Distinct ‘safe zones’ at the nuclear envelope ensure robust replication of heterochromatic chromosome regions
- National Cancer Institute, United States
Figures
Figure 1 with 2 supplements
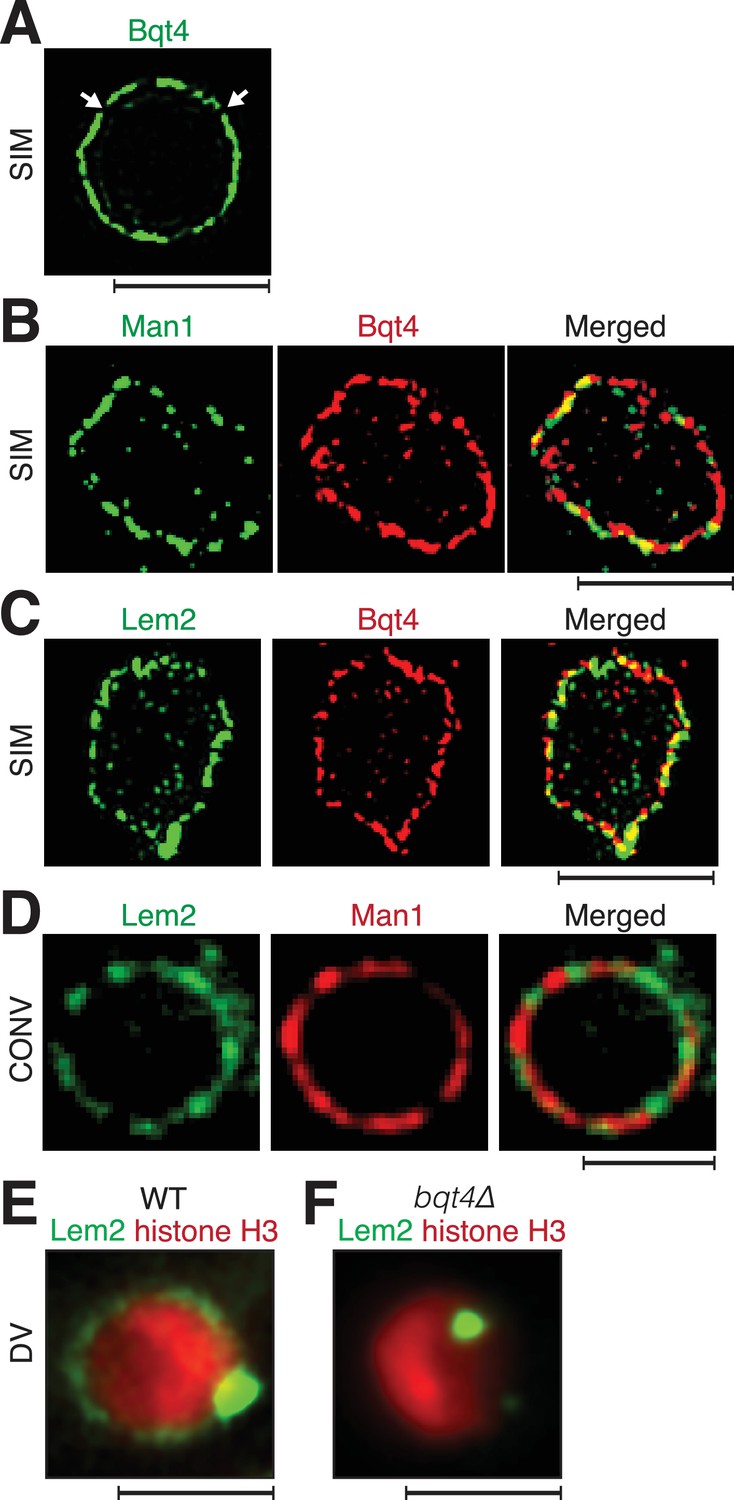
Inner NE proteins are sequestered into distinct microdomains.
(A) Representative super-resolution microscopy (structured illumination, SIM) image of a live cell harboring Bqt4-GFP. Lateral resolution is 120–150 nm. Arrows indicate regions with relatively low abundance of detectable fluorophore. Scale bars represent 2 µm in all images. (B) SIM images of representative fixed cells expressing Man1-GFP and Bqt4-mCherry, and (C) Lem2-GFP and Bqt4-mCherry. Colocalization quantitations and procedures are described in Figure 1—figure supplement 1A. (D) DeltaVision deconvolution fluorescence imaging of live cells harboring Lem2-GFP and Man1-tdTomato. Quantitation is shown in Figure 1—figure supplement 1C. (E) A representative single z-plane image of a live wt cell expressing Lem2-GFP and histone H3-mCherry. Lem2-GFP is detectable around the NE with an intense dot beneath the SPB. (F) In the absence of Bqt4, Lem2 fails to encircle the NE but remains beneath the SPB. Lateral resolution for (E–F) ~300 nm.
Figure 1—figure supplement 1
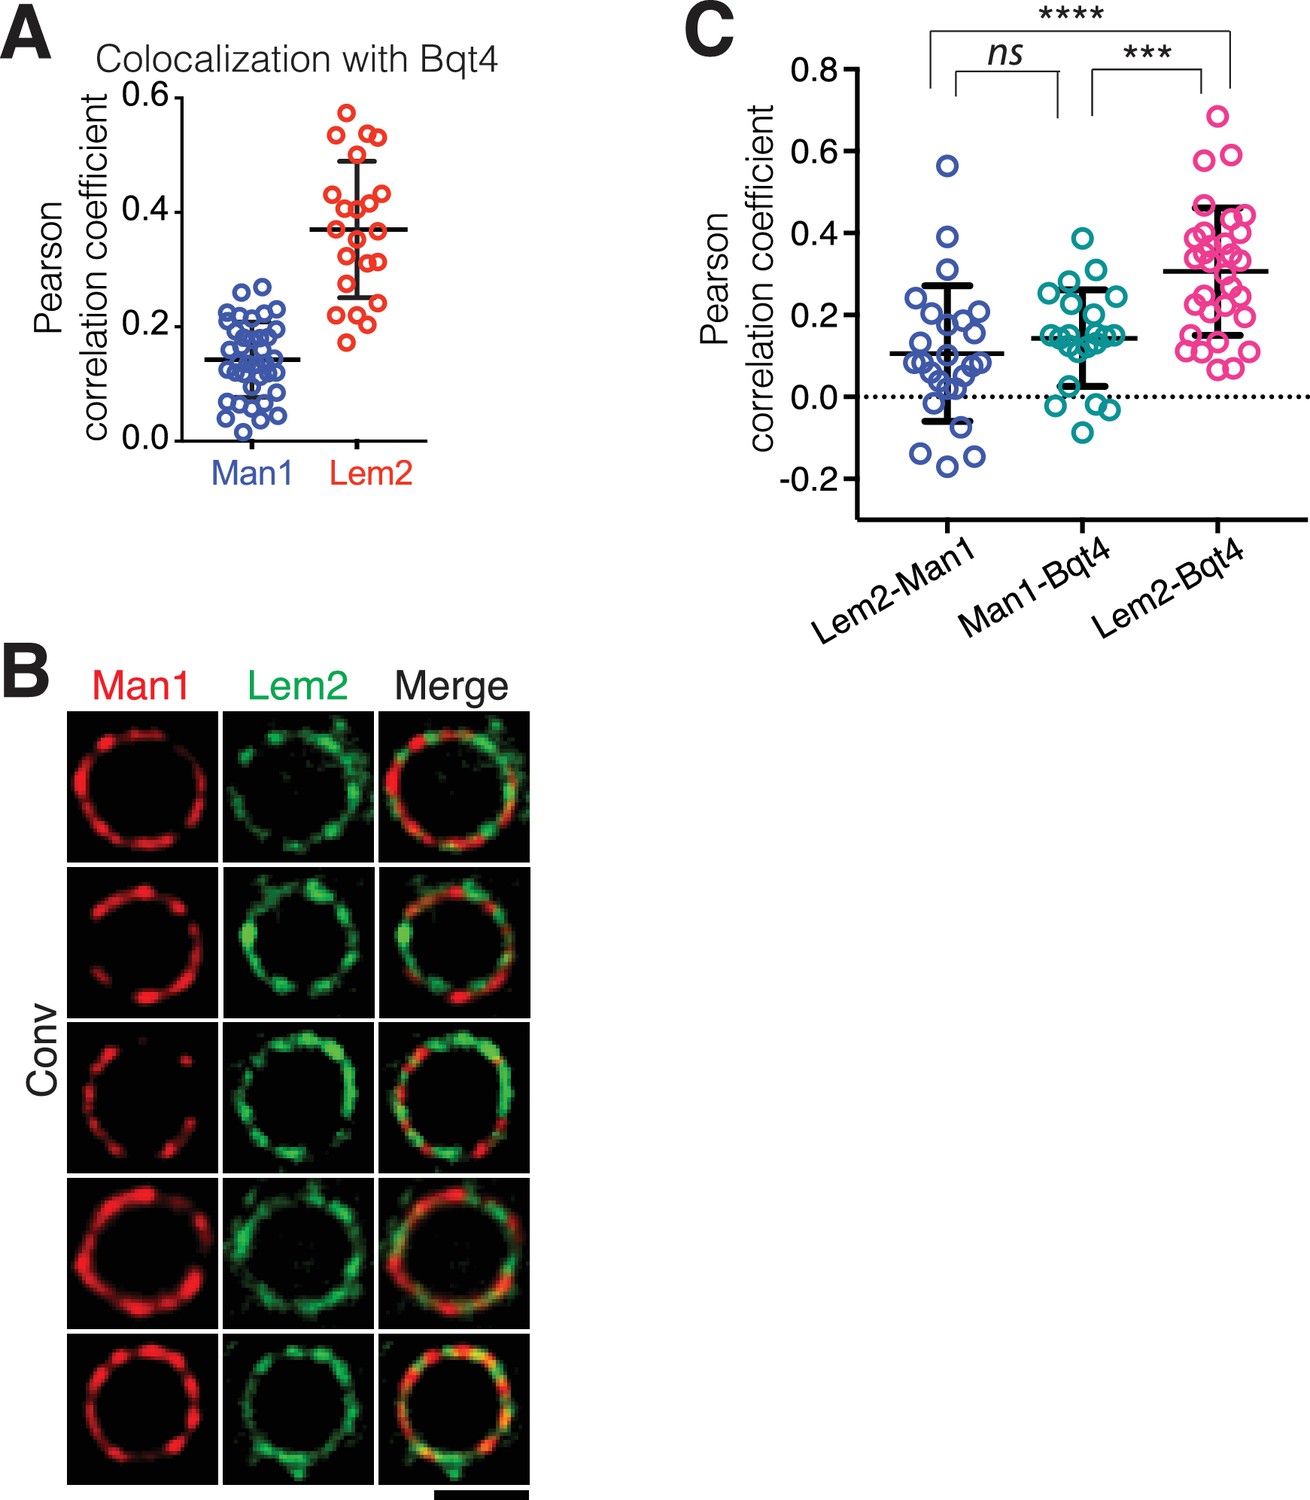
Quantitation of NE protein colocalizations.
(A) Pearson correlation coefficients derived from SIM imaging of fixed cells. Values indicate levels of overlap between Man1-GFP and Bqt4-mCherry or Lem2-GFP and Bqt4-mCherry were measured using Applied Precision softWorX software. Horizontal black lines indicate mean (Man1 Lem2: 0.143, n = 38; Lem2 Bqt4: 0.37, n = 22) and SD. (B) Additional examples of simultaneous live imaging of Man1-tdtomato and Lem2-GFP as in Figure 1. (C) Colocalization of the indicated protein pairs as assessed by live microscopy is quantified as in (A).
Figure 1—figure supplement 2
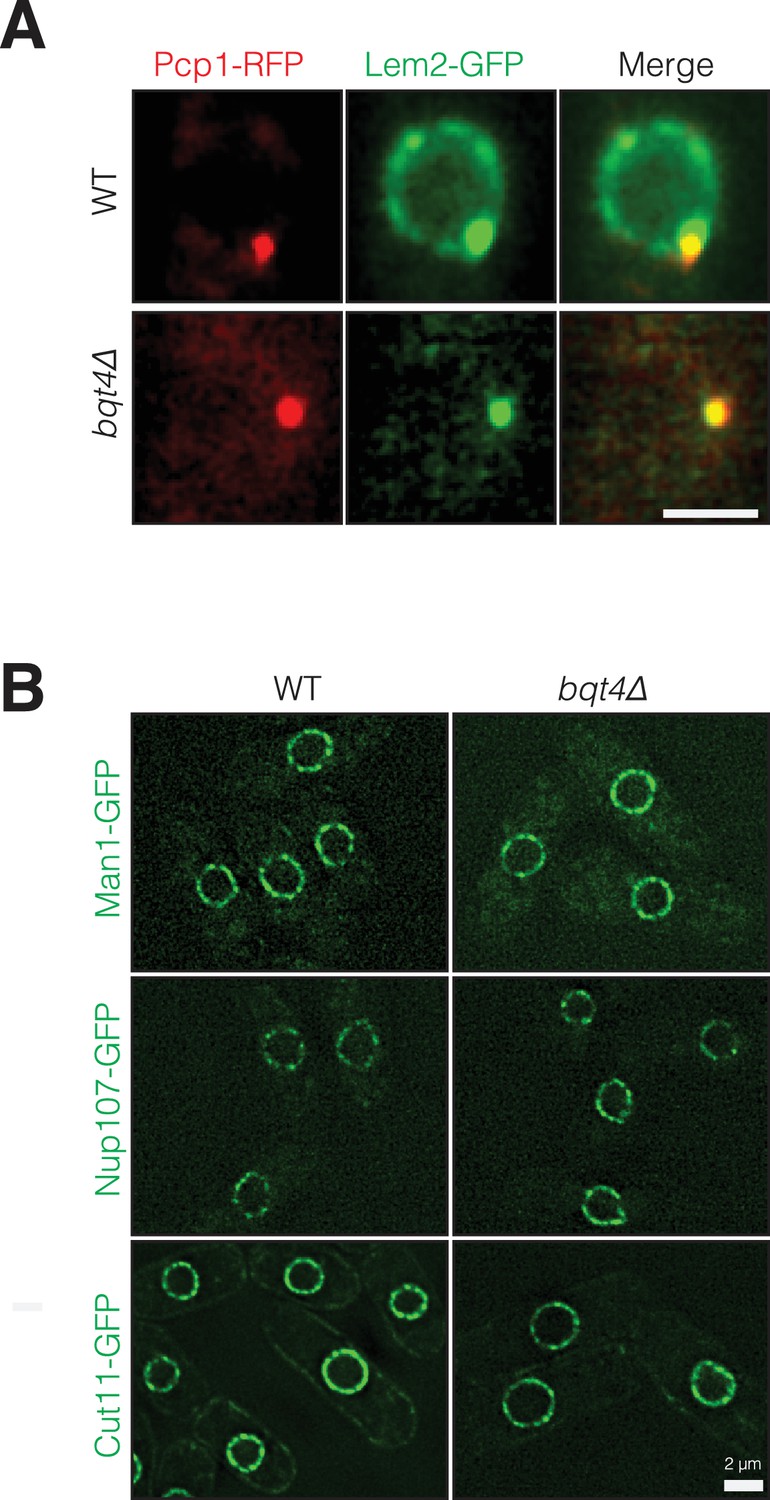
Bqt4 controls localization of Lem2 but not Man1, Nup107 or Cut11.
(A) Bqt4 is required for the localization of Lem2 around the NE. Snapshots of WT and bqt4Δ cells expressing Lem2-GFP and Pcp1-RFP. The visible Lem2-GFP dot in bqt4Δ cells colocalizes with the SPB (marked by Pcp1-RFP). The images are maximal intensity projections of imaged cross-sections through the entire nucleus. (B) Deletion of Bqt4 does not affect localization of Man1-GFP, Nup107-GFP and Cut11-GFP. Live cell imaging was performed in cells expressing the indicated tagged membrane proteins in wt and bqt4Δ cells.
Figure 2
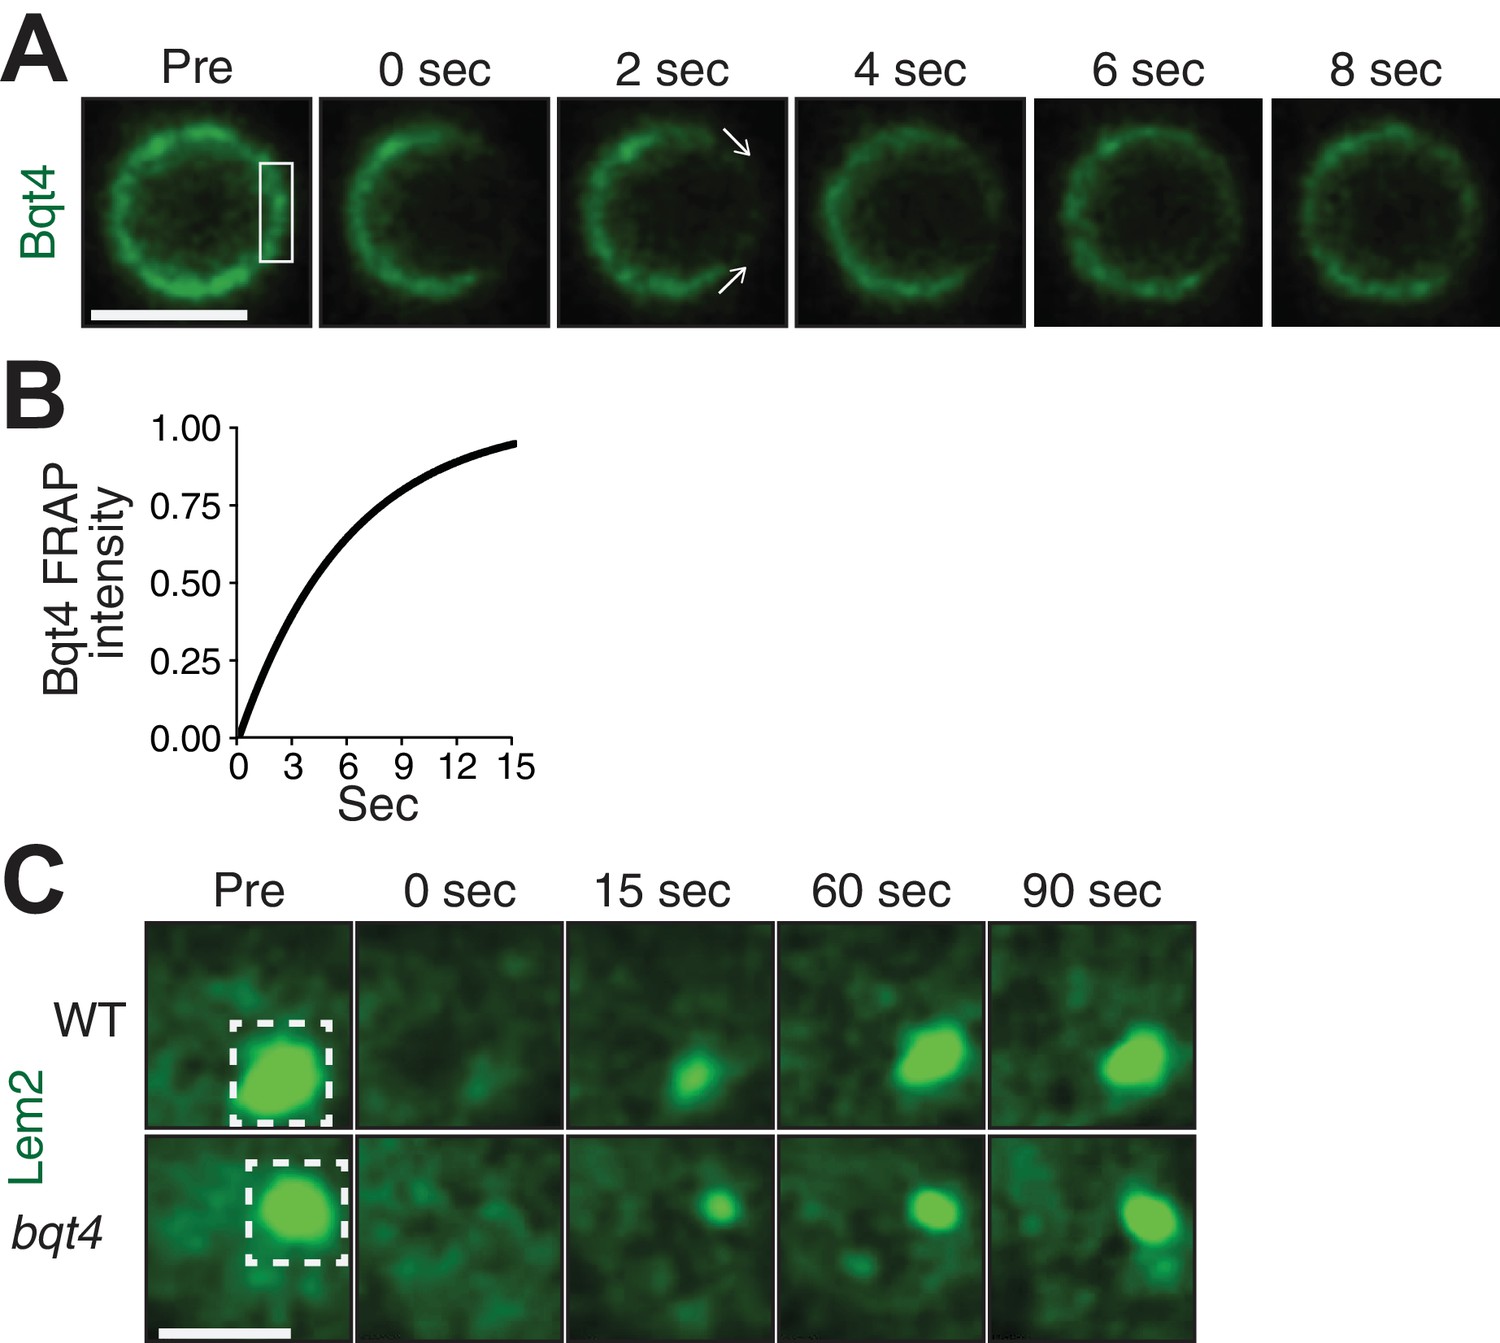
Bqt4 mobilizes Lem2 around the NE.
(A) Representative time-lapse series of a FRAP experiment. ‘Pre’ shows a control image captured immediately prior to photo-bleaching. The white box indicates the ROI targeted for photobleaching. Time 0 is taken immediately after photo-bleaching. Images were captured every 2 s. Quantitation was performed by measuring sum of pixel values inside ROI, deducting background signal (a region next to the nucleus with the same size as the ROI), and dividing by ROI signal in ‘Pre’ image. Scale bars here and in (C) represent two microns. (B) The normalized fluorescence intensities (described in A) from the imaged cells were averaged for each corresponding timepoint, and a curve fit was plotted using Prism (GraphPad Software). The y-axis indicates normalized intensities relative to ‘Pre’ intensity set to 1.0 (half-life 5.03 s, n = 13). (C) Cells expressing Lem2-GFP were subjected to FRAP as in A, except that the time-lapse interval was increased to 15 s. The ROI (dashed box in ‘Pre’) was drawn around a region covering the visible Lem2-GFP dot. The Lem2-GFP ring around the nucleus, visible by other imaging systems (Figure 1E,F), was not detectable with the specific FRAP system and settings used here. Quantitations are shown in Figure 3C.
Figure 3 with 1 supplement
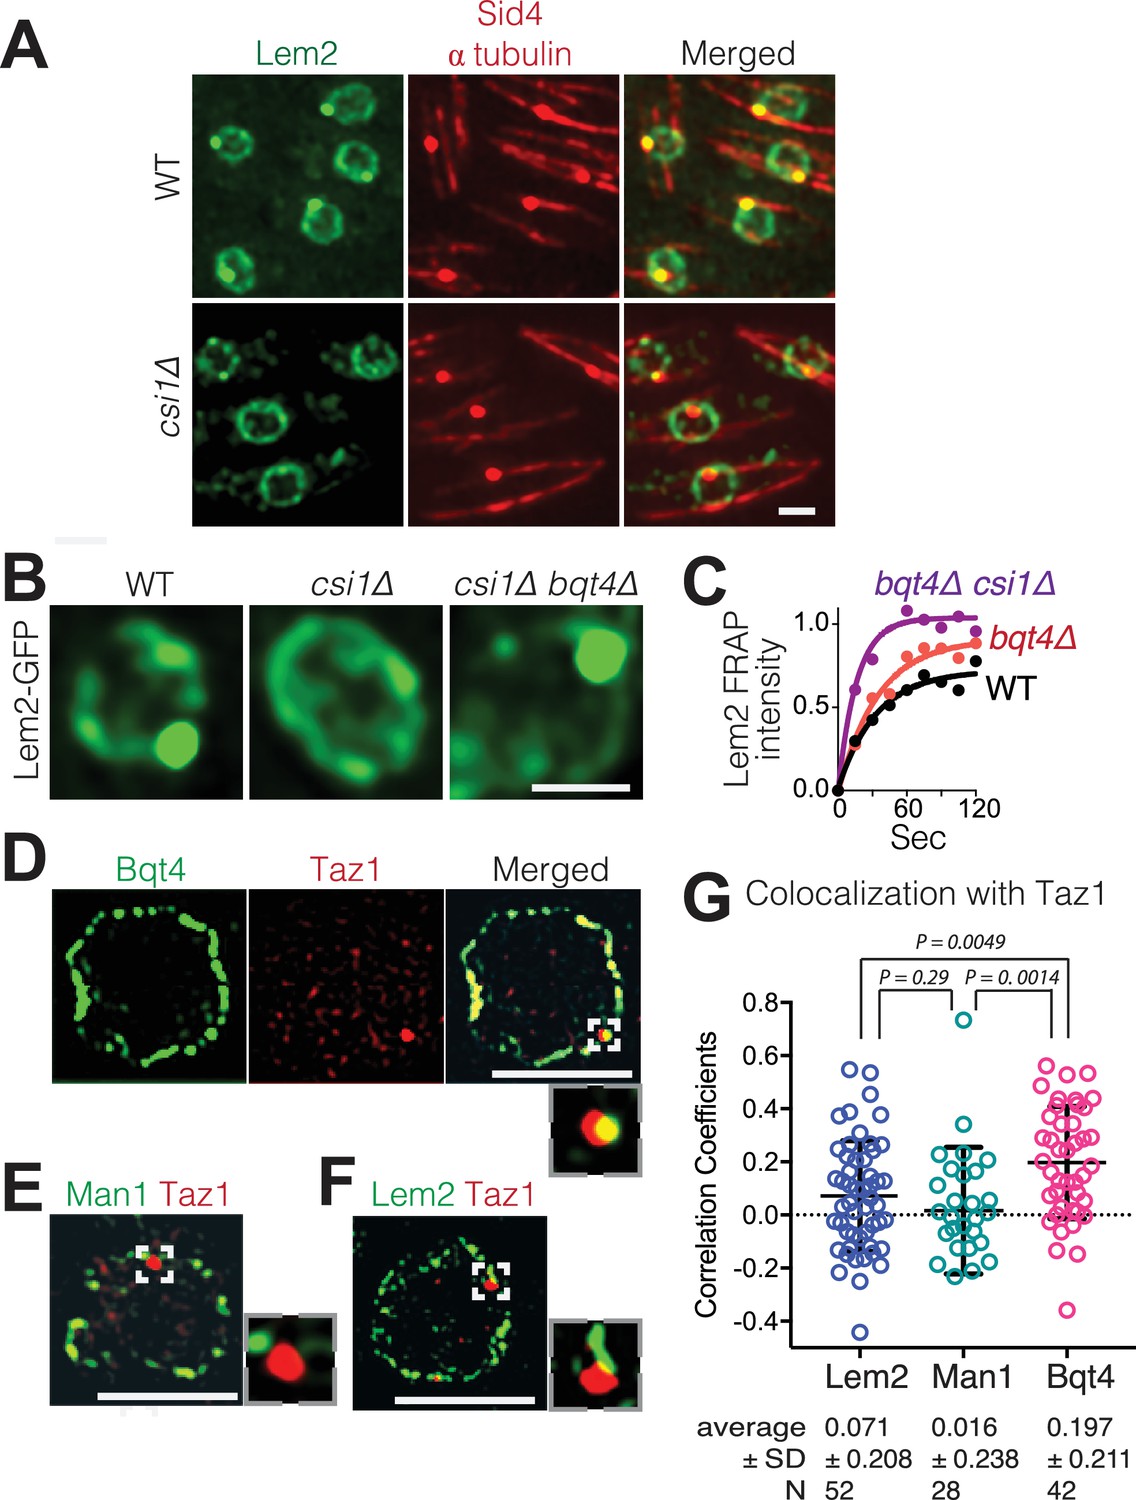
Csi1 stabilizes Lem2 beneath the SPB while Bqt4 moves Lem2 around the NE.
(A) High-resolution images (~300 nm lateral resolution) show that Lem2 localization beneath the SPB requires Csi1. Lem2-GFP and Sid4-mRFP overlap in all WT cells, but fail to overlap in 85% of csi1Δ cells. Scale bars represent two microns in all images. (B) Deletion of bqt4+ restores detectable Lem2-GFP dot at the SPB in csi1Δ cells. (C) FRAP of the visible Lem2-GFP dot as described in Figure 2C. Non-linear fit of the fluorescence recoveries for the indicated strains show curtailed half-life for Lem2-GFP at the SPB in the bqt4Δ csi1Δ double deletion strains. Half-lives: WT 23.11 s, n = 12; bqt4Δ half-life 23.99 s, n = 10; bqt4Δ csi1Δ half-life 11.24 s, n = 18. Mobile fraction (plateau) for WT: 72%, bqt4∆: 91%, bqt4∆csi1∆: 100%. Goodness of fit (R2) for WT: 0.961, bqt4∆: 0.974, bqt4∆csi1∆: 0.956. FRAP could not be performed in the csi1Δ background due to lack of visible Lem2 at the SPB. (D) SIM (120–150 nm lateral resolution) images of representative fixed cells expressing Bqt4-GFP and Taz1-mCherry, (E) Man1-GFP and Taz1-mCherry, and (F) Lem2-GFP and Taz1-mCherry. Insets show magnifications of boxed regions. (G) Co-localization between Taz1 and the indicated proteins was quantified as Pearson correlation coefficients, using the Applied Biosystems softWorX software.
Figure 3—figure supplement 1
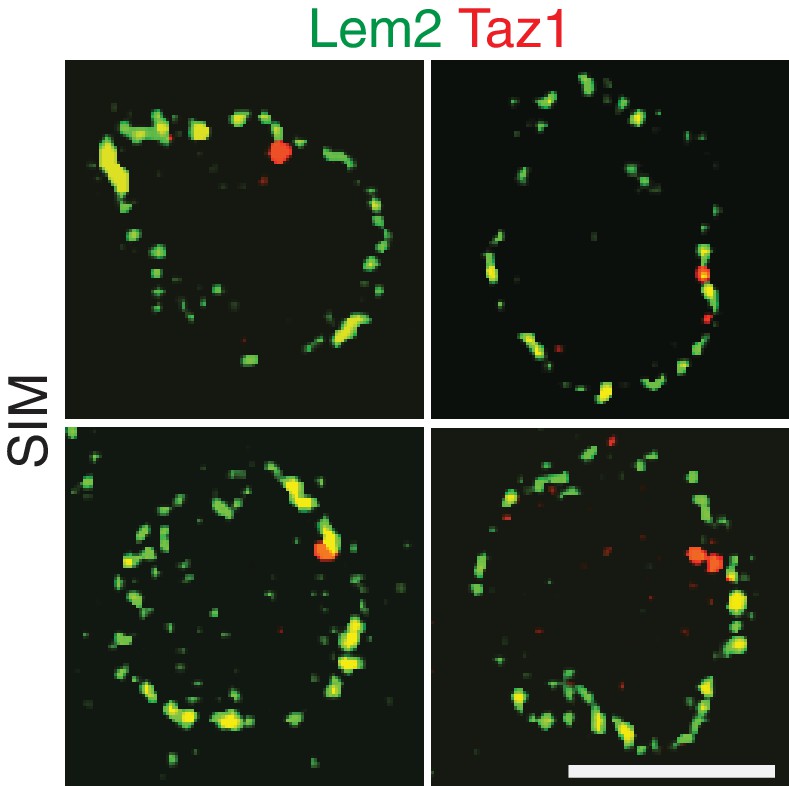
Additional examples of simultaneous imaging of Lem2-GFP and Taz1-mCherry by SIM microscopy.
Lem2 and Taz1 signals tend not to overlap. Quantitation is shown in Figure 3G.
Figure 4 with 1 supplement
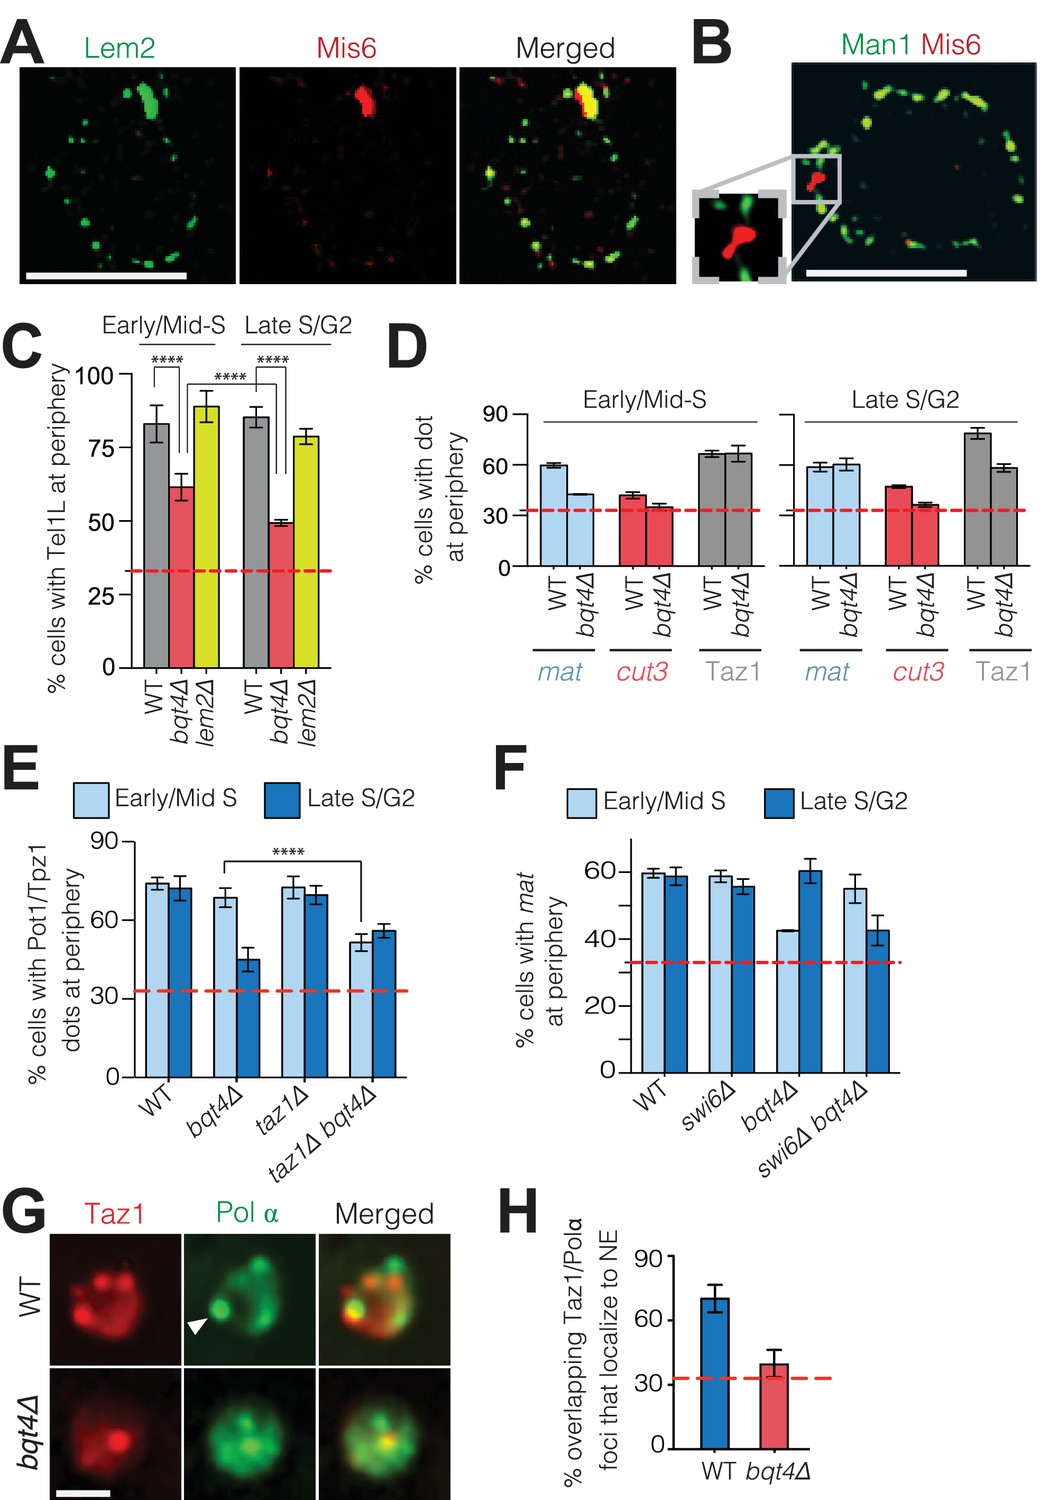
Bqt4 tethers telomeres and the mat locus when undergoing DNA replication.
(A) SIM images of representative fixed cells expressing Lem2-GFP and Mis6-mCherry, and (B) Man1-GFP and Mis6-mCherry. Inset in (B) shows magnification of the boxed region. (C) Bqt4 regulates telomere positioning while Lem2 does not. Snapshots of live cells harboring Tel1L-lacO/I-GFP and Cut3-mCherry (to mark the NE) were captured, the distance between the telomere and NE measured, and distances categorized based on the nuclear zoning assay (see Materials and methods) in which the outer third of the nuclear volume is considered the periphery. Dashed red line indicates the level of peripheral zoning expected for random localization within the nucleus (33%). The Y-axis indicates percent of imaged cells in which telomere-NE distance is categorized as Zone I (the most peripheral zone with a maximum distance of ~0.22 µm from the NE). Table 1 shows statistics for the data here and in (D–F). Error bars indicate SD. **** indicates p≤0.0001 as determined by a Student’s t-test. (D) Imaging, quantitation and plotting as in C. The mat locus and cut3 gene were visualized via lacO/I arrays inserted <40 kb away; telomere clusters were visualized via Taz1-mCherry. (E–F) Imaging and quantitation as described in A (n > 80). (G) Colocalization of Taz1-mCherry and Pol α-GFP in the indicated strains was assessed using automated image-analysis on 800–1000 cells, utilizing a MATLAB script that uses a constant threshold level for detecting dots and assigning colocalization, and measures distance to the edge of the nucleus. Arrowhead indicates a site of Polα/telomere colocalization. (H) Data from G were plotted as described in C.
Figure 4—figure supplement 1
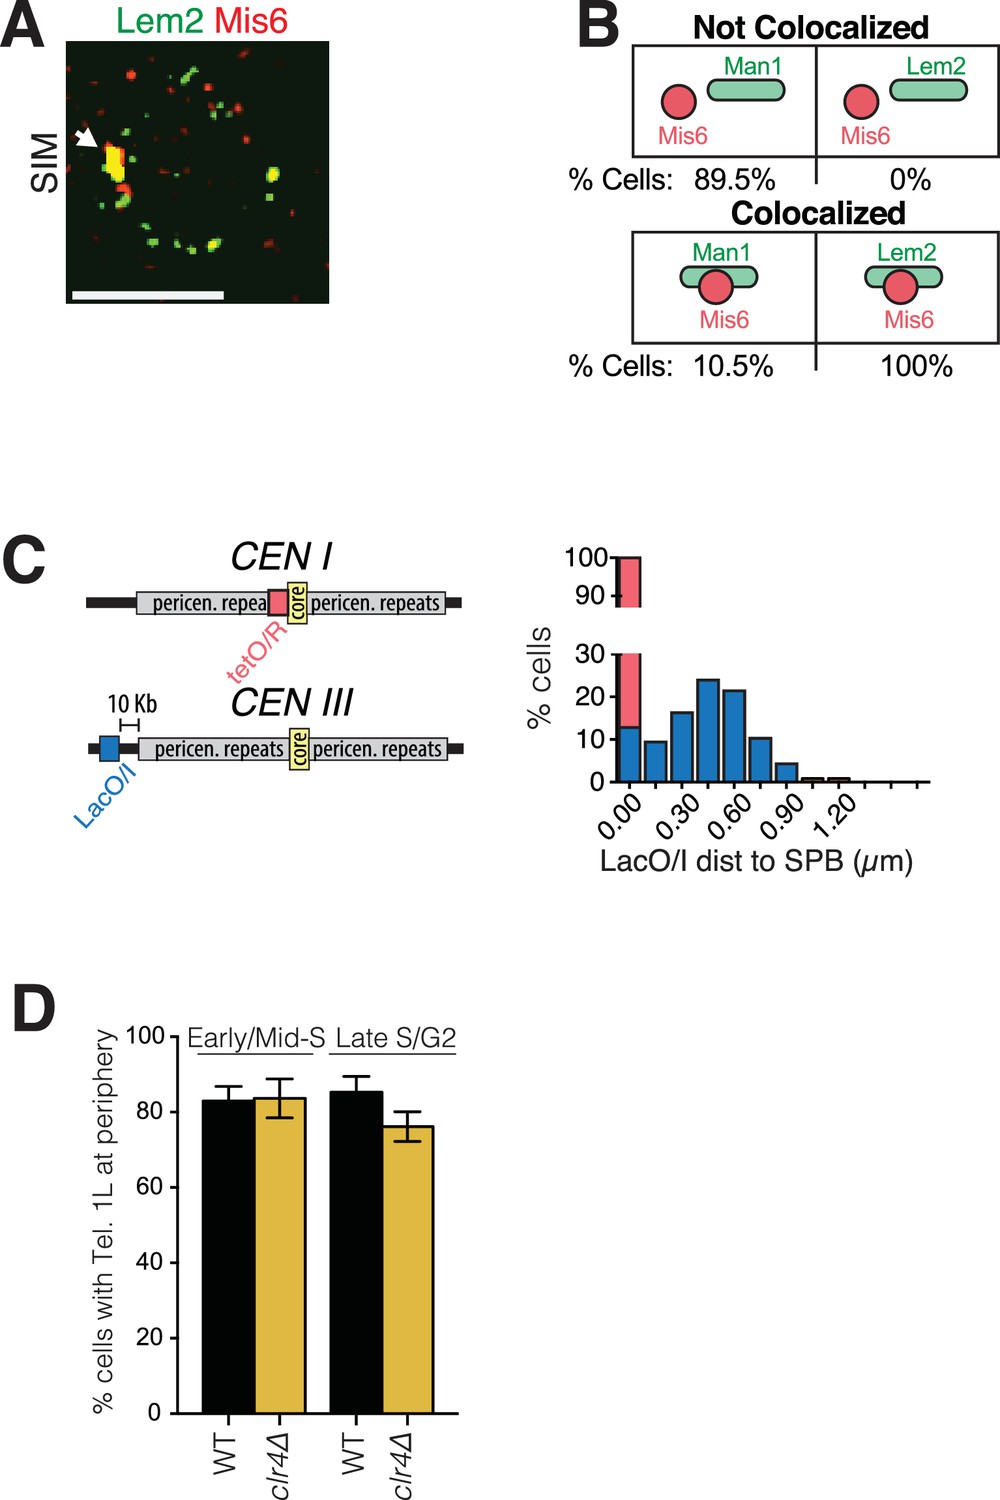
Imaging and quantitation of NE protein colocalization with centromeres and pericentromeres.
(A) Representative SIM image of a cell harboring Lem2-GFP and Mis6. White arrow indicates colocalization. (B) All cells expressing Lem2-GFP and Mis6-mCherry show colocalization of the two fluorescent signals, whereas only 10.5% of cells expressing Man1-GFP and Mis6-mCherry show colocalization. SIM images were captured as described in Figure 1. (C) Cells with marked SPB (Sid4-GFP) and tagged centromere I (lacO/I-RFP inserted at left end of the central core sequence) were imaged using time-lapse microscopy and the distance between the centromere and the SPB was measured. Plot shows percent cells in which distance between SPB and centromere I was 0 µm (red bar, 100%). Cells harboring lacO/I-CFP inserted more distally, 10 Kb from the pericentromeric repeats of centromere III, were also imaged, and distances between this pericentromere site and the SPB (Sid4-mRFP) plotted (blue bars). (D) Heterochromatin is not required for telomere tethering to the NE. wt and clr4Δ cells with tagged Tel1L were imaged as described in Figure 4C. Tel1L remains at the periphery in clr4Δ cells at similar levels to wt cells. Imaging, quantitation and plotting was carried out as described in Figure 4.
Figure 5 with 1 supplement
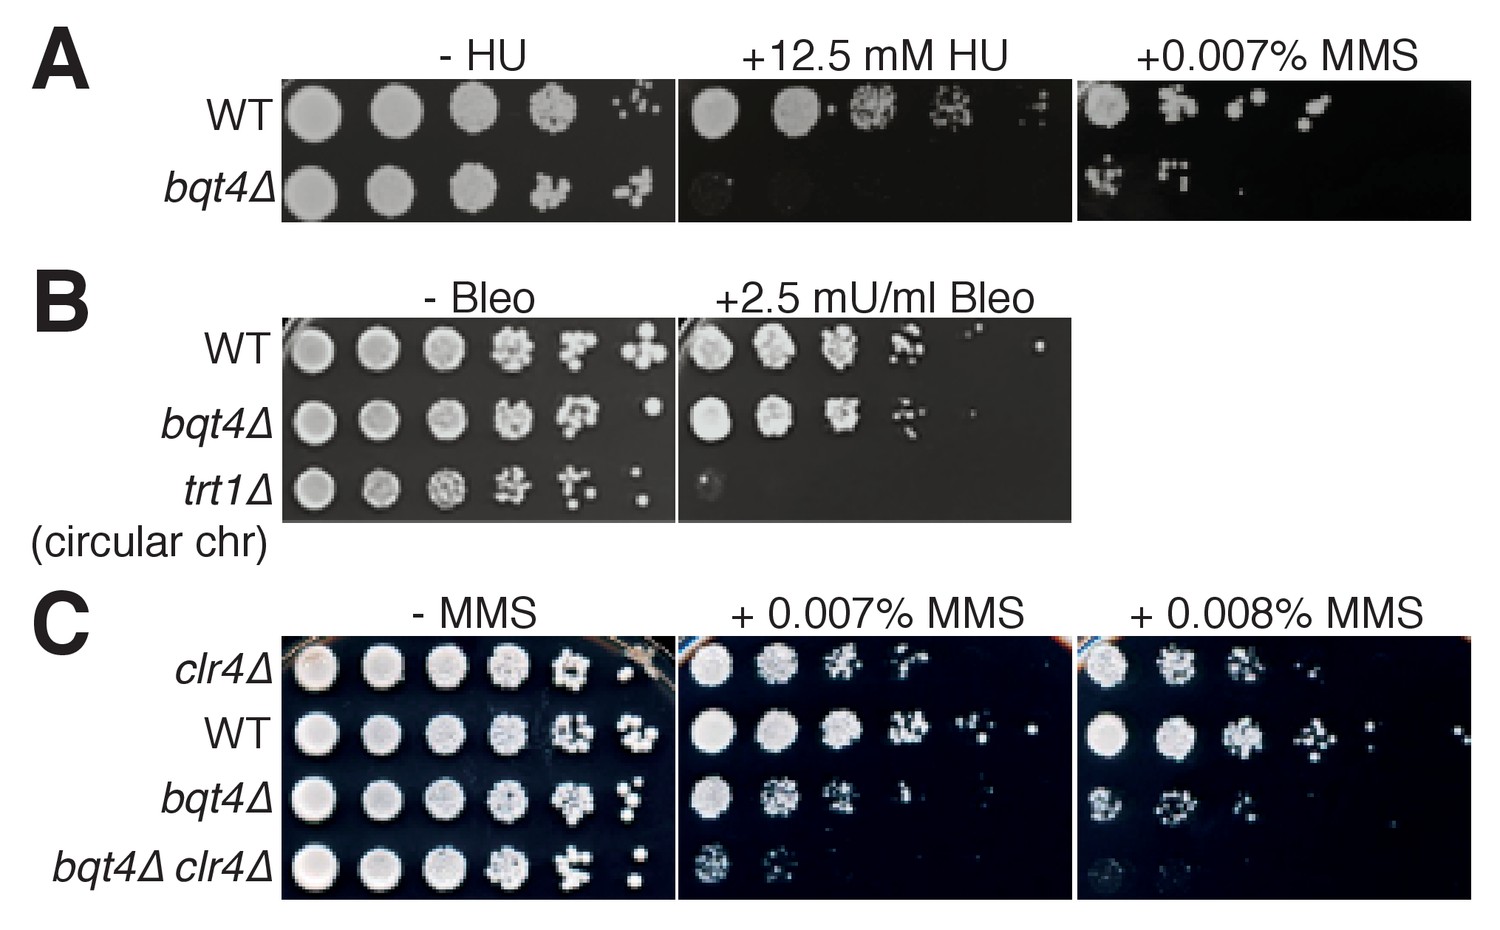
Bqt4 is required for resistance to agents that damage DNA during replication.
(A–C) Five-fold serial dilutions of log-phase cultures of the indicated strains were stamped onto media containing HU, MMS, or Bleomycin (see Materials and methods). To control for the effectiveness of Bleomycin, we used telomerase-deficient survivals that have circular chromosomes, previously shown to be bleomycin hypersensitive (Jain et al., 2010).
Figure 5—figure supplement 1
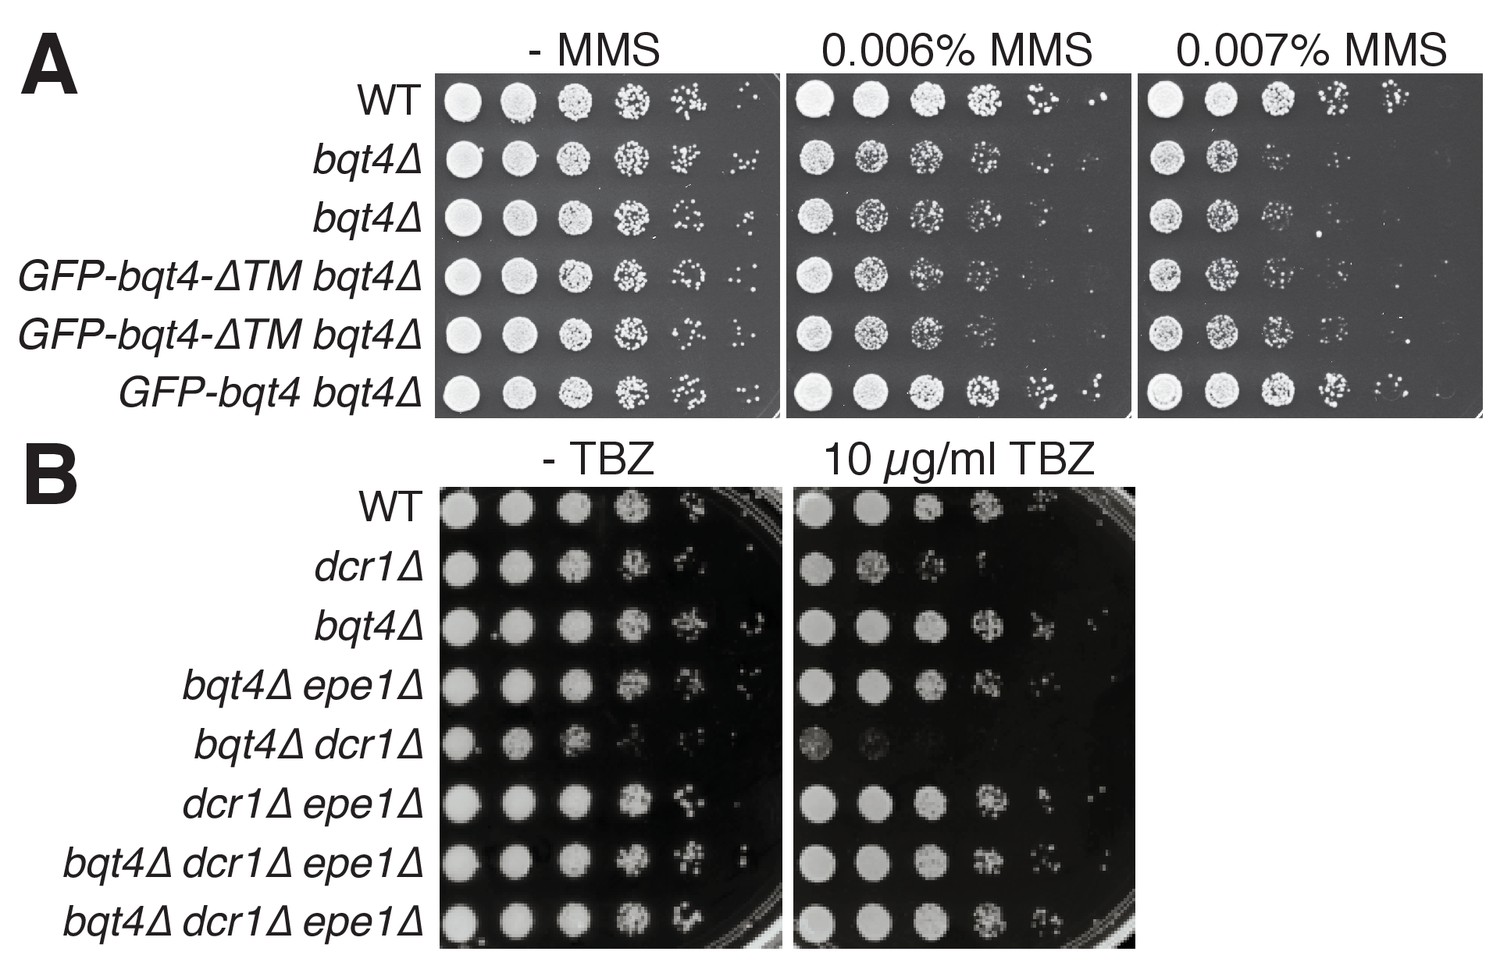
The NE localization of Bqt4 is required for resistance to MMS, but not TBZ.
(A) The transmembrane domain of Bqt4 (in the context of full length Bqt4) is required for resistance to MMS. Addition of GFP-Bqt4, but not GFP-Bqt4ΔTM, rescues the MMS sensitivity of bqt4Δ cells. Repeated rows indicate independent isolates of identical genotype. (B) bqt4Δ cells are not hypersensitive to the microtubule-destabilizing drug thiabendazole (TBZ). bqt4 deletion, however, does cause synthetic TBZ sensitivity with dcr1Δ. As expected (Reddy et al., 2011; Reyes-Turcu et al., 2011; Trewick et al., 2007), epe1 deletion rescues the growth defects and TBZ-hypersensitivity of dcr1Δ cells as well as dcr1Δbqt4Δ cells.
Figure 6 with 2 supplements
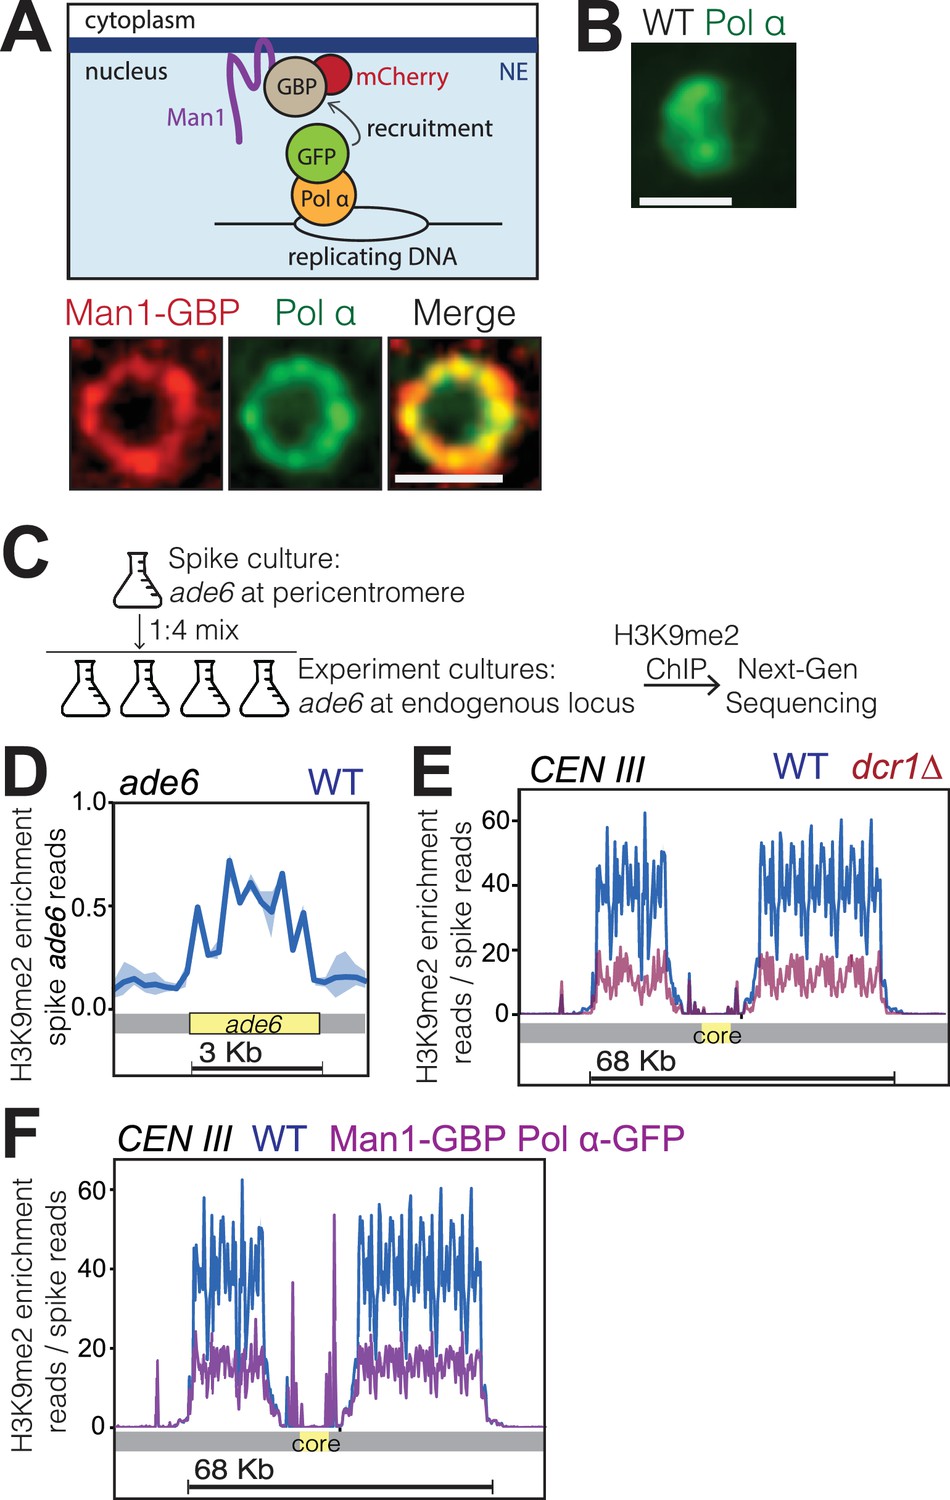
Bqt4-rich domains ensure faithful inheritance of heterochromatin.
(A) Schematic of system designed to move replication forks to the NE. Coexpression of Polα-GFP and Man1-GBP recruits Polα-associated (replicating) chromatin to Man1-rich subdomains of the NE. Images below schematic show remobilization of Pol α-GFP to colocalize with Man1-GBP-mCherry encircling the nucleus. (B) In cells lacking Man1-GBP, Polα-GFP shows diffuse localization within the nuclear interior. (C) ChIP-seq experiments were performed as described in text and Methods, using H3K9Me2 antibody (ab1220, Abcam). (D) Ribbon line-plot of enrichment of H3K9Me over the ade6+ locus in three independent WT isolates. The solid blue line indicates median; width of the ribbon indicates range of enrichment levels among the three isolates. (E–F) Ribbon line-plot of enrichment of H3K9Me2 at centromere of Chr III. The central core region is indicated by the yellow box. The sharp peaks flanking the core region (F) align to small repetitive regions (~25 bp) present in multiple regions across the genome; it is therefore not possible to determine their source.
Figure 6—figure supplement 1
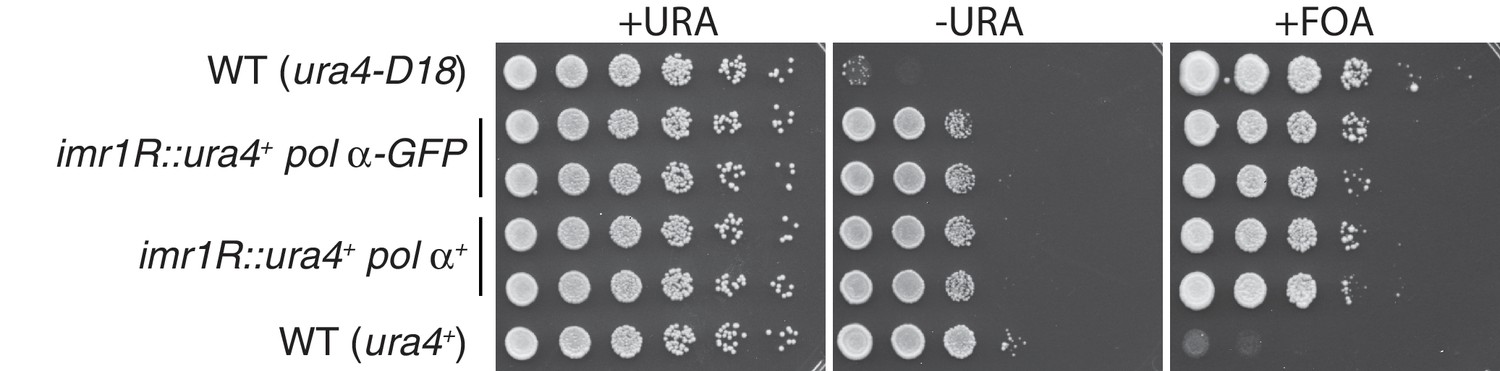
A C-terminal GFP tag on Polα does not interfere with centromeric silencing.
Five-fold serial dilutions of the indicated strains are shown. While wt cells expressing ura4+ grow on media lacking uracil and fail to grow in the presence of FOA, ura4-D18 cells fail to grow on -URA but grow on FOA. Cells harboring ura4+ at the centromeric imr1R locus grow on FOA due to silencing at imr1R; these cells also show a partial loss of viability on -URA due also to imr1R silencing. This silencing is intact in cells carrying Polα/Swi7-GFP.
Figure 6—figure supplement 2

Man1-GBP pulls both Polα-GFP and replicating telomeres to Man1-rich domains.
(A) Three representative wt cells showing Rad11-mCherry visible throughout the nucleus (single Z-plane images of live cells). (B) Each row shows a representative live cell expressing Pol α-GFP Man1-GBP and Rad11-mCherry (single Z-plane images of the nuclei). Pol α-GFP remobilizes to the NE, forming a fluorescent ring. Rad11 also appears to remobilize to the NE, with cells having lower detectable Rad11-mCherry signal in the nuclear interior compared to wt cells (compare with A). (C) Taz1 tends to localize to Man1-poor regions (quantified in (E)) in a wt setting. Imaging performed on DeltaVision microscope. (D–E) In cells harboring the Man1-GBP/Polα-GFP tethering system, the frequency of Taz1/Man1 overlap increases. (D) Imaging as in (C). (E) Pearson correlations coefficients defining degree of colocalization between Taz1-mTurquoise and Man1-GBP-mCherry were determined using Applied Precision softWorX software. While Taz1 rarely colocalizes with Man1 in a wt scenario, GBP- mediated recruitment of Polα-GFP pulls replicating telomeres to Man1 sites.
Figure 7 with 2 supplements
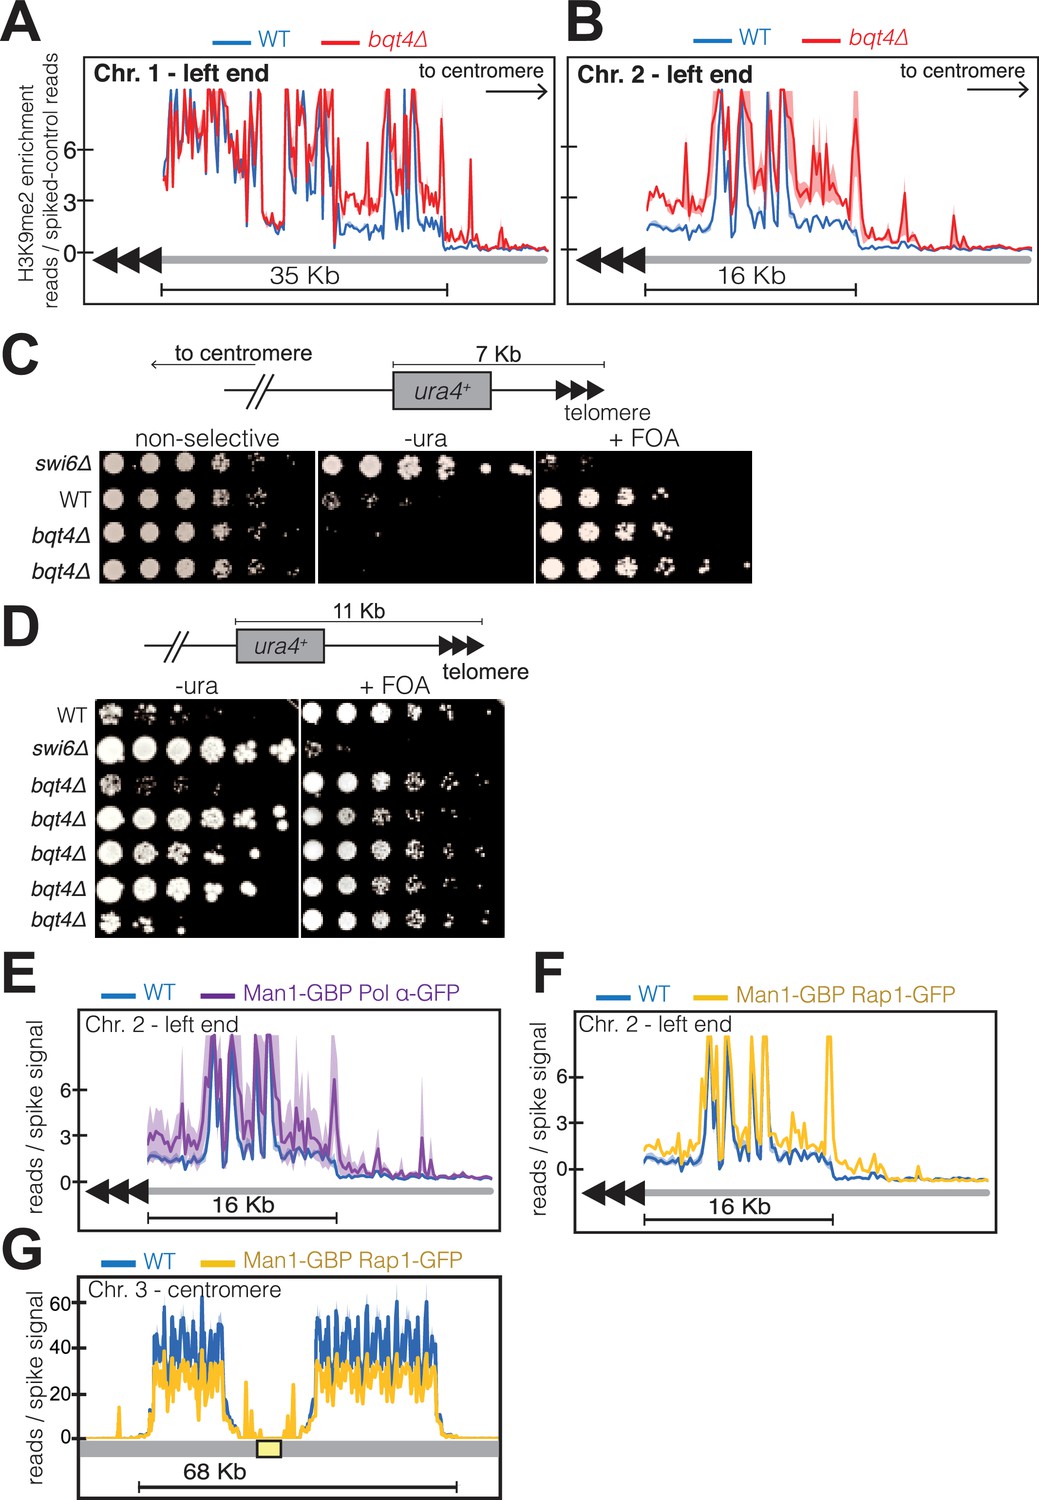
Bqt4 ensures proper heterochromatin maintenance at subtelomeric regions.
(A–B) ChIP-seq experiments (H3K9Me2) with three independent isolates of each genotype. Plot annotation as described in Figure 6D. (C) Five-fold dilutions of cells harboring the indicated genotypes and ura4+ gene inserted~7 kb from the right end of chromosome II. The two bqt4Δ rows contain cultures of two independent isolates. (D) Experiment performed as described in C, with five independent bqt4Δ isolates. (E–F) ChIP-Seq data covering the left end of Chr II is plotted as described in Figure 6D. (G) ChIP-seq data for centromeric region of Chr III.
Figure 7—figure supplement 1
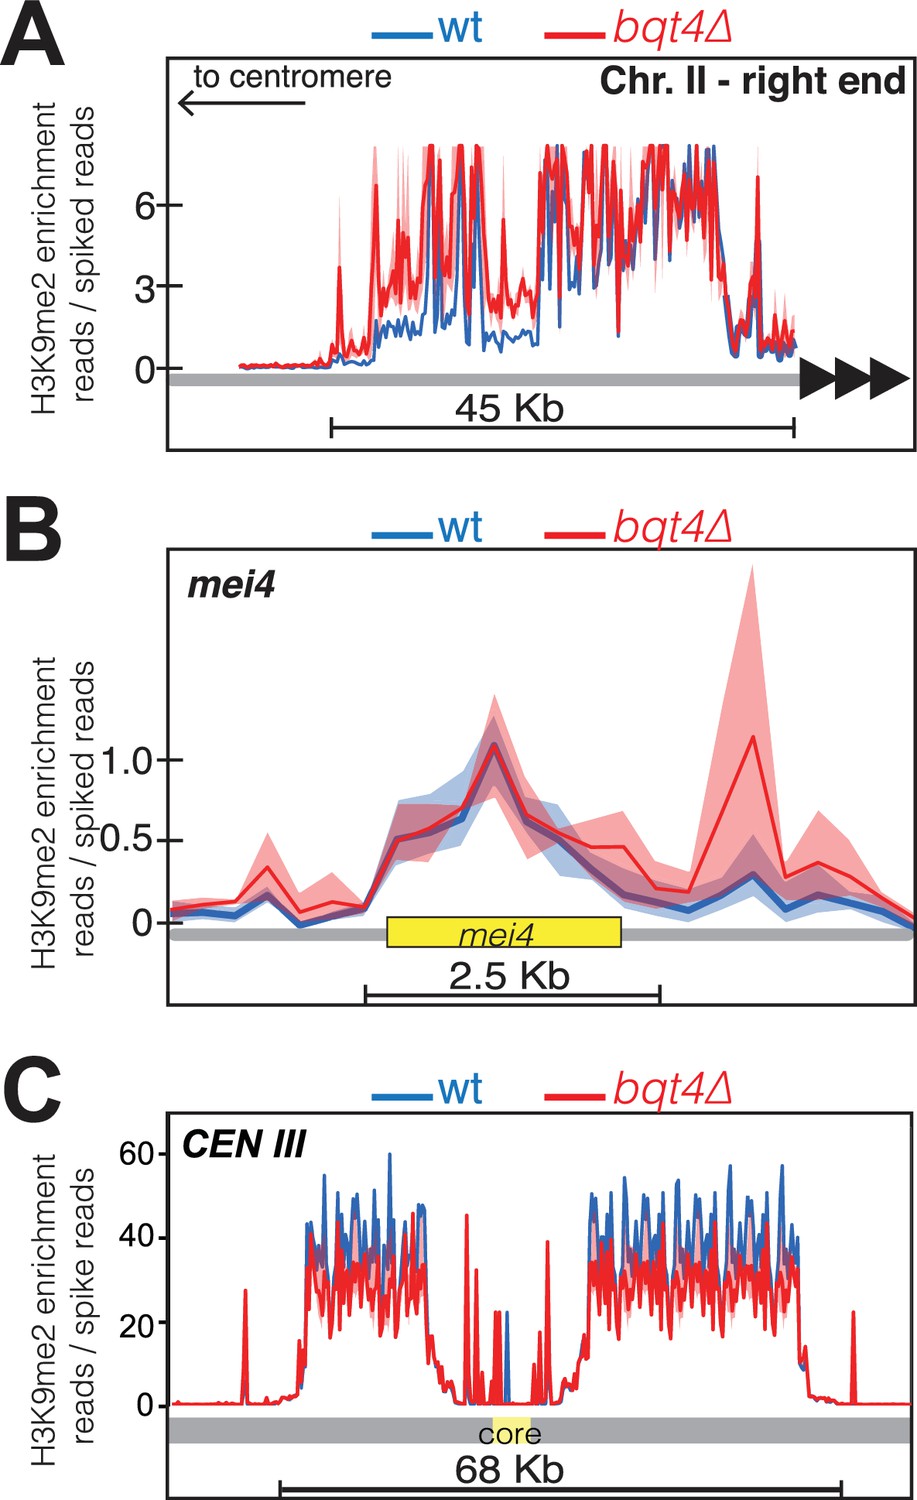
Bqt4 regulates H3K9Me2 levels at pericentric and subtelomeric regions but not the mei4+ locus.
Plots of ChIP-Seq data comparing H3K9Me2 enrichment between WT (blue) and bqt4Δ (red) cells at (A) the right end of chromosome II, (B) the mei4 heterochromatin island, and (C) centromere of Chr III.
Figure 7—figure supplement 2
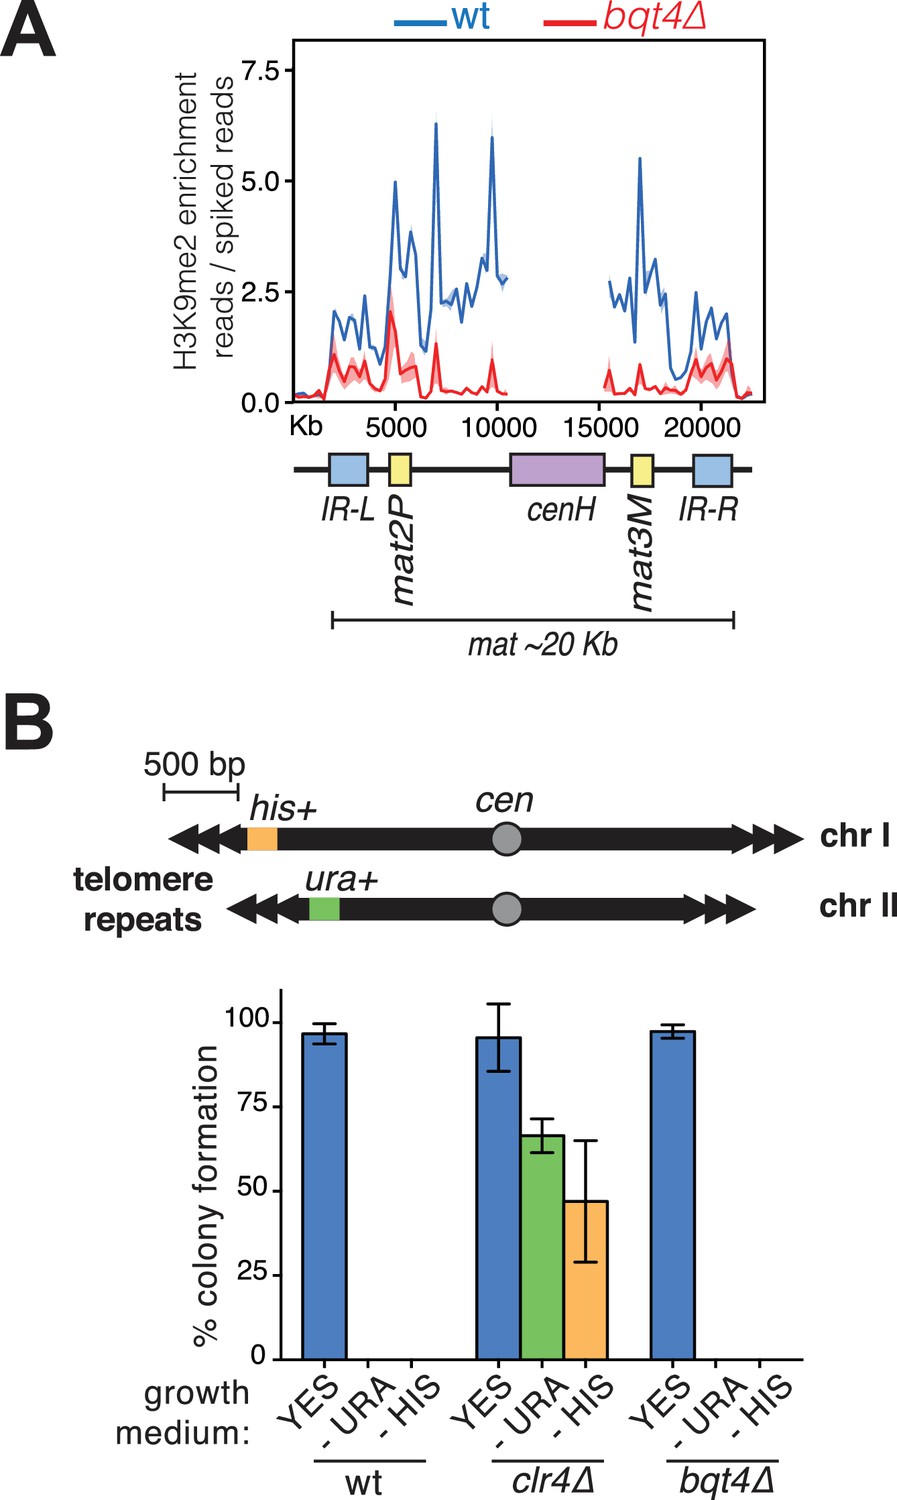
Bqt4 affects silencing at mat but not the distal subtelomere.
(A) Bqt4 regulates H3K9Me2 levels at the mat locus. ChIP-seq coverage of the mat locus comparing H3K9Me2 enrichment between WT (blue) and bqt4Δ (red) cells. The cenH region (purple box) is homologous to the cenH sequences within the pericentromeric regions; therefore, it is not possible to assign coverage here to the mat locus; this region has been masked to allow clear view of the remainder of the region (Pickrell et al., 2011). H3K9Me2 enrichment is higher at the centromere relative to the mat locus (compare the y-axis with Figure 7—figure supplement 1). (B) Consistent with published data (Chikashige et al., 2009), deletion of bqt4 does not affect silencing of genes placed at ~500 bp away from the telomeres. Top diagram illustrates the genotype of the strain used, with his + and ura4+ genes inserted at the ends of Chr I and II, respectively. Overnight cultures grown at 32°C were counted and diluted before placing 100 cells on the indicated media in triplicate. The grown colonies were counted and expressed here as percent of plated cells that formed a colony. Error bars indicate variation between the triplicate plates. wt cells fail to form colonies on media lacking uracil or histidine as the ectopic ura4+ and his3+ genes are silenced. clr4Δ cells form colonies on media lacking uracil or histidine (green and yellow bars) due to loss of silencing. bqt4Δ cells, similar to wt cells, are unable to form colonies on -URA or -HIS, indicating repression of ura4+ and his3+.
Figure 8

Genetic analysis shows roles of Bqt4 and Lem2 in promoting cellular viability.
(A) Five-fold serially diluted cultures of the indicated strains were plated on rich media (YE5S) at 32°C. (B) Growth of cells harboring a temperature sensitive allele of cnp1+ (cnp1-1) with and without overexpressed (nmt41-controlled) Ams2 was assessed with five-fold serially diluted cultures incubated at 25°C and 32°C. (C) Viability assay was performed as described in (A).
Figure 9
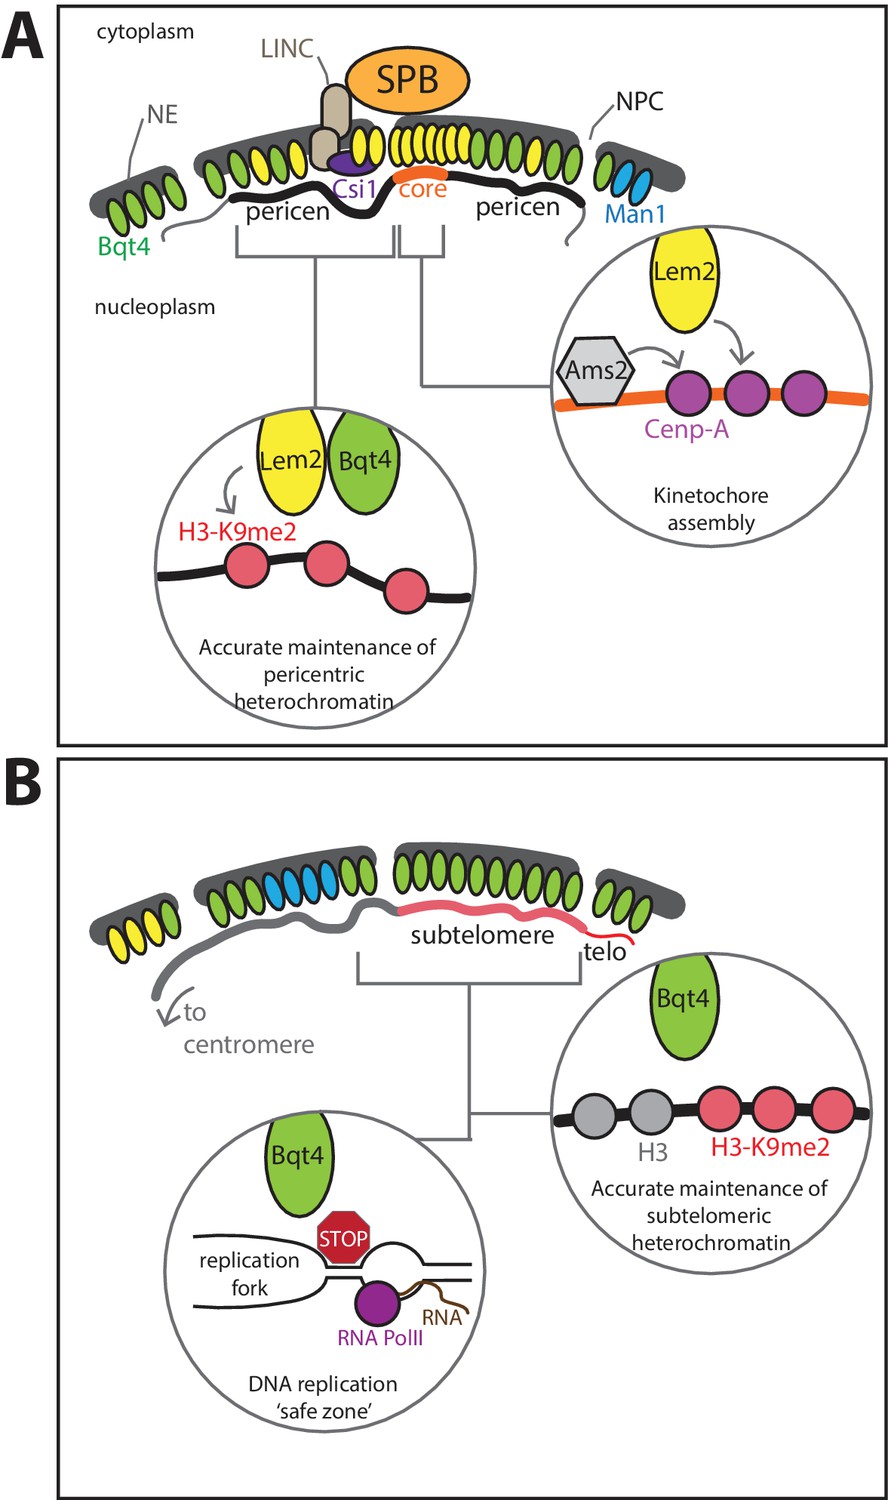
Model for roles of Lem2- and Bqt4-microdomains.
(A) Lem2 (yellow ovals) exists in two populations, the most concentrated fraction localizing beneath the SPB, where Lem2 is stabilized by Csi1. This Lem2 fraction promotes kinetochore maintenance (right insert) at the central core of the centromere (core). Lem2 is also mobilized by Bqt4 (green ovals) to sites away from the SPB (left inset), where it functions in pericentric replication and silencing. (B) Bqt4 localizes to distinct sites around the NE, some of which overlap with Lem2 and some of which do not; Bqt4 rarely if ever overlaps with Man1 (blue ovals). Bqt4-microdomains are ‘safe zones’ in which repetitive heterochromatic sequences, pericentromeres (in the Lem2-overlapping regions), telomeres and mat locus (in the non-Lem2 overlapping regions), can be replicated without suffering excessive replication/transcription collisions, perhaps by excluding RNAP2 or concentrating Pfh1 helicase (red stop sign, left insert); these safe zones also promote the high fidelity maintenance of pericentric, subtelomeric and mat heterochromatin (right inset).
Tables
Table 1
Statistical significance of chromosomal localization data in Figure 4.
n1 and n2 denote total number of scored loci in cells from two biological replicates (independent strains). P values, from two-tailed Student’s t-tests, indicate the significance of the difference between the observed number of loci in Zone one and the expected random distribution.
| Locus genotype | Early/Mid-s | Late S/G |
|---|---|---|
| Tel 1L WT | n1 = 112,, n2 = 93 p<0.000001 | n1 = 151, n2 = 180 p<0.000001 |
| Tel 1L bqt4Δ | n1 = 110, n2 = 103 p<0.000001 | n1 = 143, n2 = 112 p=0.00986 |
| Tel 1L lem2 Δ | n1 = 110, n2 = 86 p<0.000001 | n1 = 96, n2 = 160 p<0.000001 |
| mat WT | n1 = 55, n2 = 49 p=5.0 × 10⁻⁵ | n1 = 85, n2 = 95 p=1.0 × 10⁻⁵ |
| mat bqt4Δ | n1 = 70, n2 = 52 p=0.79551 | n1 = 91, n2 = 90 p<0.0001 |
| cut3 WT | n1 = 86, n2 = 73 p=0.0459 | n1 = 57, n2 = 113 p=0.97412 |
| cut3 bqt4Δ | n1 = 94, n2 = 90 p=0.99545 | n1 = 78, n2 = 125 p=0.99801 |
| Taz1 WT | n1 = 51, n2 = 74 p<0.000001 | n1 = 85, n2 = 87 p<0.000001 |
| Taz1 bqt4Δ | n1 = 67, n2 = 93 p<0.000001 | n1 = 88, n2 = 86 p=5.0 × 10⁻⁵ |
| Pot1 WT | n1 = 79, n2 = 65 p<0.000001 | n1 = 54, n2 = 68 p<0.000001 |
| Pot1 bqt4Δ | n1 = 64, n2 = 96 p<0.000001 | n1 = 59, n2 = 81 p=0.0293 |
| Pot1 taz1Δ | n1 = 60, n2 = 63 p<0.000001 | n1 = 88, n2 = 96 p<0.000001 |
| Pot1 taz1Δ bqt4Δ | n1 = 65, n2 = 100 p=0.00025 | n1 = 64, n2 = 149 p=2.0 × 10⁻⁵ |
| mat swi6Δ | n1 = 72, n2 = 60 p=1.0 × 10⁻⁵ | n1 = 103, n2 = 120 p=2.0 × 10⁻⁵ |
| mat swi6Δ bqt4Δ | n1 = 77, n2 = 75 p=0.0002 | n1 = 100, n2 = 59 p=0.0459 |
Key resources table
| Reagent type (species) or resource | Designation | Source | Identifiers | Additional information |
|---|---|---|---|---|
| Chemical compound | Thiabenzadole | Sigma-Aldrich | Cat#T8904 | |
| Chemical compound | Methyl methanesulfonate | Sigma-Aldrich | Cat#66-27-3 | |
| Chemical compound | 5-Fluoroorotic Acid | US Biological | Cat#207291-8-4 | |
| Chemical compound | nourseothricin dihydrogen sulfate | US Biological | Cat#N5374-74 | |
| Chemical compound | G418 sulfate (Geneticin) | Invitrogen | Cat#11811031 | |
| Chemical compound | Hygromycin B | Invitrogen | Cat#10687010 | |
| Chemical compound | Hydroxyurea | Sigma-Aldrich | Cat#H8627 | |
| Reagent for microscopy | glass-bottom dish | MatTek | Cat#P35G-1.5–14 C | |
| Reagent for microscopy | GFP booster_ATTO488 | Chromotek | Cat#gba488-100 | |
| Reagent for microscopy | RFP booster_ATTO594 | Chromotek | Cat#rba594-100 | |
| Reagent for microscopy | Vectashield | Vector Labs | Cat#H-1000 | |
| Reagent for microscopy | 16% Paraformaldehyde aqueous | Electron Microscopy Sciences | Cat#15710 | |
| Reagent for microscopy | 8% glutaraldehyde | Electron Microscopy Sciences | Cat#16019 | |
| Reagent for microscopy | Zymolyase-100T | MP Biomedicals | Cat#320932 | |
| Reagent for ChIP | anti-H3K9Me2 ChIP Grade | Abcam | Cat#mAbcam1220 | |
| Reagent for ChIP | Complete, EDTA-free Protease inhibitor cocktail (Roche) | Sigma-Aldrich | Cat#11873580001 | |
| Reagent for ChIP | Phenylmethylsulfonyl fluoride | Sigma-Aldrich | Cat#P7626 | |
| Reagent for ChIP | Zirconium beads, 0.7 mm diameter | BioSpec Products | Cat#11079107zx | |
| Reagent for ChIP | Dynabeads Protein G | Invitrogen | Cat#10003D | |
| Reagent for ChIP | ChIP Elute Kit | Clontech | Cat#634887 | |
| Reagent for ChIP | milliTUBE 1 ml AFA Fiber | Covaris | Cat#520130 | |
| Reagent for ChIP | DNA SMART ChIP-Seq Kit | Clontech | Cat#634865 | |
| Reagent for ChIP | Agencourt AMPure XP | Beckman Coulter | Cat#A63880 | |
| Reagent for ChIP | NEBNext Library Quant Kit | New England BioLabs | Cat#E7630S | |
| Strain (Schizosaccharomyces pombe) | h+ ade6 M216 his3-D1 leu1-32 ura4-D18 | Lab stock | JCF109 | |
| Strain (Schizosaccharomyces pombe) | h- ade6-M210 leu1-32 ura4-D18 lys1+::GFP-bqt4 | This study | JCF11923 | Plasmid pCSS18 (Chikashige et al., 2009) was integrated at lys1 locus. |
| Strain (Schizosaccharomyces pombe) | h90 man1-GFP-kanMX6 aur1R-mCherry-bqt4 bqt4Δ: :natMX6 leu1-32 ura4-D18 | This study | JCF1266 | |
| Strain (Schizosaccharomyces pombe) | h90 lem2-GFP-kanMX6 aur1R-mCherry-bqt4 bqt4Δ: :natMX6 ura4-D18 | This study | JCF1268 | |
| Strain (Schizosaccharomyces pombe) | lem2-GFP-kanMX6 man1-tdTomato-hygMX6 leu1-32 ura4-D18 | This study | JCF18885 | |
| Strain (Schizosaccharomyces pombe) | lem2-GFP-kanMX6 hht1-mRFP-hygMX6 | This study | JCF12191 | |
| Strain (Schizosaccharomyces pombe) | lem2-GFP-kanMX6 hht1-mRFP-hygMX6 bqt4::natMX6 | This study | JCF12201 | |
| Strain (Schizosaccharomyces pombe) | ura4-D18 lem2-GFP-KanMX6 | This study | JCF12148 | |
| Strain (Schizosaccharomyces pombe) | ura4-D18 lem2-GFP-KanMX6 bqt4::nat | This study | JCF12157 | |
| Strain (Schizosaccharomyces pombe) | lem2-GFP-kanMX6 sid4-mCherry-natMX6 aur1R-Pnda3-mCherry-atb2 | This study | JCF14537 | |
| Strain (Schizosaccharomyces pombe) | lem2-GFP-kanMX6 sid4-mCherry-natMX6 aur1R-Pnda3-mCherry-atb2 csi1::his3+ | This study | JCF14540 | |
| Strain (Schizosaccharomyces pombe) | lem2-GFP-kanMX6 bqt4::natMX6 csi1::ura4+ | This study | JCF14573 | |
| Strain (Schizosaccharomyces pombe) | lem2-GFP-kanMX6 taz1-mCherry-natMX6 csi1::his3+ | This study | JCF14535 | |
| Strain (Schizosaccharomyces pombe) | h- taz1-mCherry-natMX6 lys1+::GFP-bqt4 | This study | JCF14578 | |
| Strain (Schizosaccharomyces pombe) | h- taz1-mCherry-natMX6 man1-GFP-KanMX6 | This study | JCF14565 | |
| Strain (Schizosaccharomyces pombe) | h+ taz1-mCherry-natMX6 lem2-GFP-KanMX6 | This study | JCF14532 | |
| Strain (Schizosaccharomyces pombe) | h+ mis6-mCherry-hygMX6 lem2-GFP-KanMX6 | This study | JCF14543 | |
| Strain (Schizosaccharomyces pombe) | h+ mis6-mCherry-hygMX6 man1-GFP-KanMX6 | This study | JCF14533 | |
| Strain (Schizosaccharomyces pombe) | ade6-210 leu1-32 lys1-131 ura4-D18 sod2::kanr-ura4+-lacOp his7+::lacI-GFP cut11-RFP-hygMX6 | This study | JCF10756 | |
| Strain (Schizosaccharomyces pombe) | ade6-210 leu1-32 lys1 + ura4- D18 sod2::kanr-ura4+-lacOp his7+::lacI-GFP cut11-RFP-hyg bqt4::nat | This study | JCF10771 | |
| Strain (Schizosaccharomyces pombe) | ade6-210 leu1-32 lys1-131 ura4-D18 sod2::kanr-ura4+-lacOp his7+::lacI-GFP cut11-RFP-hyg lem2::nat | This study | JCF12202 | |
| Strain (Schizosaccharomyces pombe) | his2::kanMX6-ura4+-lacOp his7+::lacI-GFP cut11-RFP-hygMX6 | This study | JCF10732 | |
| Strain (Schizosaccharomyces pombe) | his2::kanMX6-ura4+-lacOp his7+::lacI-GFP cut11-RFP-hygMX6 bqt4::natMX6 | This study | JCF10740 | |
| Strain (Schizosaccharomyces pombe) | cut3+::lacOp his7+::lacI-GFP cut11-RFP-hygMX6 | This study | JCF10755 | |
| Strain (Schizosaccharomyces pombe) | cut3+::lacOp his7+::lacI-GFP cut11-RFP-hygMX6 bqt4::nat | This study | JCF11930 | |
| Strain (Schizosaccharomyces pombe) | taz1-mCherry-nat pLT1-2 (nmt1:Ish1-GFP-LEU2) | This study | JCF10701 | |
| Strain (Schizosaccharomyces pombe) | taz1-mCherry-nat bqt4::hygMX6 pLT1-2 (nmt1:Ish1-GFP-LEU2) | This study | JCF10723 | |
| Strain (Schizosaccharomyces pombe) | pot1-mRFP:kanMX6 cut11-3xPK-GFP:ura4 + leu1-32 ura4-D18 (WT) | Lab stock | JCF3649 | |
| Strain (Schizosaccharomyces pombe) | cut11-RFP-hyg tpz1-GFP-Kan taz1::ura4+ | This study | JCF12293 | |
| Strain (Schizosaccharomyces pombe) | cut11-RFP-hyg tpz1-GFP-Kan bqt4::nat | This study | JCF12291 | |
| Strain (Schizosaccharomyces pombe) | cut11-RFP-hygMX6 tpz1-GFP:kanMX6 bqt4::nat taz1::ura4+ | This study | JCF12290 | |
| Strain (Schizosaccharomyces pombe) | his2::kanMX6-ura4+-lacOp his7+::lacI-GFP cut11-RFP-hyg bqt4::nat swi6::leu2+ | This study | JCF10807 | |
| Strain (Schizosaccharomyces pombe) | his2::kanMX6-ura4+-lacOp his7+::lacI-GFP cut11-RFP-hyg swi6::leu2+ | This study | JCF 12279 | |
| Strain (Schizosaccharomyces pombe) | h- swi7-GFP::kanMX6 taz1-mCherry-natMX6 | This study | JCF11905 | |
| Strain (Schizosaccharomyces pombe) | swi7-GFP::kanMX6 taz1-mCherry-nat bqt4::hygMX6 | This study | JCF14504 | |
| Strain (Schizosaccharomyces pombe) | h- bqt4::nat ade6-M210 his3-D1 leu1-32 ura4-D18 | This study | JCF11933 | |
| Strain (Schizosaccharomyces pombe) | h+ ade6 M216 trt1::hygMX6 | Jain et al. (2010) | JCF6858 | Circular survivor |
| Strain (Schizosaccharomyces pombe) | h+ ade6 M210 clr4::kanMX6 | Lab stock | JCF3113 | |
| Strain (Schizosaccharomyces pombe) | h- clr4::kanMX6 bqt4::hygMX6 | This study | JCF10795 | |
| Strain (Schizosaccharomyces pombe) | h+ swi7-GFP-kanMX6 man1-GBP-mCherry-hph | This study | JCF11950 | GBP plasmids were gifts from Masamitsu Sato, University of Tokyo |
| Strain (Schizosaccharomyces pombe) | h- swi7-GFP-kanMX6 | Natsume et al. (2008) | JCF10835 | |
| Strain (Schizosaccharomyces pombe) | h+ swi7-GFP-kanMX6 man1-GBP-mCherry-hph bqt4::naMX6 | This study | JCF14517 | |
| Strain (Schizosaccharomyces pombe) | h90 otr1R::ade6 tel1L::his3 tel2L::ura4 ade6-210 his3-D1 leu1-32 ura4-D18 | Nimmo et al., 1998 | JCF6712 | Spike strain in ChIP-seq experiments. Used for telomere silencing assay |
| Strain (Schizosaccharomyces pombe) | h- dcr1::ura4+ | This study | JCF12179 | |
| Strain (Schizosaccharomyces pombe) | h+ ade6 M216 his3-D1 leu1-32 ura4-D18 bqt4::natMX6 | This study | JCF14512 | |
| Strain (Schizosaccharomyces pombe) | h- leu1-32 ura4-D18 T2R1-4137::ura4+ | Kanoh et al. (2005) | JCF10833 | |
| Strain (Schizosaccharomyces pombe) | h- swi6::LEU2 leu1-32 ura4-D18 T2R1-4137::ura4+ | Kanoh et al. (2005) | JCF10830 | |
| Strain (Schizosaccharomyces pombe) | h- leu1-32 ura4-D18 T2R1-4137::ura4 + bqt4::natMX6 | This study | JCF10833, 10834 | |
| Strain (Schizosaccharomyces pombe) | h- swi6::LEU2 leu1-32 ura4-D18 T2R1-7921::ura4+ | Kanoh et al. (2005) | JCF10829 | |
| Strain (Schizosaccharomyces pombe) | h- leu1-32 ura4-D18 T2R1-7921::ura4 + bqt4::natMX6 | This study | JCF11998-12002 | |
| Strain (Schizosaccharomyces pombe) | h- leu1-32 ura4-D18 T2R1-7921::ura4+ | Kanoh et al. (2005) | JCF10832 | |
| Strain (Schizosaccharomyces pombe) | h+ lem2::kanMX6 | This study | JCF12178 | |
| Strain (Schizosaccharomyces pombe) | h90 epe1::natMX6 | This study | JCF10787 | |
| Strain (Schizosaccharomyces pombe) | epe1::natMX6 lem2::kanMX6 | This study | JCF12204 | |
| Strain (Schizosaccharomyces pombe) | h+ lem2::kanMX6 dcr1::ura4 | This study | JCF12182 | |
| Strain (Schizosaccharomyces pombe) | h- epe1::naMX6t dcr1::ura4 | This study | JCF12209 | |
| Strain (Schizosaccharomyces pombe) | epe1::natMX6 dcr1::ura4 lem2::kanMX6 | This study | JCF12211 | |
| Strain (Schizosaccharomyces pombe) | h+ cnp1-1 leu1 Rep41-ams2+[leu1+] | NBPR | JCF14580 | Yeast Genetic Resource Center (YGRC), Graduate School of Science, Osaka City University |
| Strain (Schizosaccharomyces pombe) | lem2::natMX6 cnp1-1 leu1 Rep41-ams2+[leu1+] | This study | JCF14588 | |
| Strain (Schizosaccharomyces pombe) | h+ cnp1-1::ura4 + ura4-D18 | NBPR | JCF10266 | Yeast Genetic Resource Center (YGRC), Graduate School of Science, Osaka City University |
| Strain (Schizosaccharomyces pombe) | h- bqt4::nat leu1-32 ura4-D18 his3-D1 ade6-M210 | This study | JCF11933, 11934 | |
| Strain (Schizosaccharomyces pombe) | epe1::natMX6 dcr1::ura4 + bqt4::hygMX6 | This study | JCF12240 | |
| Strain (Schizosaccharomyces pombe) | h- bqt4::hygMX6 epe1::natMX6 | This study | JCF10811 | |
| Strain (Schizosaccharomyces pombe) | h+ bqt4::hygMX6 dcr1::ura4+ | This study | JCF12180 | |
| Strain (Schizosaccharomyces pombe) | h- ade6-M210 leu1-32 ura4-D18 his3-D1 sid4-GFP-kanMX6 dh1L-tetO-ura+tetR-mCherry-nat | This study | JCF14534 | |
| Strain (Schizosaccharomyces pombe) | h- his7+::adh13pr-lacI-CFP C12::kanR-ura4+-lacOp sid4-mRFP-natR ade6-210 leu1-32 ura4-D18 lys1-131 | This study | JCF18924 | |
| Strain (Schizosaccharomyces pombe) | ade6-210 leu1-32 lys1-131 ura4-D18 sod2::kanr-ura4+-lacOp his7+::lacI-GFP cut11-RFP-hyg clr4::nat | This study | JCF11961 | |
| Strain (Schizosaccharomyces pombe) | lem2-GFP-Kan bqt4::nat pcp1-RFP-hph | This study | JCF12189 | |
| Strain (Schizosaccharomyces pombe) | lem2-GFP-Kan pcp1-RFP-hph | This study | JCF12190 | |
| Strain (Schizosaccharomyces pombe) | man1-GFP-kan ura4-D18 | This study | JCF12153 | |
| Strain (Schizosaccharomyces pombe) | h+ man1 GFP-kan bqt4::nat ura4-D18 | This study | JCF12163 | |
| Strain (Schizosaccharomyces pombe) | h- ade6-M210 his3-D1 leu1-32 ura4-D18 nup107-GFP:ura4+ | This study | JCF11770 | |
| Strain (Schizosaccharomyces pombe) | nup107-GFP:ura4 + bqt4::nat | This study | JCF12177 | |
| Strain (Schizosaccharomyces pombe) | cut11-3xPK-GFP:ura4 + leu1-32 ura4-D18 | Lab stock (from Nurse lab) | JCF2924 | |
| Strain (Schizosaccharomyces pombe) | h+ cut11 GFP-kan bqt4::nat ura4-D18 | This study | JCF12176 | |
| Strain (Schizosaccharomyces pombe) | h- bqt4::nat leu1-32 ura4-D18 his3-D1 ade6-M210 aur1R-GFP-bqt4ΔTM | This study | JCF12048, 12049 | |
| Strain (Schizosaccharomyces pombe) | lys1+-GFP-bqt4 bqt4::nat ura4-D18 ade6-M210 | This study | JCF11958 | |
| Strain (Schizosaccharomyces pombe) | imr1R(Nco1)::ura4 + swi7 GFP-kanR ura4-D18 leu1-32 ade6-M216 | This study | JCF18888 | |
| Strain (Schizosaccharomyces pombe) | imr1R(Nco1)::ura4 + swi7 GFP-kanR ura4-D18 leu1-32 | This study | JCF18890 | |
| Strain (Schizosaccharomyces pombe) | imr1R(Nco1)::ura4 + ura4-D18 leu1-32 ade6-M216 | This study | JCF18892 | |
| Strain (Schizosaccharomyces pombe) | imr1R(Nco1)::ura4 + ura4-D18 leu1-32 | This study | JCF18893 | |
| Strain (Schizosaccharomyces pombe) | h+ his3D1leu1-32 ade6 | Lab stock | JCF901 | |
| Strain (Schizosaccharomyces pombe) | h- rad11-mCherry-kanR leu1-32 ura4-D18 ade6 | Lab stock | JCF1234 | |
| Strain (Schizosaccharomyces pombe) | swi7-GFP::kanMX6 man1-GBP-mCherry-hph rad11-mCherry-Kan | This study | JCF14598 | |
| Strain (Schizosaccharomyces pombe) | taz1-mTurquoise2-natR man1-GBP-mCh-hphR ura4-D18 his3-D1 ade6 | This study | JCF18936 | |
| Strain (Schizosaccharomyces pombe) | taz1-mTurquoise2-natR swi7-GFP-kanR man1-GBP-mCh-hphR ura4-D18 his3-D1 ade6 | This study | JCF18939 | |
| Strain (Schizosaccharomyces pombe) | h90 otr1R::ade6 + tel1L::his3 + tel2L::ura4 + ade6-210 his3-D1 leu1-32 ura4-D18 | Lab stock | JCF6712 | |
| Strain (Schizosaccharomyces pombe) | h90 otr1R::ade6 + tel1L::his3 + tel2L::ura4 + clr4::kanMX ade6-210 his3-D1 leu1-32 ura4-D18 | Lab stock | JCF6715 | |
| Strain (Schizosaccharomyces pombe) | h90 otr1R::ade6 + tel1L::his + 3 tel2L::ura + 4 bqt4::nat ade6-210 his3-D1 leu1-32 ura4-D18 | This study | JCF10763 | |
| Other | YES225 | Sunrise Science Products | Cat#2011–500 | |
| Other | PMG | Sunrise Science Products | Cat#2060–500 | |
| Other | EMM | Sunrise Science Products | Cat#2005–500 |
Additional files
-
Transparent reporting form
- https://doi.org/10.7554/eLife.32911.021
Download links
A two-part list of links to download the article, or parts of the article, in various formats.
Downloads (link to download the article as PDF)
Open citations (links to open the citations from this article in various online reference manager services)
Cite this article (links to download the citations from this article in formats compatible with various reference manager tools)
Distinct ‘safe zones’ at the nuclear envelope ensure robust replication of heterochromatic chromosome regions
eLife 7:e32911.
https://doi.org/10.7554/eLife.32911


