The representational dynamics of task and object processing in humans
- National Institute of Mental Health, National Institutes of Health, United States
- Wright State University, United States
- Free University of Berlin, Germany
- Humboldt Universität zu Berlin, Germany
- Charité Universitätsmedizin, Germany
Figures
Figure 1
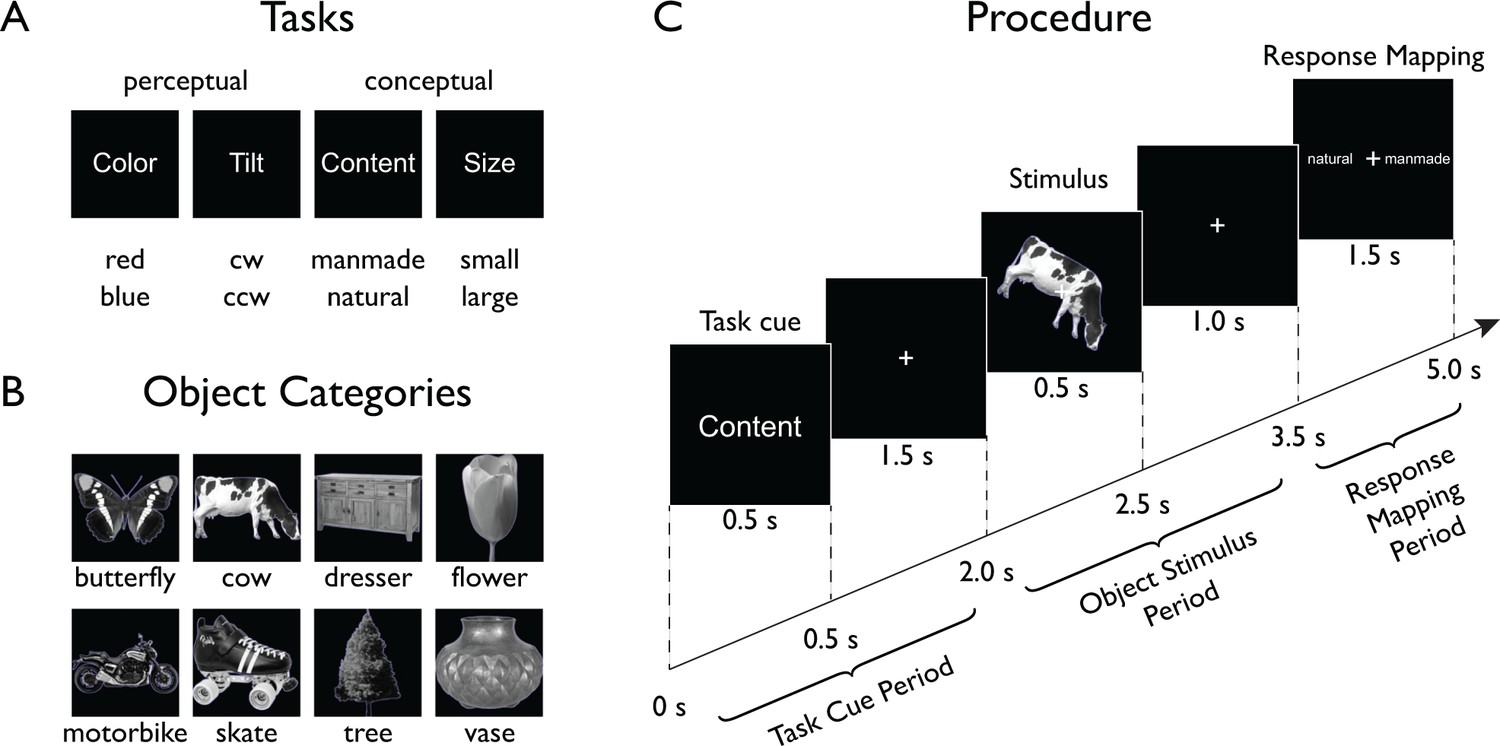
Experimental paradigm.
On each trial (Procedure depicted in Panel C), participants were presented with a stimulus from one of eight different object classes (Panel B) embedded in one of four task contexts (Panel A, top) indicated at the beginning of each trial. Participants carried out a task that either targeted low-level features (perceptual tasks) of the object or its high-level, semantic content (conceptual tasks). After a short delay, a response-mapping screen was shown that presented the possible response alternatives (Panel A, bottom) in random order either left or right of fixation to decouple motor responses from the correct response.
Figure 2
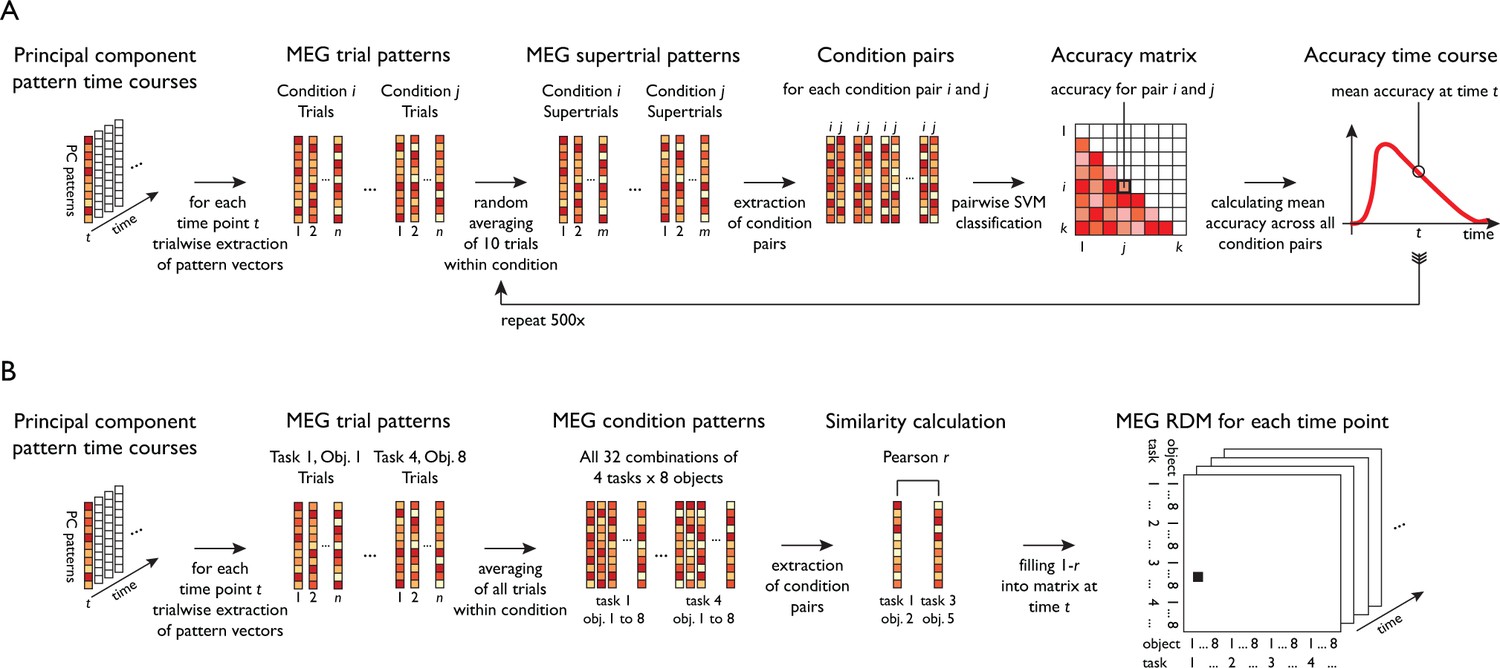
Schematic for multivariate analyses of MEG data.
All multivariate analyses were carried out in a time-resolved manner on principal components (PCs) based on MEG sensor patterns (see Materials and methods for transformation of sensor patterns to PCs). (A) Time-resolved multivariate decoding was conducted using pairwise SVM classification at each time point, classifying all pairs of tasks or categories, and averaging classification accuracies within a given decoding analysis (e.g. decoding of task or category). (B) For model-based MEG-fMRI fusion, 32 × 32 representational dissimilarity matrices were constructed using Pearson's r for all combinations of task and category.
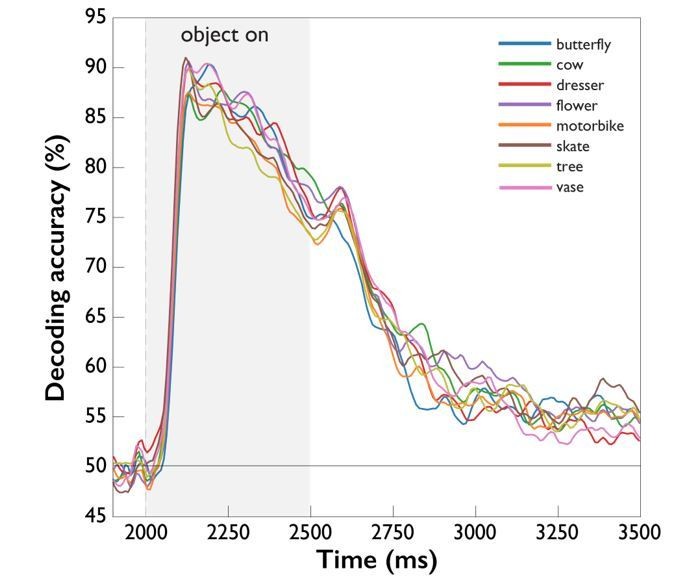
Figure 3
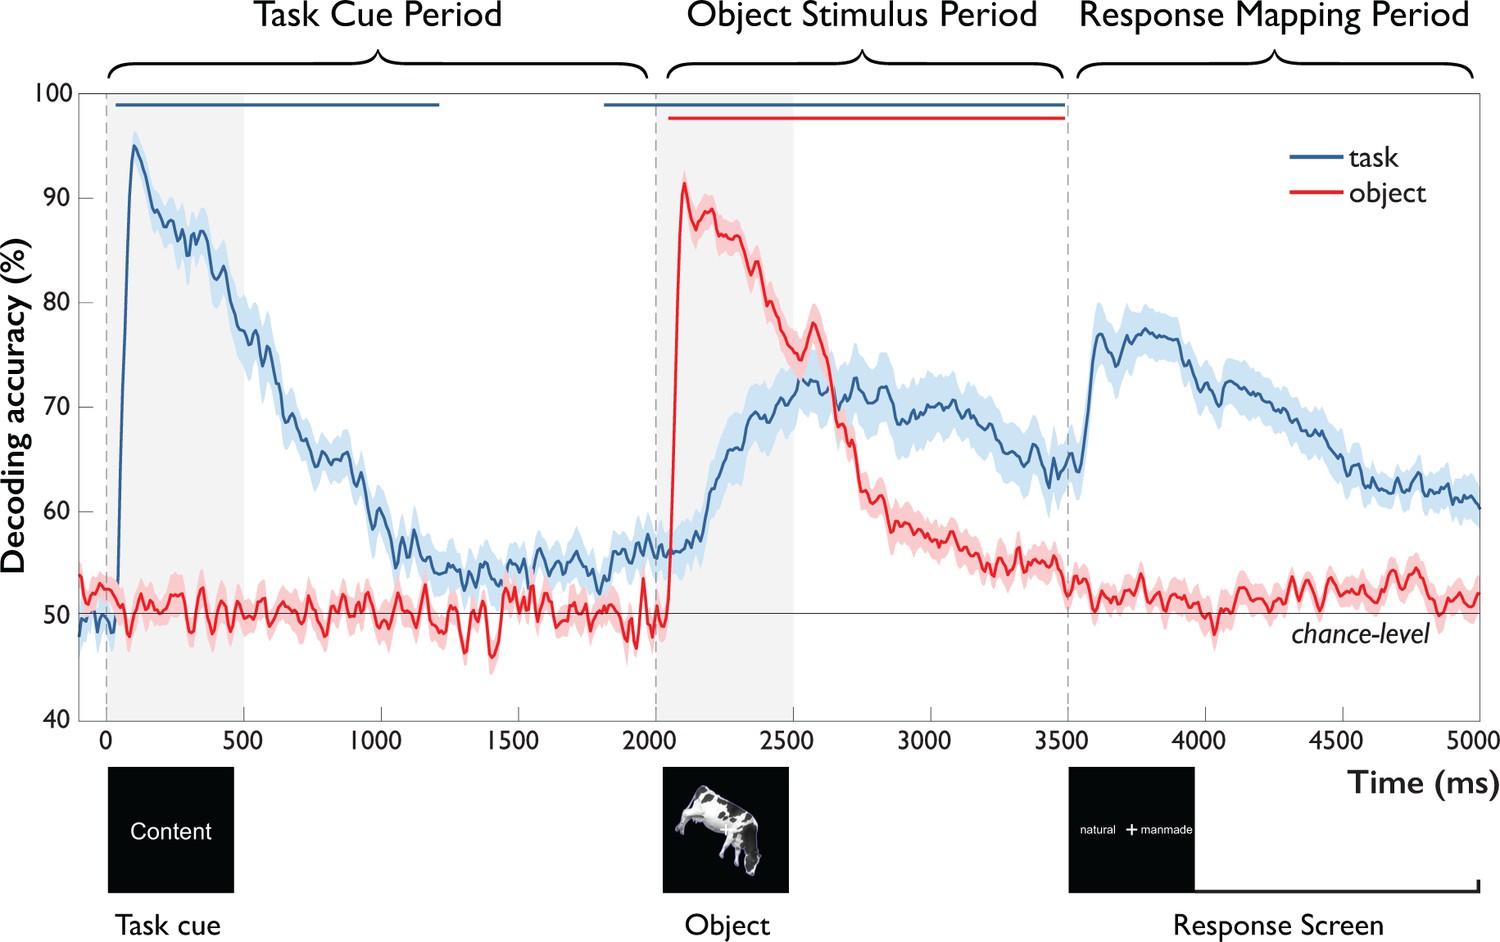
Time-resolved MEG decoding of task and objects across the trial.
After onset of the task cue (Task Cue Period), task-related accuracy increased rapidly, followed by a decay toward chance and significant above-chance decoding ~200 ms prior to object onset. After onset of the object stimulus (Object Stimulus Period), object-related accuracy increased rapidly, decaying back to chance with the onset of the response-mapping screen. This was paralleled by a gradual increase in task-related accuracy, starting 242 ms and peaking 638 ms after object onset and remaining high until onset of the response-mapping screen. Error bars reflect SEM across participants for each time-point separately. Significance is indicated by colored lines above accuracy plots (non-parametric cluster-correction at p<0.05). Time periods after the onset of the response-mapping screen were excluded from statistical analyses (see Materials and methods and Results), but are shown for completeness.
-
Figure 3—source data 1
Per subject time courses of mean classification accuracy for task and object.
- https://doi.org/10.7554/eLife.32816.005
Figure 4 with 2 supplements
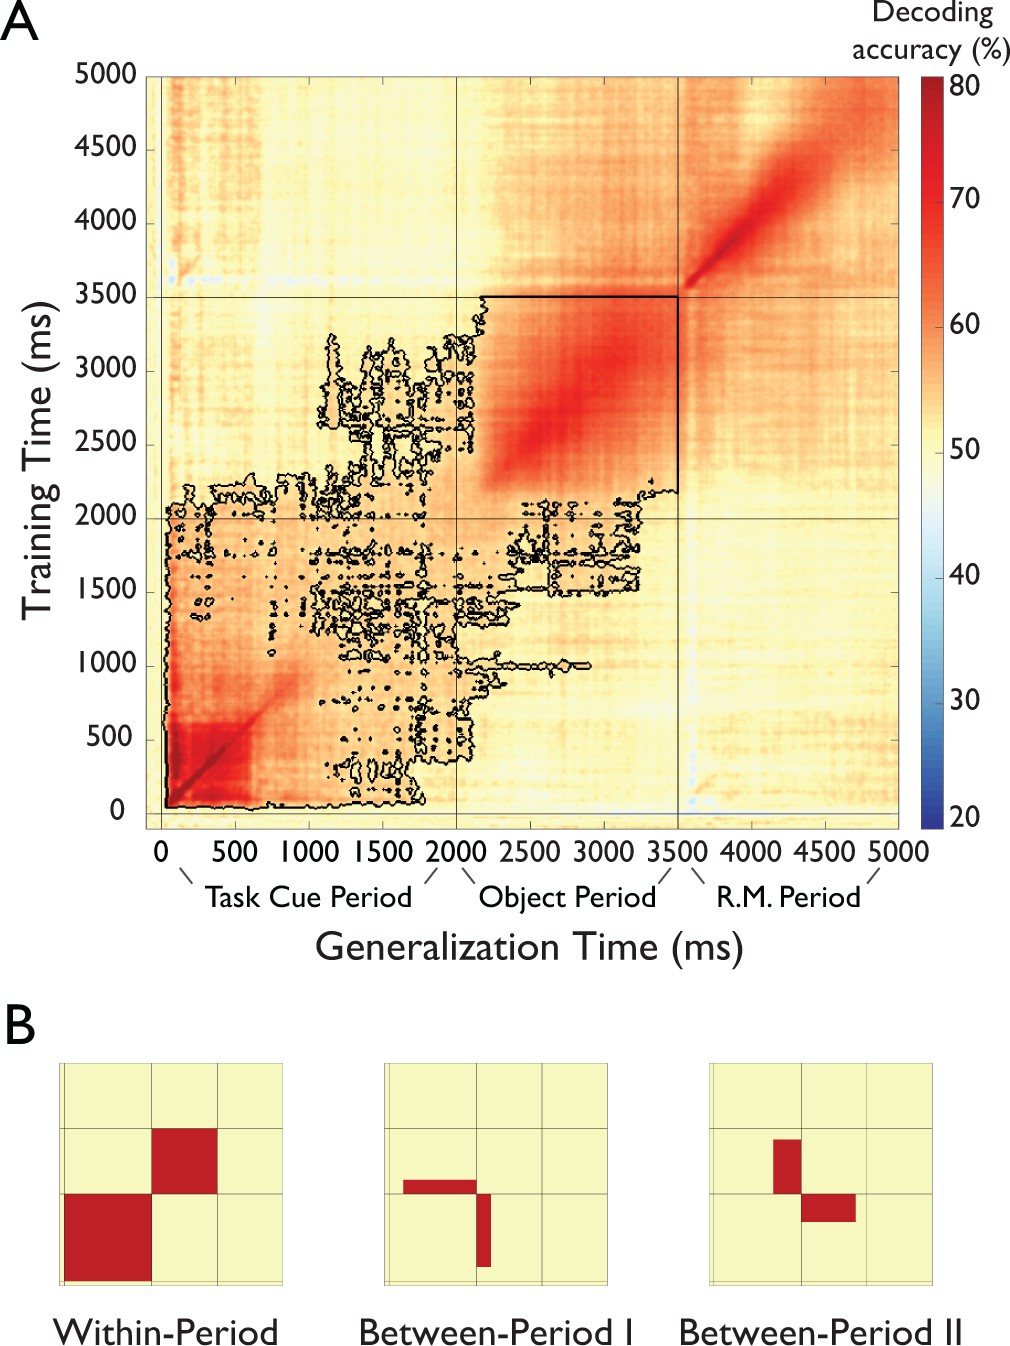
Results of temporal generalization analysis of task.
(A) Temporal cross-classification matrix. The y-axis reflects the classifier training time relative to task cue onset, the x-axis the classifier generalization time, and the color codes the cross-classification accuracy for each combination of training and generalization time. The outline reflects significant clusters (p<0.05, cluster-corrected sign permutation test). Results after the onset of the response-mapping screen are not included in the statistical evaluation but are shown for completeness. (see Results) (B). Panels that schematically indicate three patters in the temporal generalization results. First, there was a block structure (Within-Period Cross-Decoding) separately spanning the Task Cue Period and the Object Stimulus Period, indicating largely different representations during the different periods of the task (left panel). At the same time, there were two separate patterns of temporal generalization in the off-diagonals (Between-Period I and Between-Period II Cross-Decoding illustrated in middle and right panel, respectively), indicating a shared representational format between these time periods.
-
Figure 4—source data 1
Per subject matrices of temporal cross-classification analysis of task.
- https://doi.org/10.7554/eLife.32816.009
Figure 4—figure supplement 1
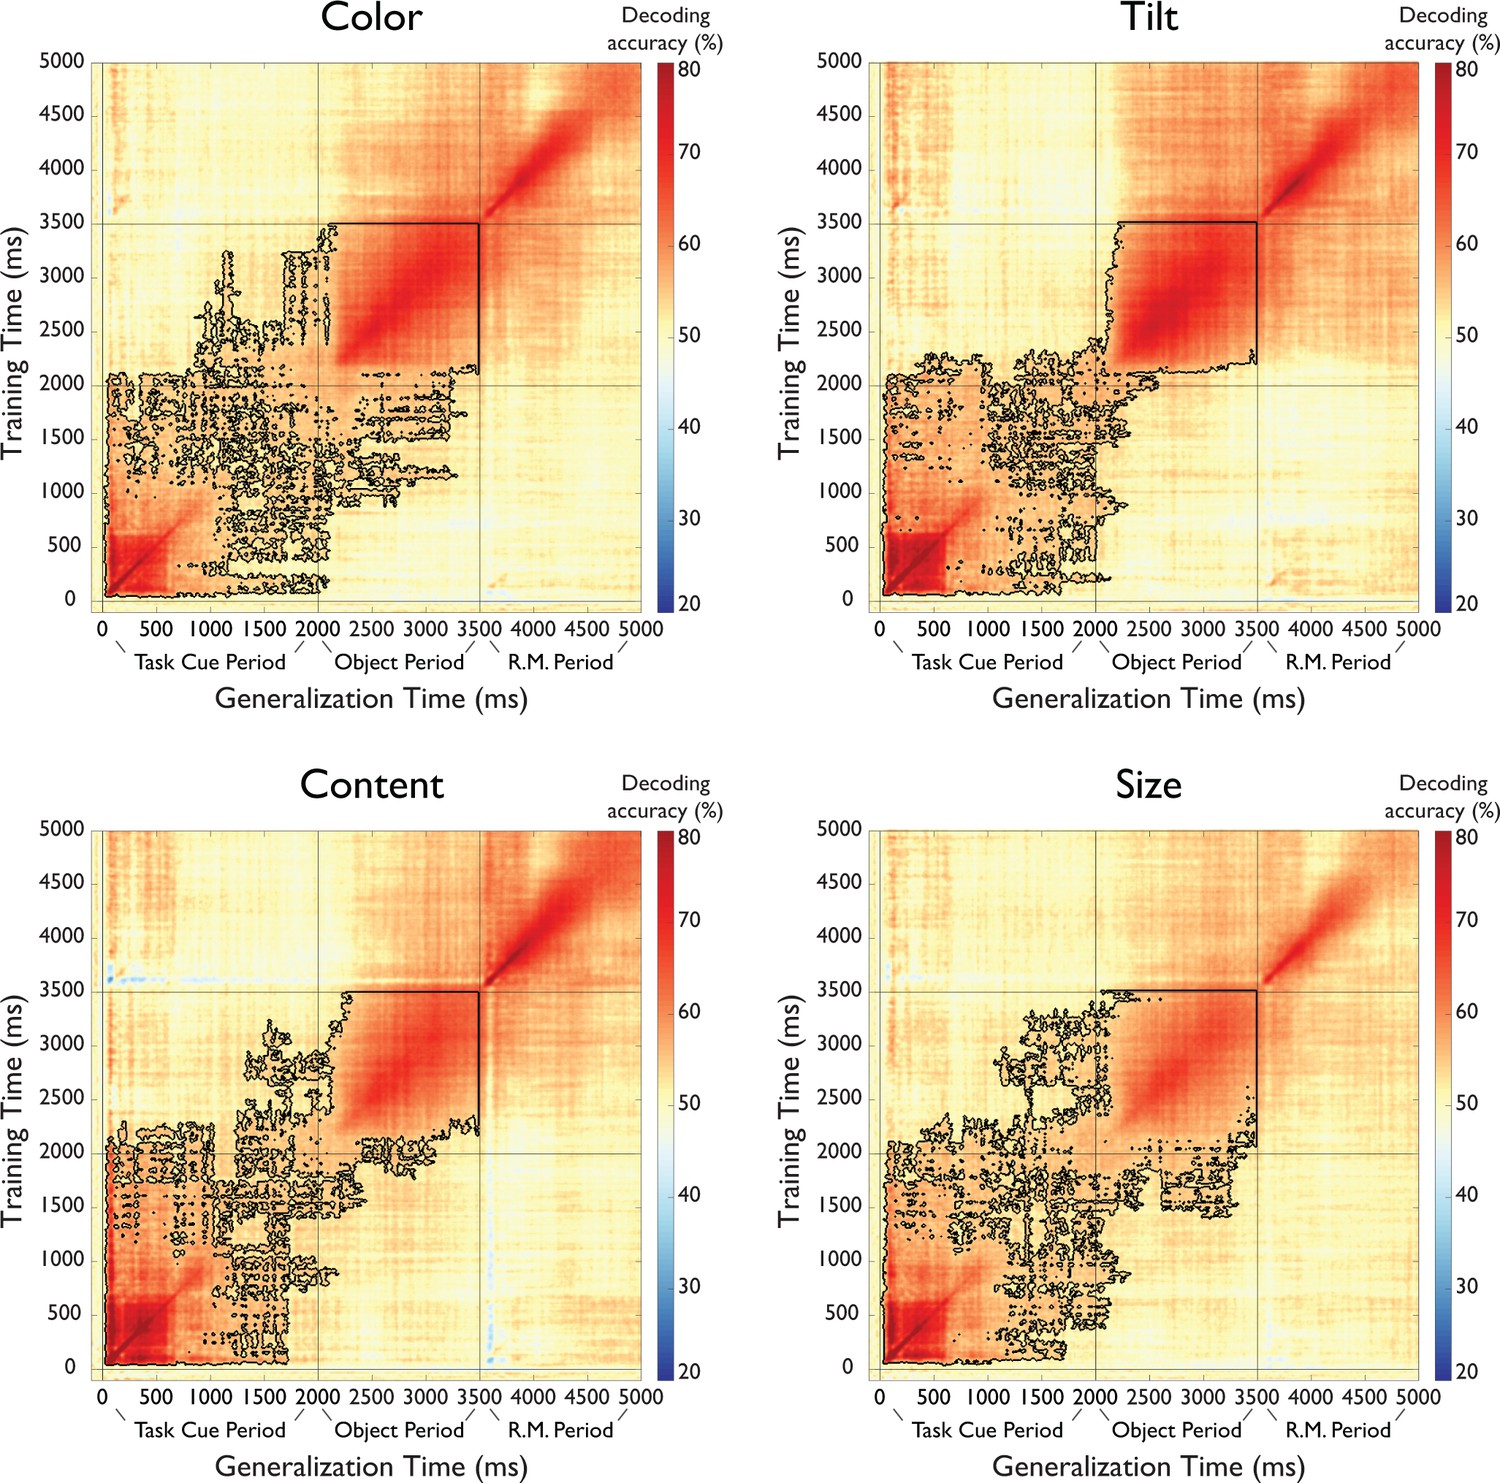
Results of temporal generalization analysis of task separated by task type.
Each map reflects the average of all pairwise classifications of a given task with all other tasks (e.g. color vs. tilt, color vs. content, color vs. size). The y-axis reflects the classifier training time relative to task cue onset, the x-axis the classifier generalization time, and the color codes the cross-classification accuracy for each combination of training and generalization time. The outline reflects significant clusters (p<0.05, cluster-corrected sign permutation test). Time periods after the onset of the response-mapping screen were excluded from statistical analyses (see Materials and methods and Results), but are shown for completeness.
Figure 4—figure supplement 2
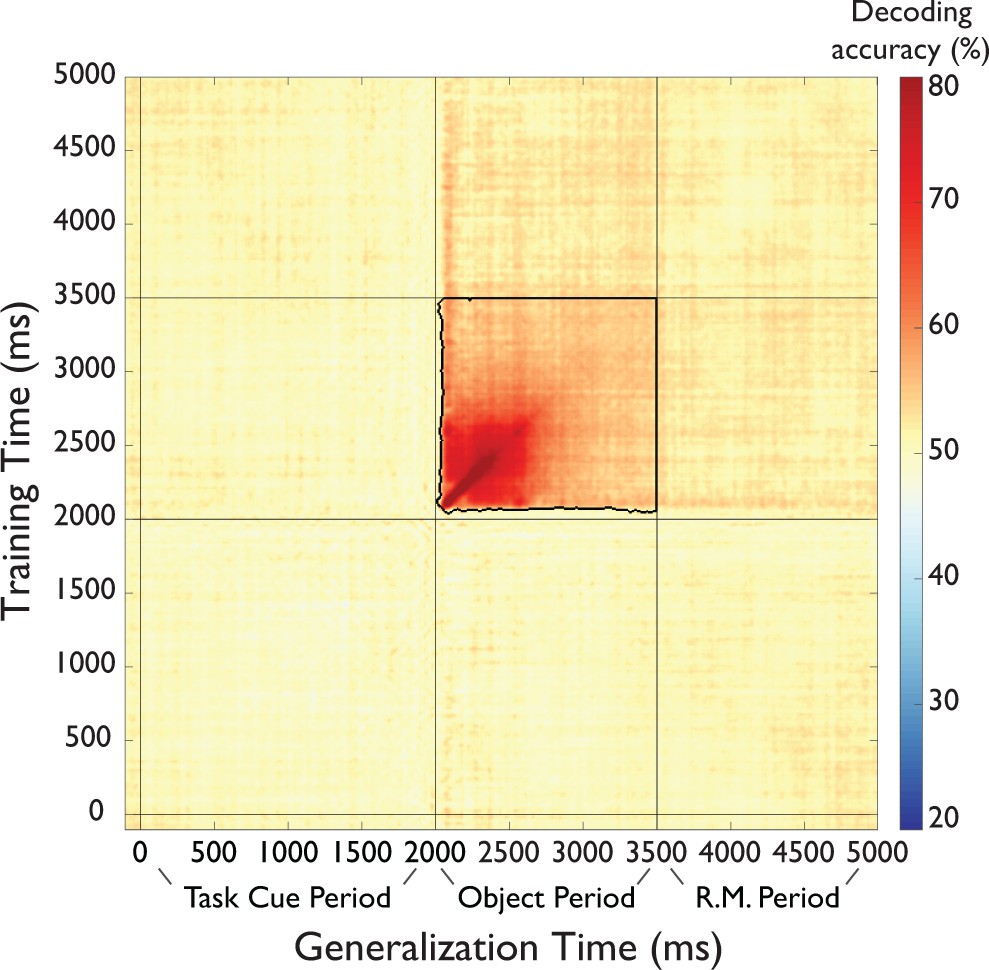
Results of temporal generalization analysis of objects.
The y-axis reflects the classifier training time relative to task cue onset, the x-axis the classifier generalization time, and the color codes the cross-classification accuracy for each combination of training and generalization time. The outline reflects significant clusters (p<0.05, cluster-corrected sign permutation test). Time periods after the onset of the response-mapping screen were excluded from statistical analyses (see Materials and methods and Results), but are shown for completeness.
Figure 5
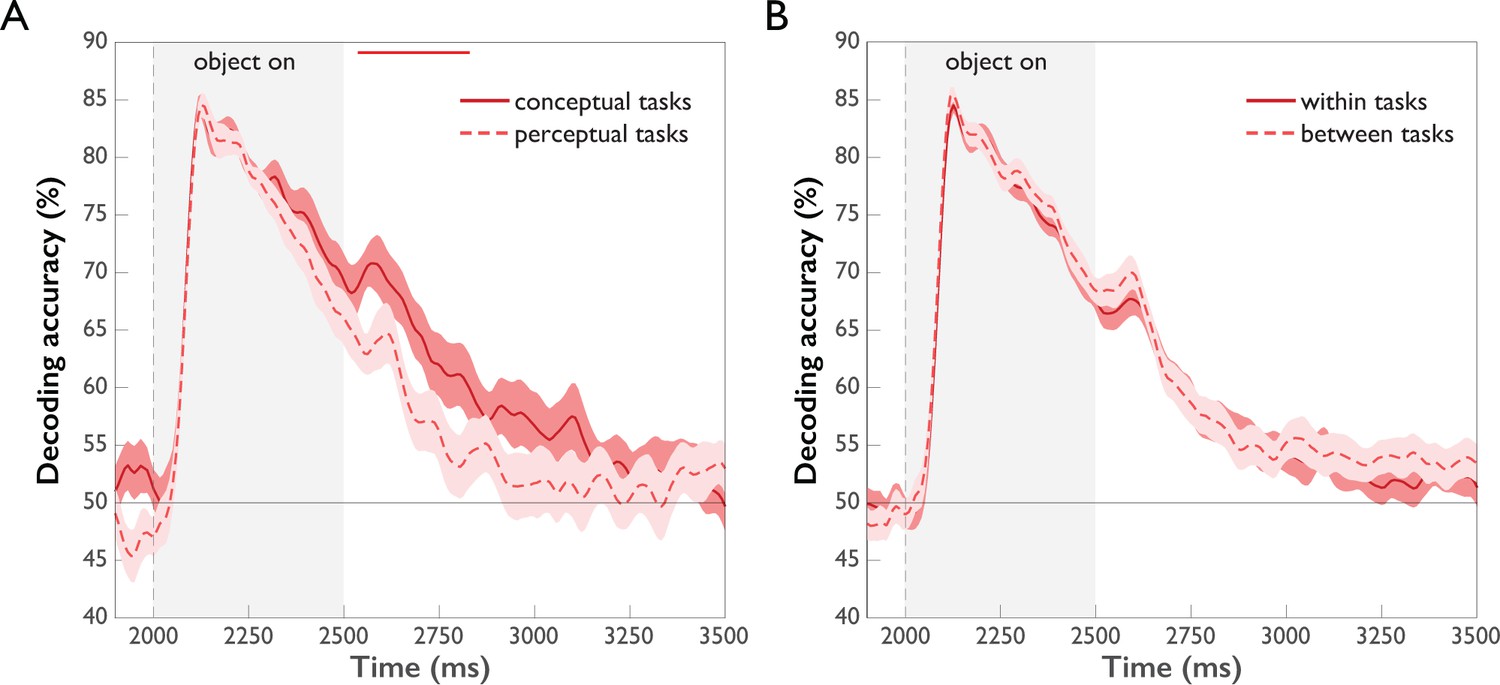
Comparison of object decoding for different task types (p<0.05, cluster-corrected sign permutation test).
Error bars reflect standard error of the difference of the means. (A) Object decoding separated by perceptual and conceptual task types. Initially, object decoding for conceptual and perceptual tasks is the same, followed by decoding temporarily remaining at a higher level for conceptual tasks than perceptual tasks between 542 and 833 ms post-stimulus onset. (B) Object decoding within and across task types. A classifier was trained on data of different objects from one task type and tested either on object-related data from the same task type (within tasks) or on object-related data from the other task type (between tasks). There was no difference in within and between-task decoding.
-
Figure 5—source data 1
Per subject time courses of mean classification accuracy for task separated by task type and cross-classification accuracy between task types.
- https://doi.org/10.7554/eLife.32816.011
Figure 6 with 2 supplements
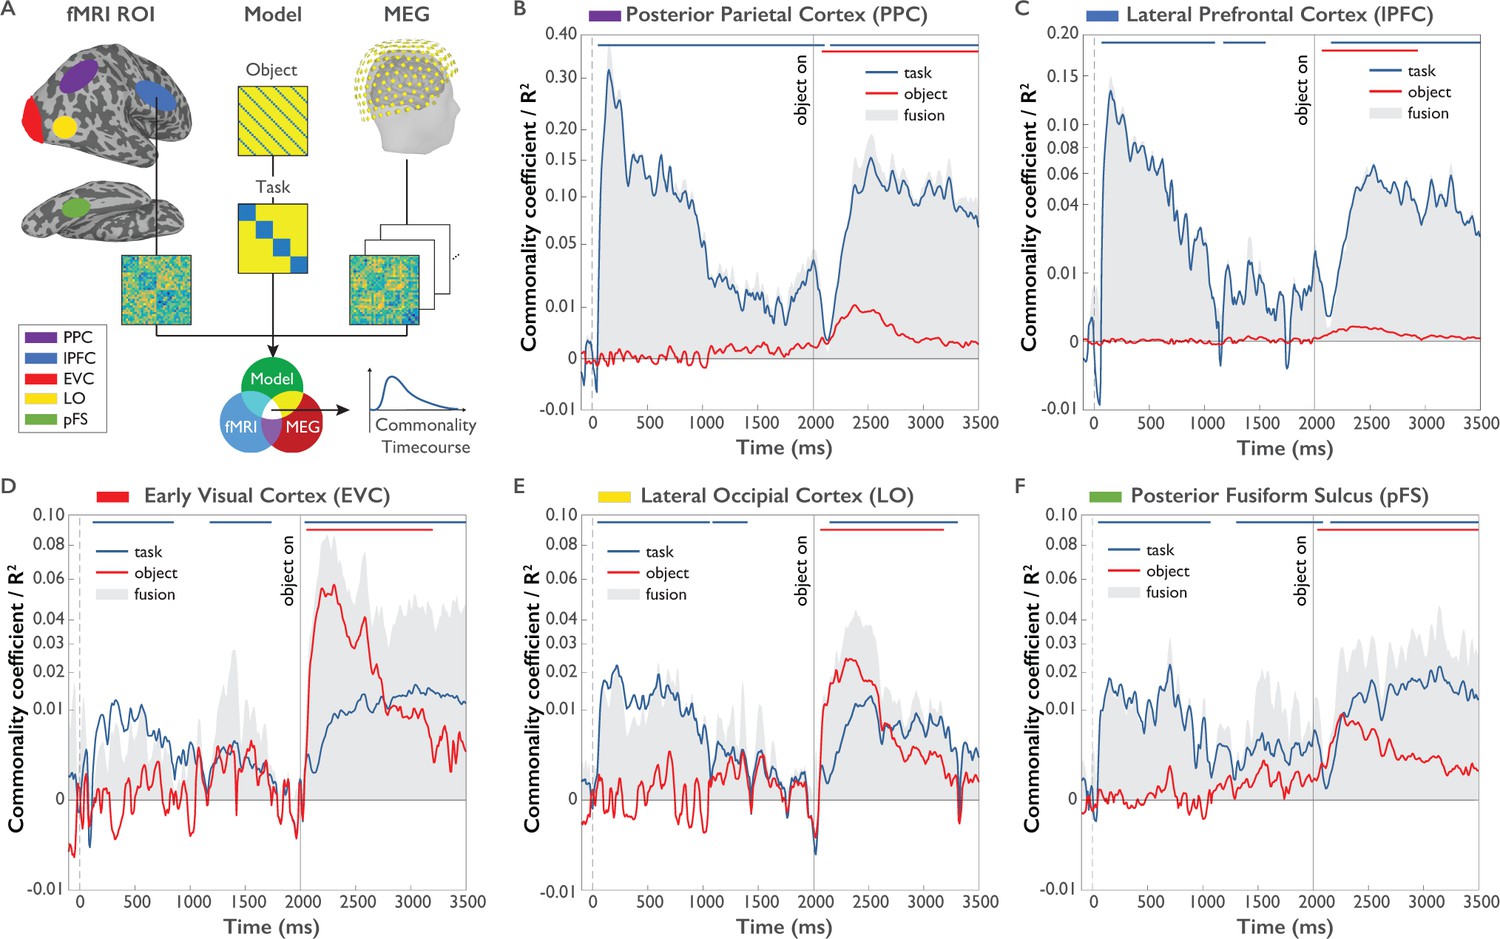
Model-based MEG-fMRI fusion procedure and results.
(A) Model-based MEG-fMRI fusion in the current formulation reflects the shared variance (commonality) between three dissimilarity matrices: (1) an fMRI RDM generated from voxel patterns of a given ROI, (2) a model RDM reflecting the expected dissimilarity structure for a variable of interest (e.g. task) excluding the influence of another variable of interest (e.g. object) and (3) an MEG RDM from MEG data at a given time point. This analysis was conducted for each MEG time point independently, yielding a time course of commonality coefficients for each ROI. (B-F). Time courses of shared variance and commonality coefficients for five regions of interest (ROIs) derived from model-based MEG-fMRI fusion (p<0.05, cluster-corrected randomization test, corrected for multiple comparisons across ROIs): PPC (Panel B), lPFC (Panel C), EVC (Panel D), LO (Panel E) and pFS (Panel F). Blue plots reflect the variance attributed uniquely to task, while red plots reflect the variance attributed uniquely to object. Grey-shaded areas reflect the total amount of variance shared between MEG and fMRI RDMs, which additionally represents the upper boundary of the variance that can be explained by task or object models. Y-axes are on a quadratic scale for better comparability to previous MEG-RSA and MEG-fMRI fusion results reporting correlations (Cichy et al., 2014) and to highlight small but significant commonality coefficients.
-
Figure 6—source data 1
Mean representational dissimilarity matrices for all combinations of task and object, both for all five fMRI ROIs and each MEG time point, including pre-calculated permutations used for permutation testing.
- https://doi.org/10.7554/eLife.32816.014
Figure 6—figure supplement 1
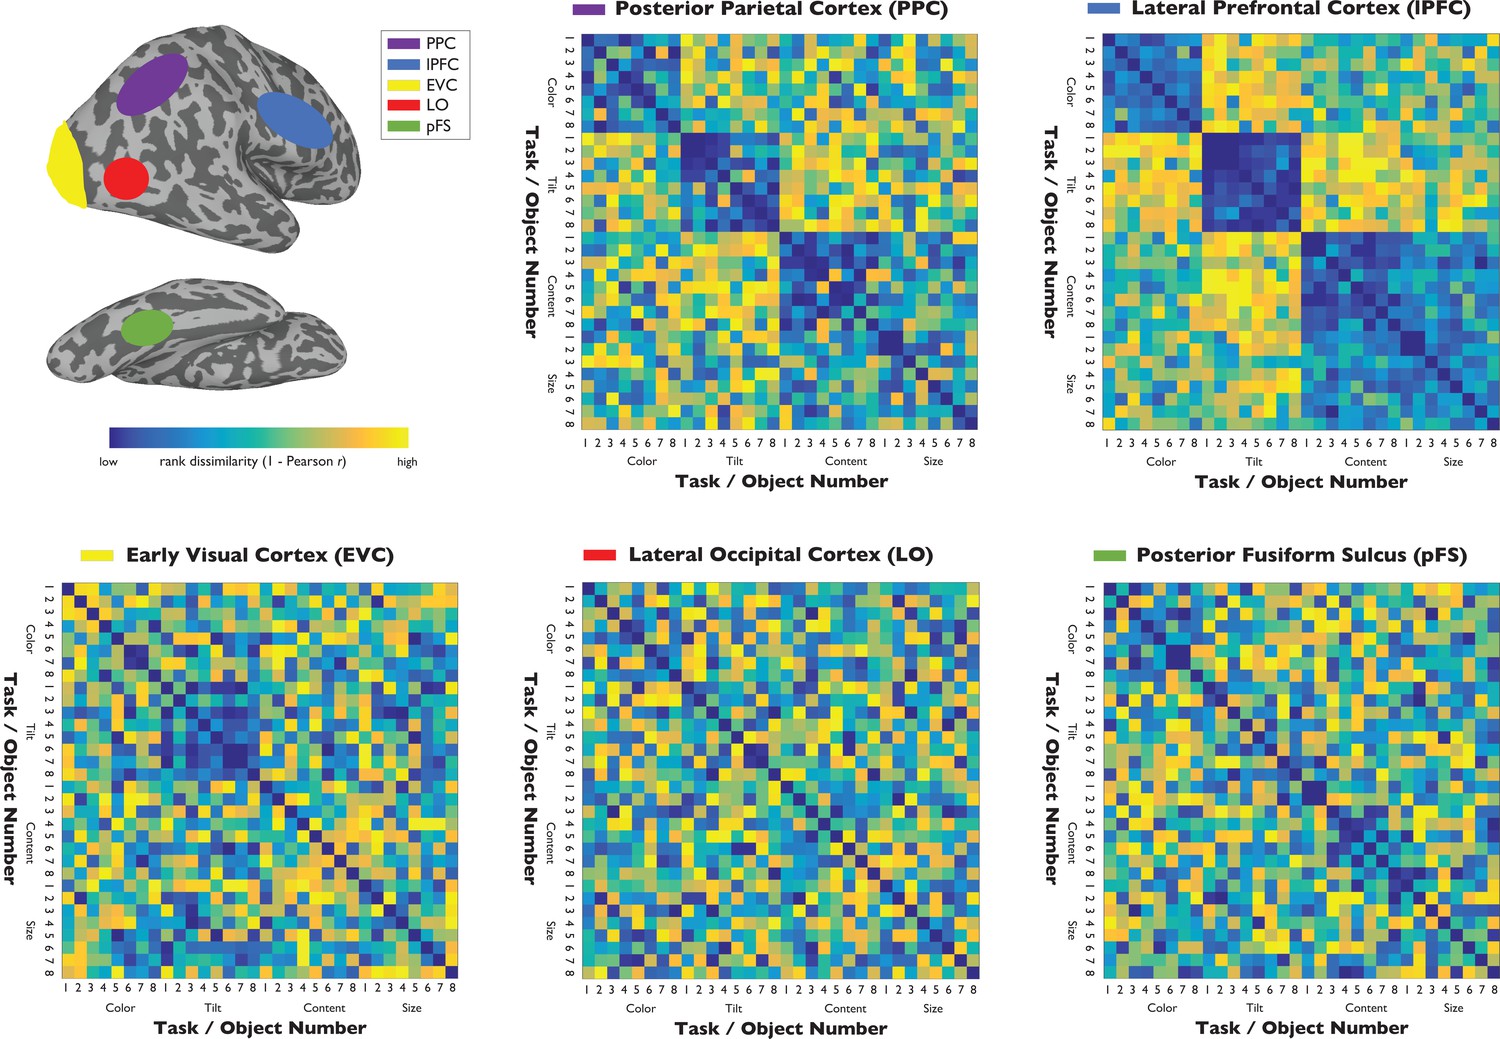
FMRI representational dissimilarity matrices (RDMs) for the five regions of interest: Posterior parietal cortex (PPC), lateral prefrontal cortex (lPFC), early visual cortex (EVC), object-selective lateral occipital cortex (LO), and posterior fusiform sulcus (pFS).
Since RDMs are compared to MEG data using Spearman r, rank-transformed dissimilarities are plotted.
Figure 6–video 1
Movie of time-resolved MEG representational dissimilarity matrices, scaled using the rank transform across dissimilarities.
https://doi.org/10.7554/eLife.32816.015
Author response image 1
Author response image 2
Additional files
-
Source code 1
Matlab scripts including helper functions to produce Figures 3–6 based on available source data.
- https://doi.org/10.7554/eLife.32816.016
-
Transparent reporting form
- https://doi.org/10.7554/eLife.32816.017
Download links
A two-part list of links to download the article, or parts of the article, in various formats.
Downloads (link to download the article as PDF)
Open citations (links to open the citations from this article in various online reference manager services)
Cite this article (links to download the citations from this article in formats compatible with various reference manager tools)
The representational dynamics of task and object processing in humans
eLife 7:e32816.
https://doi.org/10.7554/eLife.32816


