Explosive mutation accumulation triggered by heterozygous human Pol ε proofreading-deficiency is driven by suppression of mismatch repair
- Tulane University School of Medicine, United States
- The Hospital for Sick Children, Canada
- University of Toronto, Canada
Figures
Figure 1 with 2 supplements
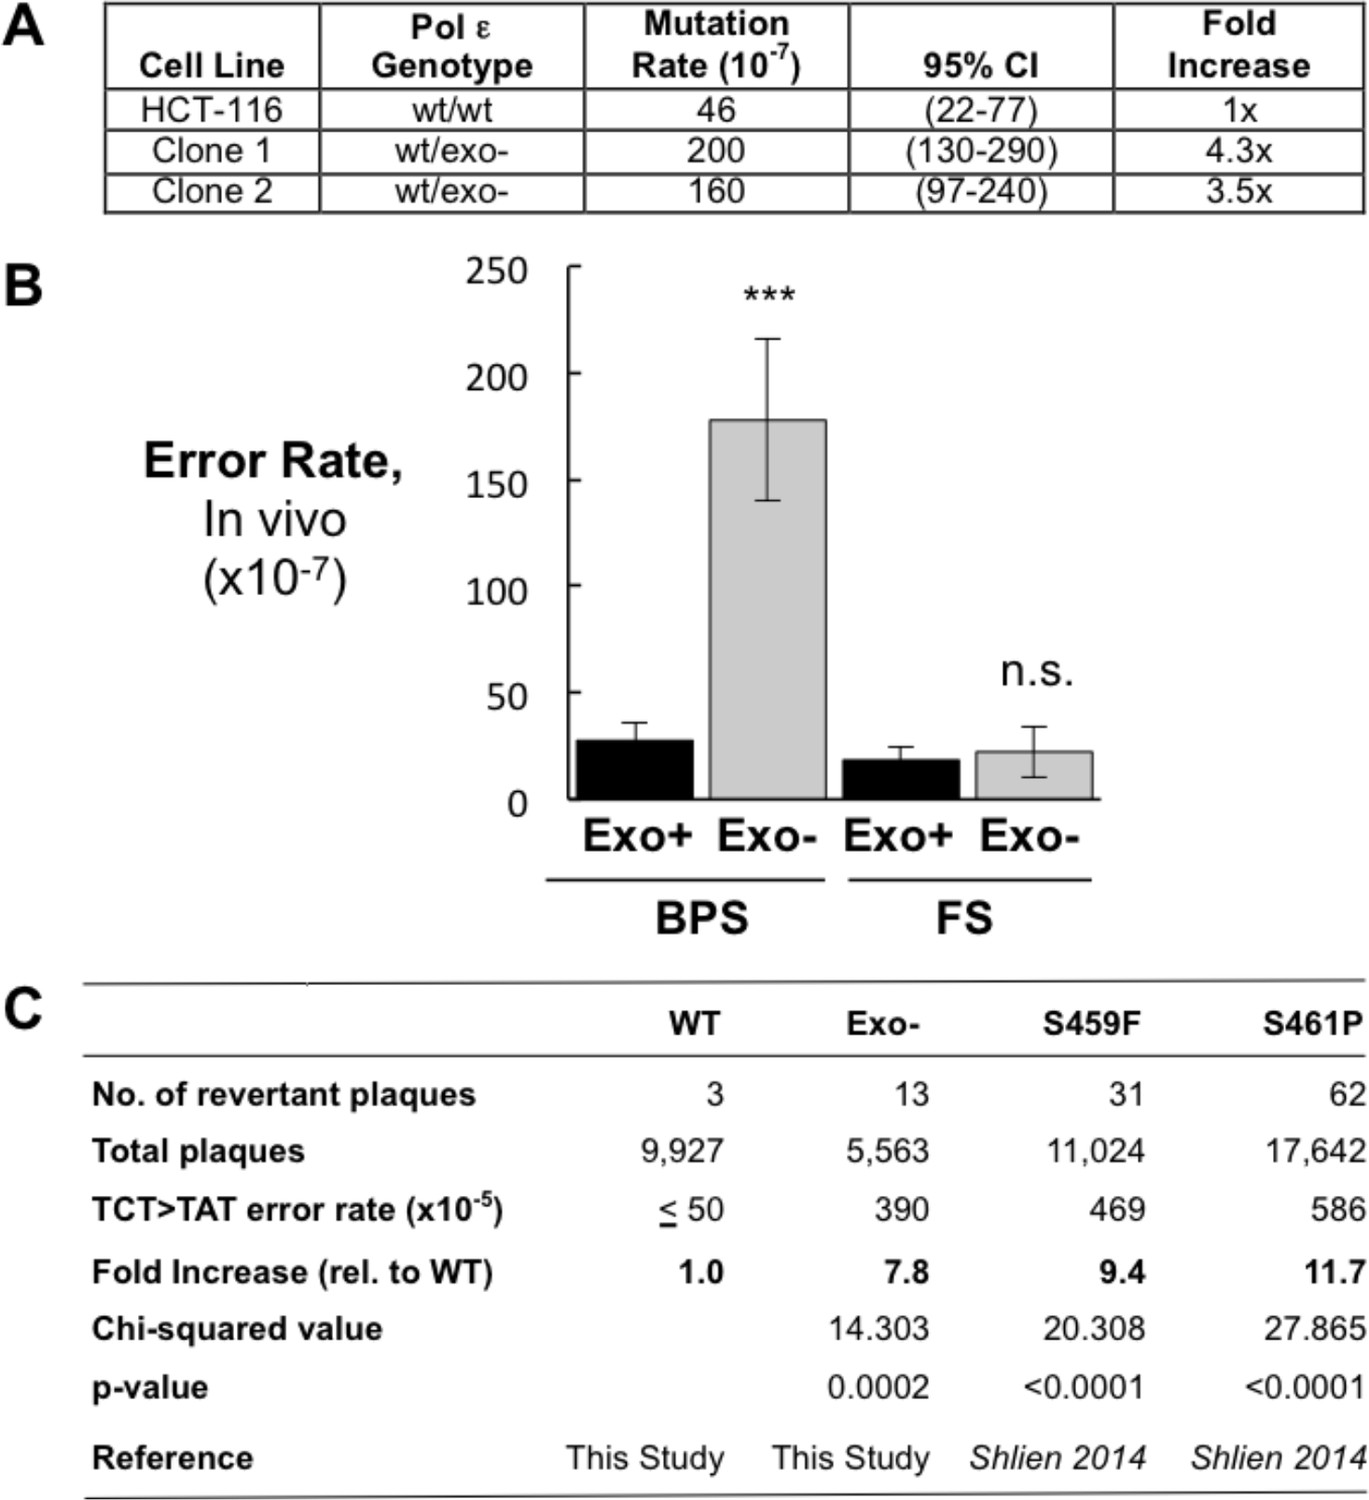
Heterozygous inactivation of Pol ε proofreading causes an increase in specific base pair substitutions.
(A) Mutation rates were measured using the fluctuation assay at the HPRT1 locus by resistance to 6-thioguanine. Mutation rates and 95% confidence intervals were measured by fluctuation analysis as described in the Methods using the Ma-Sandri-Sarkar Maximum Likelihood Estimator. Twelve independent isolates of both the parental (wt/wt) cell line and two independently derived clones of the heterozygous cell lines (wt/exo-) were used. All cell lines were mismatch repair-deficient. P-values for Clones 1 and 2 (p=0.0017 and p=0.008, respectively) were calculated using an unpaired t-test relative to wt/wt. Mutation rates for Clone 1 and Clone 2 were not significantly different from one another (p=0.4727). (B) Error rates for base pair substitutions (BPS) and small insertion/deletion frameshift mutations (FS) were calculated using the mutation rate data from Figure 1A. Exo + BPS Error Rate = 27.6 × 10⁻⁷, SEM = 8.48 × 10⁻⁷, n = 12; Exo- BPS Error Rate = 178 × 10−7, SEM = 37.8 × 10⁻⁷, n = 8; p=0.0002. Exo + FS Error Rate = 18.4 × 10⁻⁷, SEM = 5.73 × 10⁻⁷, n = 8; Exo- FS Error Rate = 22.2 × 10⁻⁷, SEM = 12.1 × 10⁻⁷, n = 1; p=0.7759. Error rate data shown for Exo- is from Clone 1 (See Figure 1A). The HPRT1 ORF was sequenced from independently derived isolates of 6-TG resistant clones (these included 20 mismatch repair-deficient Pol εwt/wt and 25 mismatch repair-deficient Pol εwt/exo- clones; see Materials and methods). Sequence changes used to calculate error rates are in Figure 1—source data 2. ***p<0.001; n.s., p>0.05. (C) Errors rates were calculated using a lacZ reversion substrate that reverts via TCT→TAT transversion. P values were calculated using chi-square tests with Yates correction. Error rates are the averages of two experiments, each conducted with independent DNA and enzyme preparations for each construct tested. ≤indicates the value is a maximal estimate as it is identical to the assay background.
-
Figure 1—source data 1
Pol ε rAAV targeting efficiencies in human HCT-116 cells.
HCT-116 cells (37.4 × 10⁶) were transduced with Pol ε rAAV and grown in the presence of 10 μg/ml G418 to select for Neor clones. Targeted clones were identified by PCR analysis.
- https://doi.org/10.7554/eLife.32692.006
-
Figure 1—source data 2
HPRT1 mutations sequenced from 6-thioguanine resistant Pol ε wt/exo- and Pol ε wt/wt HCT116 cells.
For each cell line, HPRT1 cDNA was made by RT-PCR, amplified and sequenced from independent 6-thioguanine resistant clones. Verified errors are indicated by type on the coding strand and position relative to the +1 start site. Insertion (ins) or deletion (Δ) of the indicated base(s) is denoted.
- https://doi.org/10.7554/eLife.32692.007
Figure 1—figure supplement 1
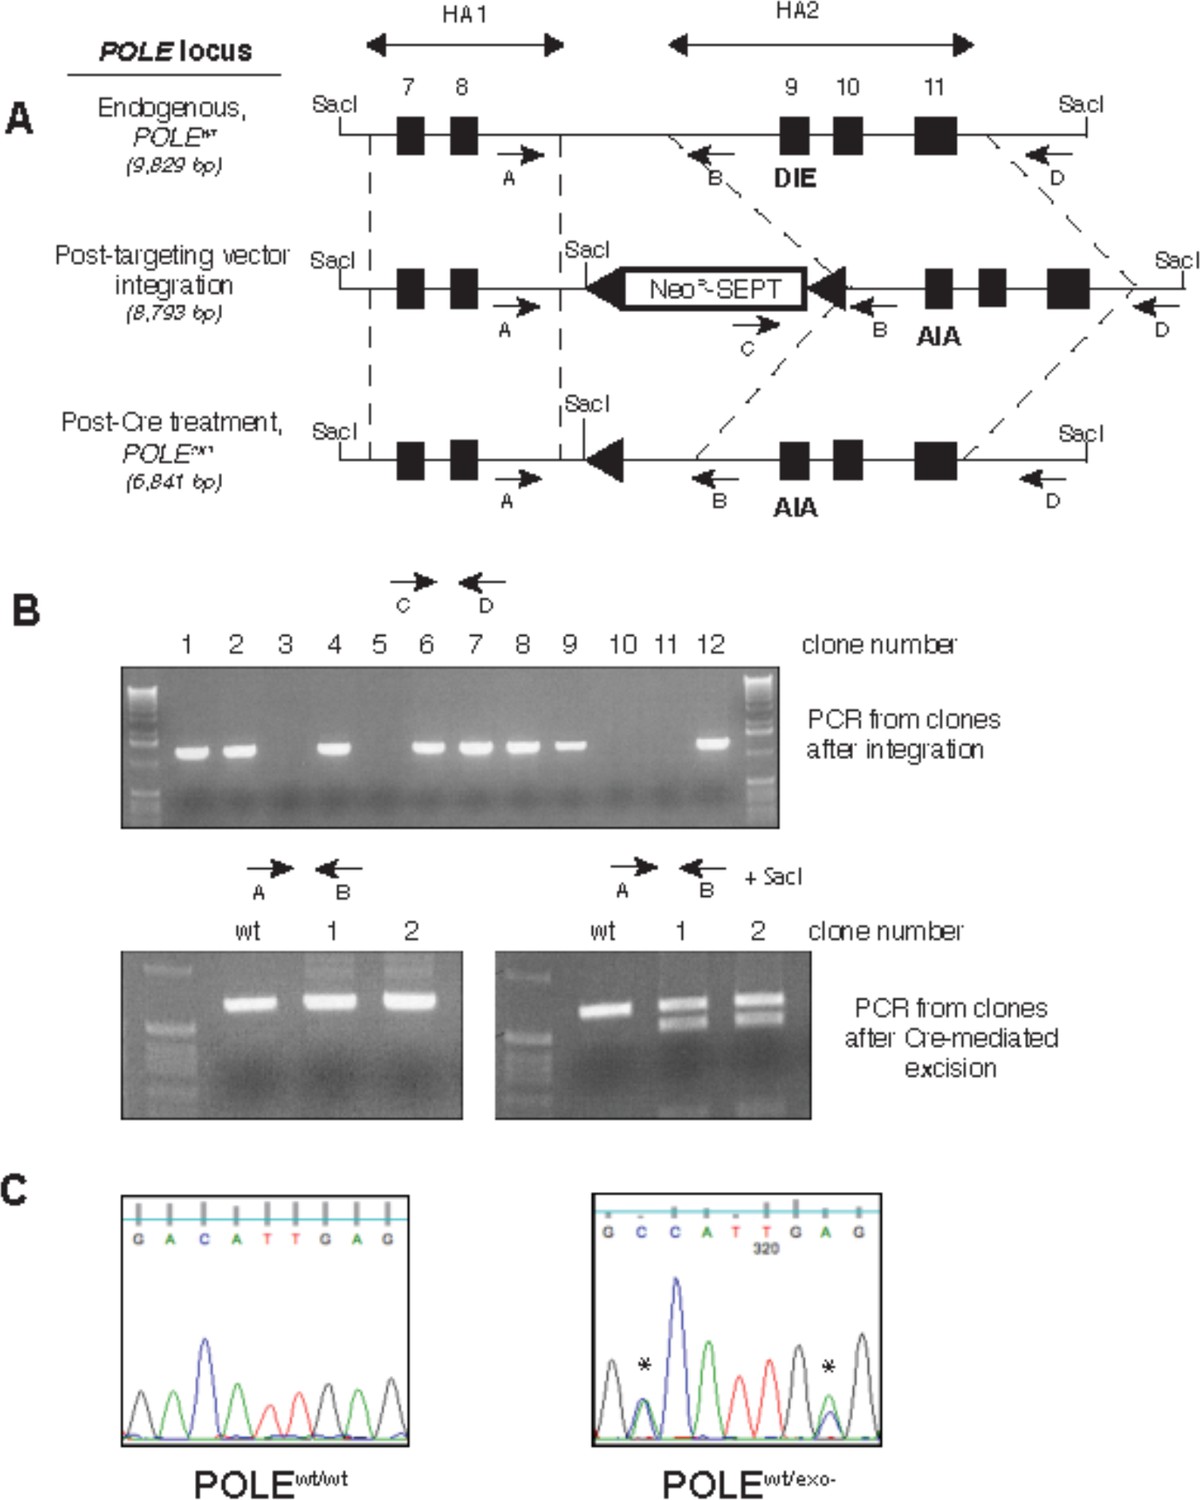
Generation of exonuclease-deficient Pol ε human cell lines by gene targeting.
(A) Gene targeting scheme to change the sequence coding for the exonuclease active site amino acid residues (DIE) at the endogenous human Pol ε locus (POLE) to DNA coding for exonuclease-inactive residues (AIA). Two regions (HA1 and HA2) of the POLE locus (dotted lines) containing exons 7 and 8 and exons 9–11 (black boxes), respectively, were amplified from HCT-116 cells and used as homology arms in rAAV construction. The rAAV created for gene targeting used a promoterless neomycin-resistance marker containing a splice acceptor site and introduced a novel SacI cleavage site into the POLE locus (Rago et al., 2007). LoxP sites (triangles) flanked the cassette, allowing for Cre-mediated cassette excision. Arrows denote PCR primers. Predicted sizes of SacI-digested fragments hybridizing to HA2-derived Southern blot probe are shown in italics. (B) The indicated primer pairs (shown on the scheme in A) were used to amplify the indicated region of genomic DNA from geneticinr (cassette integration after viral transduction, upper) and geneticins (after Cre-mediated excision, lower) clones to verify construct integration at the genomic POLE locus and subsequent excision. (C) Genomic DNA from parental HCT116 cells (POLEwt/wt) and cells where one copy of proofreading exonuclease was inactivated (POLEwt/exo-) was prepared and a region containing exon 9 was amplified by PCR and sequenced to verify gene targeting. Asterisks denote bases changed by site-directed mutagenesis.
Figure 1—figure supplement 2
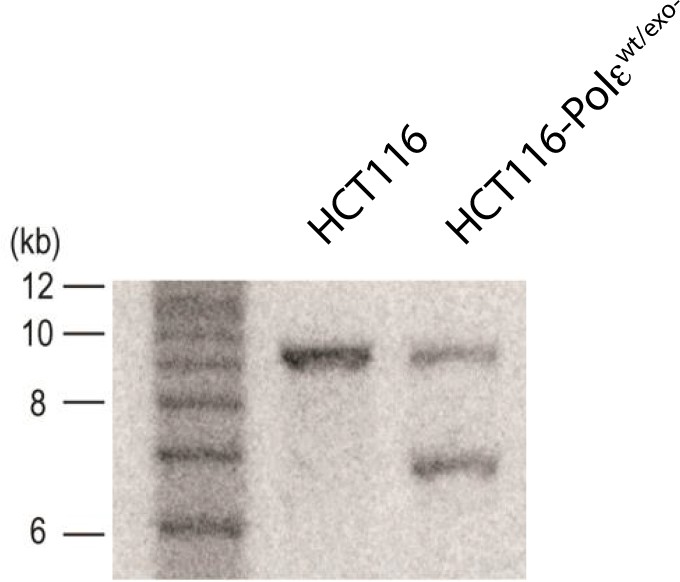
Southern blot of parental (HCT116) and knock-in clone (HCT116-Polεwt/exo-) after Cre-mediated excision.
Genomic DNA was digested with SacI and resolved on a 1% agarose gel in TBE. The DNA was transferred to Hybond N + membrane (Amersham) and blotted with probe against HA2 (shown in Figure 1—figure supplement 1). The sizes of the 1 kb ladder are shown to the left of the blot.
Figure 2 with 11 supplements
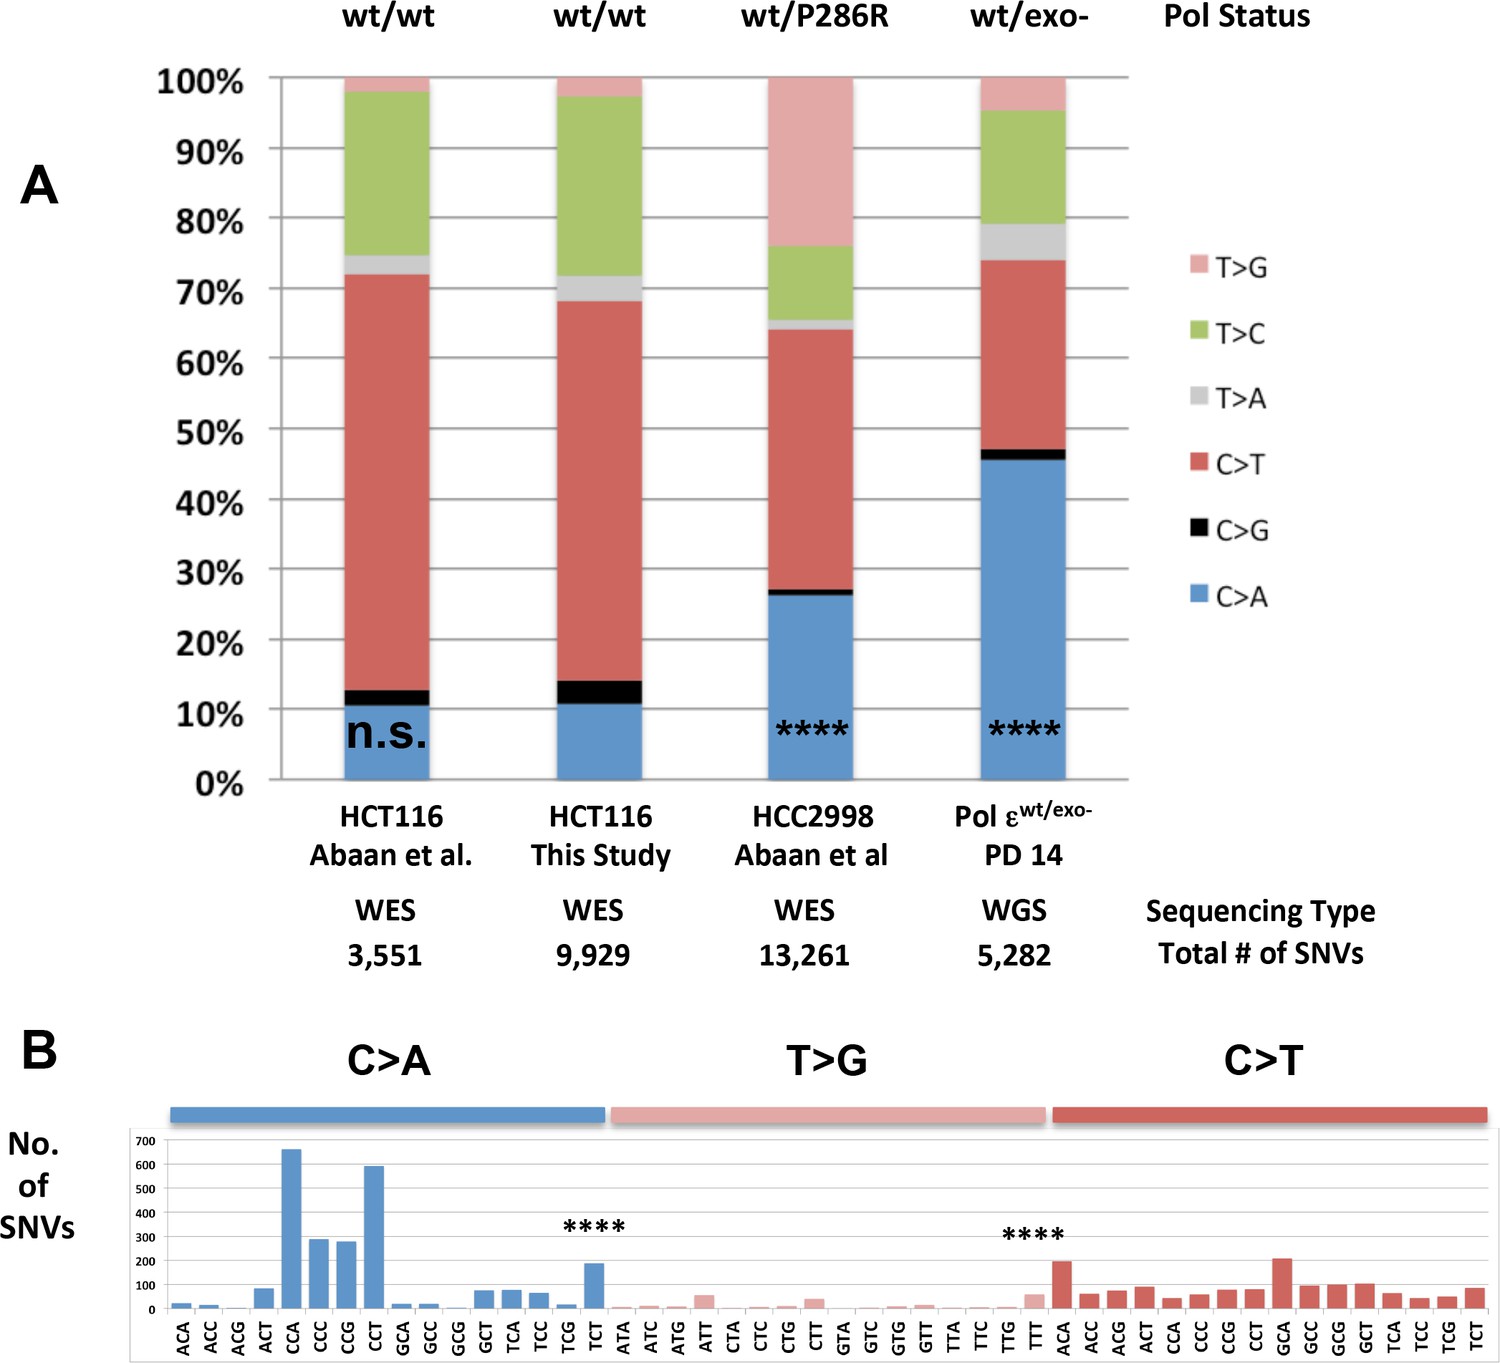
Whole-genome sequencing from defined population doubling Pol εwt/exo- mismatch repair-deficient cells.
(A) Whole genome sequencing (2.8 × 10⁹ bp, average 30X coverage) was performed on Pol εwt/exo- cells lacking mismatch repair at two defined population doubling levels, P0 and P14, as described in the Methods. P0 was used as the matched normal cells to define only those mutations arising during the 14 population doublings. The fraction of each type of base pair substitution from the PD 14 Pol εwt/exo- cells was plotted and compared to the fraction of each type of mutation from HCT116 ((Abaan et al., 2013) and this study) and HCC2998 cells (Abaan et al., 2013). Chi square tests with Yates correction were used to calculate p values relative to SNVs found in Pol εwt/wt mismatch repair-deficient cells in this study. Pol εwt/wt (Abaan et al.) χ2 = 0.033, p=0.8551; Pol εwt/P286R (Abaan et al.) χ2 = 872.341, p<0.0001; Pol εwt/exo-χ2 = 2,3680.508, p<0.0001. ****p<0.0001; n.s., not significant. (B) The number of each indicated base pair substitution in a specific trinucleotide context was plotted from the PD 14 Pol εwt/exo- mismatch repair-deficient cells. The base pair substitutions shown (C > A and T > G transversions, left; C > T transitions, right) are those found enriched in POLE tumors. Chi square tests with Yates correction were used to calculate p-values relative to SNVs found in Pol εwt/wt mismatch repair-deficient cells in this study. C > A TCT χ2 = 152.772, p<0.0001; T > G TTT χ2 = 72.254, p<0.0001. ****p<0.0001.
Figure 2—figure supplement 1
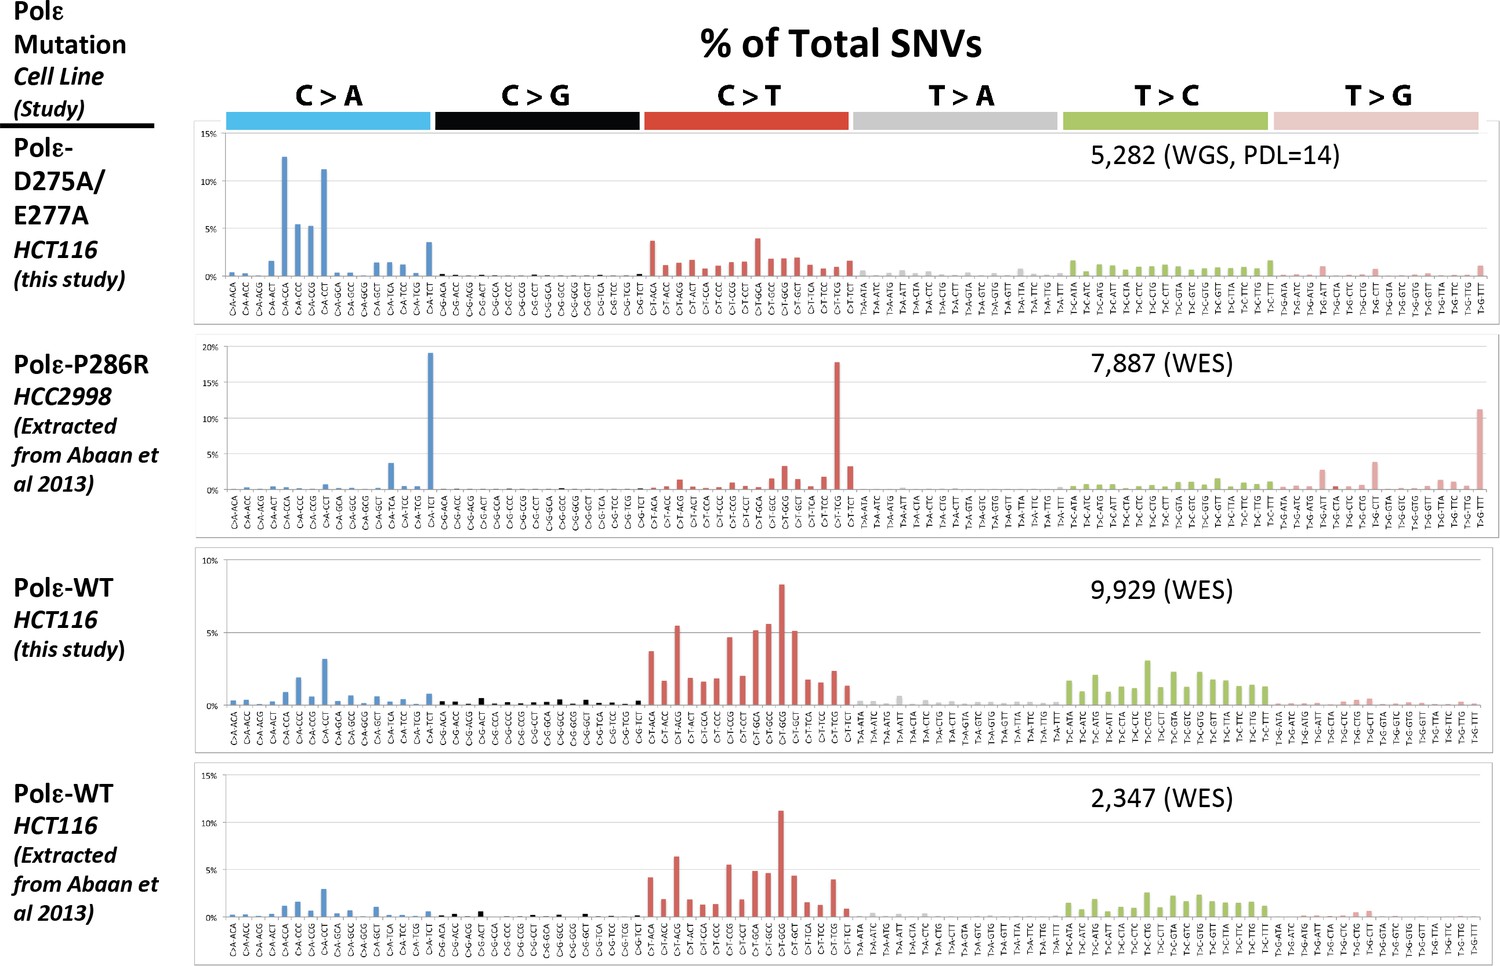
Whole genome SNVs identified in Pol εwt/exo- (PDL = 14) in cells lacking functional mismatch repair identified.
Whole exome SNVs identified in HCT116 cells in the current study, as well as from HCT116 and HCC2998 cells previously by Abaan et al. were extracted and identified. All SNVs were then analyzed for their triplet nucleotide sequence context. Occurrences of each of the 96 possible trinucleotide base pair substitutions was then plotted as a percentage of the total number of SNVs. The mutation status of Pol ε is indicated for each cell line. The number of SNVs for each study is indicated.
Figure 2—figure supplement 2
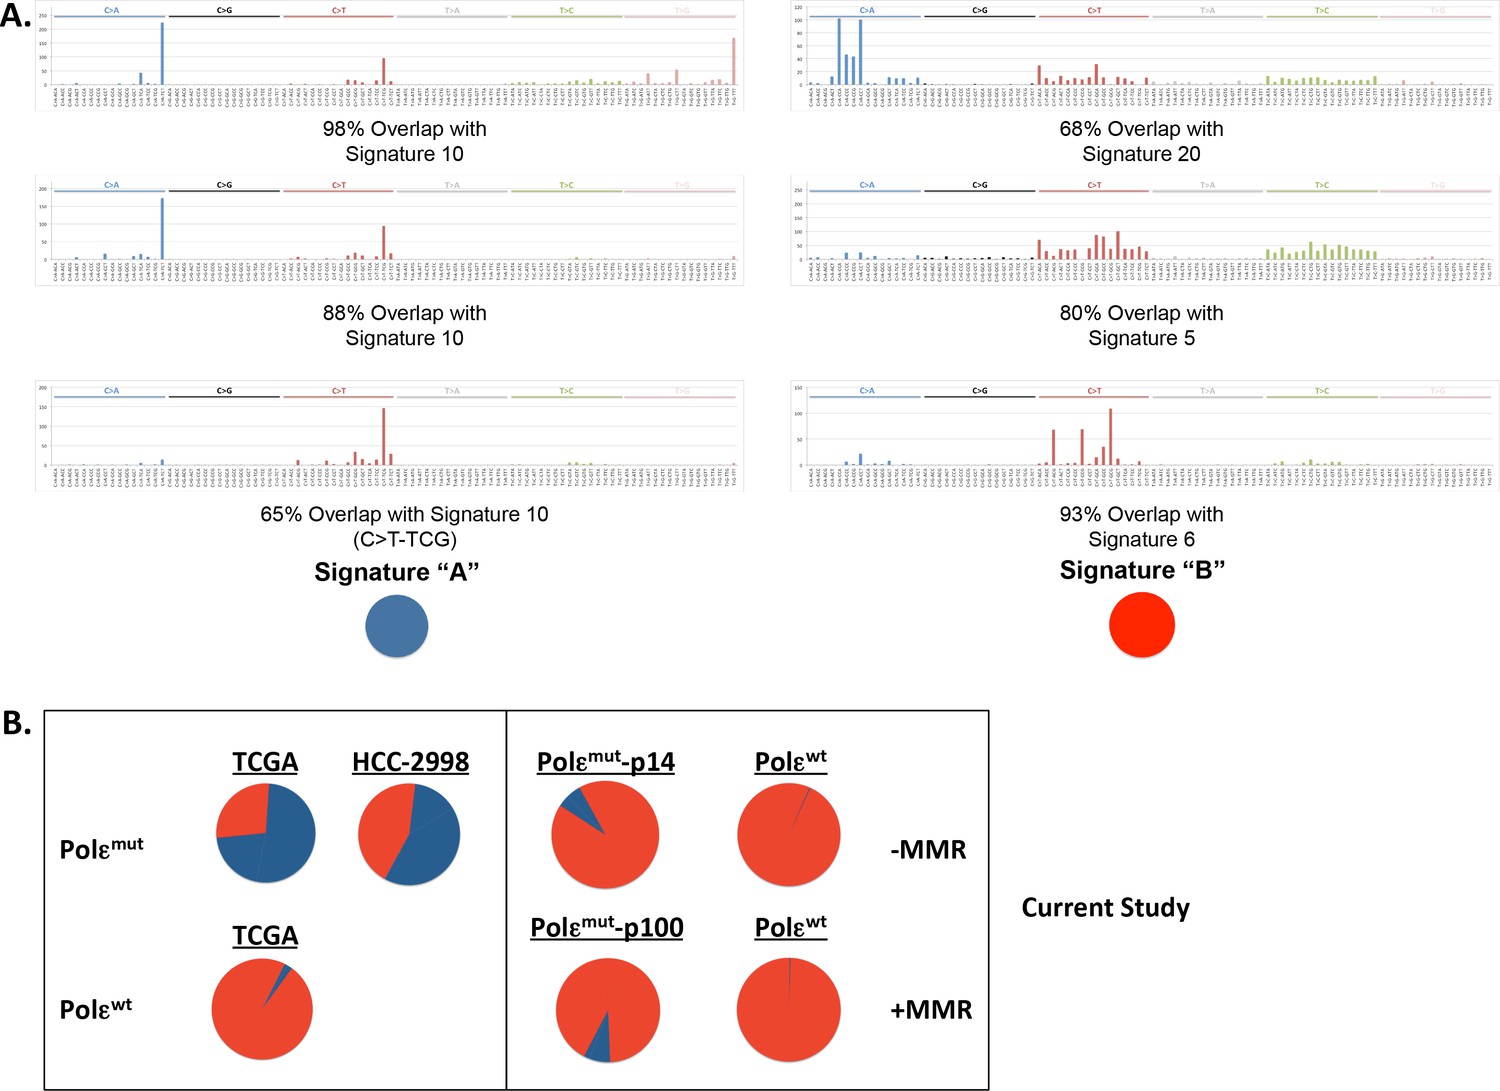
POLE mutation signature extracted from POLE-mutant cell lines.
(A) Non negative matrix factorization (NMF) was used to extract six unique mutation signatures from POLE-mutant (n = 14) and POLE-wild type (n = 545) colorectal cancer patients, Pol ε-P286R HCC2998 cells (SNVs extracted from Abaan, Cancer Res. 2013) and the indicated cell lines with and without MMR from the current study. Cosine similarity to all 30 cancer mutational signatures (Alexandrov, Cell Reports 2013) showed significant overlap between our Signature ‘A’ set and mutation signature 10 (ascribed to Pol ε mutations) and 98% overlap between between our Signature ‘B’ and mutation signatures 5, 6 and 20 (ascribed to MMR mutations). (B) The relative contribution of each extracted mutation signature to the total mutations in the indicated sample was calculated. Signatures and their respective contributions to each sample were derived using NMF. NMF was performed on all samples together (including cell lines and patients) using the Scikit-learn Python library (Pedregosa et al., Jrnl Machine Research Learning 2011.).
Figure 2—figure supplement 3
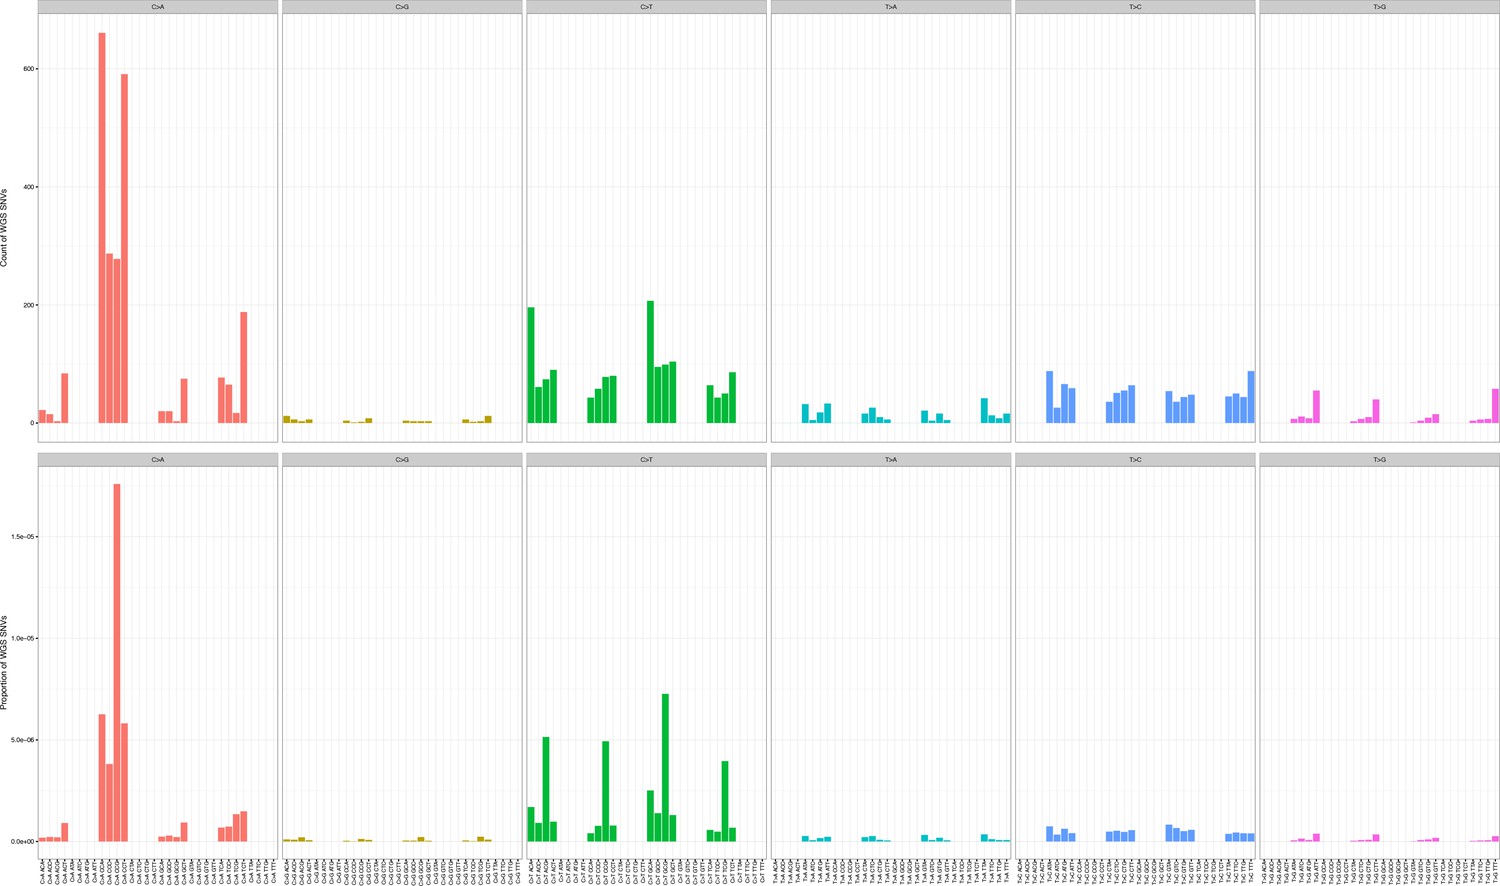
Mutation counts in the indicated trinucleotide context (top) were plotted as a proportion of their occurrence (bottom) in WGS samples.
https://doi.org/10.7554/eLife.32692.011
Figure 2—figure supplement 4
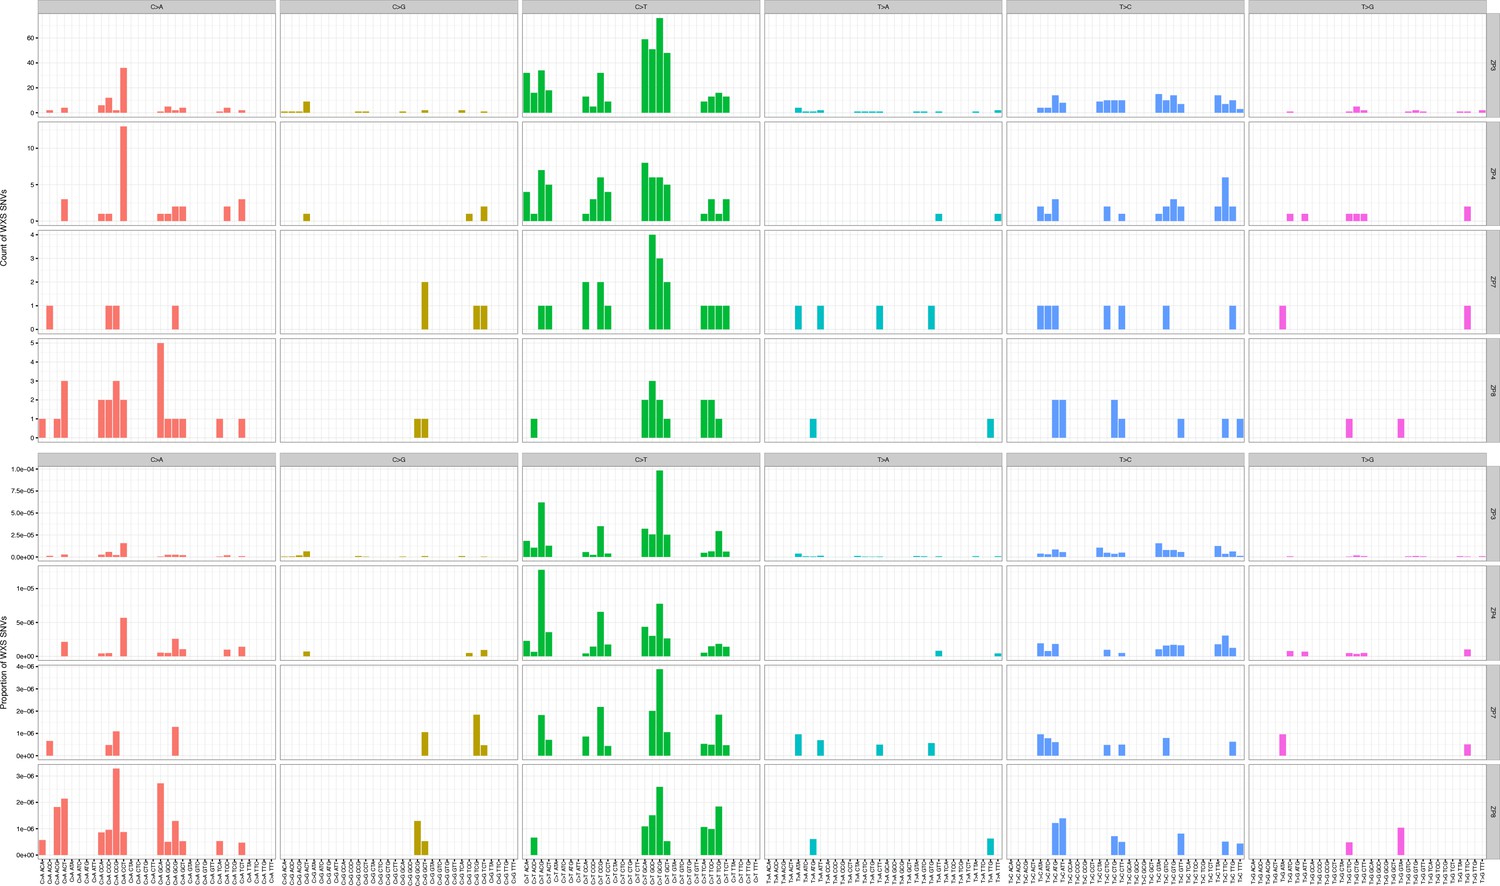
Mutation counts in the indicated trinucleotide context (top) were plotted as a proportion of their occurrence (bottom) in WES samples.
https://doi.org/10.7554/eLife.32692.012
Figure 2—figure supplement 5
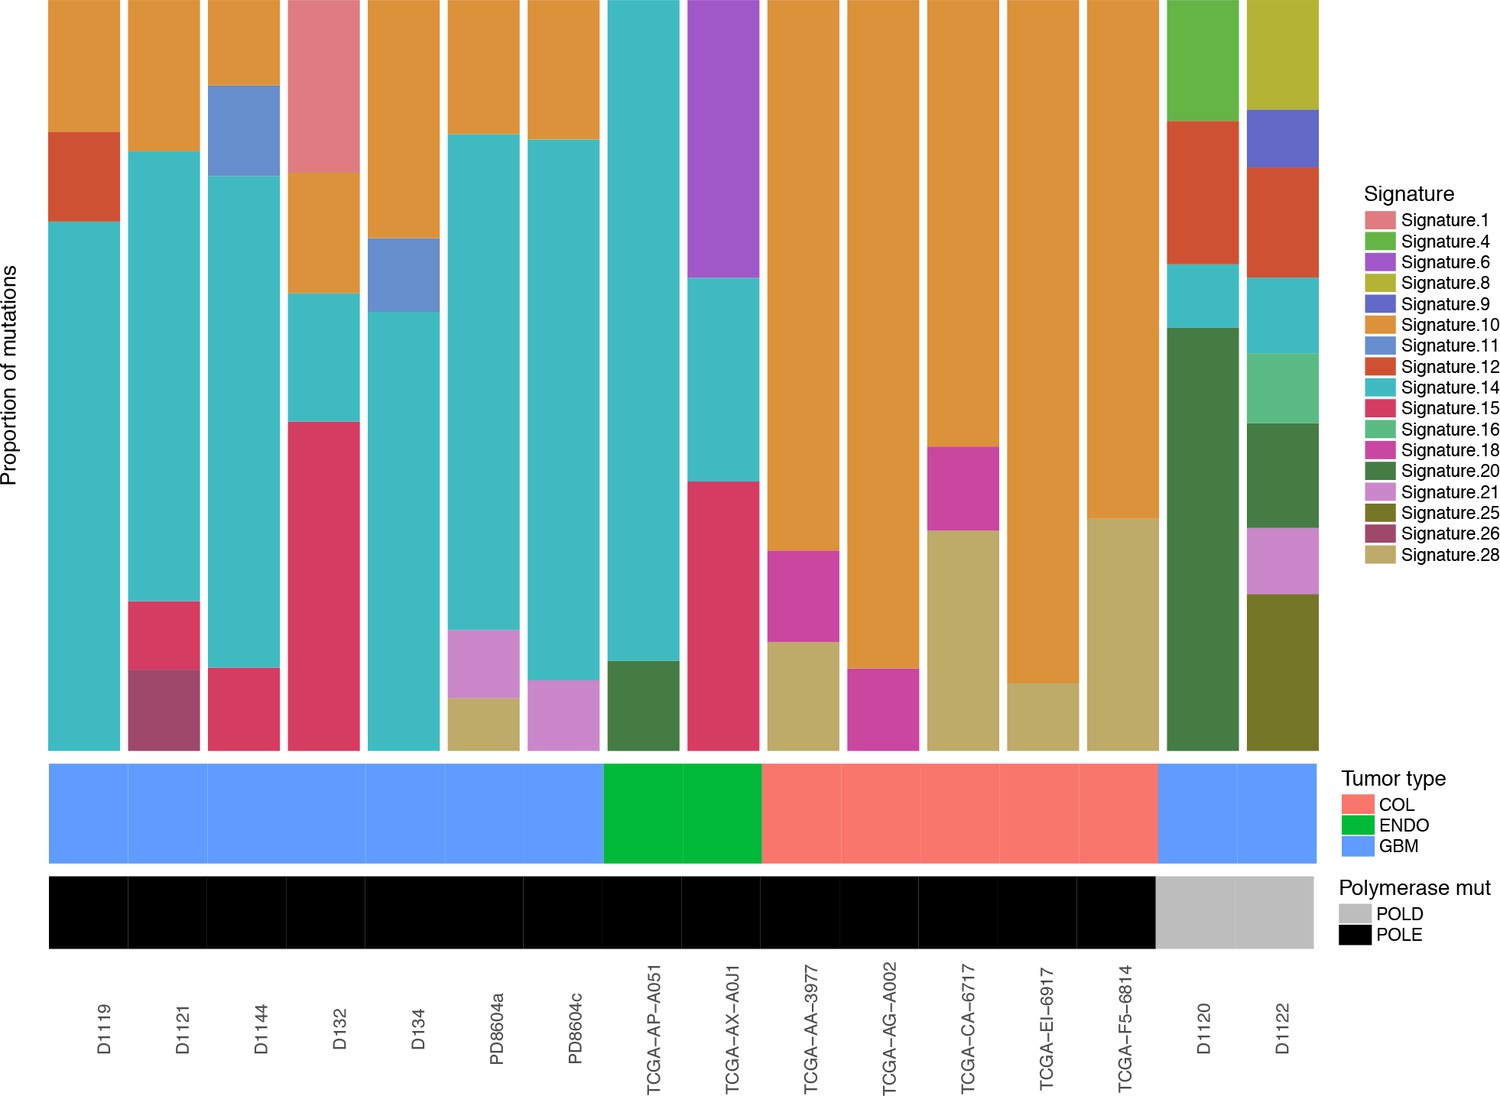
Relative contributions of Cosmic Mutation Signatures to individual patient mutation spectra were determined using deconstructSig.
The relative proportion of each signature is shown for several tumor types (bMMRD, blue; somatic endometrial, green; somatic colorectal, salmon) and for Pol ε (black) and Pol δ (gray) mutations.
Figure 2—figure supplement 6
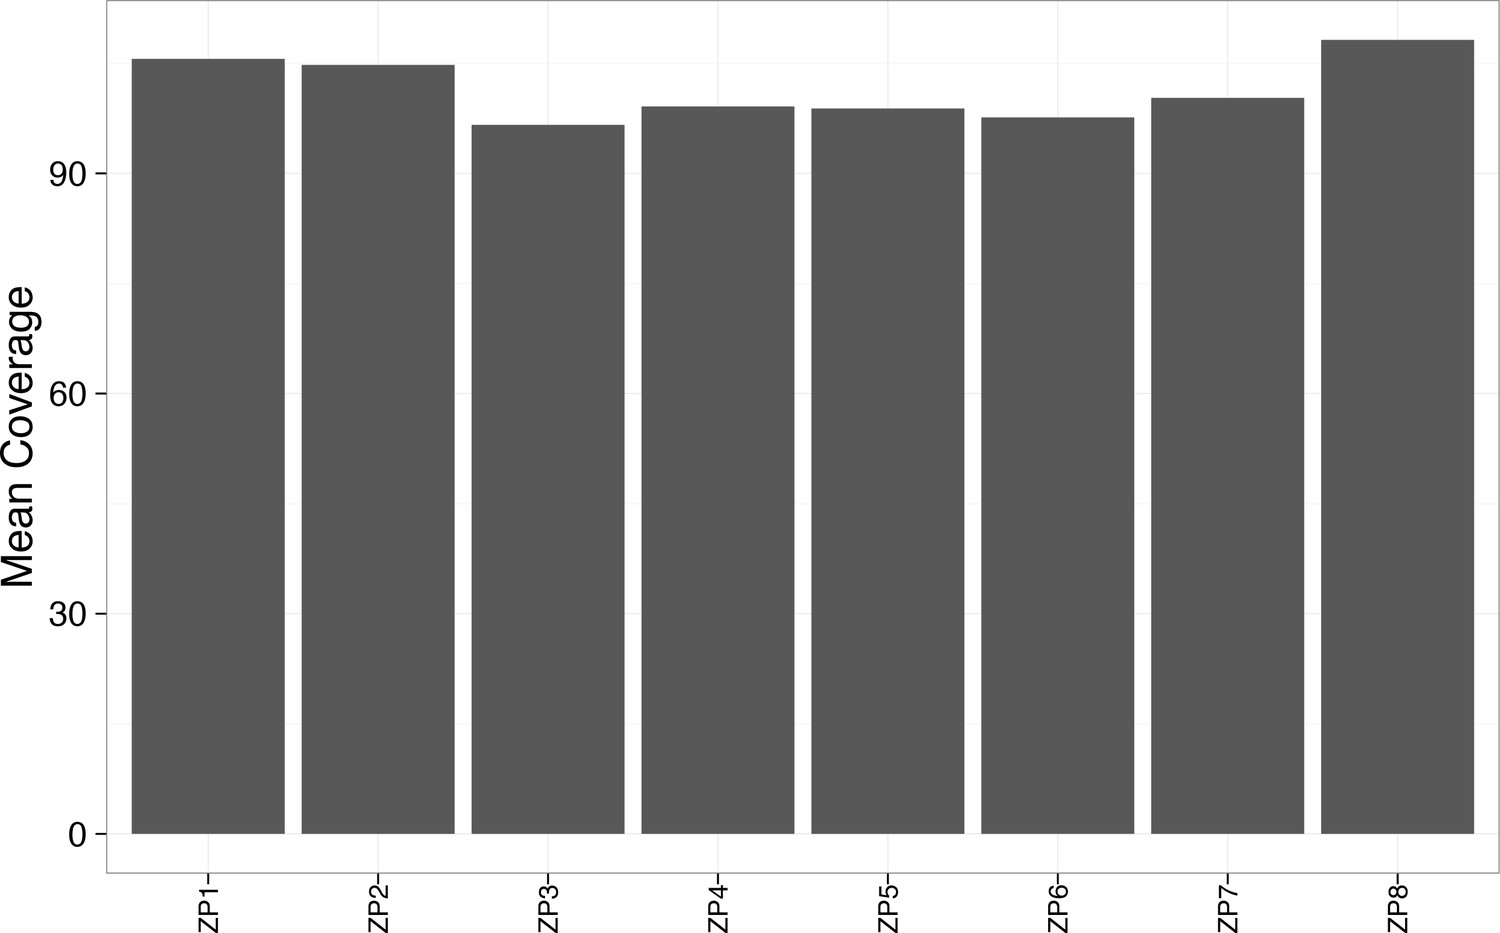
Mean coverage was greater than 90x for each WES sample.
https://doi.org/10.7554/eLife.32692.014
Figure 2—figure supplement 7
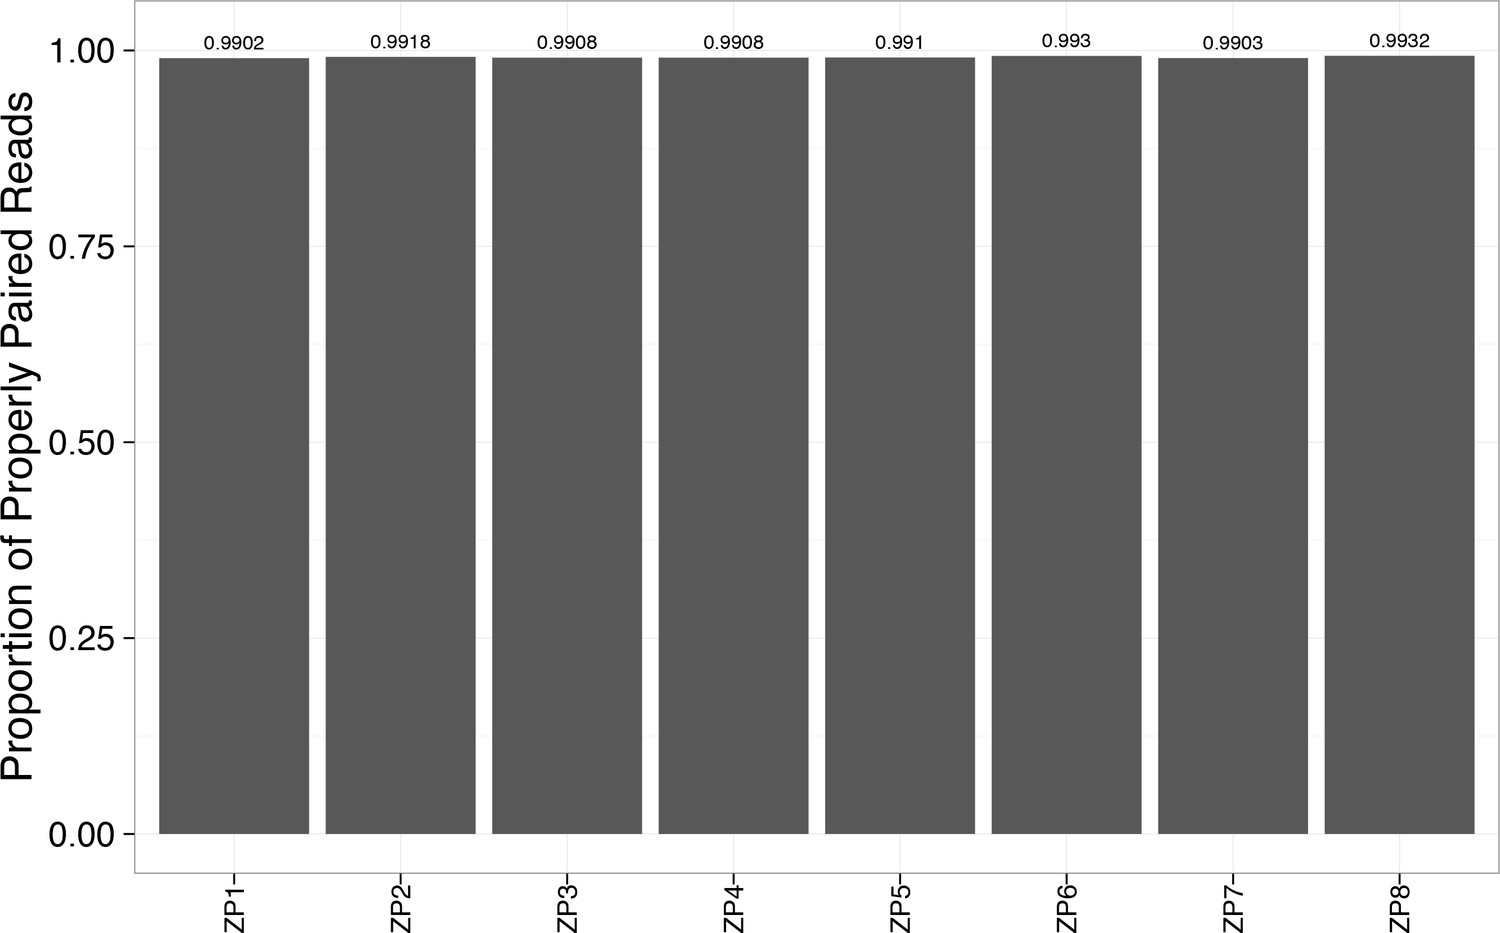
Alignment rate to the reference genome exceeded 99% for each WES sample.
https://doi.org/10.7554/eLife.32692.015
Figure 2—figure supplement 8
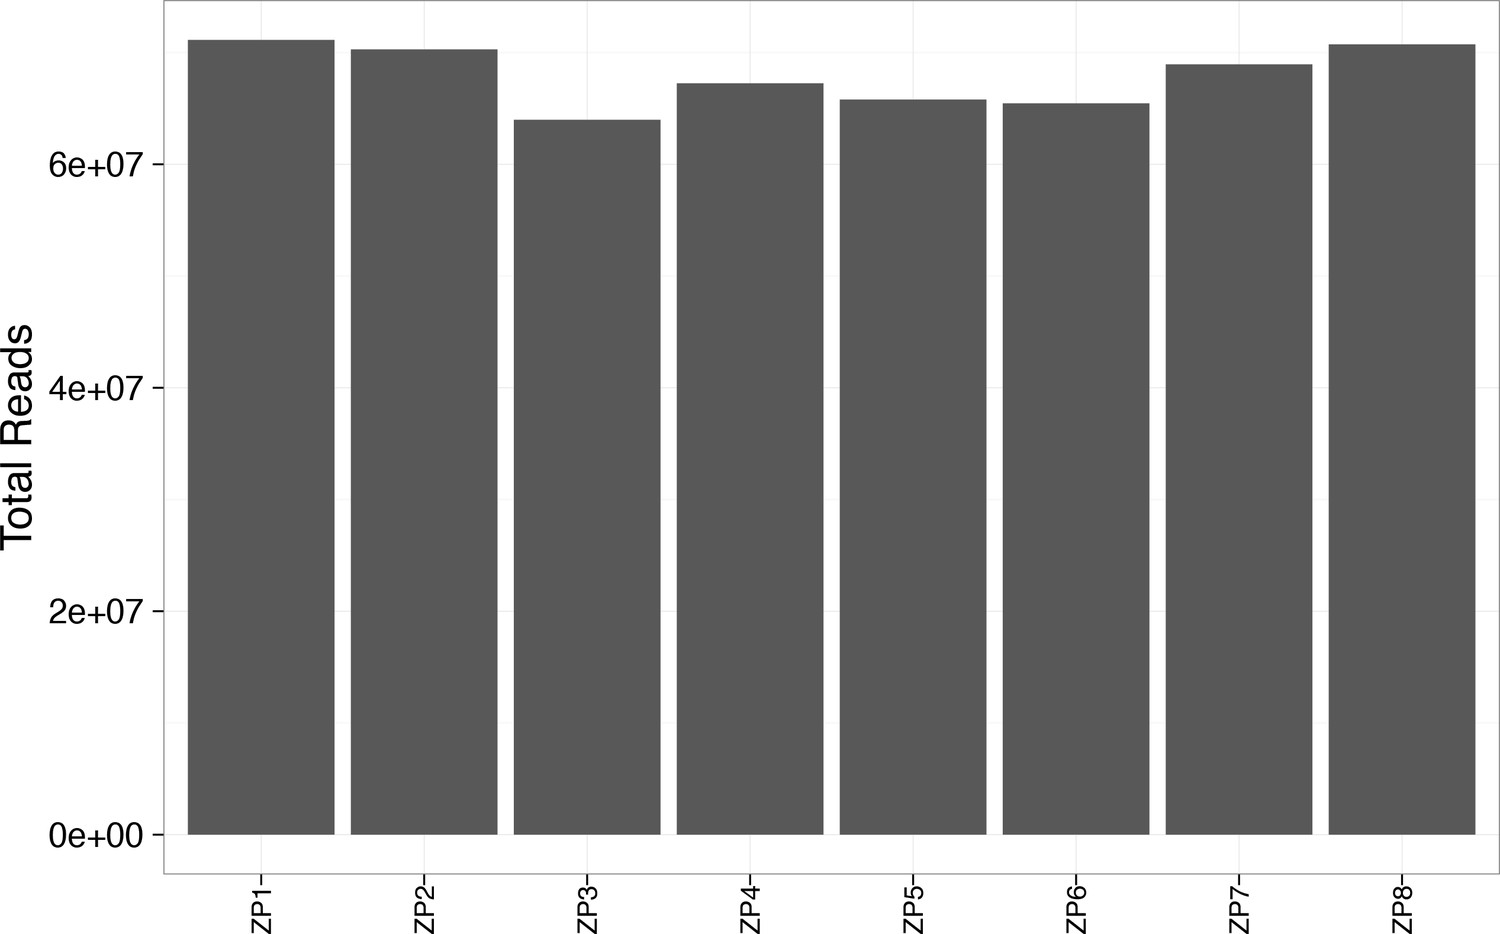
Total reads exceeded 60 million for each WES sample.
https://doi.org/10.7554/eLife.32692.016
Figure 2—figure supplement 9
Greater than 90% of the bases in the WES genome exceeded 30x coverage.
https://doi.org/10.7554/eLife.32692.017
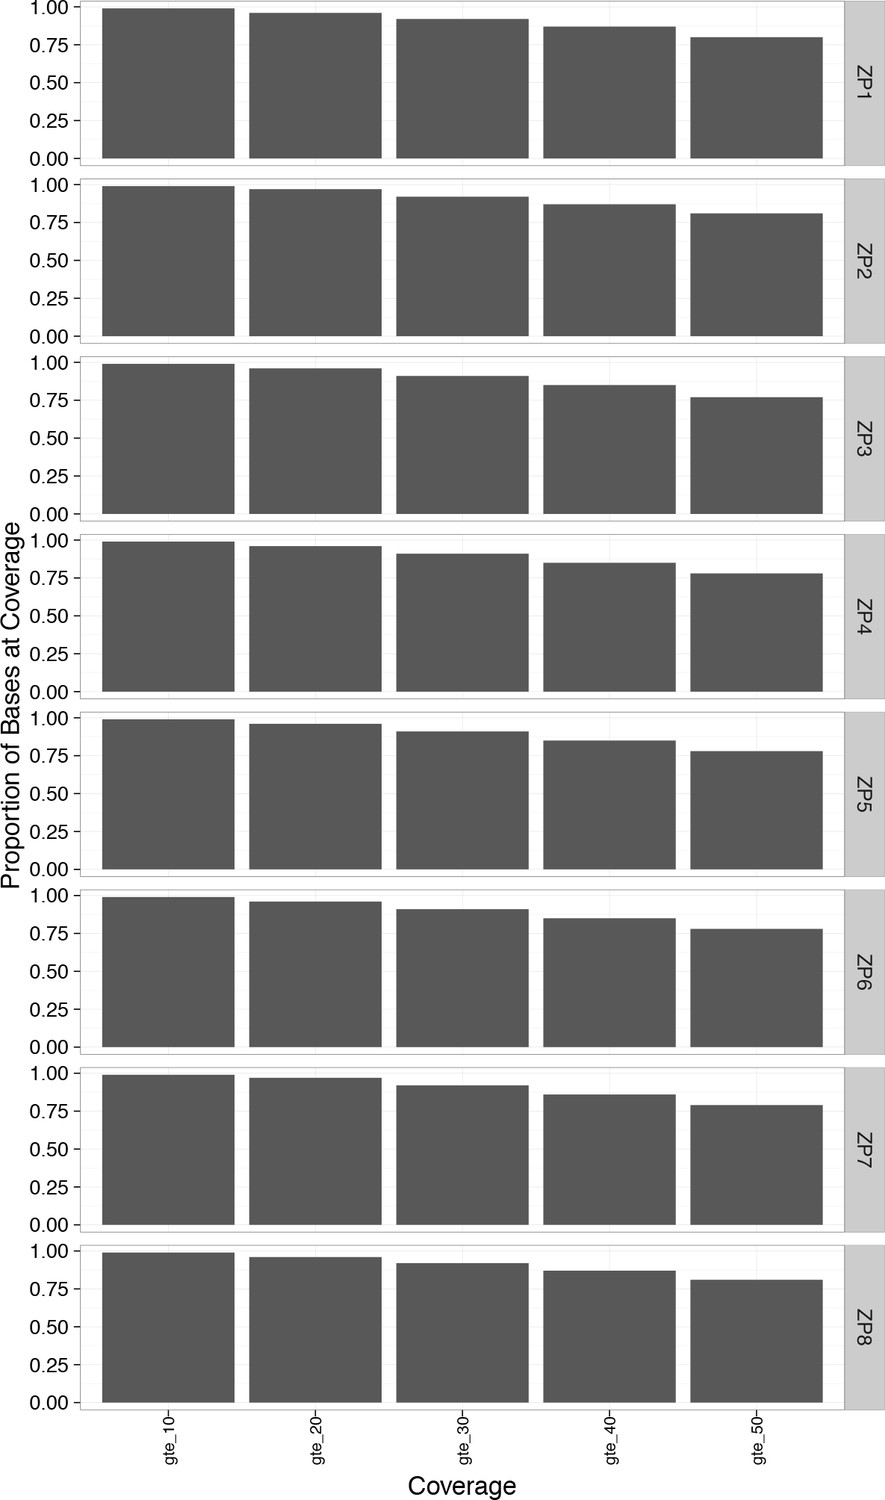
Figure 2—figure supplement 10

Greater than 85% of the bases in the WGS genome exceeded 20x coverage.
https://doi.org/10.7554/eLife.32692.018
Figure 2—figure supplement 11
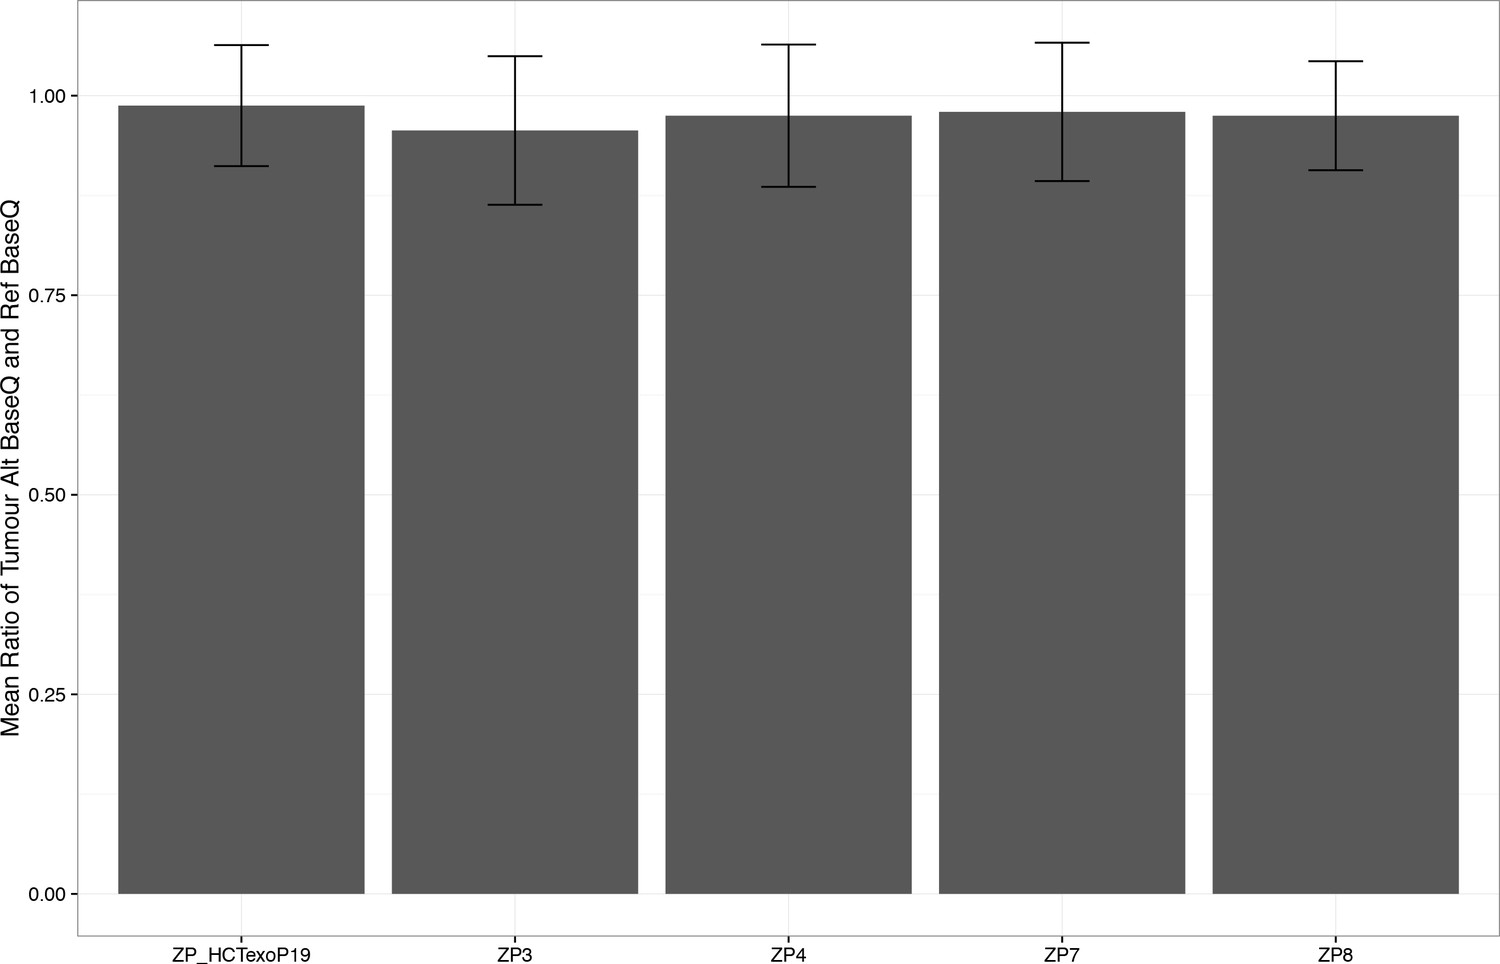
Average alternate base quality to reference base quality of ~1.0.
https://doi.org/10.7554/eLife.32692.019
Figure 3
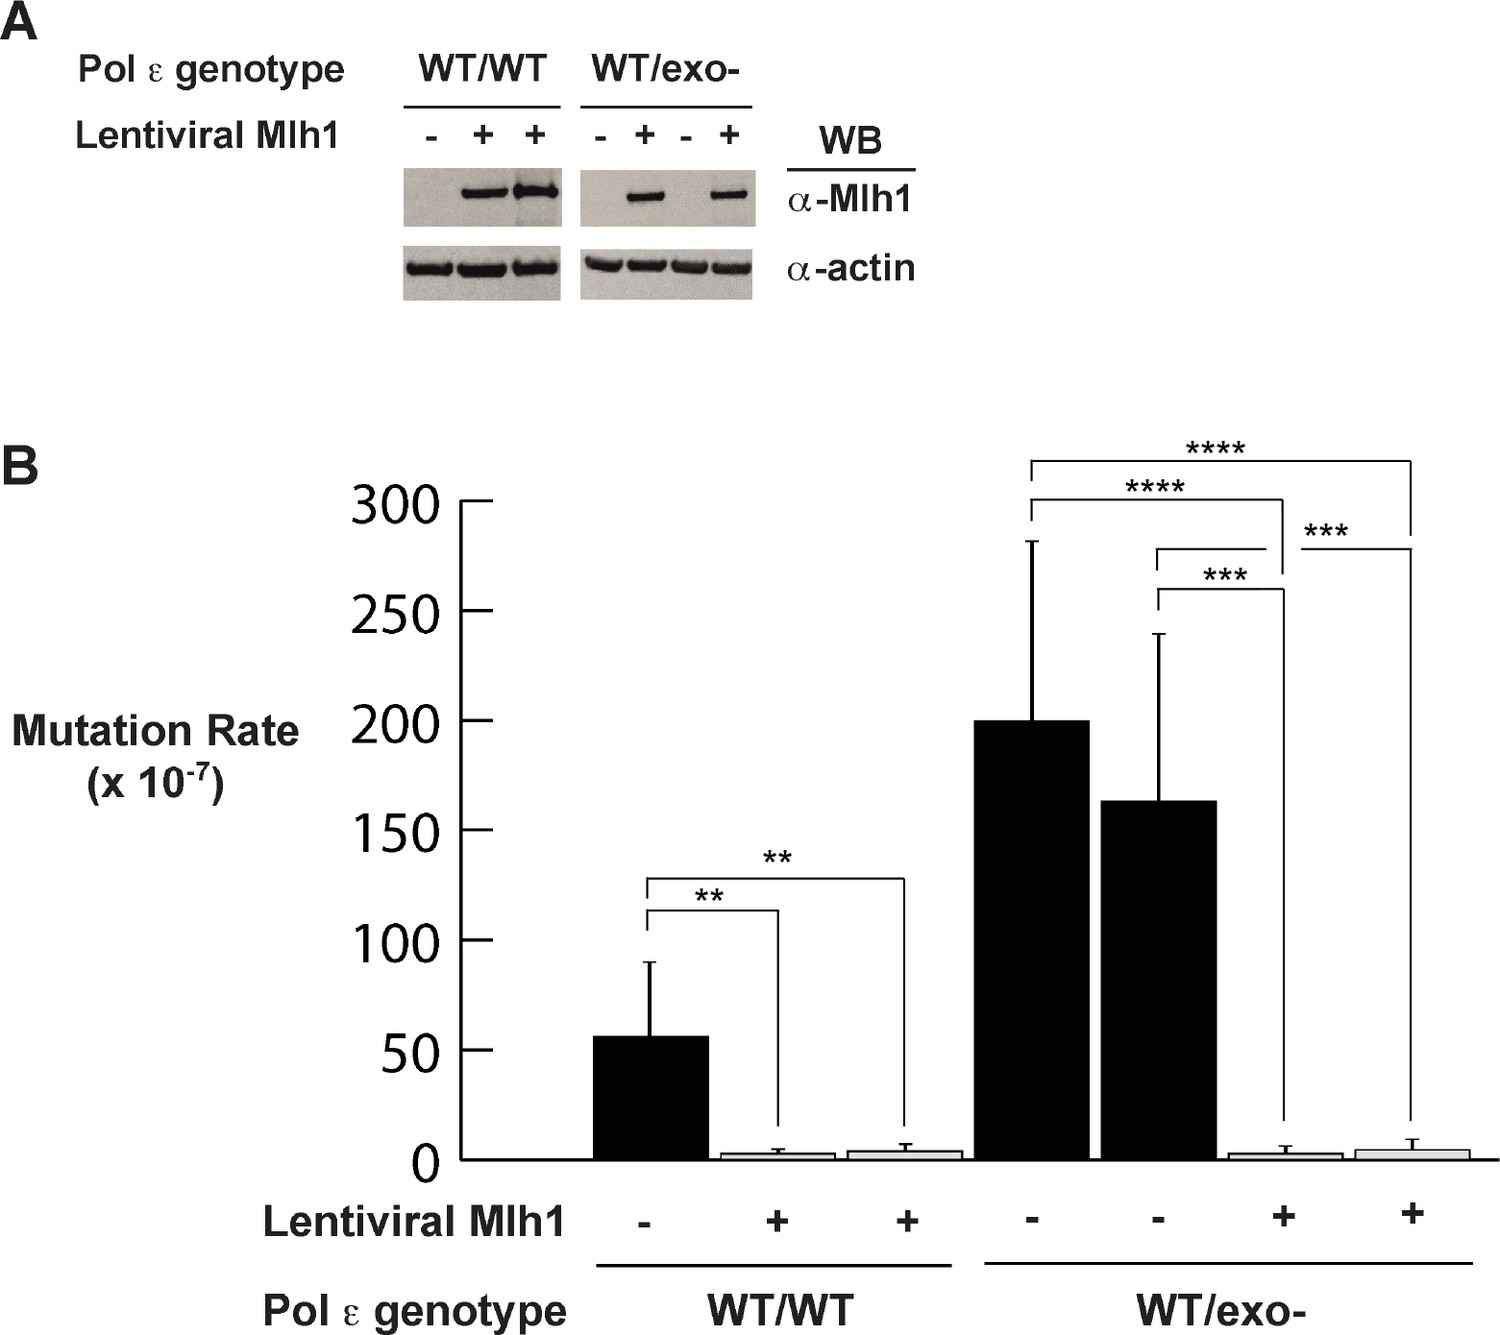
Mismatch repair suppresses exonuclease-deficient Pol ε-induced mutation rate increase.
(A) Lentivirus encoding human Mlh1 was generated and used to infect parental cells with wild type Pol ε and cells heterozygous for Pol ε exonuclease deficiency. Cell lysates were probed by Western blot using antibodies against Mlh1 and β-actin. (B) Mutation rates were measured by fluctuation analysis as described in the Methods using the Ma-Sandri-Sarkar Maximum Likelihood Estimator. Twelve independent isolates from each of two parental (wt/wt) and two heterozygous cell lines (wt/exo-) expressing Mlh1 were used. 95% confidence intervals are shown. Pol εwt/wt Mlh1+ Clone 1 Mutation Rate = 1.7 × 10⁻⁷, SEM = 0.72 × 10⁻⁷, p=0. 0046. Pol εwt/wt Mlh1+ Clone 2 Mutation Rate = 2.5 × 10⁻⁷, SEM = 1.1 × 10⁻⁷, p=0.0053. Pol εwt/exo- Mlh1+ Clone 1 Mutation Rate = 2.3 × 10⁻⁷, SEM = 0.81 × 10⁻⁷, p<0.0001 (vs. Pol εwt/exo- Mlh1- Clone 1) and p=0.0003 (vs. Pol εwt/exo- Mlh1- Clone 2). Pol εwt/exo- Mlh1+ Clone 2 Mutation Rate = 3 × 10⁻⁷, SEM = 1.3 × 10⁻⁷, p<0.0001 (vs. Pol εwt/exo- Mlh1- Clone 1) and p=0.0003 (vs. Pol εwt/exo- Mlh1- Clone 2). Mutation Rates for Pol εwt/exo- Mlh1+ Clone 1 and Clone 2 were not significantly different (p=0.6485). Mutation rates from cells lacking mismatch repair (from Figure 1A) are shown for comparison.
Figure 4 with 1 supplement

Mismatch repair suppresses the majority of exonuclease-deficient Pol ε mutation specificity.
(A) Cells were continuously passaged and PDL was calculated using the following equation: PDL = [ln(Nt)-ln(N0*PE)]/ln2. Nt = Number of viable cells counted after passage; N0 = Number of cells seeded prior to passage; PE = plating efficiency. Mutant frequencies were measured for each mismatch repair proficient strain at the indicated PDL (diamonds, Pol εwt/wt; triangles, Pol εwt/exo-). Ten plates for each cell lines were seeded with 2 × 10⁵ cells at each PDL into media containing 6-TG and grown for 12–14 days. Each 6TG-resistant clone was isolated, expanded and the HPRT1 ORF was sequenced. Mutant frequencies were calculated based on the number of unique HPRT1 mutations at each PDL. Pol εwt/wt PDL6.4 MF = 1.8 × 10⁻⁶, SEM = 2.7 × 10⁻⁶, n = 4; Pol εwt/exo- PDL6.6 MF = 4.1 × 10⁻⁶, SEM = 3.1 × 10⁻⁶, n = 3, p=0.6003. Pol εwt/wt PDL44.6 MF = 1.1 × 10⁻⁶, SEM = 2.3 × 10⁻⁶, n = 2; Pol εwt/exo- PDL47.9 MF = 3.2 × 10⁻⁶, SEM = 4.7 × 10⁻⁶, n = 8, p=0.9066. Pol εwt/wt PDL69 MF = 1.5 × 10⁻⁶, SEM = 1.6 × 10⁻⁶, n = 5; Pol εwt/exo- PDL71 MF = 3.7 × 10⁻⁶, SEM = 2.6 × 10⁻⁶, n = 5, p=0.4917. (B) Whole exome sequencing (30 × 106 bp, average 101x coverage) was performed on the indicated cell line at two defined population doubling levels, P0 and P69 or P71, as described in the Methods. P0 for each cell line was used as the matched normal cells to define only those mutations arising during the 70 or 71 population doublings. The fraction of each type of base pair substitution found unique to PDL 69 (for Pol εwt/wt) or PDL 71 (Pol εwt/exo-) was plotted and compared. Fisher’s exact tests were used to calculate p values. p=0.0002 (***p<0.001).
-
Figure 4—source data 1
HPRT1 mutations sequenced from mismatch repair-proficient cells.
The HPRT1 ORF was sequenced from individual HPRT1-resistant clones at the indicated PDL as described (Figure 4A and Materials and methods). One clone was unable to be sequenced (n.d.).
- https://doi.org/10.7554/eLife.32692.023
-
Figure 4—source data 2
Pol ε mutation spectra calculation of cosine similarity to cancer mutation spectra.
Cosine similarities were calculated between the six unique mutation signatures extracted from POLE tumors and Pol ε mutant cell lines (columns, from Figure 2—figure supplement 2A) and each of the 30 identified Cosmic mutation signatures (http://cancer.sanger.ac.uk/cancergenome/assets/signatures_probabilities.txt).
- https://doi.org/10.7554/eLife.32692.024
Figure 4—figure supplement 1
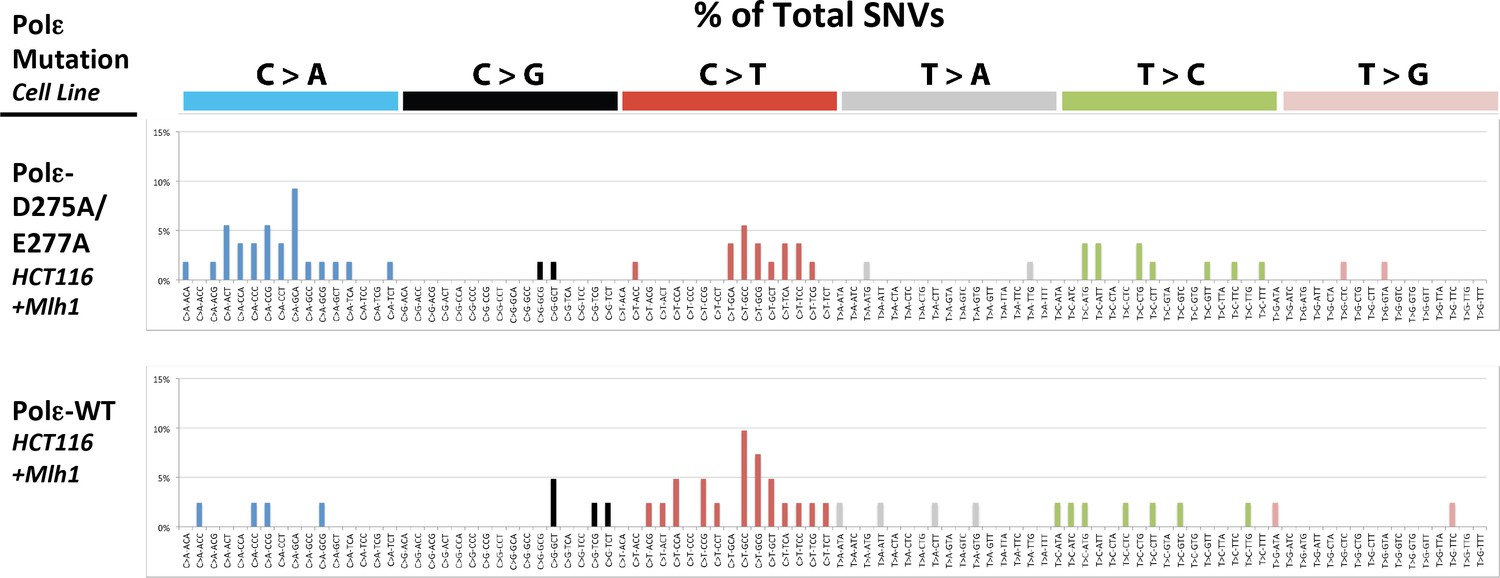
Whole exome SNVs identified in Pol εwt/exo- (PDL = 71) and Pol εwt/wt (PDL = 70) cells expressing Mlh1 were analyzed for their triplet nucleotide sequence context.
Occurrences of each of the 96 possible trinucleotide base pair substitutions was then plotted as a percentage of the total number of SNVs.
Figure 5 with 1 supplement
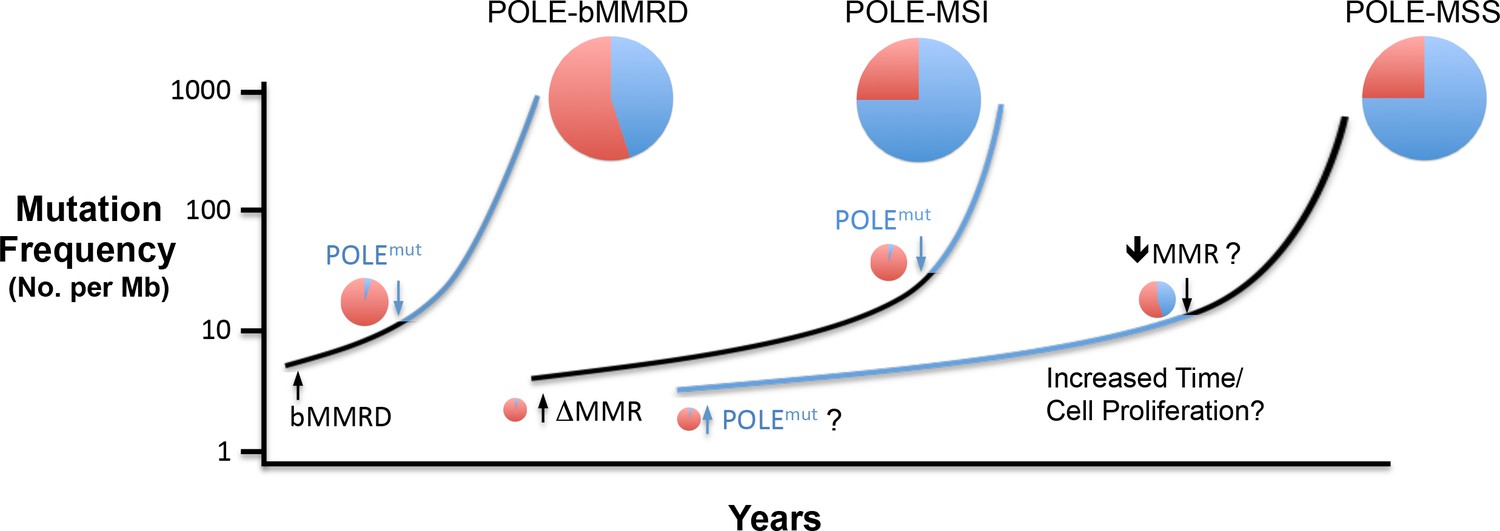
Model for Pol ε-dependent tumor mutation signature development.
Rapid, massive mutation accumulation and Pol ε mutation signature acquisition (blue circles) depends on both Pol ε exonuclease domain mutation and compromised mismatch repair function. In somatic tumors, the partial MSI phenotype seen in a subset of POLE patients is likely the result of mismatch repair loss preceding Pol ε mutation (black line), leading to an accumulation of Pol ε-independent mutations (red circles). Mutations in bMMRD patients develop with similar mutation patterns, but accelerated timing due to germline loss of mismatch repair. When the Pol ε mutation occurs first during somatic tumor development, the mutation signature likely requires an additional characteristic for the explosive mutation acquisition to occur (blue line). Possibilities include subsequent suppression of mismatch repair (↓MMR?), unique biochemical properties (POLEmut?) or increased time and or cellular proliferation.
Figure 5—figure supplement 1
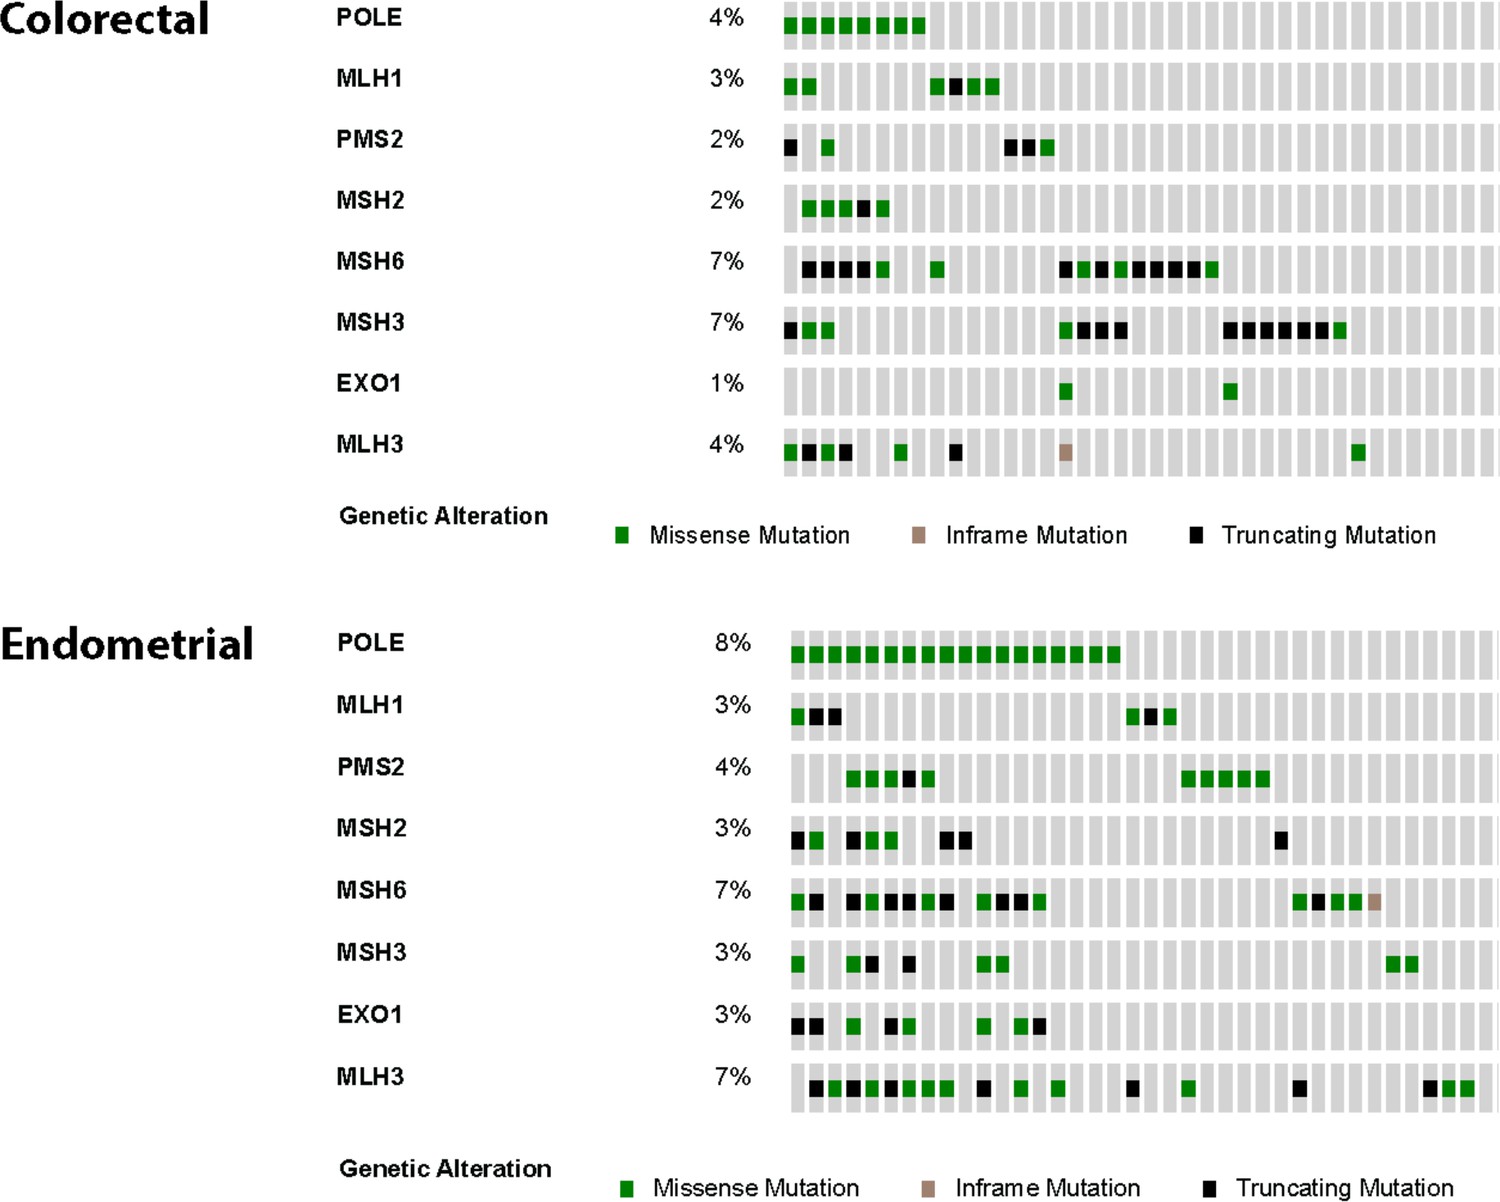
Oncoprints were made using cBioPortal for colorectal (n = 8) and endometrial (n = 18) tumors from the TCGA studies containing Pol ε exonuclease domain mutations.
Also shown are mutations in canonical and associated mismatch repair genes. Missense (green), nonsense (black) and inframe deletion or insertion (tan) mutations are shown. Each column represents an individual patient tumor.
Tables
Key resources table
| Reagent type (species) or resource | Designation | Source or reference | Identifiers | Additional information |
|---|---|---|---|---|
| cell line (Homo sapiens, Male) | HCT116 cells | Other | RRID:CVCL_0291 | Prescott Deininger at Tulane Univeristy LCRC |
| cell line (H. sapiens, Male) | HCT116 + Mlh1 | This paper | NA | HCT116 cells stably expressing human Mlh1-ORF via lentivirus-mediated integration |
| cell line (H. sapiens, Male) | Exo-; Exonuclease-deficient HCT116 Cells | This paper | NA | HCT116 cells infected with rAAV containing D275A and E277A POLE mutations |
| cell line (H. sapiens, Male) | Exo-; Exonuclease-deficient HCT116 Cells + Mlh1 | This paper | NA | HCT116 cells stably expressing human Mlh1-ORF via lentivirus- mediated integration and infected with rAAV containing D275A and E277A POLE mutations |
| recombinant DNA reagent | ExoI-targeting rAAV vector | This paper | NA | Homology arms/SEPT Cassette/Exo- mutations |
| recombinant DNA reagent | pCMV-XL5-Mlh1 | Other | NA | Victoria Belancio at Tulane Univeristy LCRC |
| antibody | Mlh1 Antibody | Pharmingen | G168-728; RRID: AB_395227 | Rabbit monoclonal; (1:100) in Milk (1%) TBST (1X) x 1 hr at RT |
| chemical compound, drug | 6-Thioguanine; 6-TG | Sigma-Aldrich | A4882 | Used at 5 ug/mL final concentration |
| chemical compound, drug | Hypoxanthine-Aminopterin- Thymidine; HAT | Thermo Fisher Scientific | 21060017 | Used at 1X final concentration |
| chemical compound, drug | Geneticin; G418 | Thermo Fisher Scientific | 10131027 | Used at 400 ug/mL final concentration |
| other | Ad-CMV-Cre | Vector Biolabs | 1045 | Adenovirus expressing Cre recombinase for excision of SEPT cassette from ExoI-targeted cell lines |
| software, algorithm | BWA-MEM v0.7.8 | PMID: 19451168 | NA | Used to align reads to human reference |
| software, algorithm | Picard v1.108 | Broad Institute; https://broadinstitute.github.io/picard/. | NA | Identify duplicate reads |
| software, algorithm | The Genome Analysis Toolkit (GATK) v2.8.1 | PMCID: PMC2928508 | NA | locally realign reads to known indels and recalibrate base quality scores |
| software, algorithm | MuTect v1.1.4 | PMCID: PMC3833702 | NA | Identiy somatic point mutations between the tumour and matched normal |
| other | WES/WGS raw sequencing data | This paper | NCBI GEO Accession: PRJNA327240 | Raw FASTQ files for WES and WGS performed in this study |
Additional files
-
Transparent reporting form
- https://doi.org/10.7554/eLife.32692.027
Download links
A two-part list of links to download the article, or parts of the article, in various formats.
Downloads (link to download the article as PDF)
Open citations (links to open the citations from this article in various online reference manager services)
Cite this article (links to download the citations from this article in formats compatible with various reference manager tools)
Explosive mutation accumulation triggered by heterozygous human Pol ε proofreading-deficiency is driven by suppression of mismatch repair
eLife 7:e32692.
https://doi.org/10.7554/eLife.32692


