Codon choice directs constitutive mRNA levels in trypanosomes
- University of Cambridge, United Kingdom
- University of Oxford, United Kingdom
Figures
Figure 1 with 1 supplement
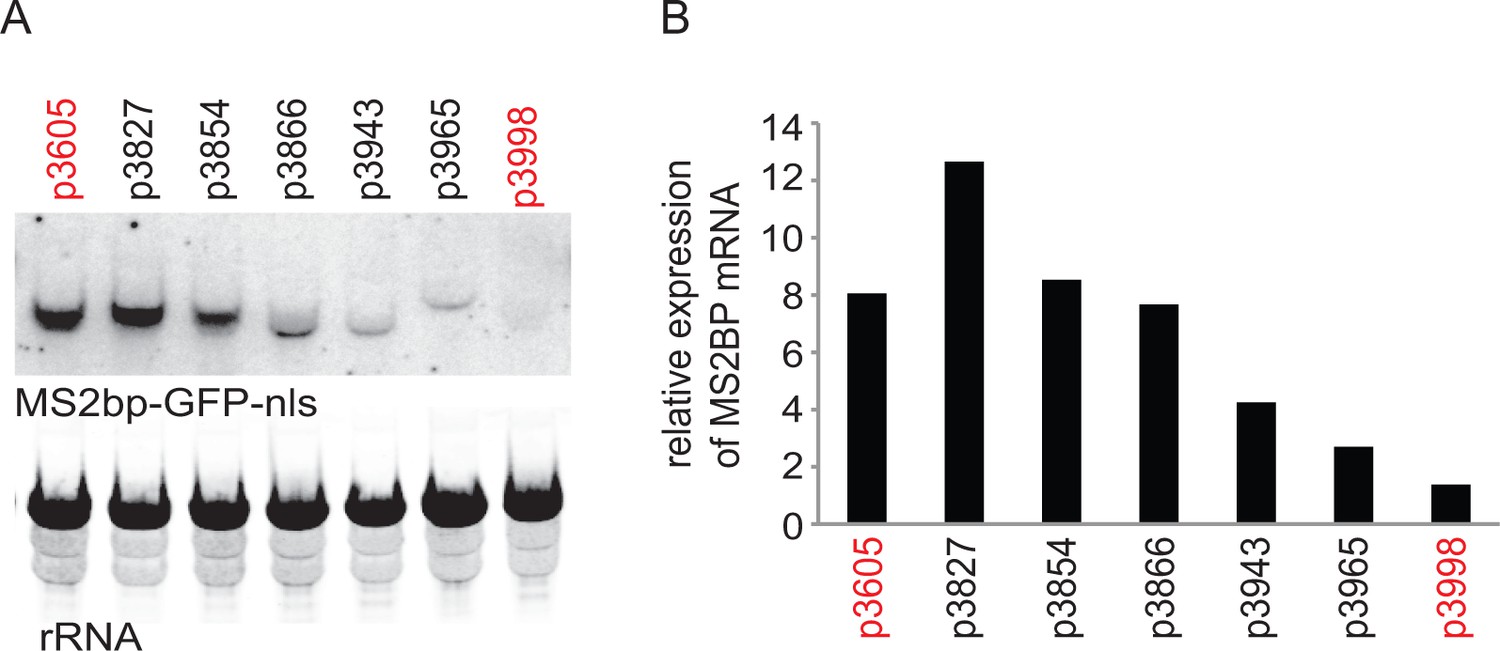
Initial experiment that provided evidence that altering codon use of a transgene ORF affected mRNA as well as protein levels.
A series of MS2bp-GFP-nls transgenes were integrated into the tubulin locus of procyclic form cells and expressed by endogenous transcription. Starting with p3605 which directed the expression of MS2bp-GFP-nls with α-tubulin 5’UTR and actin 3’UTR the following changes were made: p3827, substituted β-tubulin 5’UTR; p3854, substituted synthetic 5’UTR (based on pNS11 from [Siegel et al., 2005]); p3866, as p3854 but trans-slice acceptor site mutated from AG to AA; p3943, as p3866 but sequence around initiation codon changed from CCGCCGCCATG to TTTTTTTATG p3965, as p3943 but substituted RAB28 3’UTR p3998, as p3605 but with the ORF altered to contain codons enriched in genes with low expression levels. All sequences are in Supplementary file 1. (A) The relative expression of the transgene mRNAs was estimated by northern blotting of total RNA and detected using a probe made from an equal mixture of ‘wild type’ and re-codoned MS2bp-GFP-nls ORF sequences; the probe was in excess. (B) The relative expression of transgene mRNAs was estimated by phosphorimaging and adjustment for loading using rRNA signal. The effect of the use of infrequent codons can be seen by comparing p3605 and p3998, in red.
Figure 1—figure supplement 1
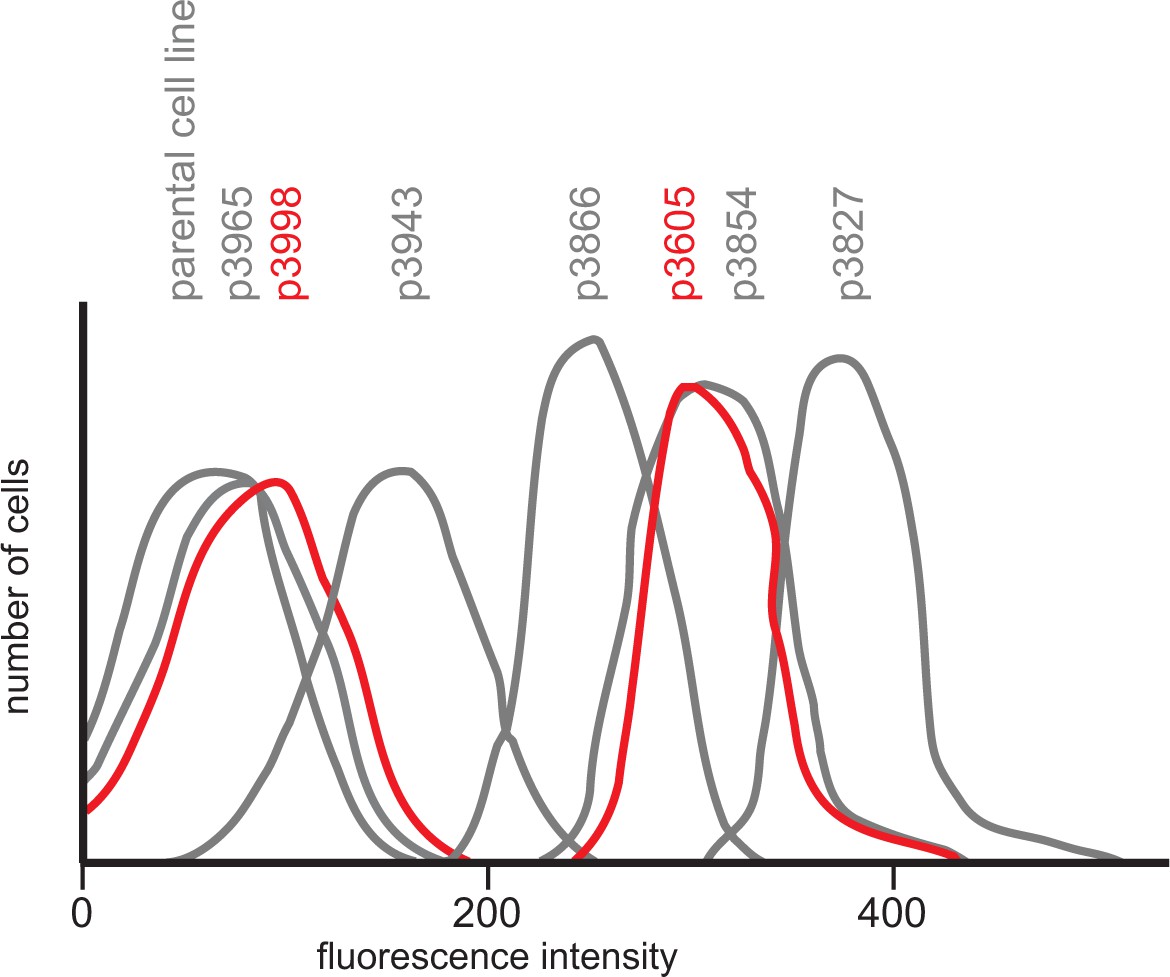
Diagram showing GFP fluorescence detected by flow cytometry in 20 000 cells for each transgene expressing cell line and the parental T. brucei Lister 427 KG procyclic form cell line.
Starting with p3605 which directed the expression of MS2bp-GFP-nls with α-tubulin 5’UTR and actin 3’UTR the following changes were made: p3827, substituted β-tubulin 5’UTR; p3854, substituted synthetic 5’UTR (based on pNS11 from [Siegel et al., 2005]); p3866, as p3854 but trans-slice acceptor site mutated from AG to AA; p3943, as p3866 but sequence around initiation codon changed from CCGCCGCCATG to TTTTTTTATG p3965, as p3943 but substituted RAB28 3’UTR p3998, as p3605 but with the ORF altered to contain codons enriched in genes with low expression levels. All sequences are in Supplementary file 1 and the effect of the use of infrequent codons can be seen by comparing p3605 and p3998, in red.
Figure 2 with 2 supplements
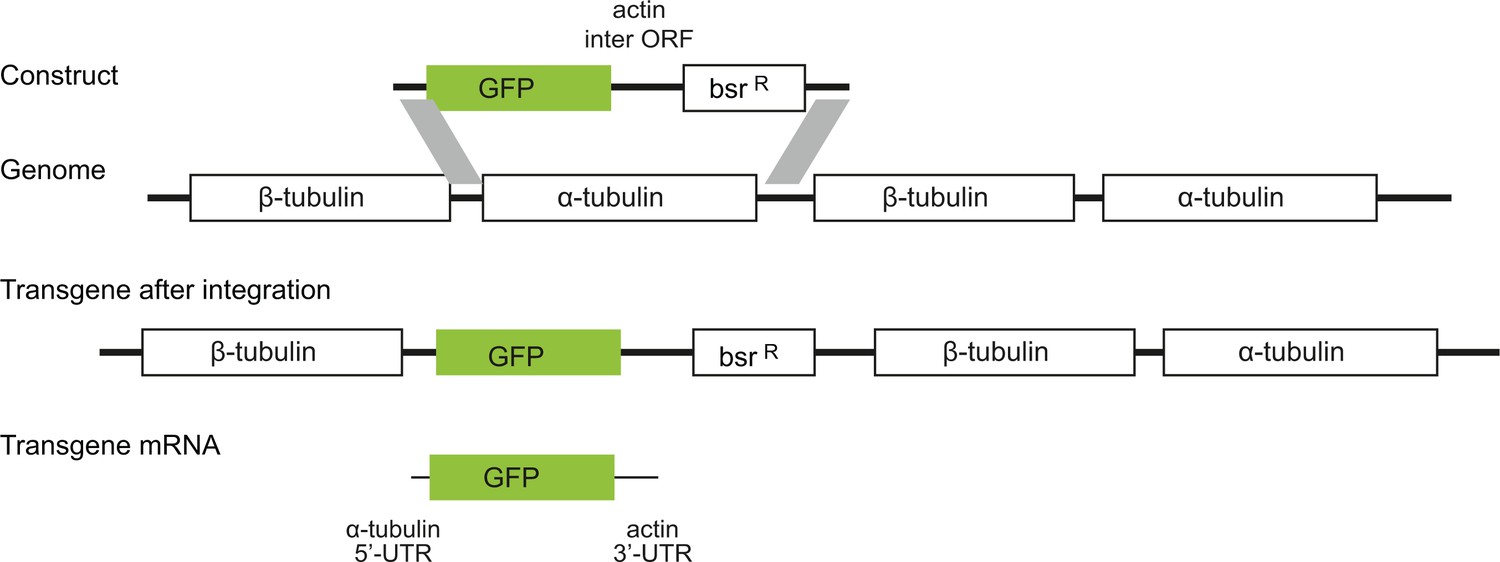
Diagram to show the strategy for integration of the GFP transgenes into the tandem repetitive α-tubulin and β-tubulin array.
In every case the transgene mRNA had a α-tubulin 5’UTR and an actin 3’UTR and was expressed by endogenous transcription of the array.
Figure 2—figure supplement 1

Differences in expression levels of four GFP transgenes with different codon usage.
Live cells were imaged and a constant exposure time of 1 s was used. The sequences of the GFP ORFs is in Supplementary file 3.
Figure 2—figure supplement 2
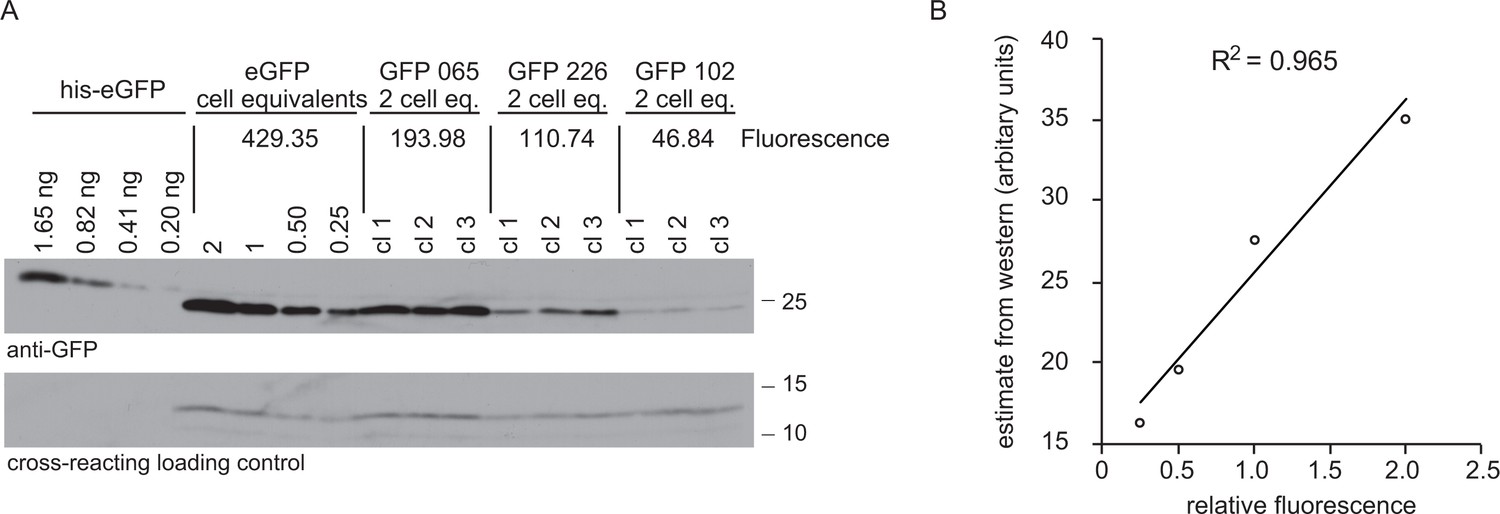
Comparison of GFP expression measured as fluorescence by flow cytometry and protein by western blotting.
(A) Western blot of total cell lysates from cell lines expressing four different GFP transgenes and a standard curve of recombinant GFP with an N-terminal hexahistidine tag for purification. For cell lines expressing GFPs 065, 226 and 102, 2 × 10⁶ cell equivalents were loading in each track and three independent clones of each cell line were used. For the cell line expressing eGFP, the loading was titred from 2 × 10⁶ to 0.25 × 10⁶ cell equivalents. The amount of recombinant eGFP loaded is indicated. The blot was probed with anti-GFP, then a peroxidase-conjugated donkey anti-rabbit IgG secondary and signal detected by chemiluminescence with x-ray film. The GFP fluorescence of each cell line was measured and the value is shown in arbitrary units. See supplementary file 2 for GFP sequences. (B) Plot of quantitation of western blot against fluorescence. The western blot was quantified using ImageJ to analyse x-ray film images and then the standard curve for quantitation. The Pearson’s correlation coefficient between fluorescence and the western blot GFP estimates was calculated and r2 = 0.965.
Figure 3 with 2 supplements
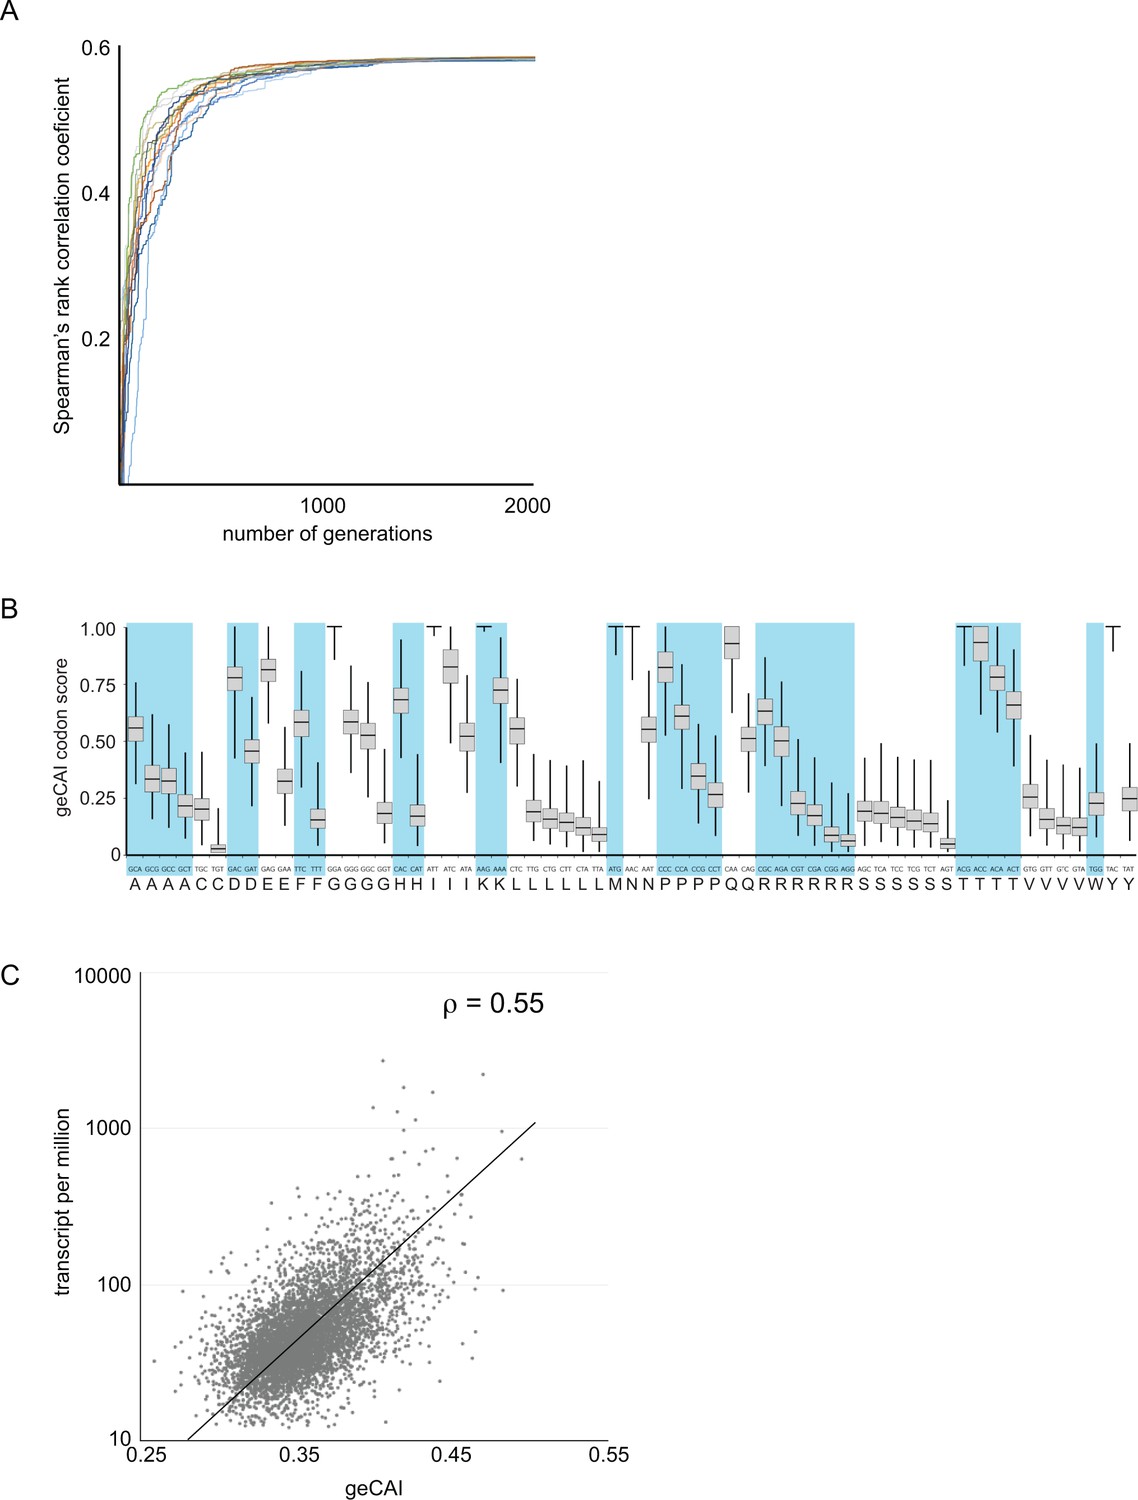
Development of a gene expression codon adaptation index (geCAI).
Randomly assigned codon values were generated and the Spearman’s rank correlation score between the ORF geCAI score (geometric mean of the individual codon values) and the measured cognate mRNA expression levels calculated. Changes were made to the codon values using a Markov chain Monte Carlo algorithm and if the step increased the correlation coefficient it was permitted and the process moved on to the next generation. 5000 generations were used and the process run 1000 times each starting with different sets of randomly assigned codon scores. (A) The maximisation of the Spearman’s rank correlation coefficient between geCAI scores and cognate mRNA expression levels reached a plateau after 1000 to 1500 generations in individual chains, seen here in a plot of Spearman’s rank correlation coefficient against generation number for a sample of 20 Markov chain Monte Carlo chains. (B) The geCAI values for each codon shown were calculated as the median of the 1000 parallel processes. They are shown here as a box plot with the median and quartiles of each value derived from the 1000 chains. (C) Final correlation between geCAI score for each ORF and the measurement of cognate mRNA abundance for the 5136 single copy, non-developmentally regulated genes in the genome. The Spearman’s rank correlation coefficient was ρ = 0.55.
Figure 3—figure supplement 1

Correlation between (A) tAI score and (B) CAI score for each ORF and the measurement of cognate mRNA abundance for the 5136 single copy, non-developmentally regulated genes in the genome.
The Spearman’s rank correlation coefficient was ρ = 0.13 for tAI and ρ = 0.16 for CAI.
Figure 3—figure supplement 2
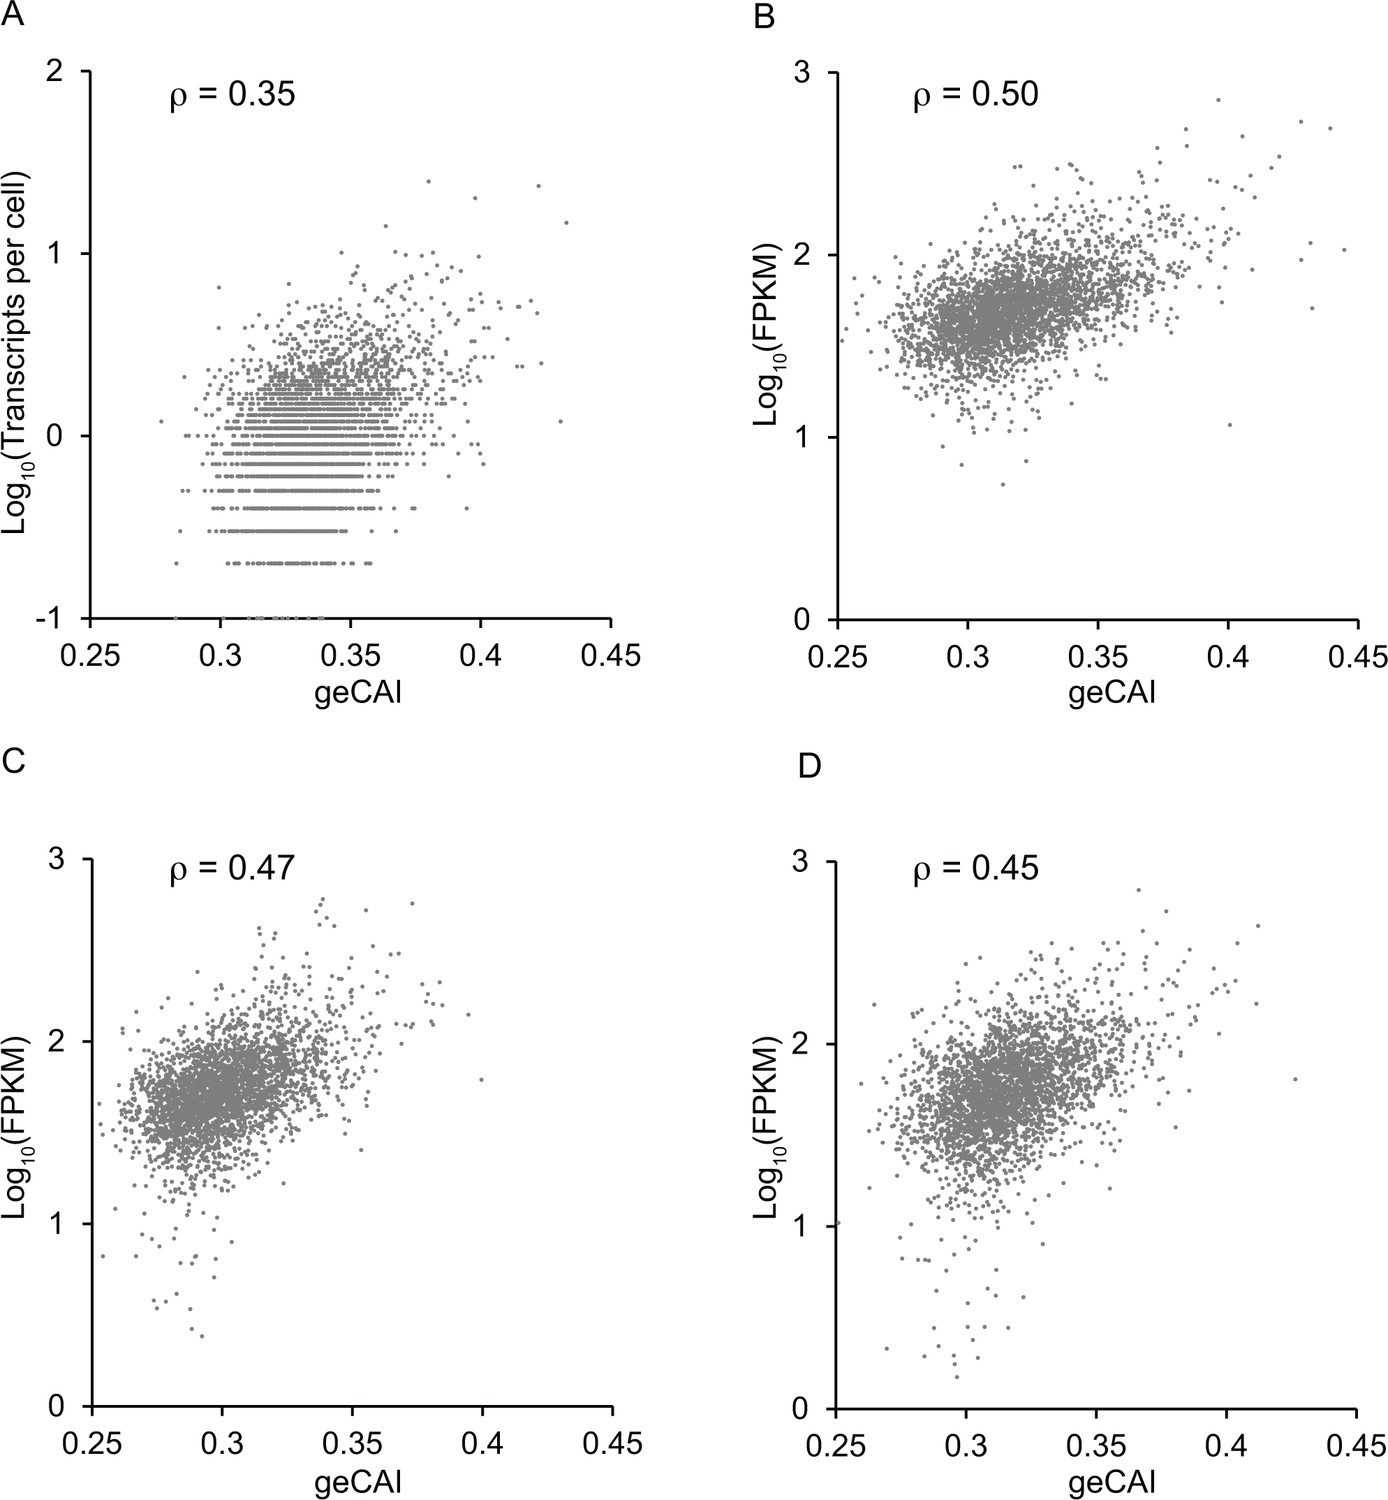
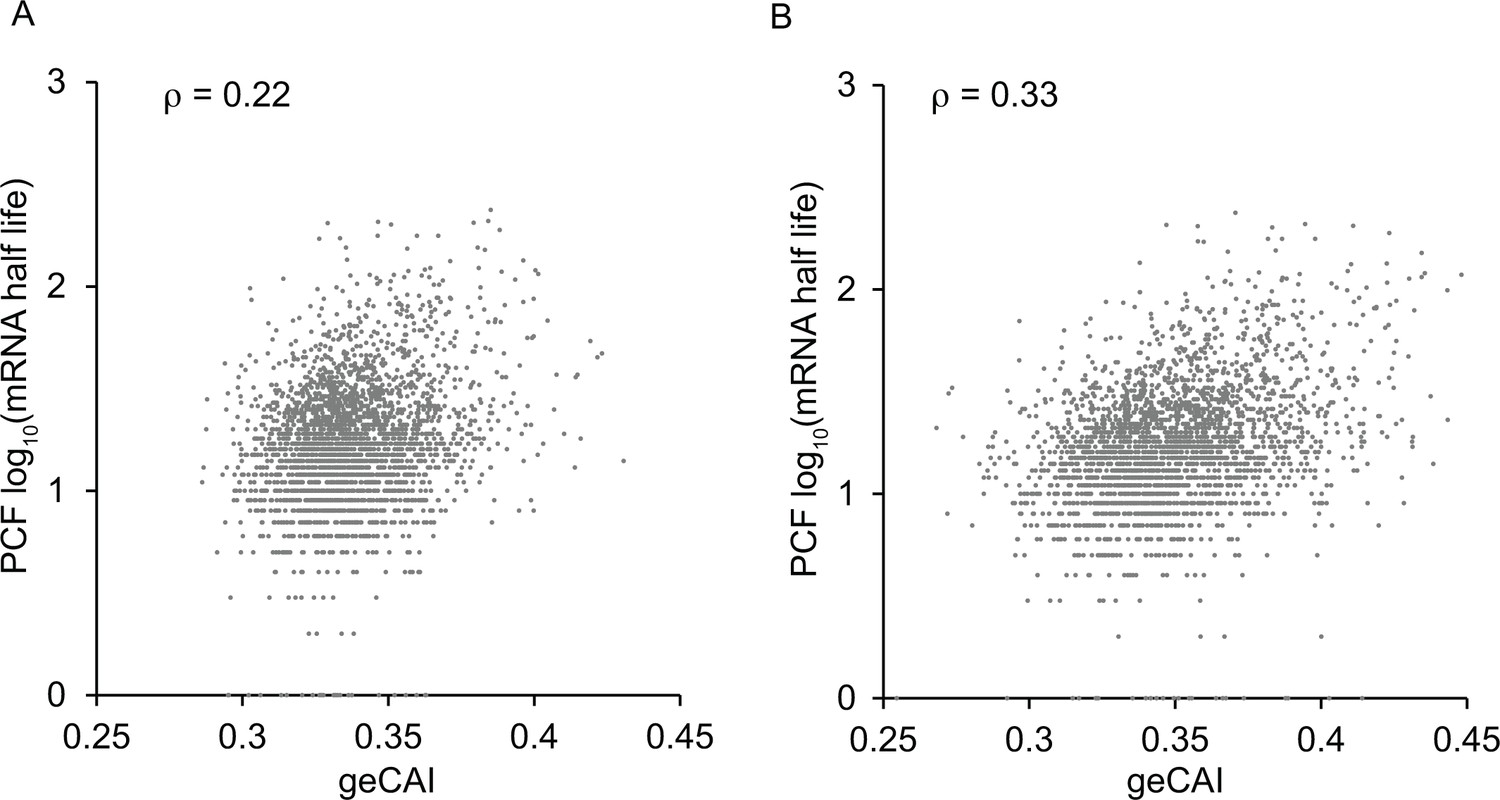
Correlation between mRNA expression levels and geCAI scores calculated from transcriptomes from other studies (Fadda et al., 2014; Christiano et al., 2017; Hutchinson et al., 2016).
In each case the transcriptome data was used to calculate a table of geCAI values for each codon (Supplementary file 5B). The score for each ORF was then plotted against the measured mRNA abundance: (A) reference (Fadda et al., 2014) PCF; (B) reference (Christiano et al., 2017) PCF; (C) reference (Hutchinson et al., 2016) BSF; (D) reference (Hutchinson et al., 2016) PCF. The Spearman’s rank correlation coefficient is given as ρ at the top of each graph.
Figure 4
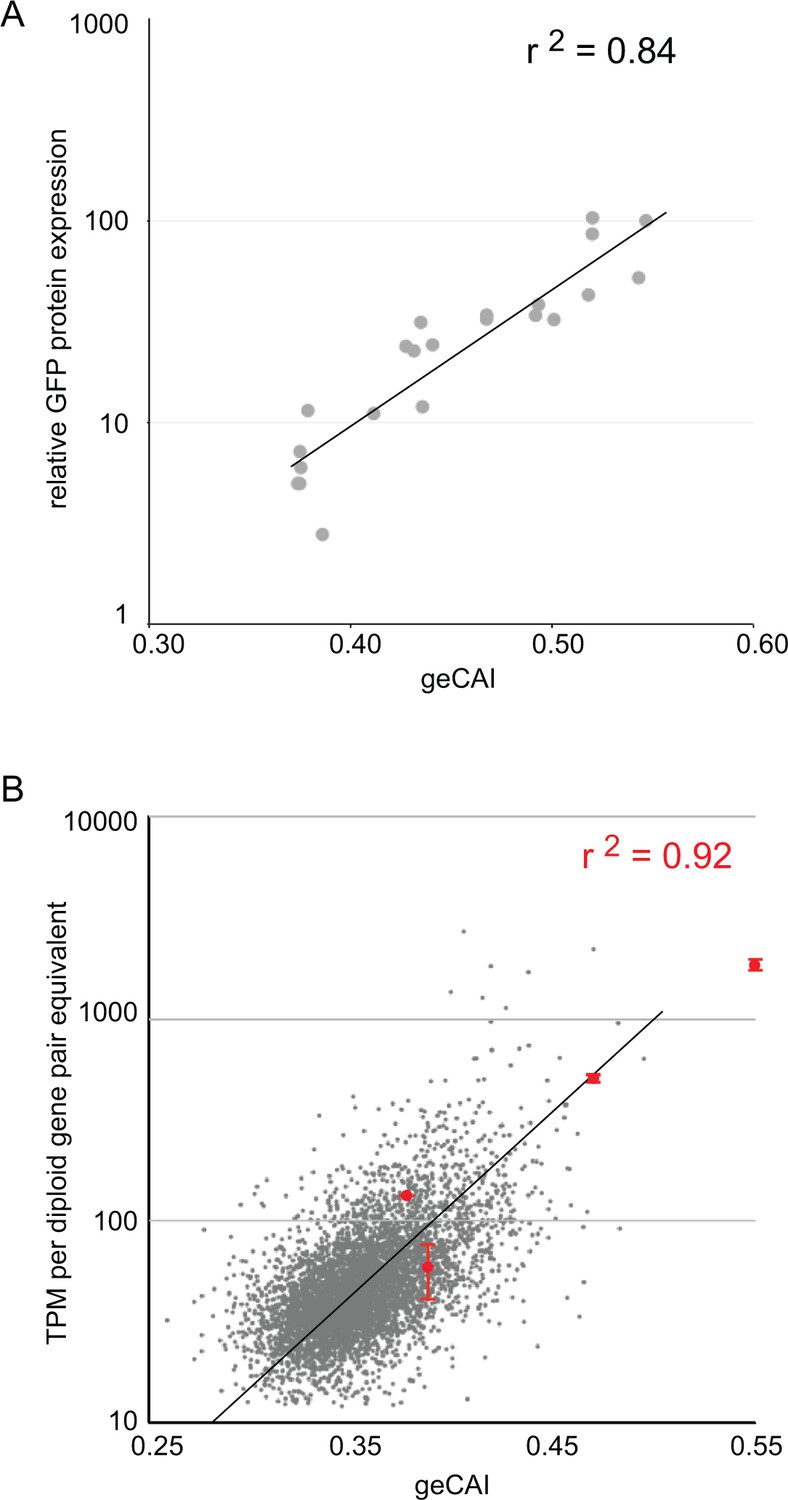
geCAI score is a predictor of protein and mRNA expression levels.
(A) The correlation between log10(GFP protein levels) and geCAI score for twenty-two different ORFs with a range of geCAI scores. The Pearson’s correlation coefficient was r2 = 0.84. (B) The correlation between geCAI score and log10(GFP mRNA levels) for four different GFP ORFs. The values for the four GFPs are shown in red (±standard error), and are superimposed upon a plot of the endogenous mRNAs in grey, from Figure 3C. The Pearson’s correlation coefficient was r2 = 0.92.
Figure 5
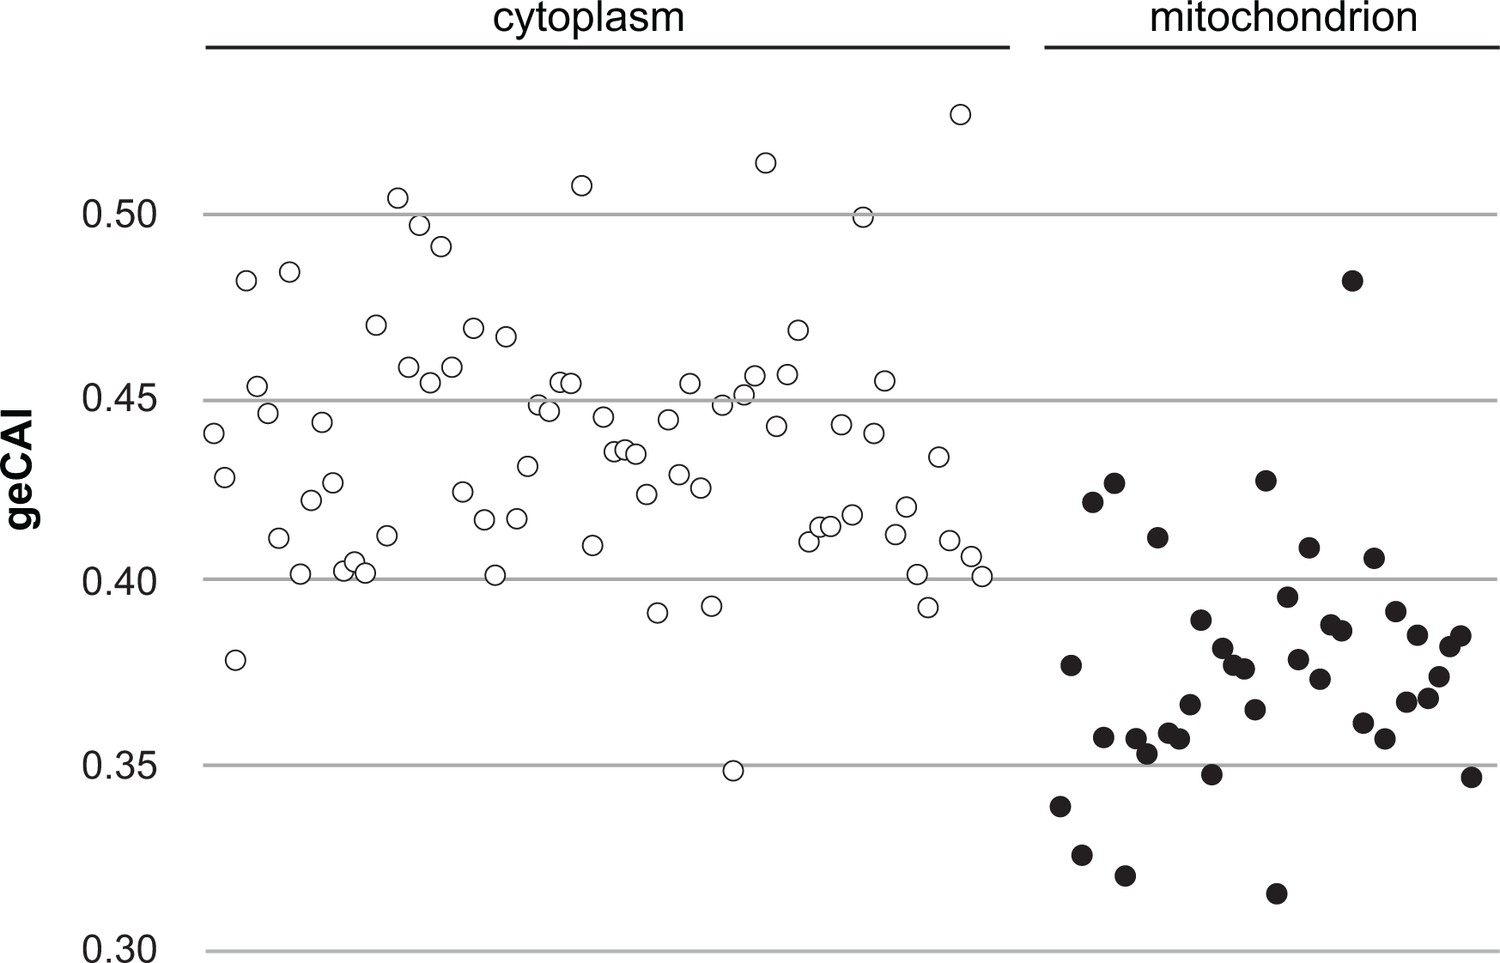
A comparison of geCAI scores for mRNAs encoding 75 abundant cytosolic ribosomal proteins and 41 less abundant mitochondrial ribosomal proteins.
As 67/75 of the cytosolic ribosomal proteins are encoded by >1 gene, they were excluded from the calculation of geCAI values for individual codons. mRNAs encoding cytosolic ribosomal proteins are shown as open circles and mitochondrial ribosomal proteins as solid circles. The cytosolic ribosome protein ORFs have a significantly higher geCAI score than the mitochondrial ribosome protein ORFs (p<0.00001 unpaired two-sample t test with equal variance).
Figure 6 with 1 supplement
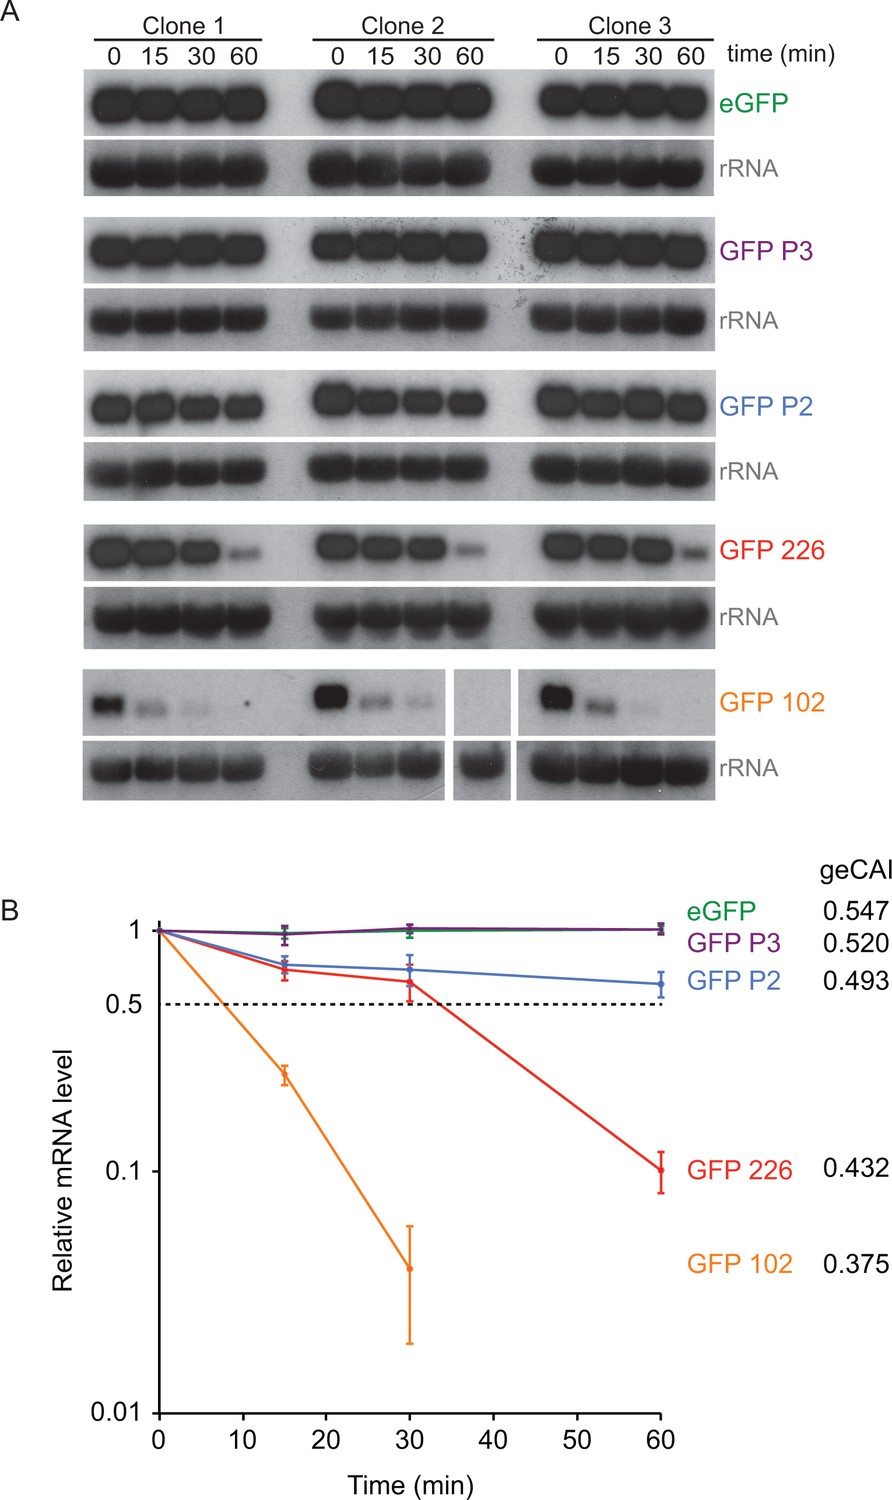
geCAI scores are a major determinant of mRNA half-lives.
(A) Northern blots to measure mRNA levels over a time course after inhibition of mRNA maturation with sinefungin in cell lines expression one of five differently coded GFPs. Three independent clones for each of five cell lines are shown and each blot was probed with the cognate GFP ORF; blots were exposed for a range of times. rRNA was used as a loading control for GFP mRNA quantitation. The identity and geCAI score for each GFP ORF is shown to the right. (B) Decay of GFP mRNAs after sinefungin addition. The mRNAs were quantified by phosphorimaging of the northern blots and each value adjusted for loading based on rRNA. The mRNA levels (±standard error) were plotted against time after being normalised to the zero timepoint.
Figure 6—figure supplement 1
Correlation between mRNA half-lives from (Fadda et al., 2014) and geCAI scores for each ORF calculated from the transcriptome data in: (A) reference (Fadda et al., 2014); (B) this study.
The Spearman’s rank correlation coefficient is given as ρ at the top of each graph.
Figure 7
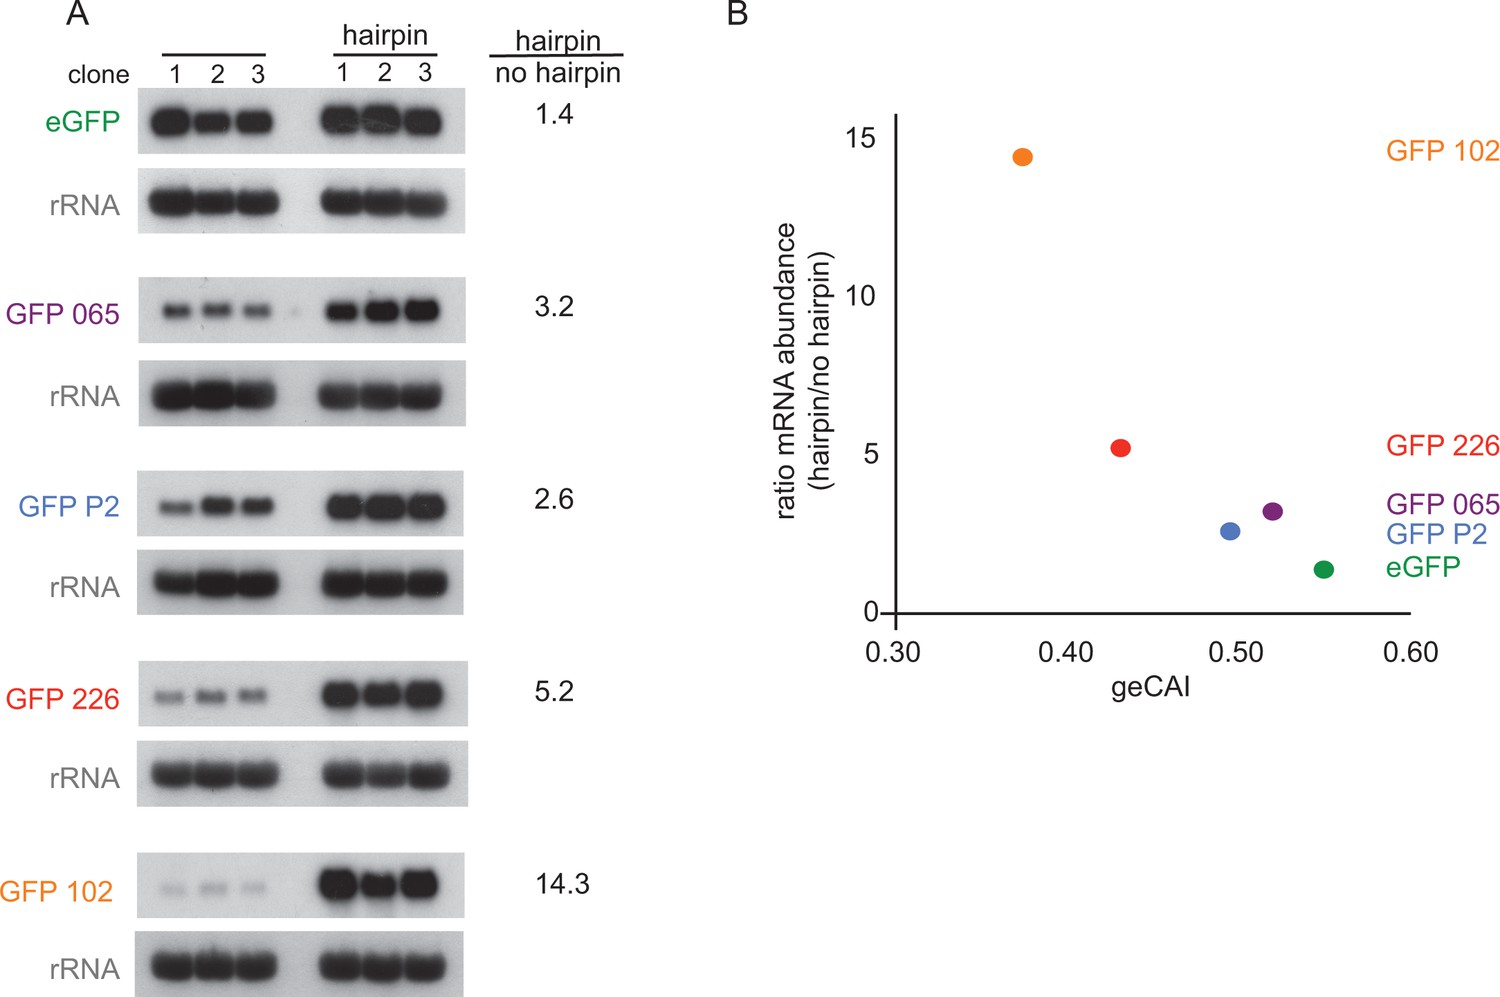
Blocking translation stabilises mRNAs with low geCAI scores more than mRNAs with high geCAI scores.
(A) Northern blots to measure GFP mRNAs in cell lines expressing GFP with geCAI scores with or without a hairpin structure in the 5’UTR that blocked translation. Three independent clones for each transgene were analysed and GFP; mRNA was quantified by phosphorimaging and values adjusted for loading using rRNA. (B) Graph showing the fold increase in mRNA steady state level due to the inclusion of the hairpin in the 5’UTR plotted against the geCAI score for each ORF.
Figure 8
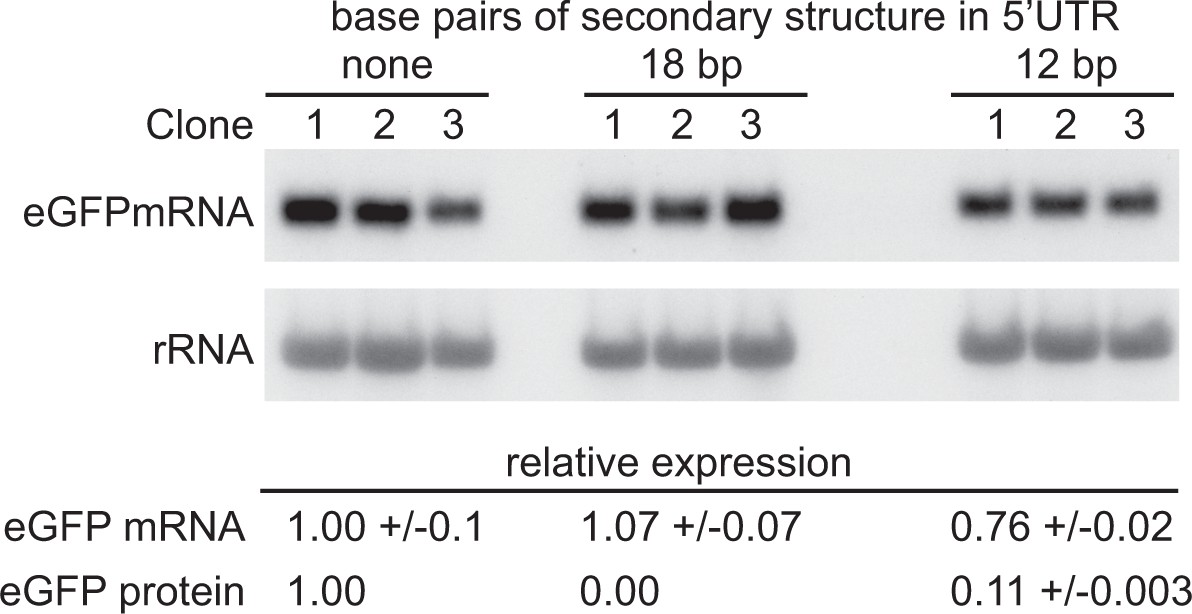
Partially blocking translation of a GFP mRNA decreases protein but has only a small effect on mRNA levels.
(A) Northern blot to measure GFP mRNAs in cell lines expressing GFP with different secondary structures in the 5’UTR. Three independent clones for each transgene were analysed; mRNA was quantified by phosphorimaging and values adjusted for loading using rRNA. (B) Quantitation of the effect of secondary structures on GFP protein and mRNA levels. GFP protein was measured by flow cytometry (Supplementary file 6F) and GFP mRNA by phosphorimaging, rRNA was used to adjust for loading (Supplementary file 6G). Values are normalised to the 5’UTR with no added secondary structure. In each case the value is the average of three independent clones and the standard error is shown.
Figure 9
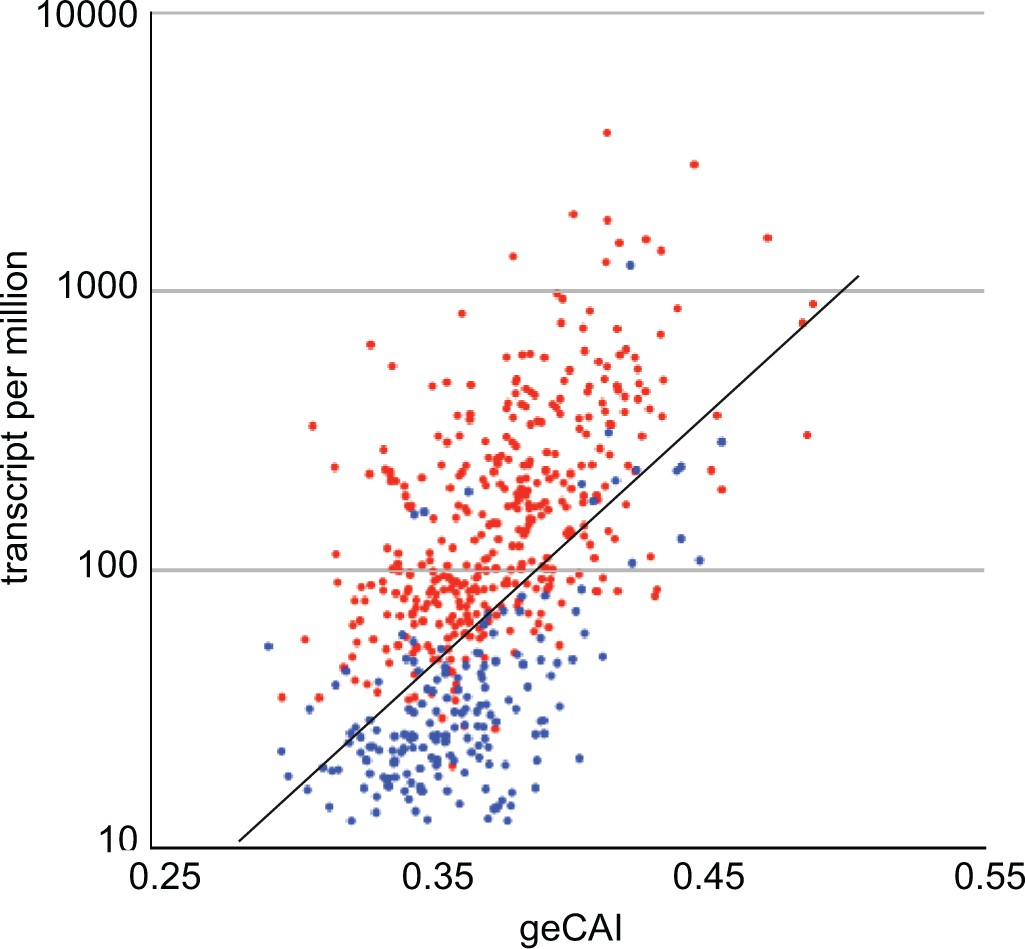
geCAI and expression levels of developmentally regulated mRNAs in procyclic forms.
Expression levels in procyclic forms plotted against geCAI scores for developmentally regulated mRNAs transcribed from single copy genes. Red: 374 mRNAs more than twofold up regulated in procyclic forms compared to bloodstream forms. Blue: 182 mRNAs more than twofold down regulated in procyclic forms when compared to bloodstream forms. The diagonal line is the best fit line for the 5136 non-developmentally regulated mRNAs (Figure 3C).
Tables
Table 1
geCAI values for each codon for logarithmically growing procyclic form T. brucei.
https://doi.org/10.7554/eLife.32467.011| Amino acid | Codon | geCAI codon weight | Amino acid | Codon | geCAI codon weight |
|---|---|---|---|---|---|
| A | GCA | 0.55 | N | AAC | 1.00 |
| A | GCG | 0.33 | N | AAT | 0.55 |
| A | GCC | 0.32 | P | CCC | 0.82 |
| A | GCT | 0.21 | P | CCA | 0.61 |
| C | TGC | 0.20 | P | CCG | 0.34 |
| C | TGT | 0.02 | P | CCT | 0.26 |
| D | GAC | 0.78 | Q | CAA | 0.93 |
| D | GAT | 0.45 | Q | CAG | 0.51 |
| E | GAG | 0.81 | R | CGC | 0.63 |
| E | GAA | 0.32 | R | AGA | 0.50 |
| F | TTC | 0.58 | R | CGT | 0.22 |
| F | TTT | 0.15 | R | CGA | 0.17 |
| G | GGA | 1.00 | R | CGG | 0.08 |
| G | GGG | 0.58 | R | AGG | 0.06 |
| G | GGC | 0.52 | S | AGC | 0.19 |
| G | GGT | 0.18 | S | TCA | 0.18 |
| H | CAC | 0.68 | S | TCC | 0.16 |
| H | CAT | 0.17 | S | TCG | 0.15 |
| I | ATT | 1.00 | S | TCT | 0.13 |
| I | ATC | 0.82 | S | AGT | 0.04 |
| I | ATA | 0.52 | T | ACG | 1.00 |
| K | AAG | 1.00 | T | ACC | 0.93 |
| K | AAA | 0.72 | T | ACA | 0.78 |
| L | CTC | 0.55 | T | ACT | 0.66 |
| L | TTG | 0.19 | V | GTG | 0.25 |
| L | CTG | 0.15 | V | GTT | 0.15 |
| L | CTT | 0.14 | V | GTC | 0.13 |
| L | CTA | 0.12 | V | GTA | 0.12 |
| L | TTA | 0.09 | W | TGG | 0.22 |
| M | ATG | 1.00 | Y | TAC | 1.00 |
| Y | TAT | 0.24 |
Additional files
-
Supplementary file 1
Sequences of the various MS2bp-GFP-nls transgenes used is the experiment in Figure 1.
Each sequence is split into three: the 5’ sequences, the open reading frame in bold, and 3’ sequences.
- https://doi.org/10.7554/eLife.32467.019
-
Supplementary file 2
GFP transgene mRNA sequences
(A) GFP transgene sequence after integration. 5’ region from an alpha-tubulin gene, trans-splice acceptor sites in red (Kolev et al., 2010), GFP open reading frame in green, and 3’ region from an actin gene, polyadenylation sites in blue (Kolev et al., 2010). Grey sequences added to construct for cloning of GFP variants (B) 5’UTR variants. Sequences adding secondary structure to the 5’UTR are shown in blue; the two characterised trans-splicing site AG acceptor sites are shown in red; the initiation codon is in green and other additional sequences are in grey.
- https://doi.org/10.7554/eLife.32467.020
-
Supplementary file 3
Sequences of the 22 GFP open reading frames used in this study, the corresponding plasmids are listed in Supplementary file 11.
- https://doi.org/10.7554/eLife.32467.021
-
Supplementary file 4
The expression level of each mRNA encoded by a single copy gene in transcripts per million transcripts (TPM).
The values for three biological replicates for two developmental forms, PCF procyclic forms and BSF bloodstream forms, are shown. 'P-adj' is the Benjamini-Hochberg adjusted P-value for the BSF measurements being the same as the PCF measurement. The data was taken from EBI Array Express E-MTAB-3335 (Kelly et al., 2017).
- https://doi.org/10.7554/eLife.32467.022
-
Supplementary file 5
(A) Pairwise Pearson correlation (r) between log2(mRNA abundance) for single copy genes determined in this and three other studies: A, from reference (Fadda et al., 2014); B, from reference (Christiano et al., 2017); C from reference (Hutchinson et al., 2016).
(B) geCAI values for individual codons derived from mRNA abundances from this and three other studies: A, from reference (Fadda et al., 2014); B, from reference (Christiano et al., 2017); C from reference (Hutchinson et al., 2016). (C) Pairwise Pearson correlation (r) between calculated geCAI values calculated from mRNA abundance measurements in this and three other studies: A, from reference (Fadda et al., 2014); B, from reference (Christiano et al., 2017); C from reference (Hutchinson et al., 2016).
- https://doi.org/10.7554/eLife.32467.023
-
Supplementary file 6
(A) Table showing flow cytometry measurements of GFP expression in cell line expressing each of the 22 differently encoded GFPs.
(B) Summary of GFP expression levels measured by flow cytometry and calculation of correlation coefficients between expression and geCAI, CAI and tAI. (C) Table showing flow cytometry measurements for cell lines containing GFP transgenes with a 24 bp hairpin in the 5’UTR. (D) Summary of GFP expression levels measured by flow cytometry from cell lines containing a GFP transgene with a hairpin in the 5’UTR. (E) mRNA measurements from Figure 7. (F) Table showing flow cytometry measurements for cell lines containing GFP transgenes with a a range of secondary structures in the 5’UTR. G. mRNA measurements from Figure 8. The rRNA values were used to adjust for loading.
- https://doi.org/10.7554/eLife.32467.024
-
Supplementary file 7
Summary of GFP mRNA expression levels measured by RNA Seq and calculation of correlation coefficient between gCAI and mRNA levels.
- https://doi.org/10.7554/eLife.32467.025
-
Supplementary file 8
Identification of ribosome proteins from the cytoplasmic (PDB 4V8M) (Hashem et al., 2013) and mitochondrial ribosomes (Zíková et al., 2008) along with the geCAI scores for each mRNA.
The cytosolic ribosome proteins encoded by > 1 gene were similar and the geCAI values is for the first gene in the list.
- https://doi.org/10.7554/eLife.32467.026
-
Supplementary file 9
Quantitation of GFP mRNA decay after inhibition of mRNA maturation by sinefungin by phosphorimager analysis of the northern blots in Figure 6.
The rRNA data was used to adjust for loading.
- https://doi.org/10.7554/eLife.32467.027
-
Supplementary file 10
Calculation of the correlation coefficients between geCAI and log10(ribosome footprint measure) for data from two studies.
Of the 5136 single copy genes used in this study both the footprinting dataset contained measures for > 5000. Study A is from reference (Vasquez et al., 2014) and study B is from reference (Jensen et al., 2014).
- https://doi.org/10.7554/eLife.32467.028
-
Supplementary file 11
A list of: A, plasmids used in this study and B, oligonucleotides used.
- https://doi.org/10.7554/eLife.32467.029
-
Transparent reporting form
- https://doi.org/10.7554/eLife.32467.030
Download links
A two-part list of links to download the article, or parts of the article, in various formats.
Downloads (link to download the article as PDF)
Open citations (links to open the citations from this article in various online reference manager services)
Cite this article (links to download the citations from this article in formats compatible with various reference manager tools)
Codon choice directs constitutive mRNA levels in trypanosomes
eLife 7:e32467.
https://doi.org/10.7554/eLife.32467


