Activation of G protein-coupled estrogen receptor signaling inhibits melanoma and improves response to immune checkpoint blockade
- University of Pennsylvania, United States
Figures
Figure 1 with 1 supplement
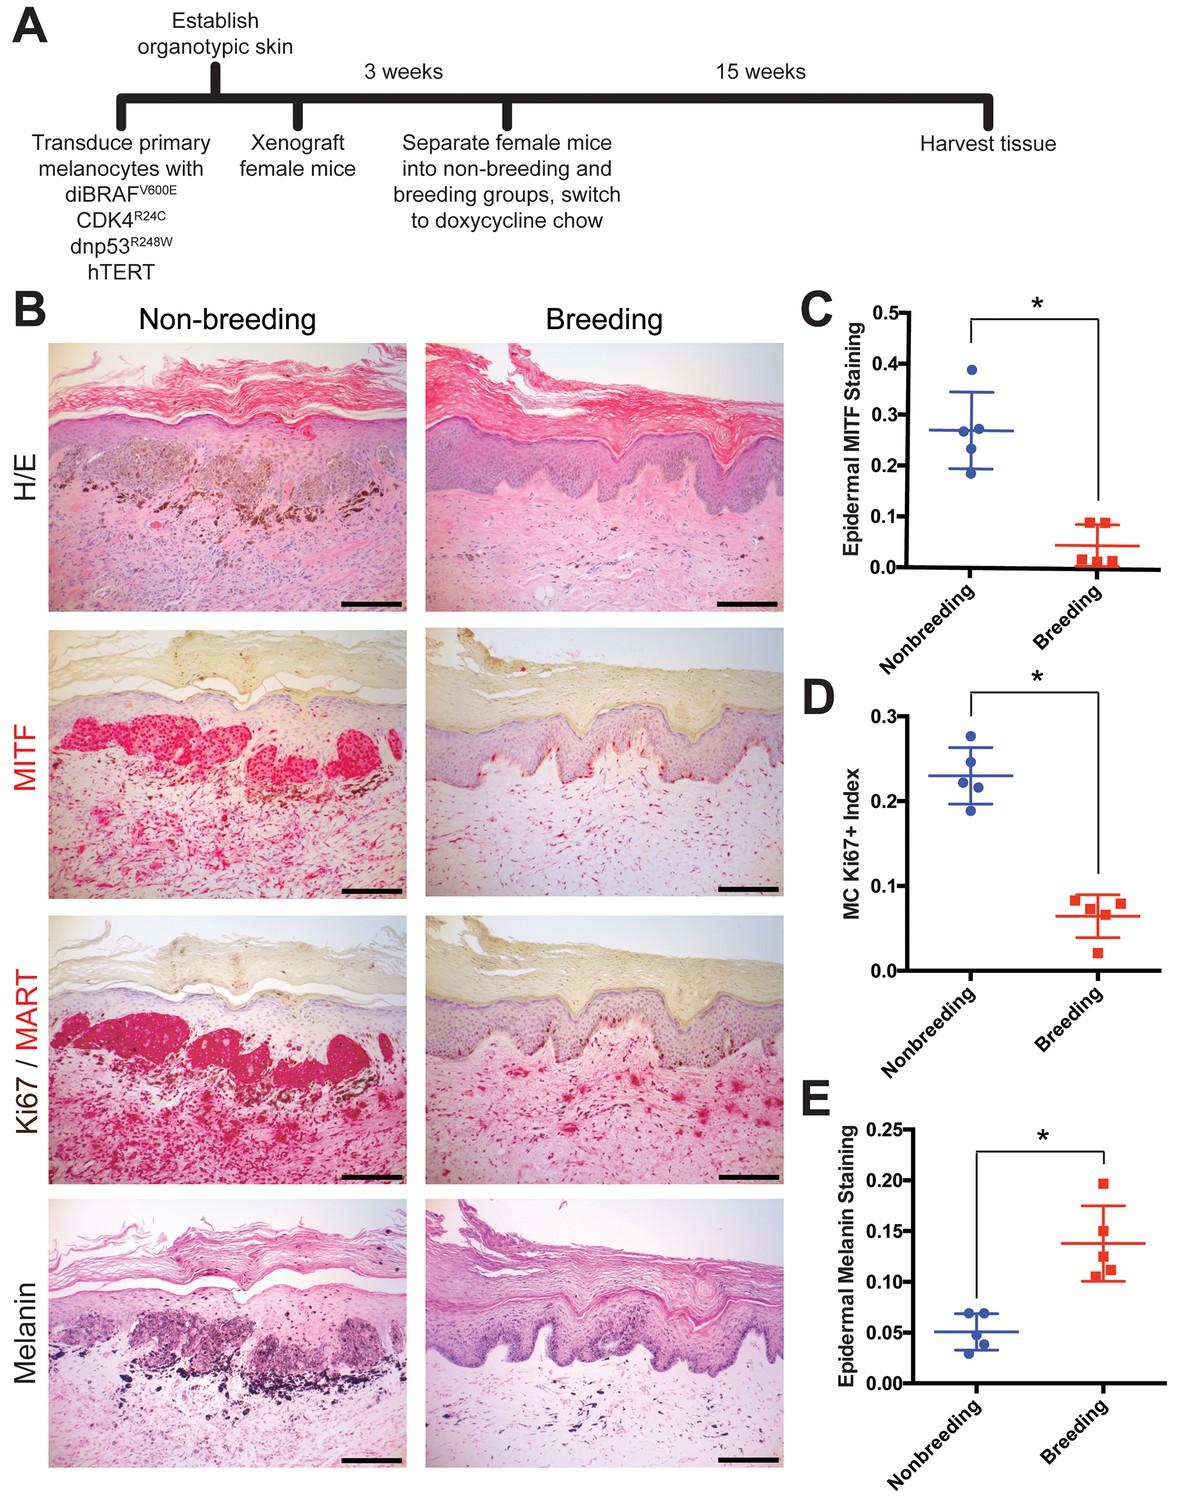
Multiple pregnancies inhibit melanomagenesis.
(A) Experimental timeline of genetically-defined human xenograft melanoma on SCID mice, n = 5 per group. (B) Histologic characterization of representative orthotopic skin and resulting tumors, including hematoxylin and eosin (H/E), melanocyte and proliferation markers MITF, Ki67/MART, and Fontana Masson (Melanin). Scale bars = 100 μM. (C–E) Quantification of epidermal MITF staining (C), Ki67 proliferation index (D) and melanin staining in epidermal keratinocytes (E), * denotes significance by the Mann-Whitney test.
Figure 1—figure supplement 1
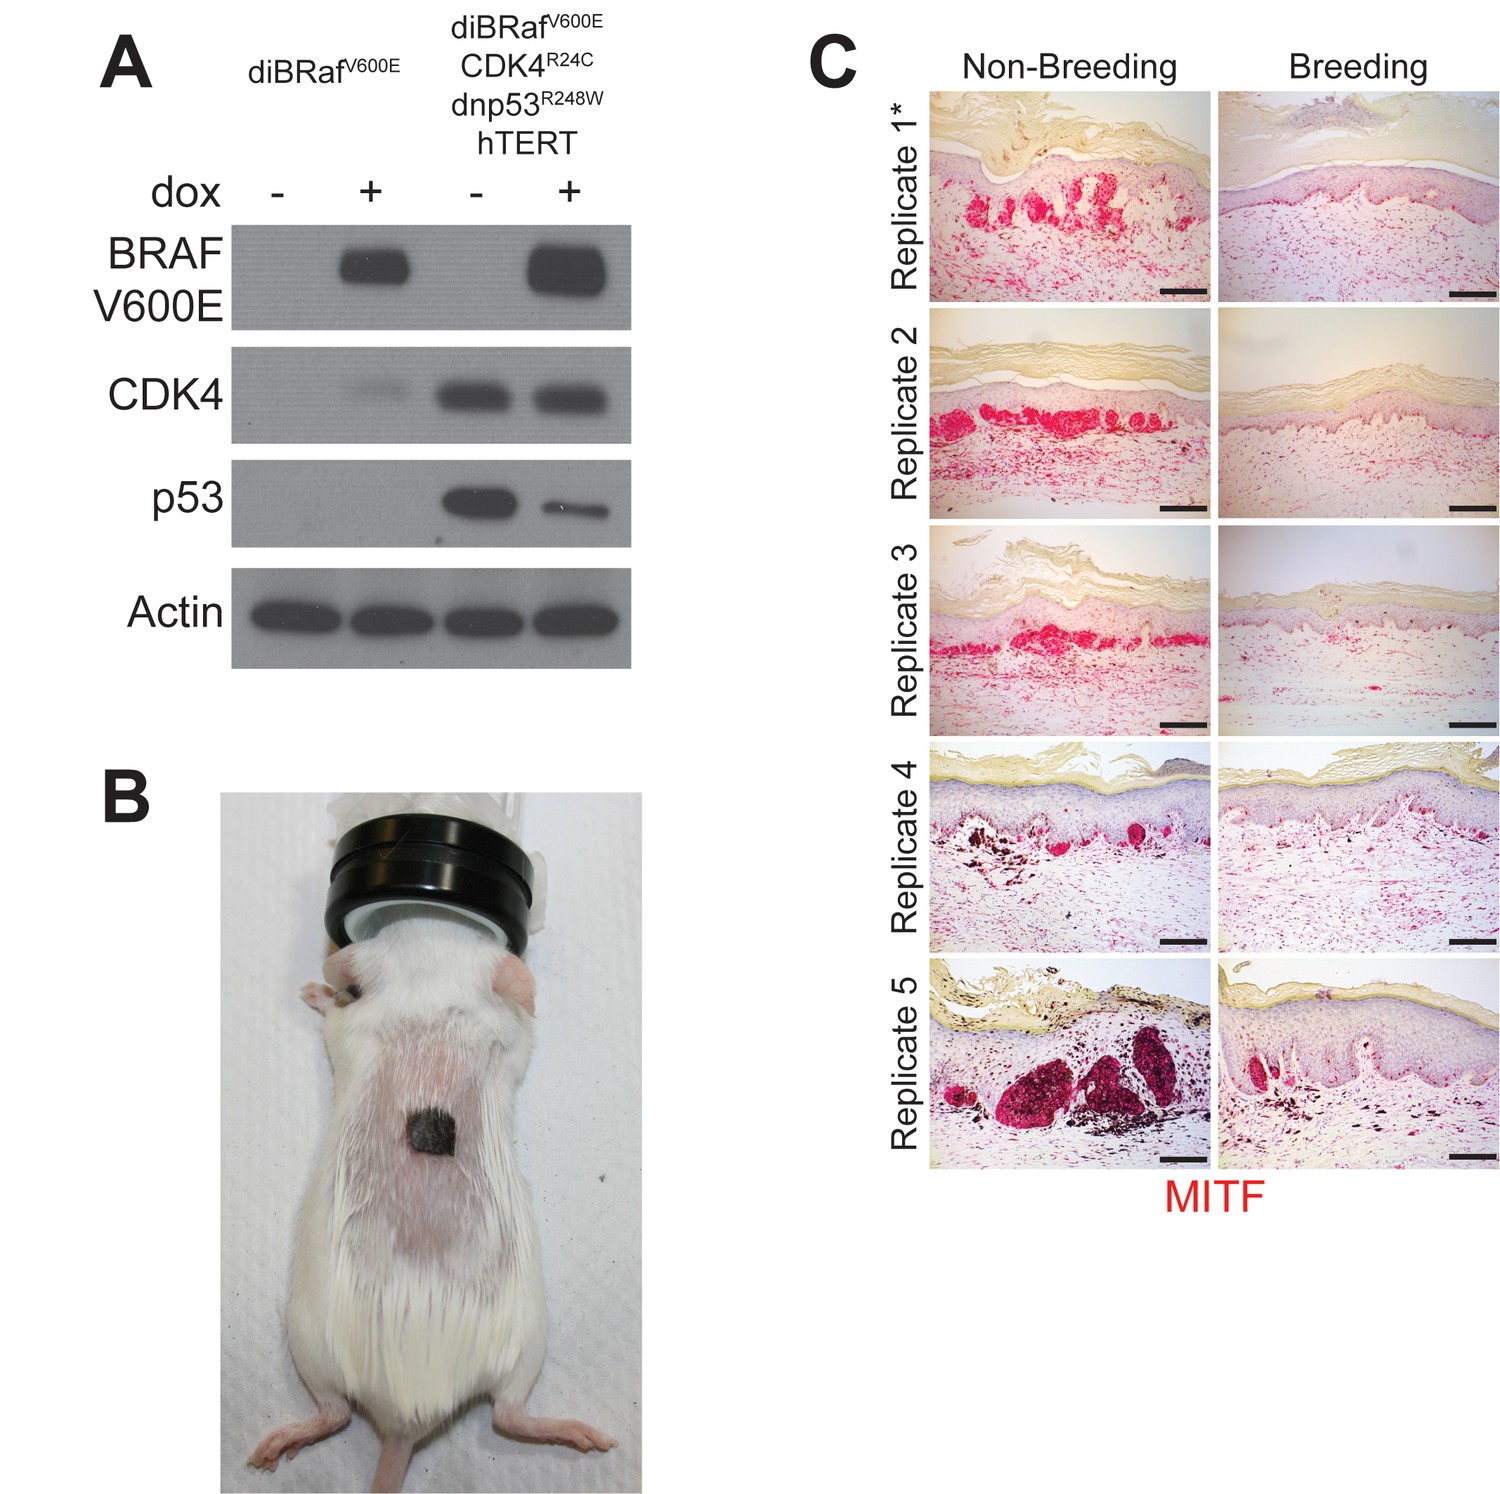
Multiple pregnancies inhibit melanomagenesis.
(A) Western blot validating the transduction of normal human melanocytes with doxycycline inducible BRAF(V600E), dominant-negative p53(R248W), active CDK4(R24C) and hTERT. (B) Representative photo of a SCID mouse with a human engineered melanoma xenograft. (C) MITF immunohistochemistry across all non-breeding and breeding mice, * denotes replicates shown in Figure 1B. Scale bars = 100 μM.
Figure 2 with 1 supplement
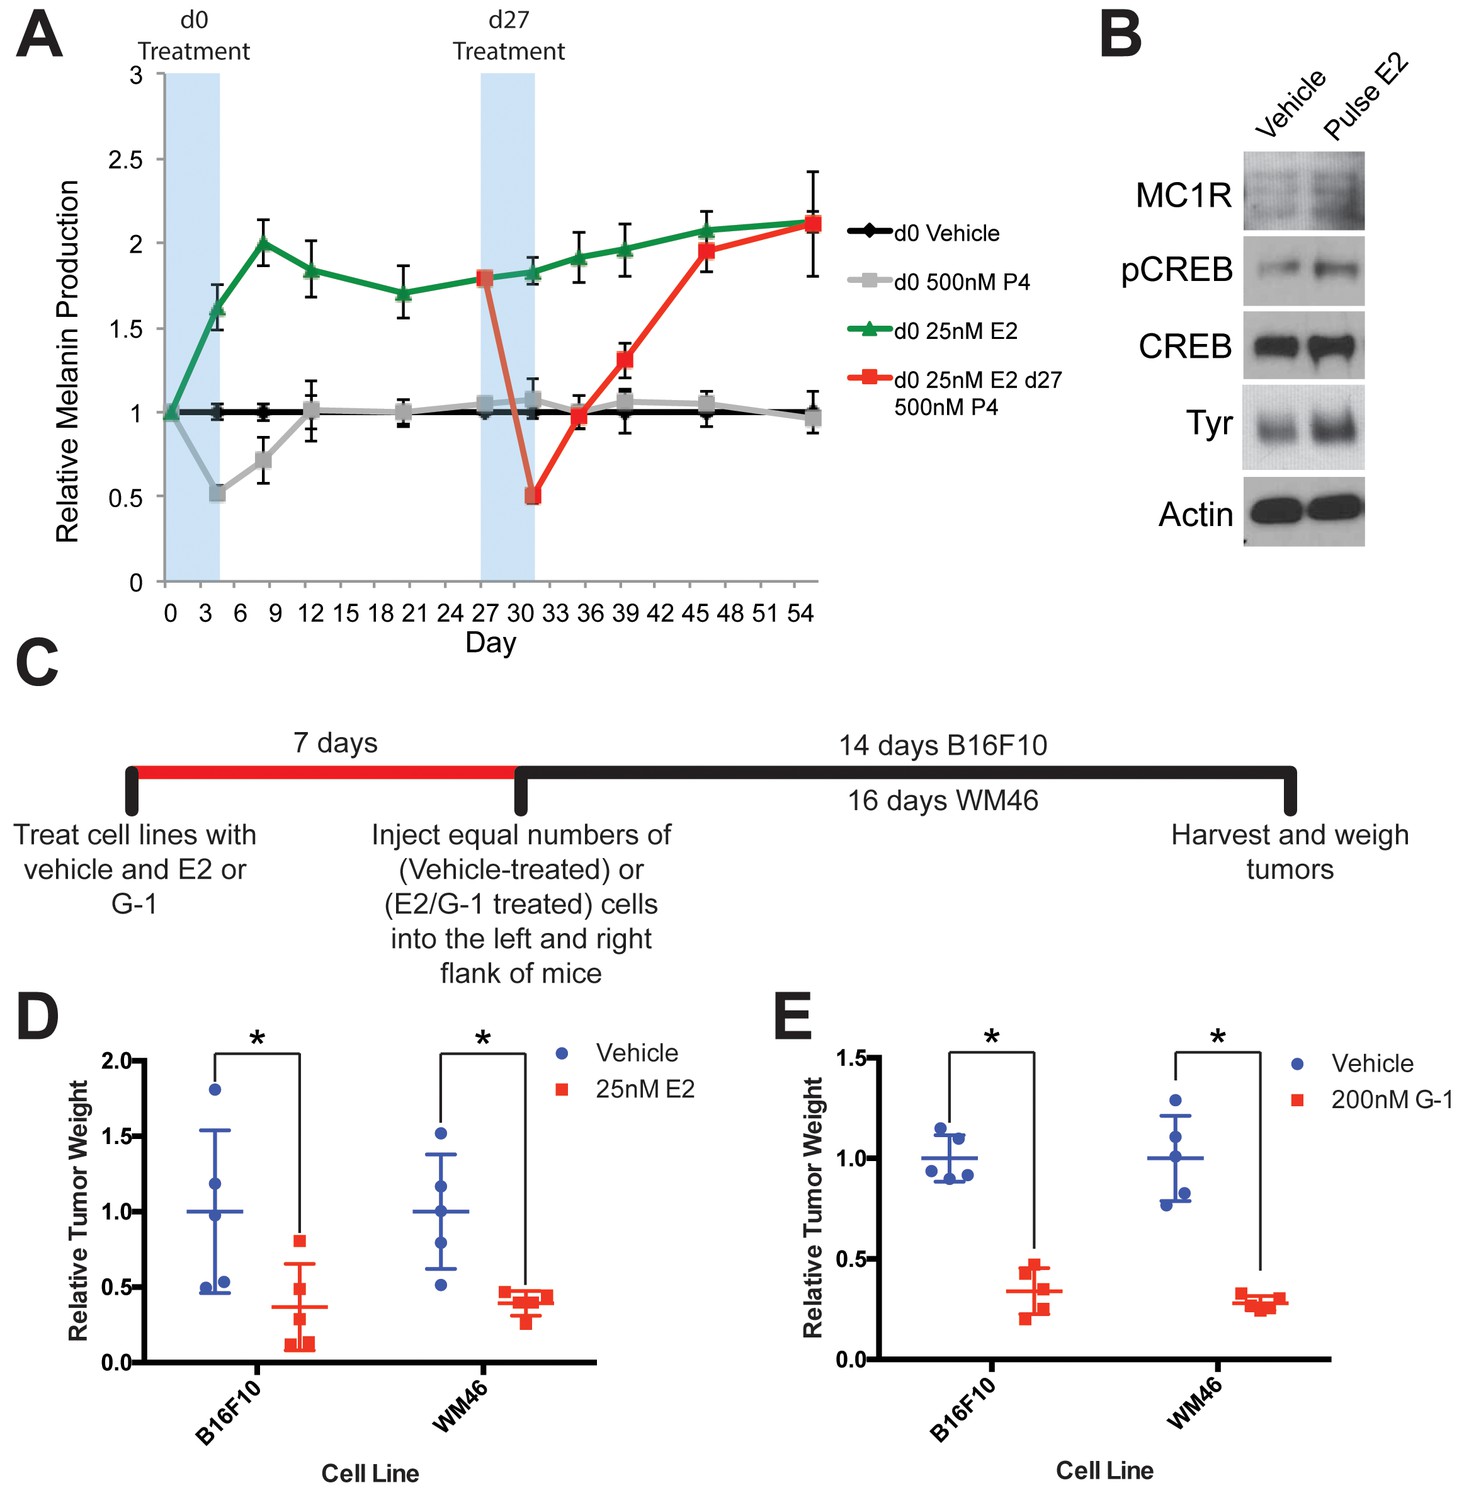
GPER signaling drives stable differentiation in normal human melanocytes and in melanoma.
(A) Long-term melanin assay in which normal human melanocytes were transiently treated with progesterone (P4), or estrogen (E2). Subsets of these groups (Red) were treated with an additional transient pulse of P4 at Day 27. Error bars equal the standard deviation of the samples. (B) Western blot of melanocyte differentiation markers after a transient, 4 day treatment with either vehicle or estrogen, followed by an 8 day withdraw period. (C) Experimental timeline of estrogen or GPER agonist (G-1) pre-treatment of mouse and human melanoma cells, n = 5 per group. (D) Relative tumor weights of mouse and human melanomas pre-treated with estrogen, * denotes significance by the Mann-Whitney test. (E) Relative tumor weights of mouse and human melanomas pre-treated with G-1, * denotes significance by the Mann-Whitney test.
Figure 2—figure supplement 1
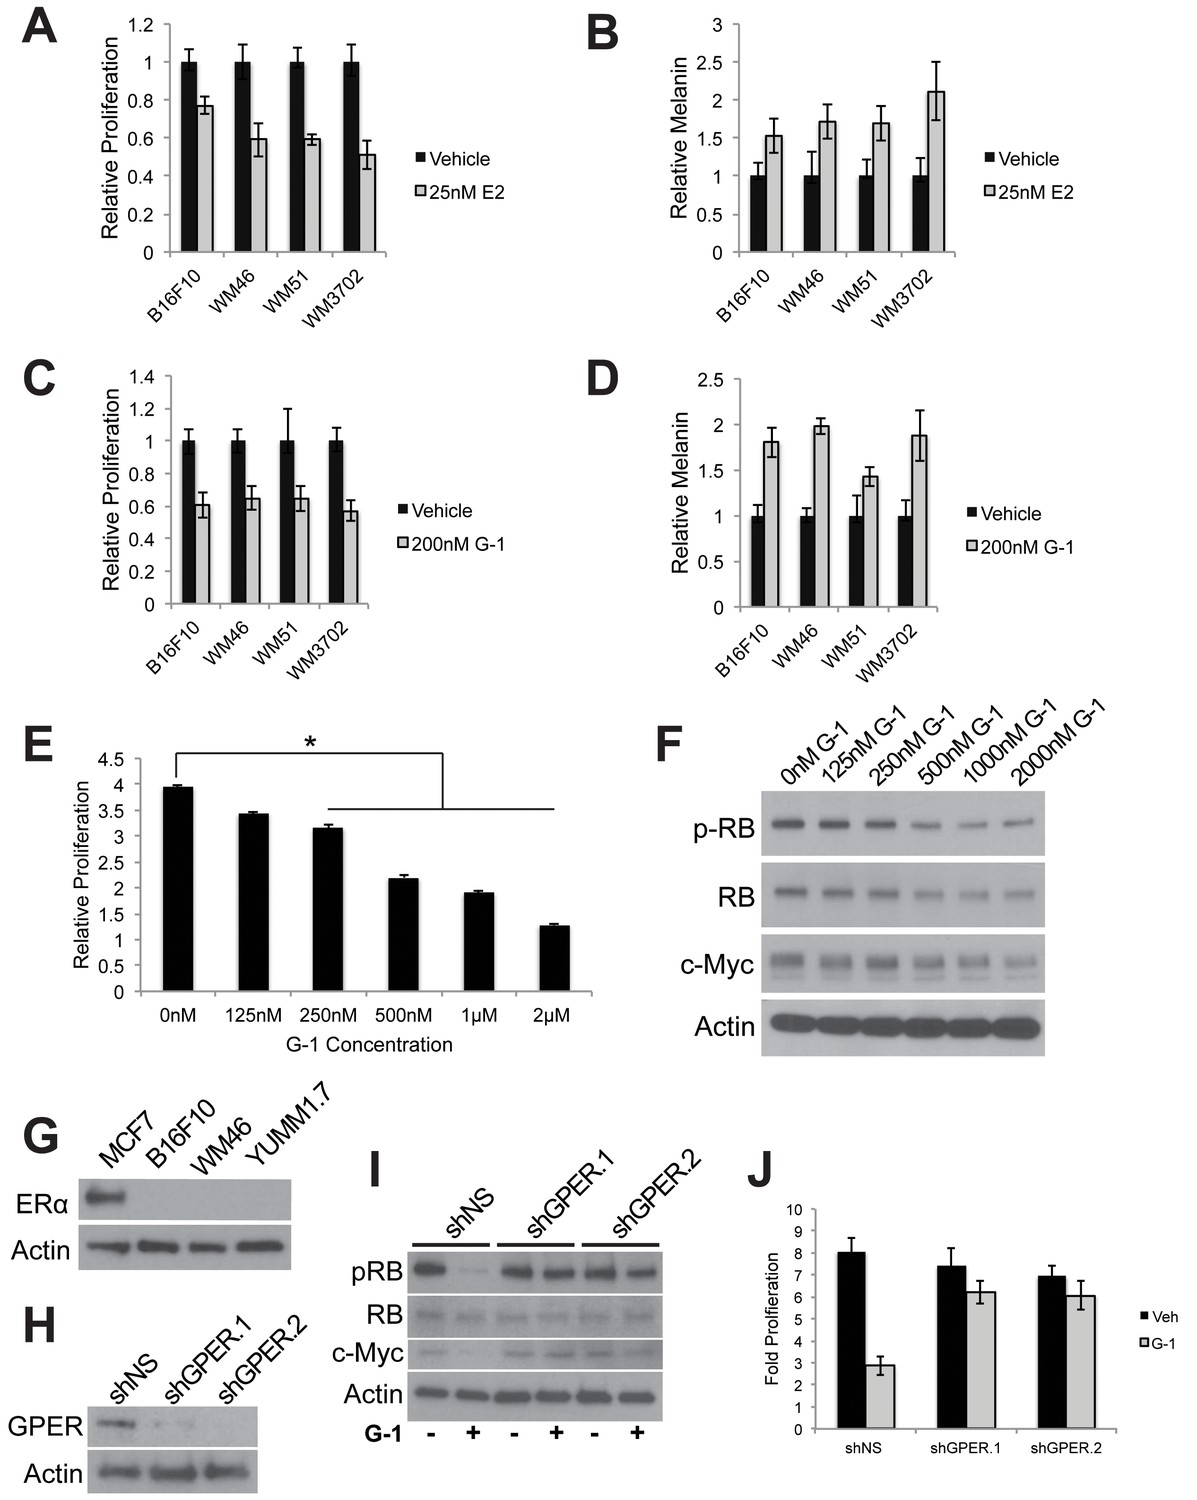
GPER signaling slows proliferation and drives differentiation in mouse and human melanoma.
(A) 5 day proliferation assay of B16F10, WM46 (BRAFV600E), WM51 (BRAFV600E), and WM3702 (NRASQ61L) cells treated with estrogen (E2), n = 3 per group. (B) 5 day melanin assay of B16F10, WM46 (BRAFV600E), WM51 (BRAFV600E), and WM3702 (NRASQ61L) cells treated with E2, n = 3 per group. (C) 5 day proliferation assay of B16F10, WM46 (BRAFV600E), WM51 (BRAFV600E), and WM3702 (NRASQ61L) cells treated with GPER agonist (G-1), n = 3 per group. (D) 5 day melanin assay of B16F10, WM46 (BRAFV600E), WM51 (BRAFV600E), and WM3702 (NRASQ61L) cells treated with G-1, n = 3 per group. (E) 3 day proliferation assay of B16F10 cells treated with a dose response of G-1, * denotes significance One-way ANOVA with Tukey’s multiple comparison test, n = 5 per group. (F) Western blot of B16F10 cells treated for 16 hr with a saturating dose response of G-1. (G) Western blot of melanoma cell lines for ERα with MCF7 breast cancer cells as a positive control. (H) Western blot of YUMM1.7 cells transduced with shRNA’s targeting GPER. (I) Western blot of YUMM1.7 cells transduced with shRNA’s targeting GPER treated with 500 nM G-1. (J) 5 day proliferation assay of YUMM1.7 cells transduced with shRNA’s targeting GPER treated with 500 nM G-1, n = 3 per group. All error bars equal the standard deviation of the samples.
Figure 3 with 1 supplement
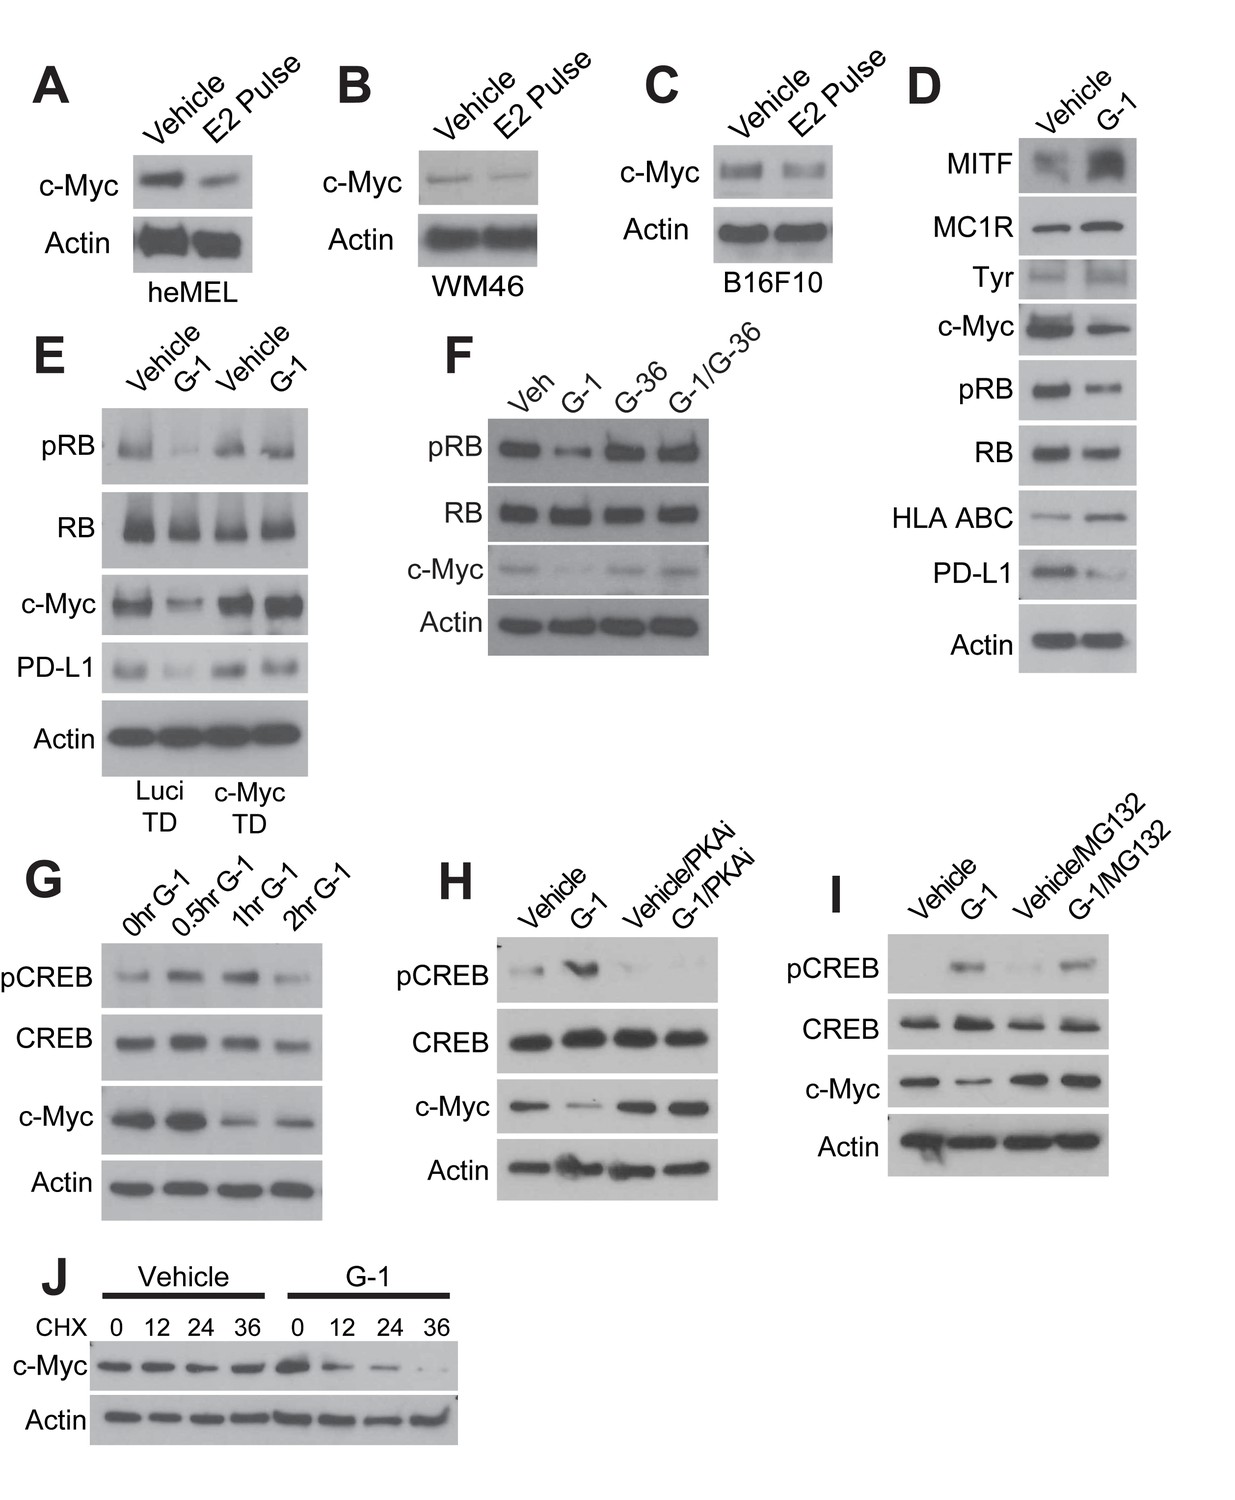
GPER signaling results in loss of c-Myc in melanoma.
(A–C) Western blots of heMel (A), WM46 (B), and B16F10 (C) melanoma transiently treated with 25 nM E2 for 3 days, followed by 4 day withdraw. (D) Western blot of WM46 cells treated with 500 nM G-1 for 16 hr. (E) Western blot of luciferase- or c-Myc transduced WM46 cells treated with 500 nM G-1 for 16 hr. (F) Western blot of WM46 cells treated with 500 nM G-1, 1 μM G-36 (GPER antagonist), or a combination for 16 hr. (G) Western blot of WM46 cells treated with G-1 across a time course. (H) Western blot of WM46 cells treated with G-1, 100 μM PKA inhibitor Rp-8-Br-cAMPS (PKAi), or both for 1 hr. (I) Western blot of WM46 cells treated with 500 nM G-1, 2.5 μM proteasome inhibitor (MG132), or both for 1 hr. (J) Western blot of WM46 cells treated with 10 μg/ml cyclohexamide (CHX) with and without 500 nM G-1.
Figure 3—figure supplement 1
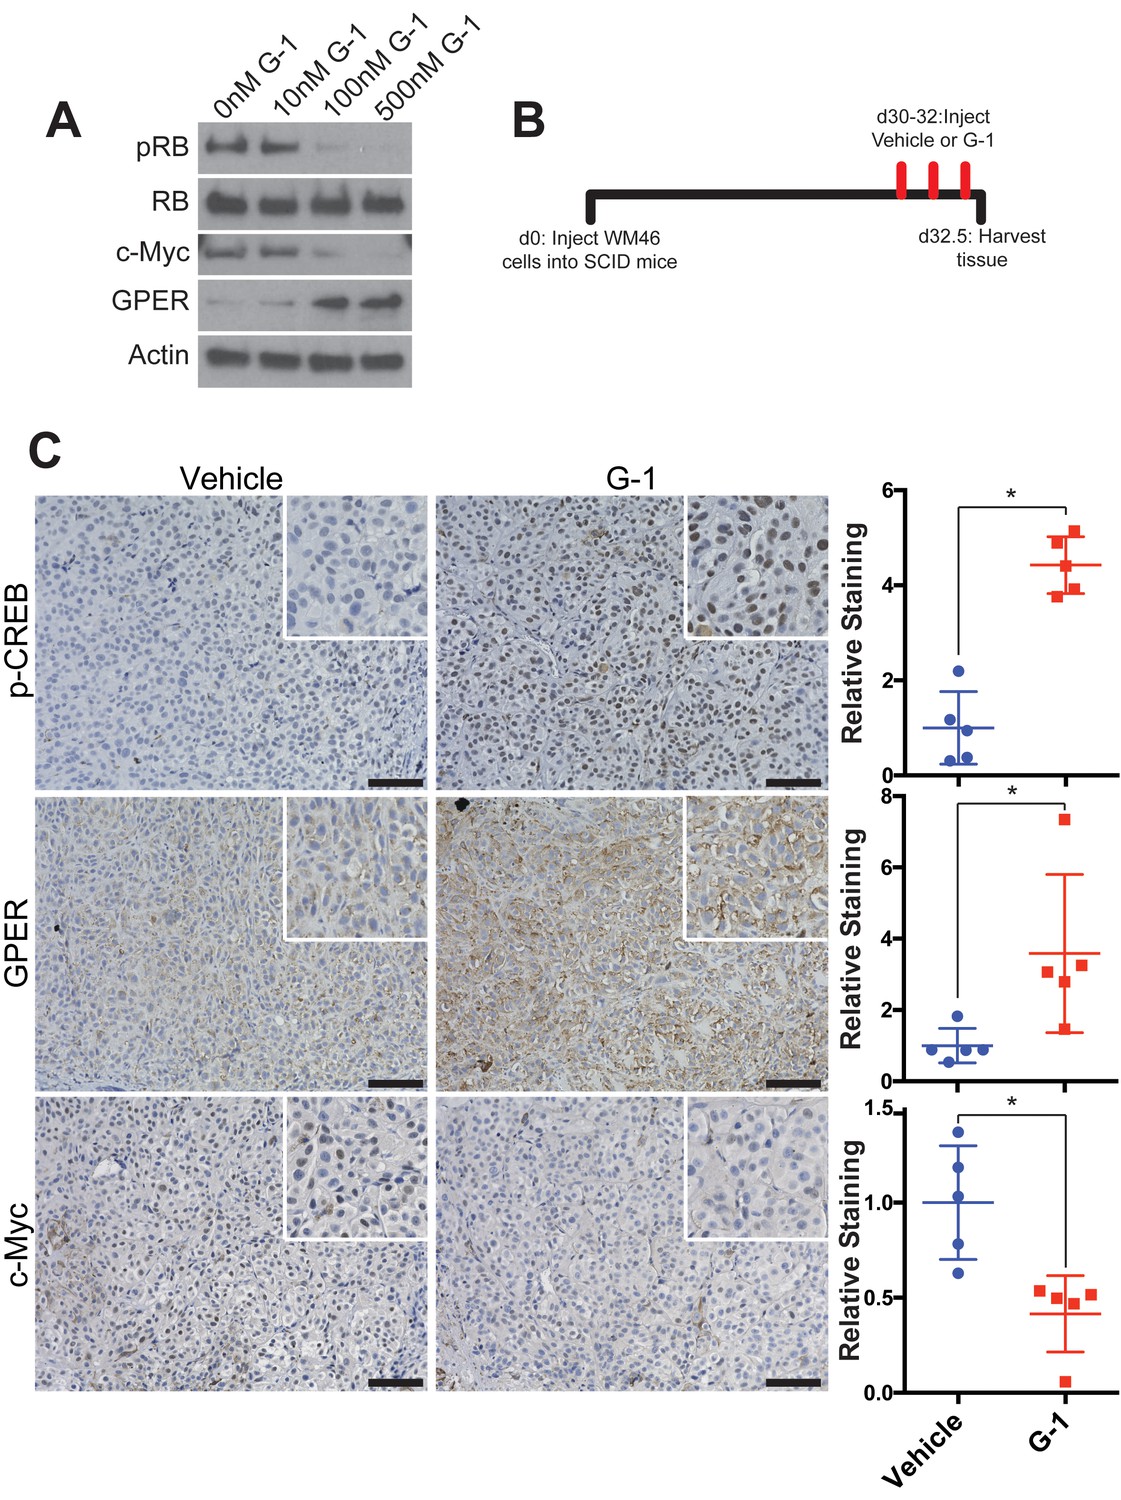
Markers of GPER activation in vivo.
(A) Western blot of WM46 cells treated for 16 hr with increasing concentrations of G-1. (B) Experimental timeline of WM46-bearing mice treated with vehicle or G-1, n = 5 per group. (C) Immunohistochemistry staining of WM46 tumors treated with either vehicle or G-1 with quantification of staining on right, * denotes significance by the Mann-Whitney test. Scale bars = 100 μM.
Figure 4 with 1 supplement
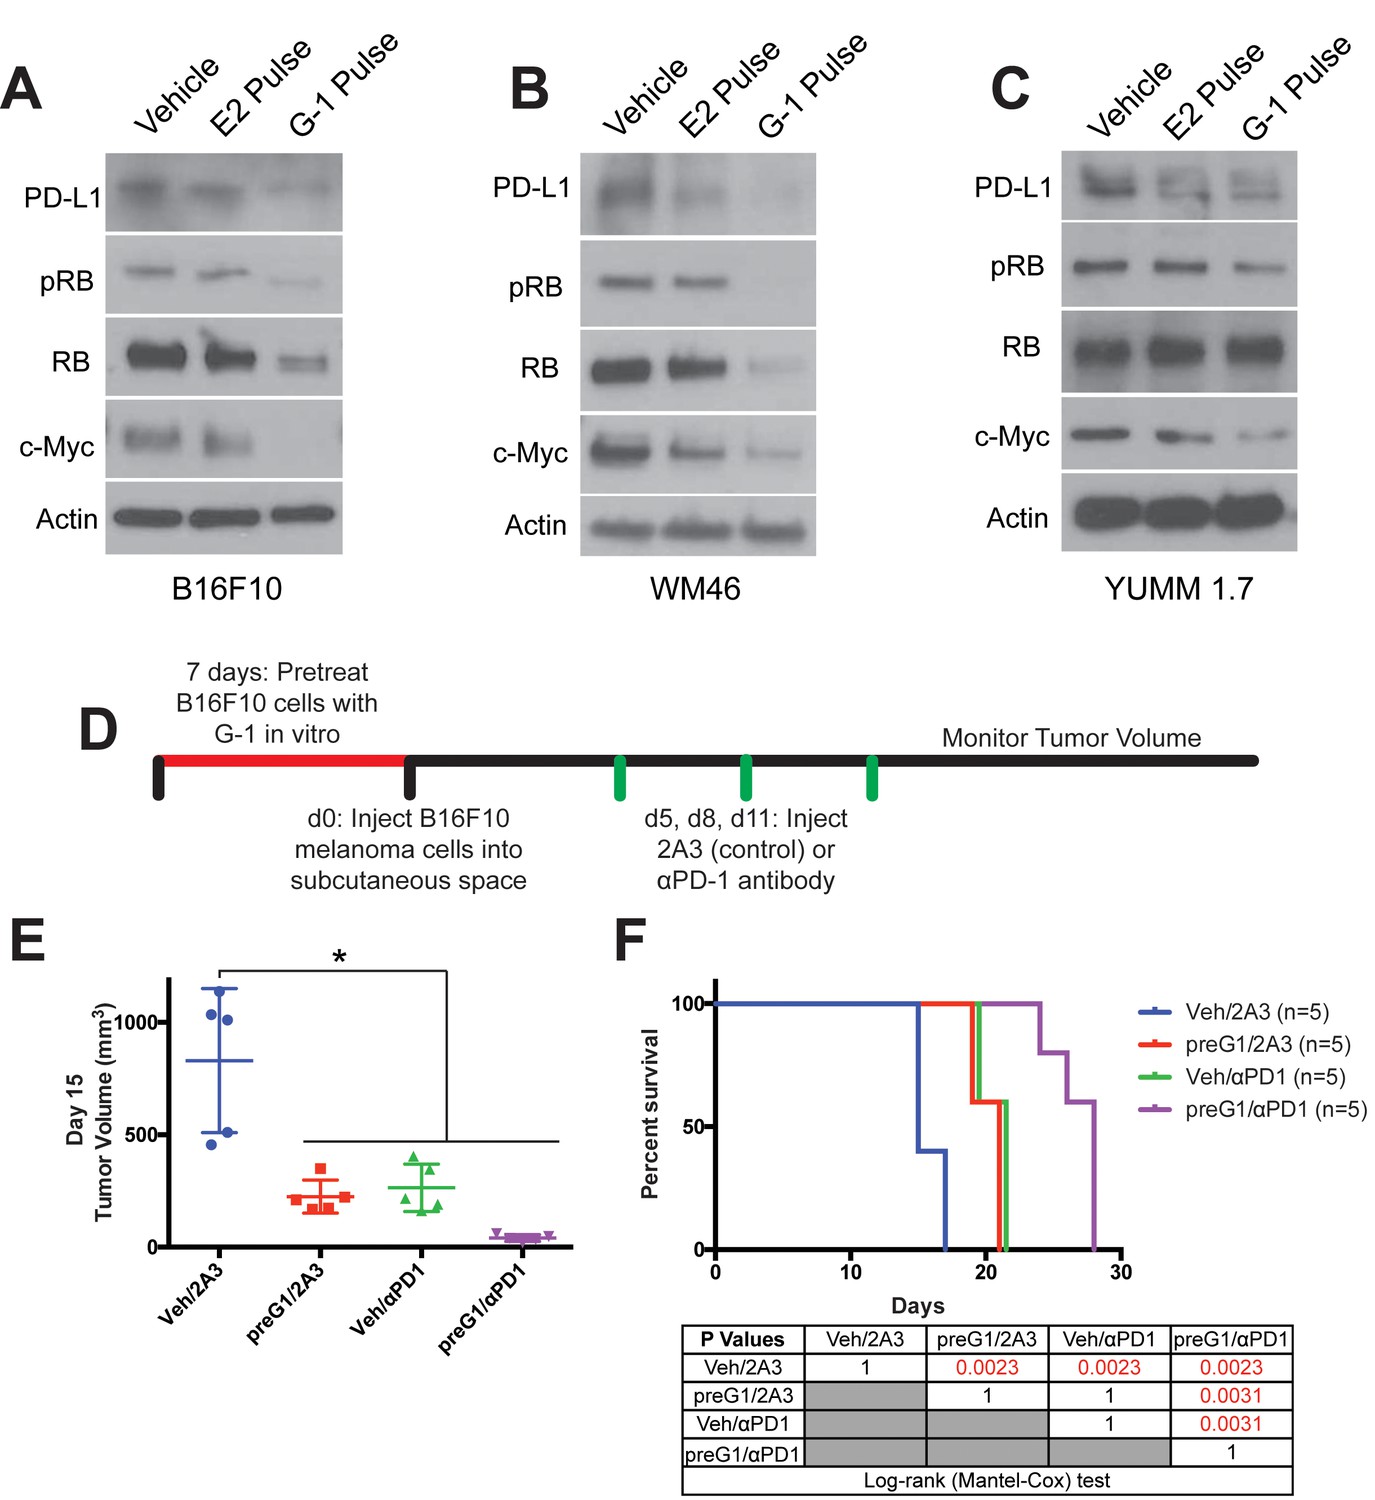
Transient GPER activation inhibits proliferation and augments response to immunotherapy.
(A–C) Western blots of B16F10 (A), WM46 (B), and YUMM 1.7 (C) melanoma cells after transient treatment with a pregnancy-associated concentration of E2 (25 nM) or an optimized concentration of G-1 (500 nM). (D) Experimental timeline of vehicle or 500 nM G-1 pre-treatment of B16F10 cells followed by treatment with either αPD-1 antibody or isotype antibody control (2A3), n = 5 per group. (E) Tumor volumes of treatment groups at Day 14, * denotes significance One-way ANOVA with Tukey’s multiple comparison test. (F) Survival curve of mice with tumors pre-treated with vehicle or G-1, followed by isotype antibody control (2A3) or αPD-1 antibody. Significance between groups by the Log-Rank (Mantel-Cox) test is listed in the table below.
Figure 4—figure supplement 1
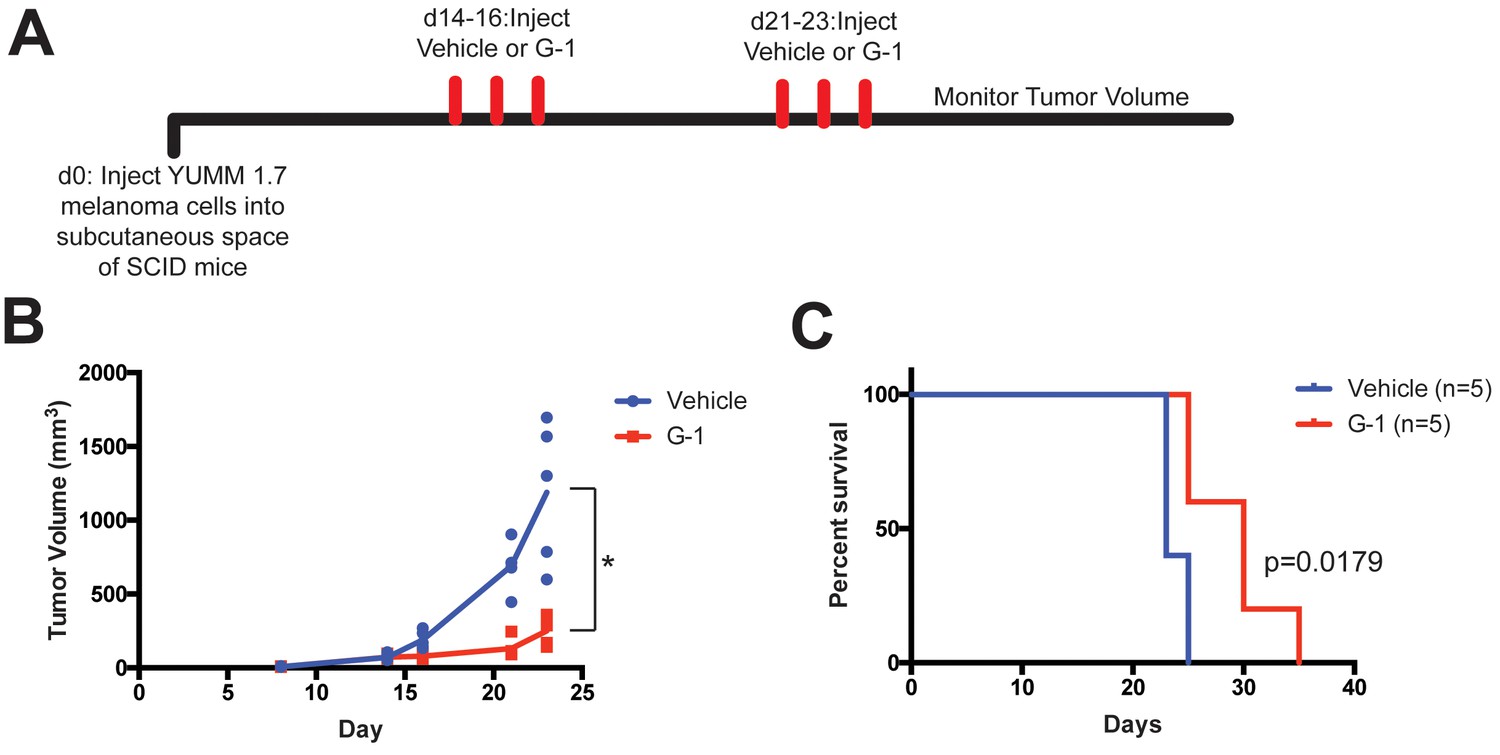
GPER activation inhibits YUMM1.7 melanoma in SCID mice.
(A) Experimental outline of YUMM1.7-bearing SCID mice treated with vehicle or G-1, n = 5. (B) Tumor volumes over time in two treatment groups, * denotes significance by the Mann-Whitney test. (C) Survival curve of YUMM1.7-bearing mice treated with vehicle or G-1, significance by the Log-Rank (Mantel-Cox) test.
Figure 5 with 1 supplement
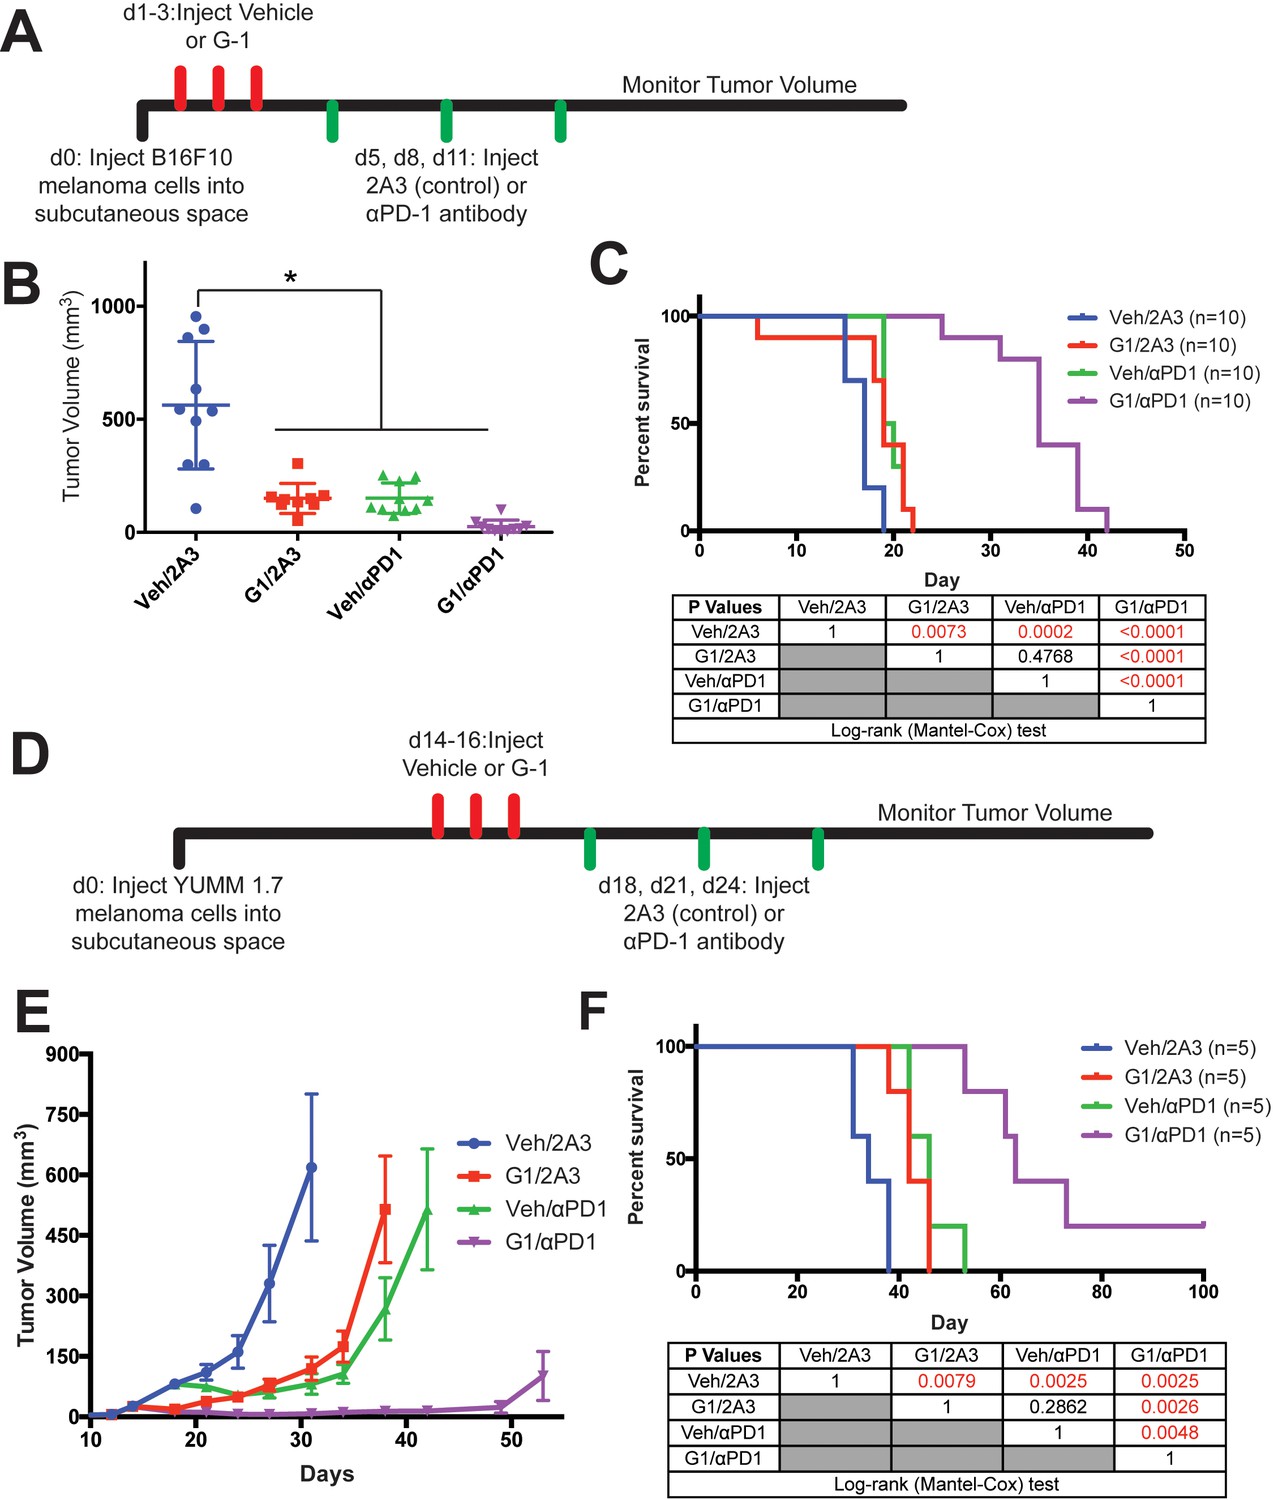
Treatment of melanoma-bearing mice with G-1 and αPD-1 immunotherapy dramatically extends survival.
(A) Experimental timeline of B16F10-bearing mice treated with vehicle or G-1, as well as αPD-1 antibody or isotype antibody control (2A3), n = 10 per group. (B) Tumor volumes of treatment groups at Day 14, * denotes significance One-way ANOVA with Tukey’s multiple comparison test. (C) Survival curve of mice treated with vehicle or G-1, as well as isotype antibody control (2A3) or αPD-1 antibody. Significance between groups by the Log-Rank (Mantel-Cox) test is listed in the table below. (D) Experimental outline of YUMM1.7-bearing mice treated with vehicle or G-1, as well as isotype antibody control (2A3) or αPD-1 antibody. Treatment was started at day 14 after tumors reached 4–5 mm in diameter. n = 5 per group. (E) Tumor volumes over time of treatment groups. (F) Survival curve of mice treated with vehicle or G-1, as well as αPD-1 antibody or isotype antibody control (2A3). Significance between groups by the Log-Rank (Mantel-Cox) test is listed in the table below.
Figure 5—figure supplement 1

G-1 treatment in vivo alters tumor- infiltrating immune cells.
(A) Experimental timeline for vehicle or G-1 treatment of YUMM 1.7 melanoma-bearing mice. (B) Heatmap summarizing immune profiling across biological replicates, n = 5 per group, * denotes significance by two-way ANOVA assuming each immune population is an independent measurement of immune activation. (C) Quantification of individual immune populations from (B), n = 5 per group. (D) Immunohistochemistry highlighting CD8+ T cells in central or peripheral edge regions of YUMM 1.7 tumors treated with vehicle or G-1. Quantification of staining on right, n = 3 per group, scale bars = 50 μM.
Figure 6
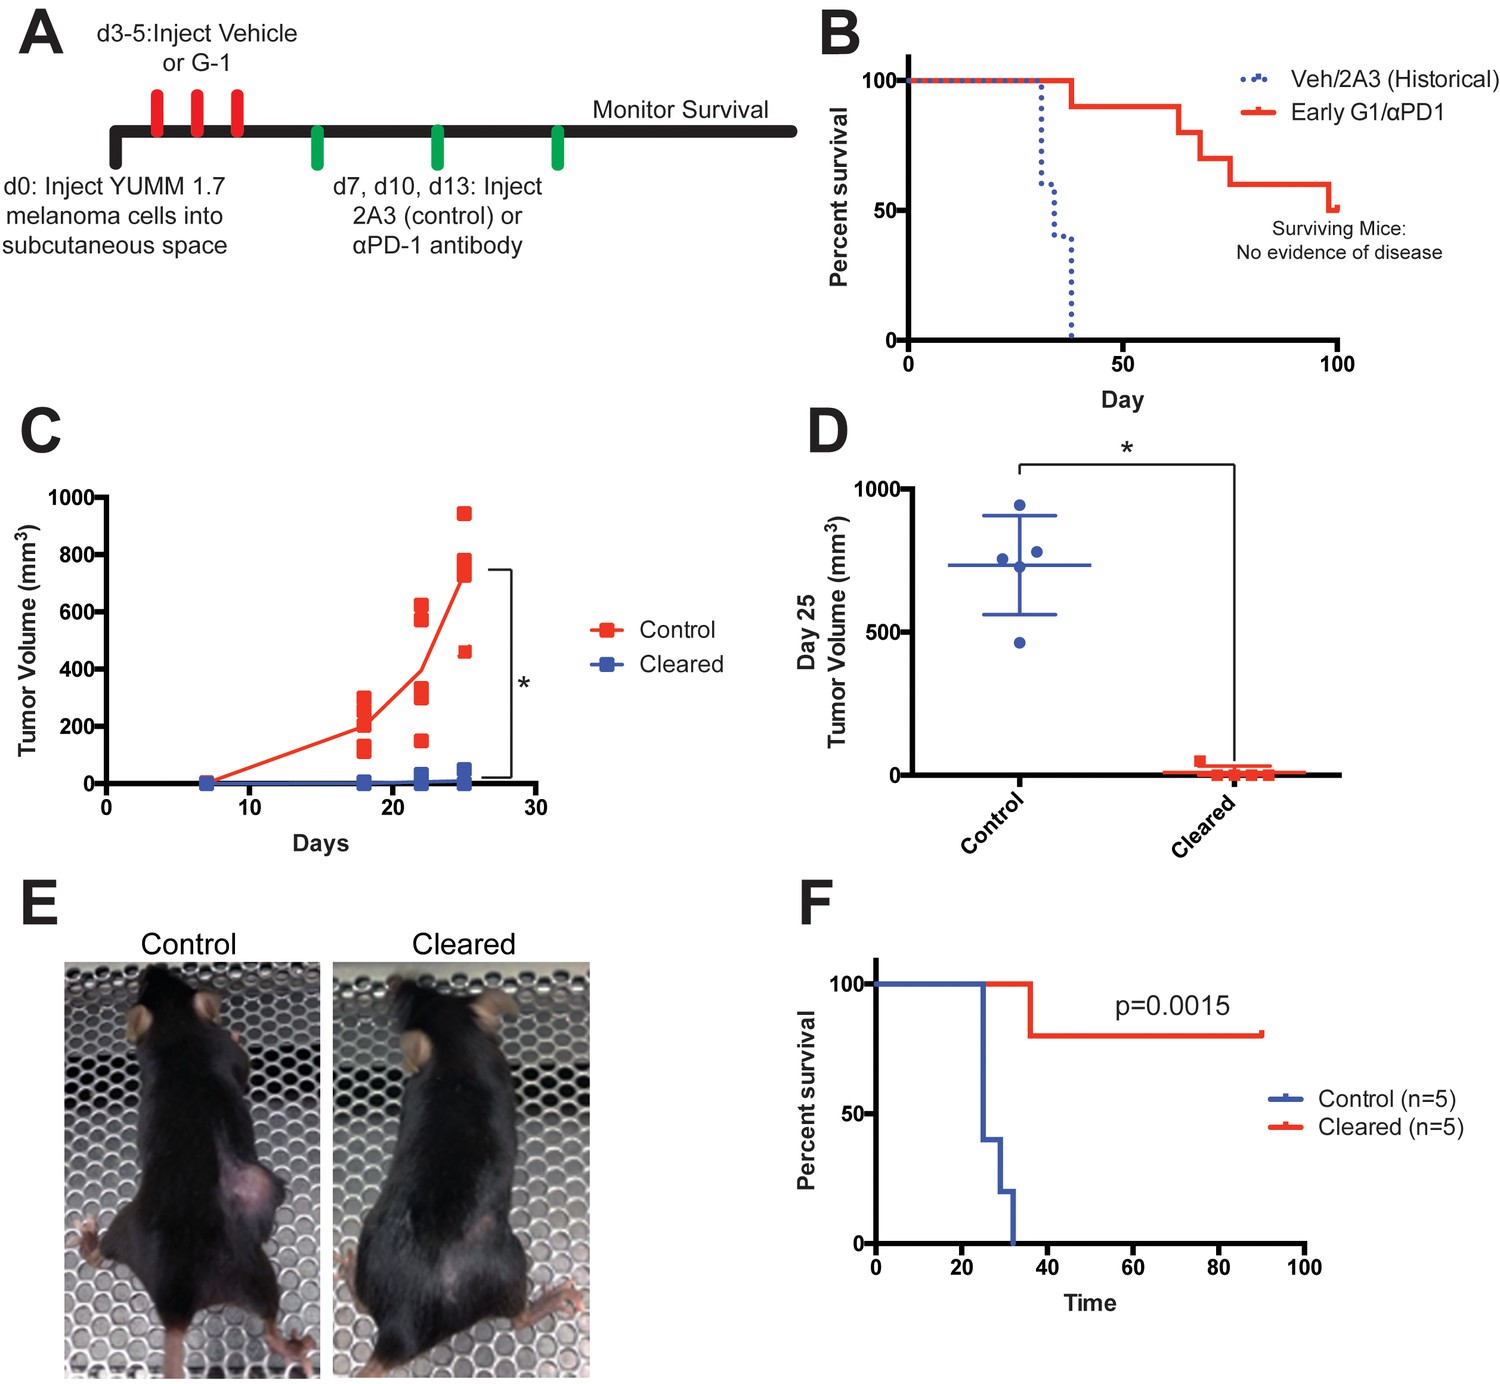
Tumor clearance with G-1 and αPD-1 combination treatment is associated with immune memory.
(A) Experimental outline of YUMM1.7-bearing mice treated with vehicle or G-1 and αPD-1 antibody, treatment was started at day 3, n = 10. (B) Survival curve of mice treated G-1 and αPD-1 antibody compared to historical controls, five mice had no evidence of disease at day 100 and were considered ‘cleared’. (C) Control and Cleared mice were challenged with YUMM 1.7 tumors, tumor volumes were measured over time, *denotes significance by 2way-ANOVA. (D) Tumor volumes of Control and Cleared mice on day 25, * denotes significance by the Mann-Whitney test. (E) Representative images of Control and Cleared mice on day 25. (F) Survival curve of Control and Cleared mice challenged with YUMM1.7 tumors, significance by the Log-Rank (Mantel-Cox) test.
Figure 7
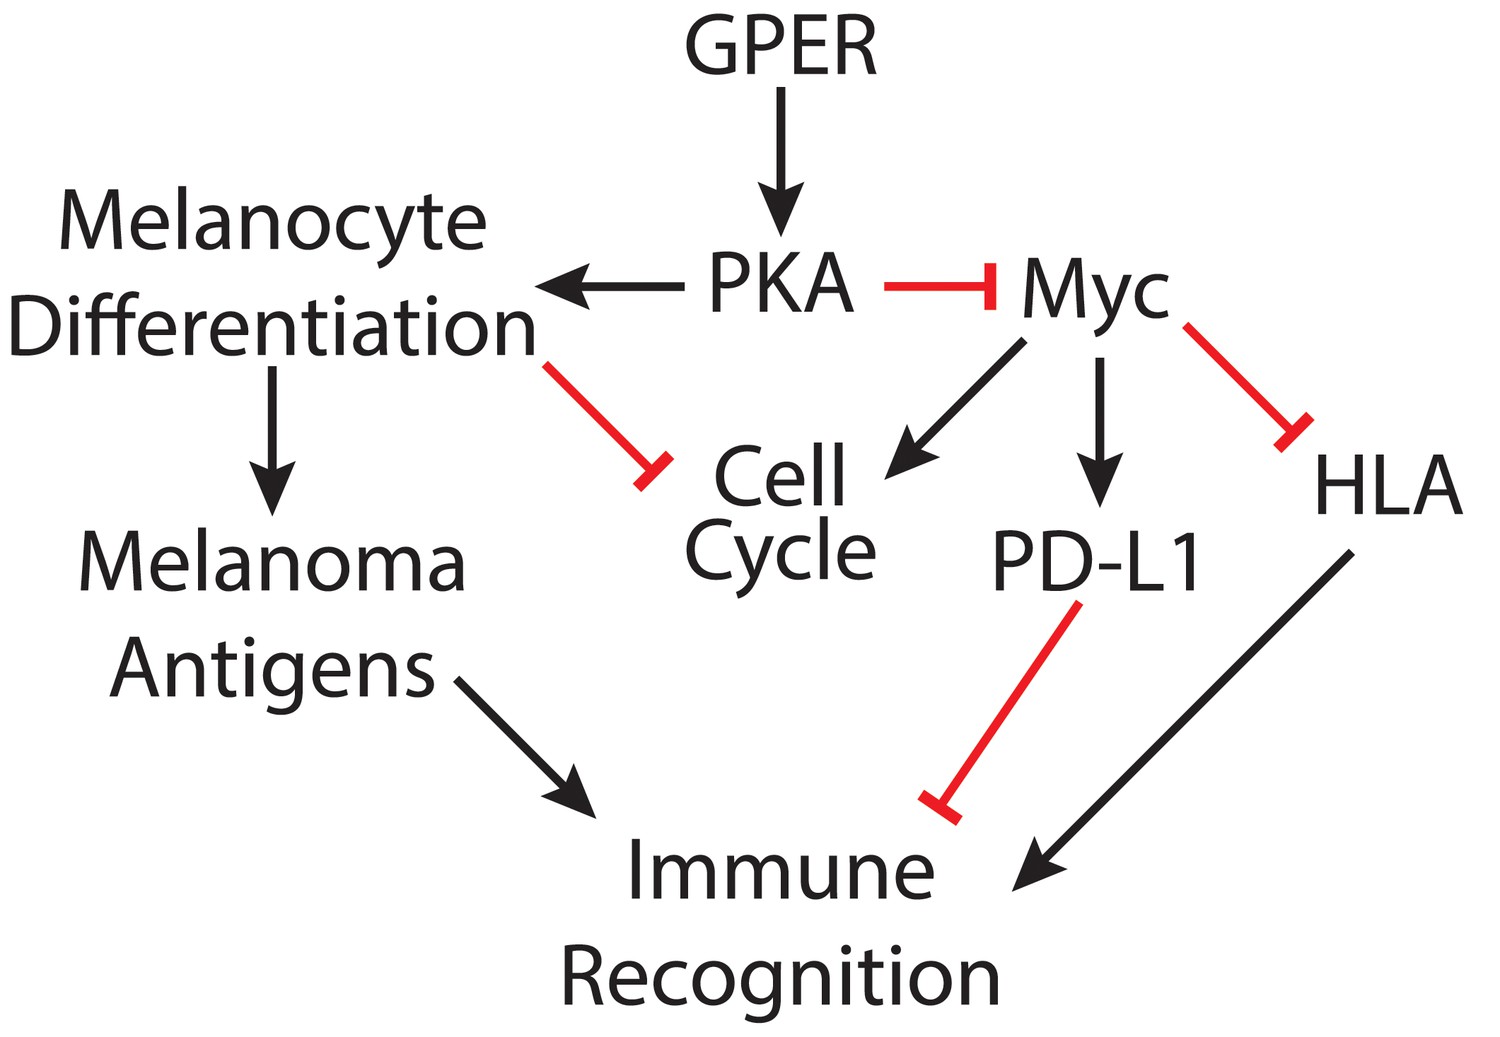
Model depicting mechanisms through which GPER signaling may antagonize melanoma.
https://doi.org/10.7554/eLife.31770.013Additional files
-
Transparent reporting form
- https://doi.org/10.7554/eLife.31770.014
Download links
A two-part list of links to download the article, or parts of the article, in various formats.
Downloads (link to download the article as PDF)
Open citations (links to open the citations from this article in various online reference manager services)
Cite this article (links to download the citations from this article in formats compatible with various reference manager tools)
Activation of G protein-coupled estrogen receptor signaling inhibits melanoma and improves response to immune checkpoint blockade
eLife 7:e31770.
https://doi.org/10.7554/eLife.31770


