Energetics and conformational pathways of functional rotation in the multidrug transporter AcrB
- RIKEN Advanced Institute for Computational Science, Japan
- JST PRESTO, Japan
- Yokohama City University, Japan
- The University of Tokyo, Japan
- Nippon Medical School, Japan
- Tokyo Institute of Technology, Japan
Figures
Figure 1
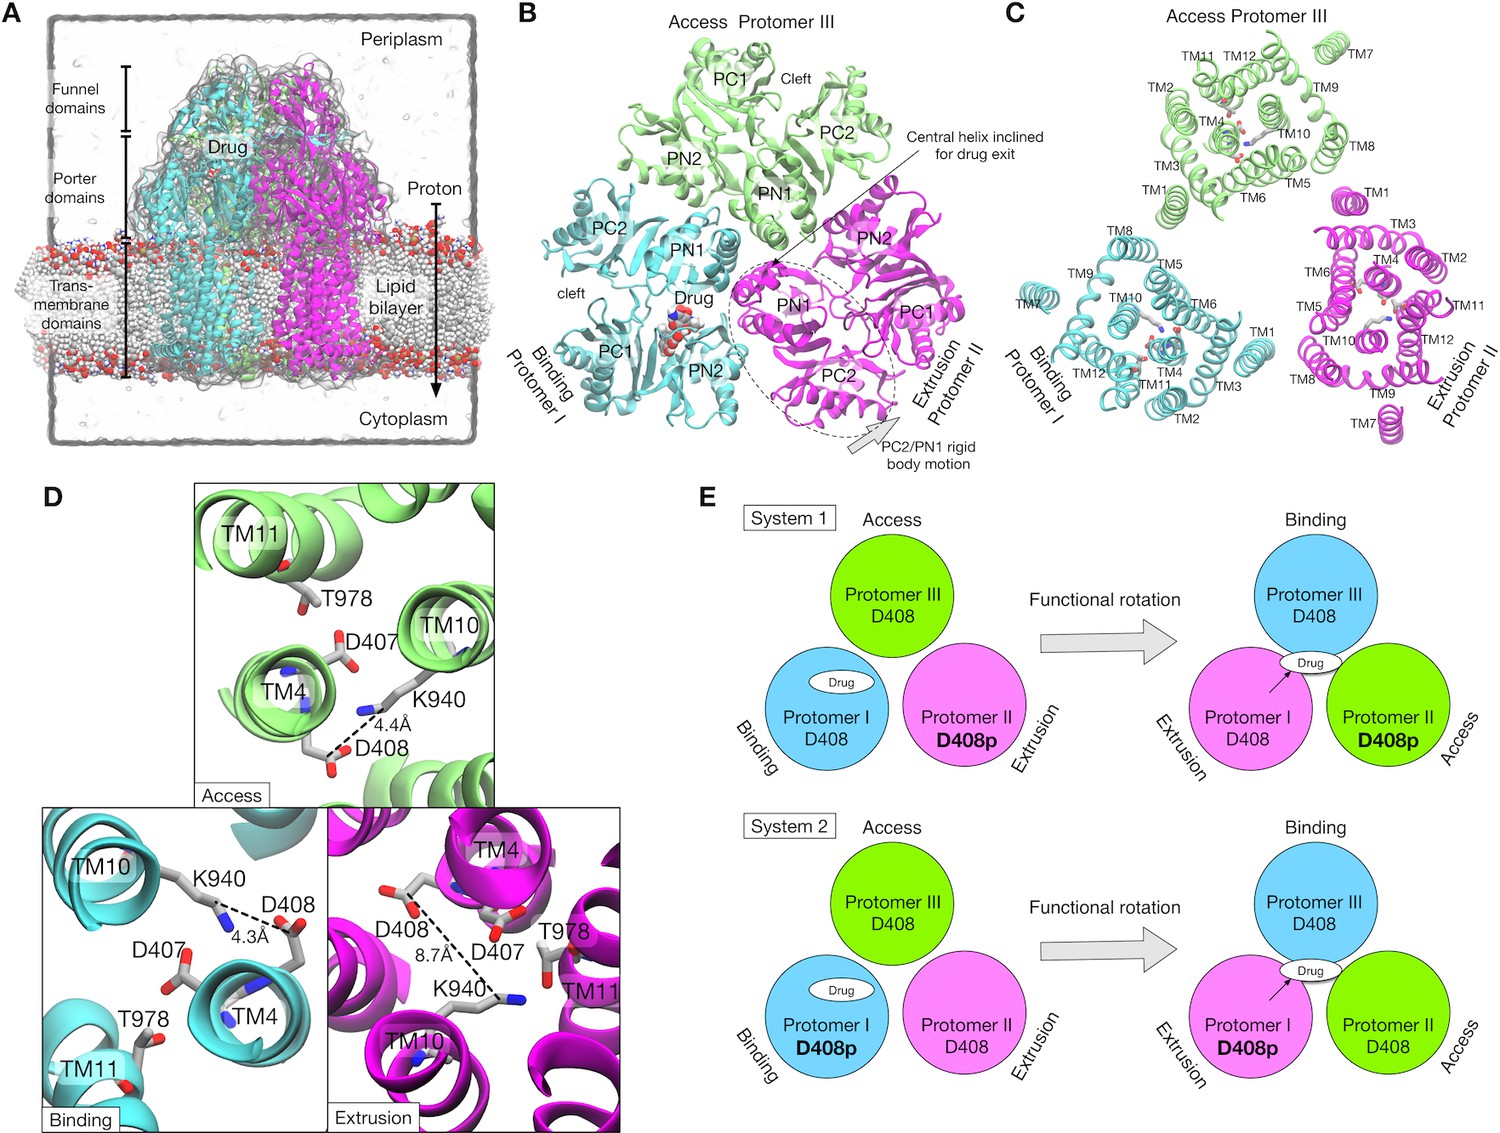
Crystal structure of AcrB and simulation setup.
(A) Simulation box and a side view of AcrB embedded in a palmitoyloleoyl phosphatidylethanolamine (POPE) lipid bilayer. A drug (minocycline) is represented by spheres. (B) Porter domains of the crystal structure viewed from the cell exterior. The protomers in cyan, magenta and lime represent the Binding, Extrusion, and Access states, respectively. (C) The transmembrane domain viewed from the cell exterior. Key residues that are related to proton translocation are represented by sticks. (D) Close-up view of the key residues. (E) Schematics of the simulation systems. The protonated D408 is denoted by D408p. System 1 has D408p in the Protomer II. System 2 has D408p in the Protomer I.
Figure 2 with 4 supplements
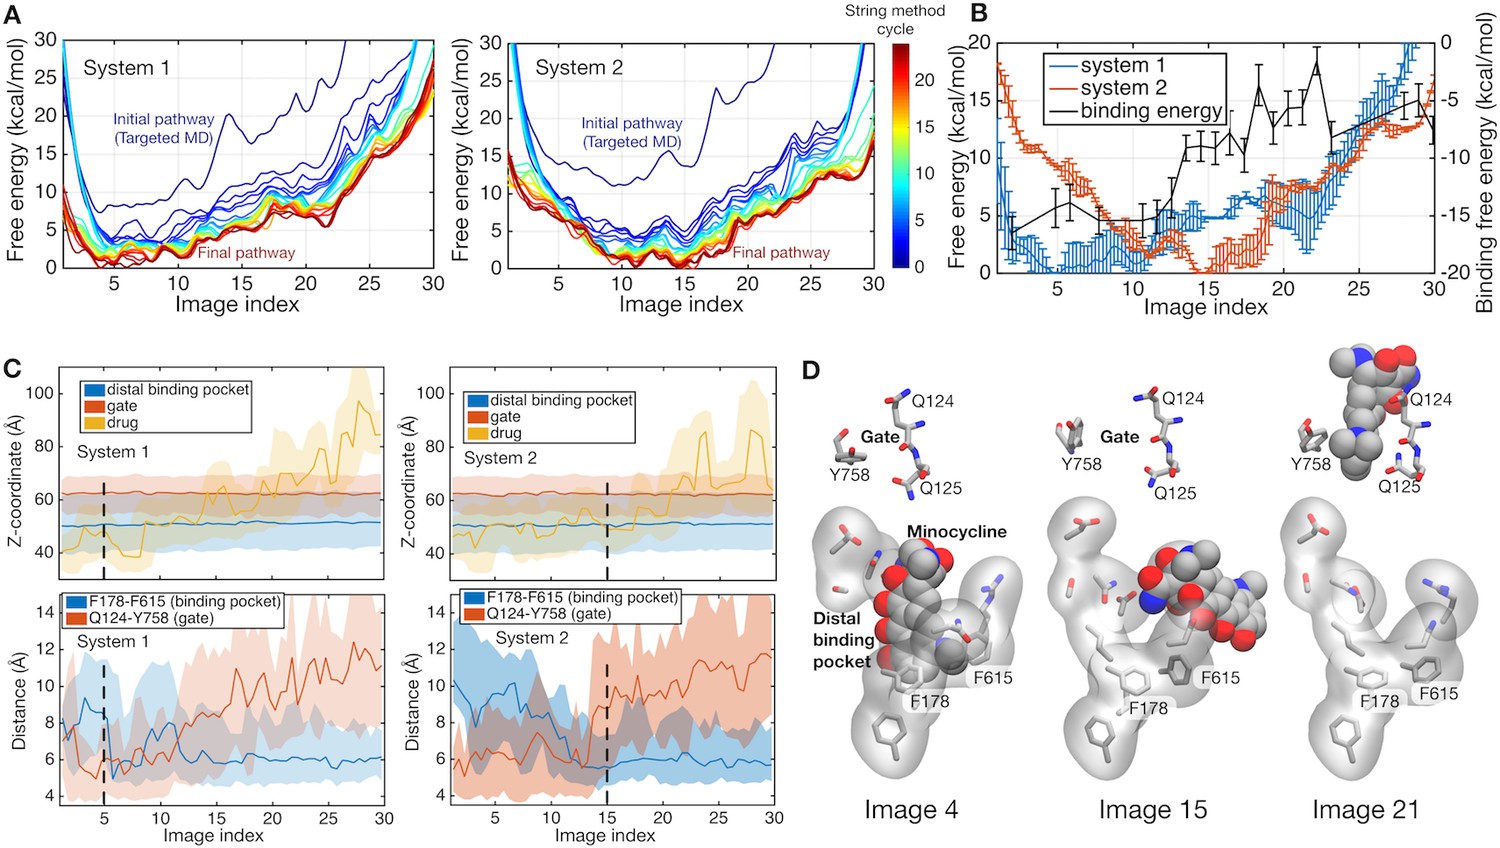
Energetics of functional rotation for two different protonation states.
(A) Free energies of the whole system along the conformational pathways obtained by the string method for systems 1 and 2. Image 1 represents the BEA state, whereas image 30 corresponds to the EAB state (see text for the three-letter notation). Line color represents the cycle of the string method calculation. The initial pathway (obtained by the targeted MD) is indicated by a dark blue line, whereas the final converged pathway is in dark brown. (B) Comparison of the final converged pathways for systems 1 (blue) and 2 (red). Free energies are referenced to their minima (against the left y-axis). The black line indicates the absolute binding free energy of the drug for each image of system 2 (against the right y-axis). Statistical uncertainties are represented by error bars. (C) Z-coordinate (perpendicular to the membrane) of binding pocket residues, gate residues, and drug atoms, and distances between F178 and F615 and between Q124 and Y758 are shown. Light color regions represent minimum and maximum ranges, and dark lines the average. The positions of minima in system 1 and 2 are indicated by black broken lines. (D) Representative structures of the binding pocket and gate residues (sticks) and of the drug (spheres) are shown at images 4, 15 and 21.
Figure 2—figure supplement 1
Collective variables used for the string method.
Atoms involved in the collective variables are colored cyan, magenta and lime. (A) Side-view of trimeric AcrB structure. (B) Top and close-up view of the key residues in the transmembrane domain. Cγ-atoms of D407 and D408 and Cε-atoms of K940, which are also included in the collective variables, are represented by spheres.
Figure 2—figure supplement 2
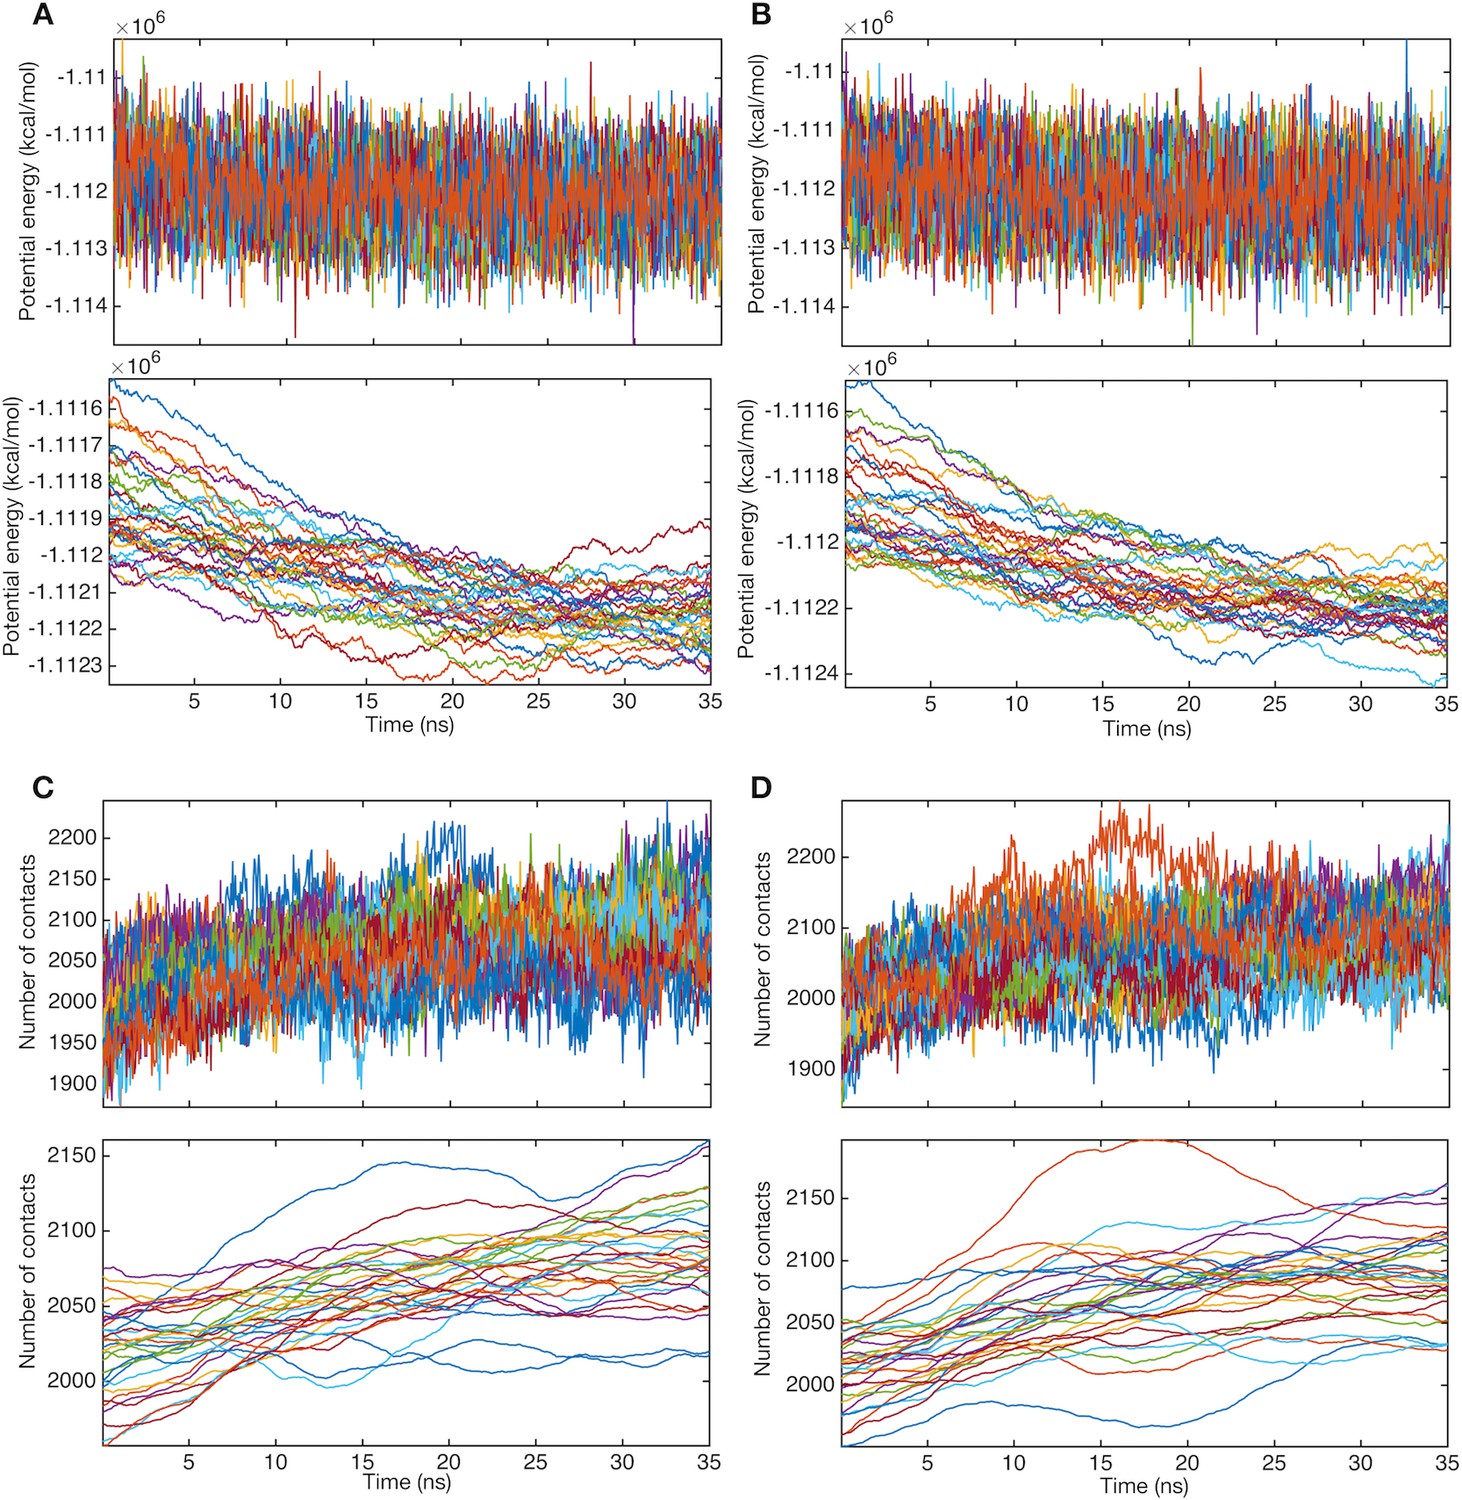
Relaxation of structures before string method calculation.
Time courses of potential energies and their moving averages (window of 5 ns) for (A) system 1 and (B) system 2. Line colors represent systems of different images. Time courses of the numbers of contacts between the trimer TM domain and POPE molecules and their moving averages (window of 5 ns) for (C) system 1 and (D) system 2.
Figure 2—figure supplement 3
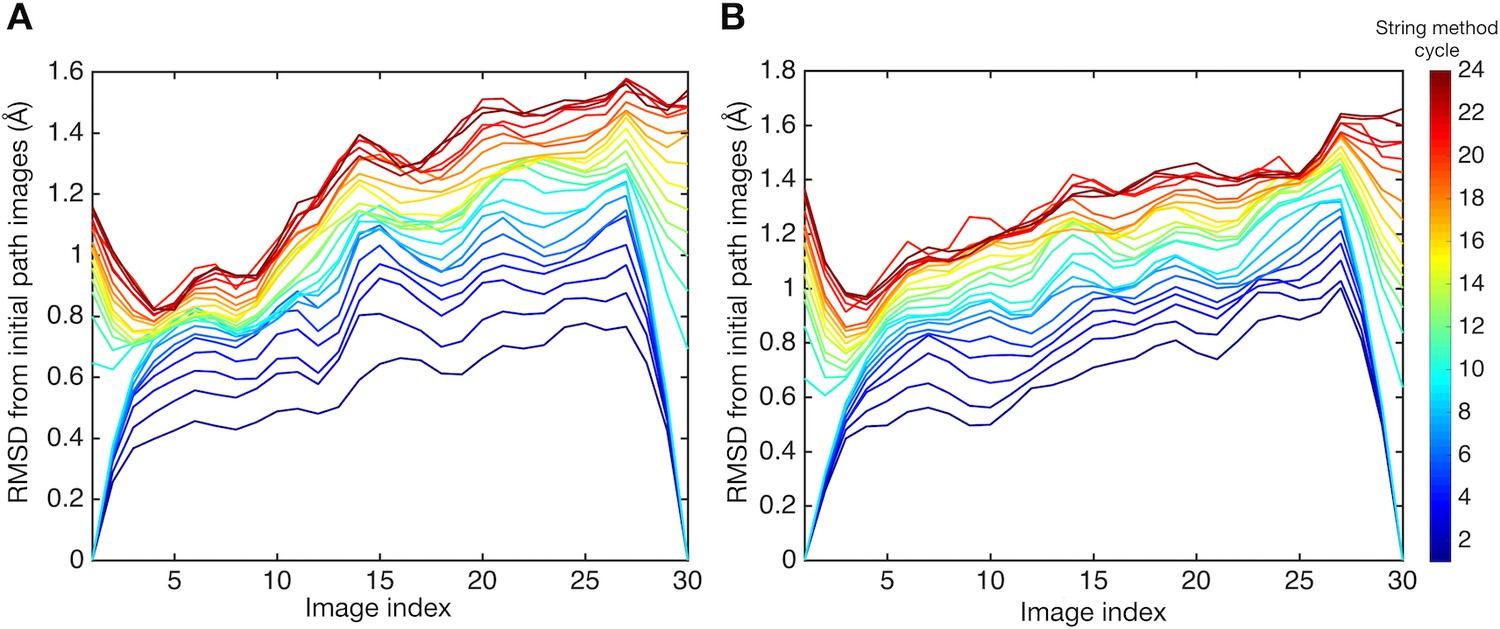
Root mean square displacements (RMSDs) of images from those of the initial pathway.
RMSDs are plotted for (A) system 1 and (B) system 2. Line colors represent the cycle of the string method calculation. RMSDs were calculated using collective variables.
Figure 2—figure supplement 4
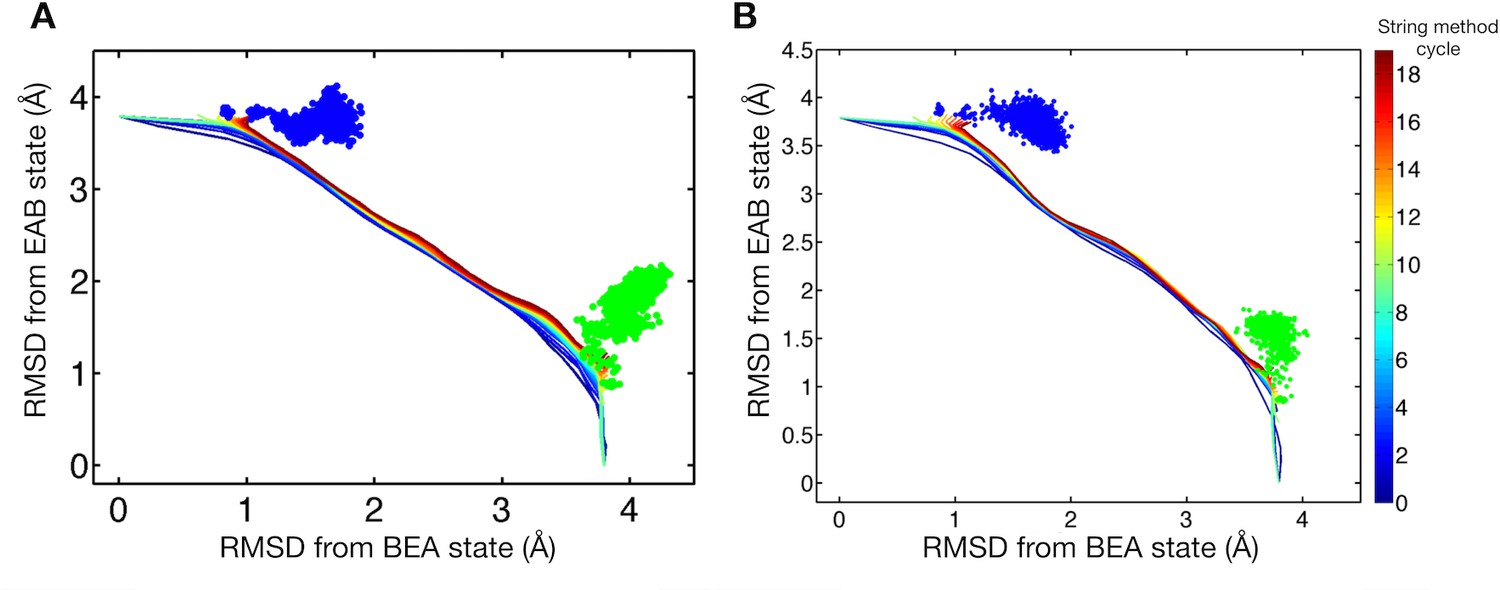
Comparison of string method pathways and brute-force simulations.
(A) String method pathways and brute-force simulations of 50 ns are plotted in the RMSDs from the trimeric BEA and EAB states for system 1. Colored lines represent the string method pathways where color corresponds to the cycle of the string method calculation. Brute-force simulations are indicated by green (started from the initial BEA state) and blue (started from the final EAB state) dots. (B) Same for system 2.
Figure 3 with 5 supplements
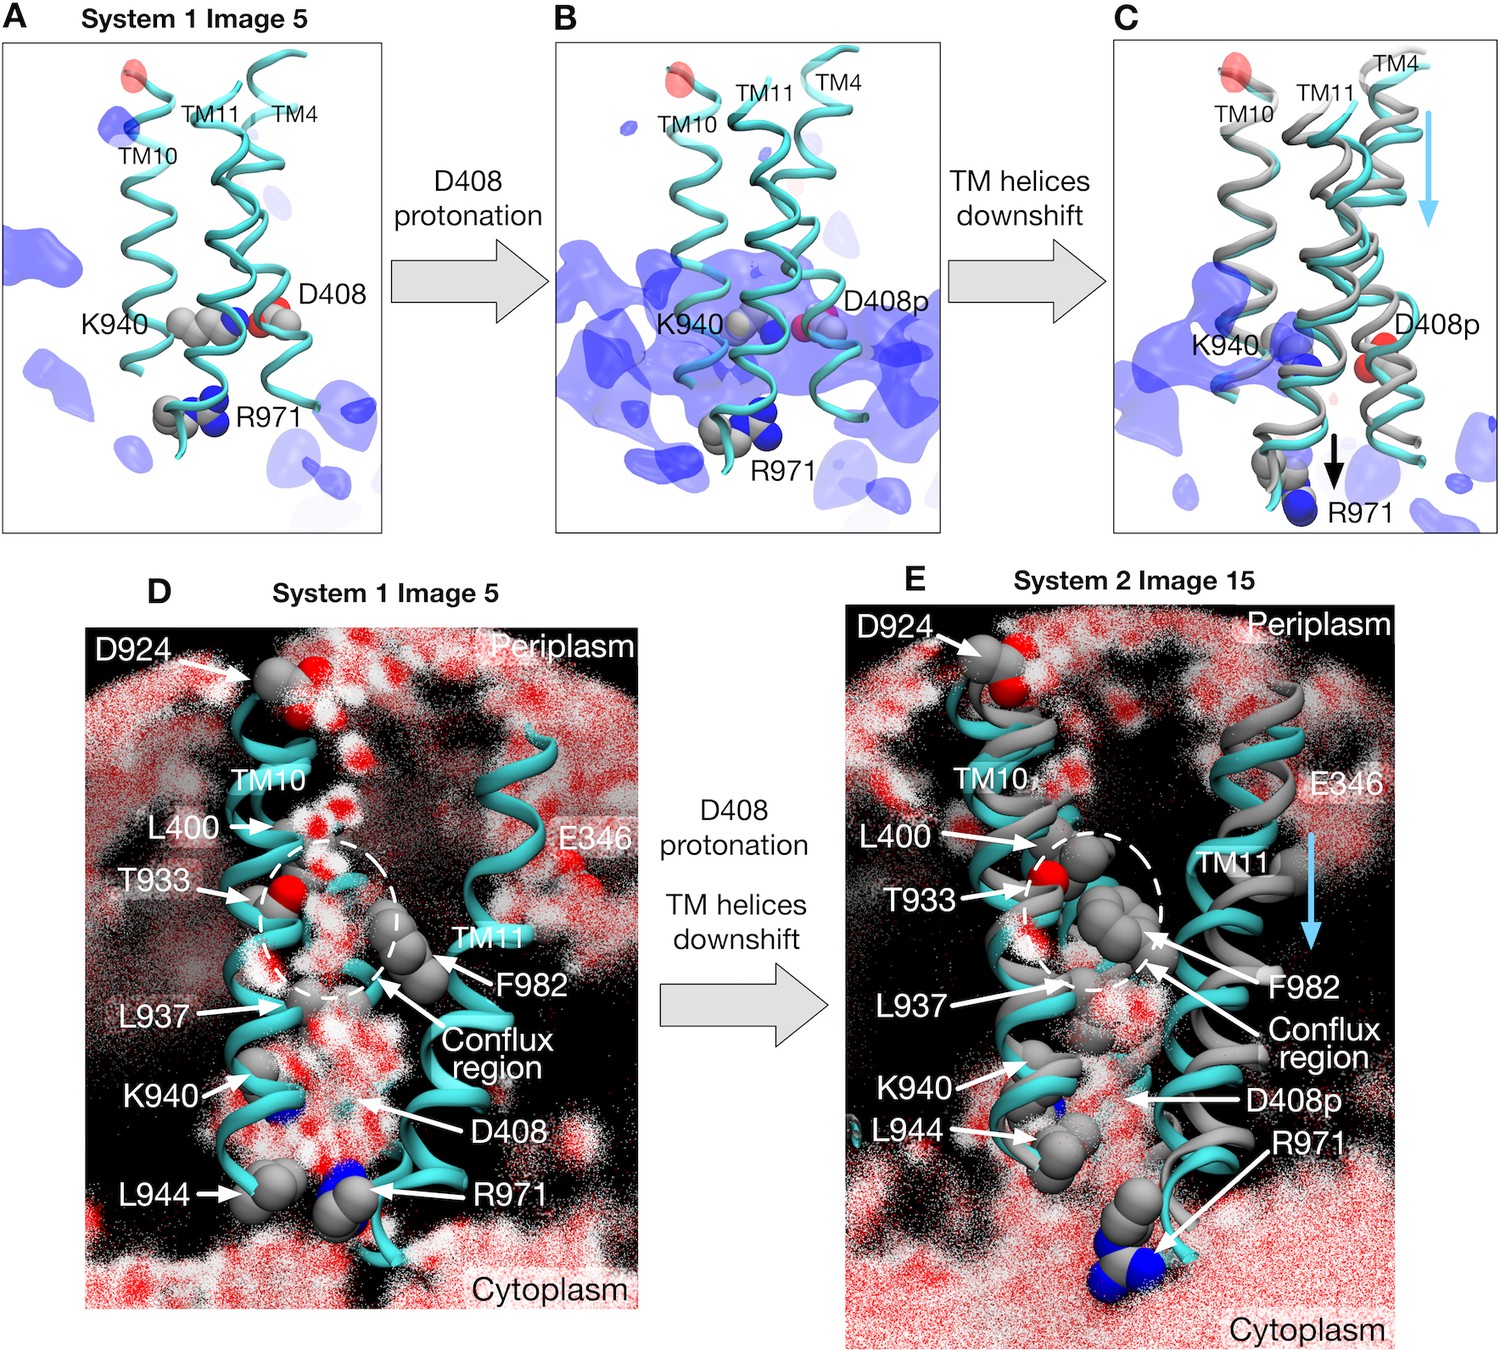
Electrostatic features and water molecule distributions in the transmembrane region.
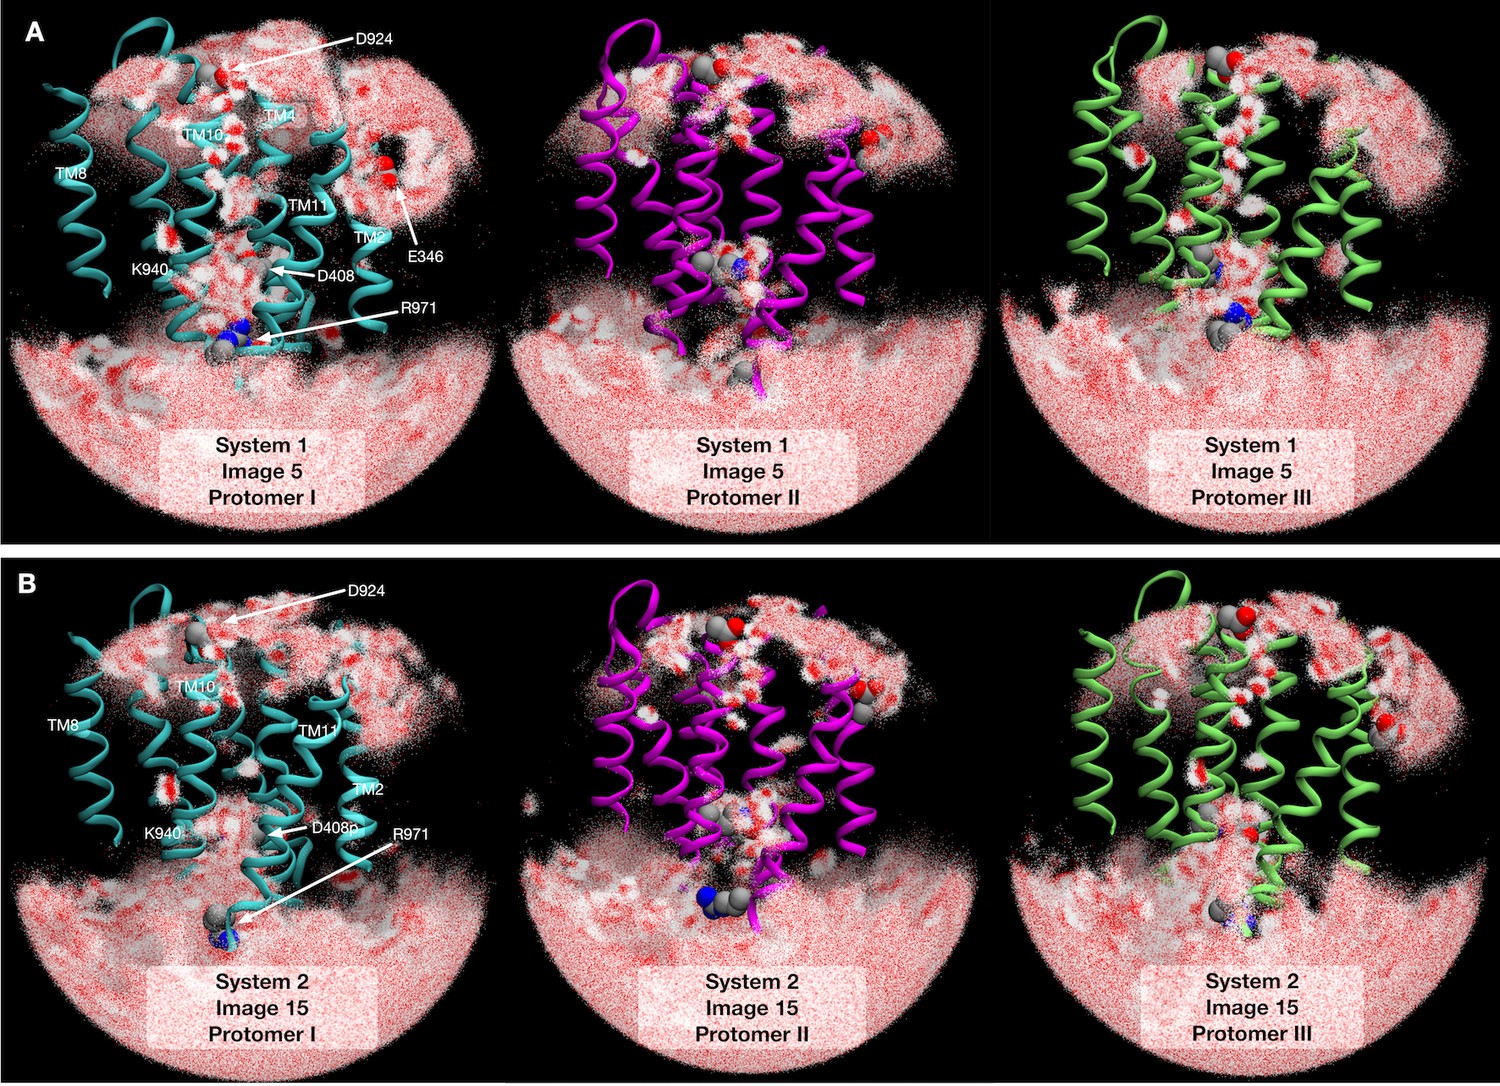
(A) Representative structure of transmembrane helices 4, 10 and 11 for protomer I (cyan) of system 1 at image 5 drawn with cartoons. Deprotonated/protonated D408, K940 and R971 are represented by spheres. Averaged electrostatic potential isosurfaces are drawn in blue (corresponding to the isovalue of 0.06 kcal/mol) and red (−0.06 kcal/mol). (B) After transforming the protonation state toward system 2. (C) System 2 at image 15. For comparison, the helices of image 5 are drawn in gray. (D) 2500 snapshots of water atoms are drawn with red points (oxygen) and white points (hydrogen) for protomer I of system 1 at image 5. Key residues (L400, D924, T933, L937, K940, F982 and R971) are drawn with spheres. (E) System 2 at image 15. For comparison, the helices of image 5 are drawn in gray.
Figure 3—figure supplement 1
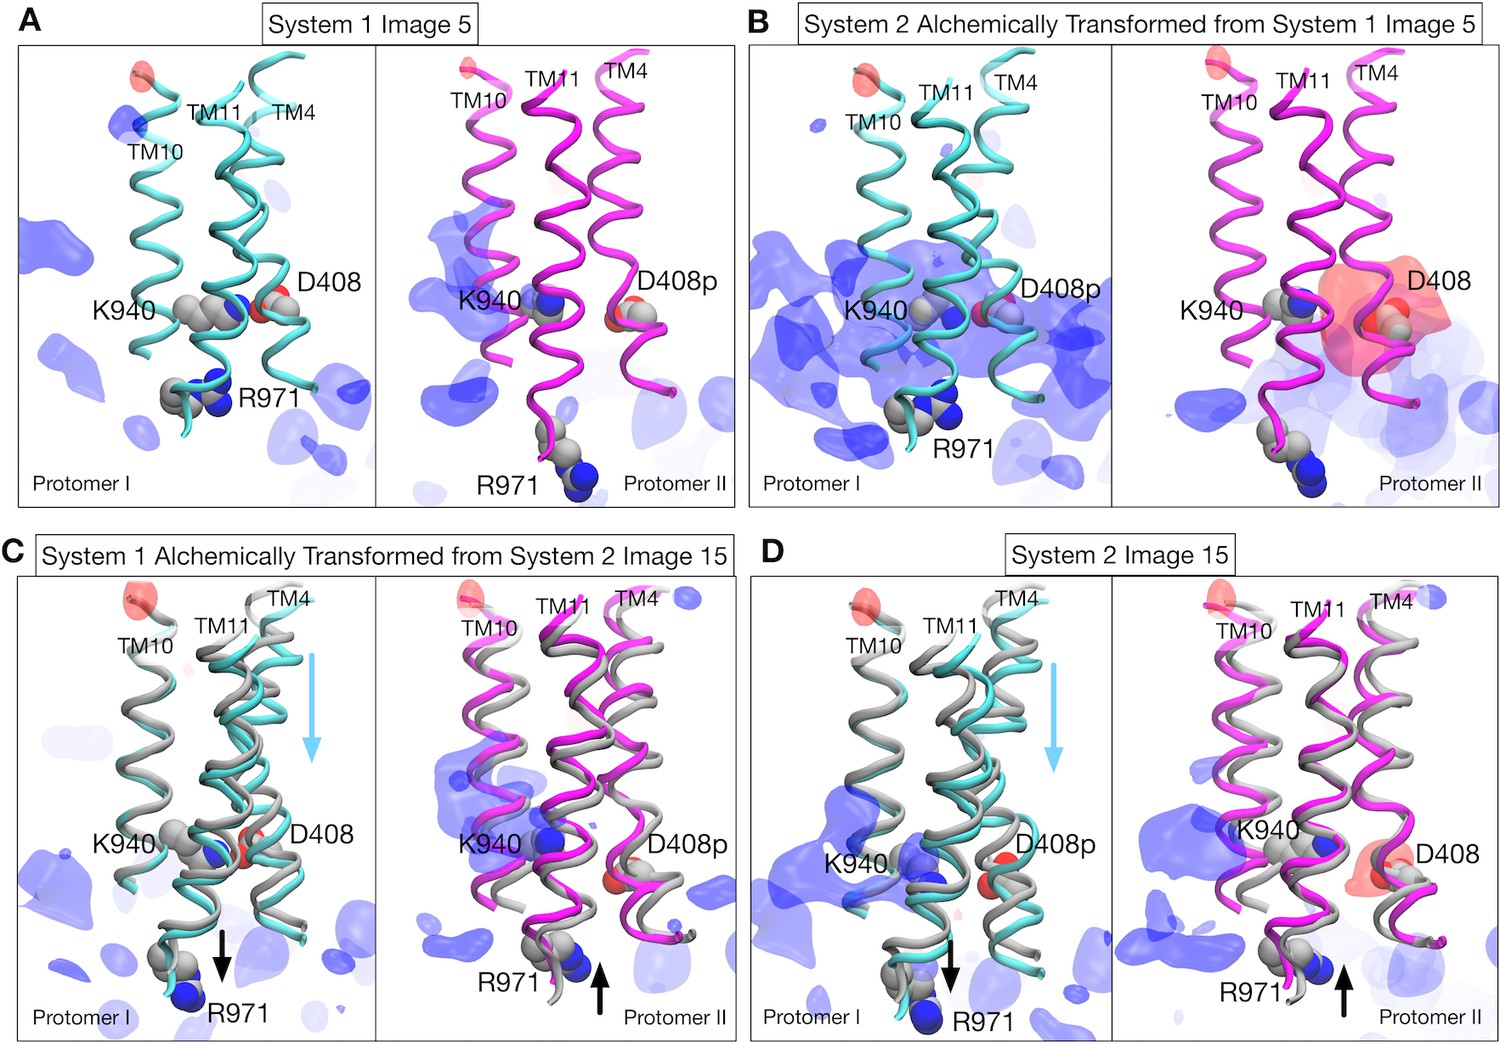
Structural changes and electrostatic features in the transmembrane region.
Representative structure of transmembrane helices 4, 11 and 10 for protomer I (cyan) and II (magenta) drawn with cartoons. Deprotonated/protonated D408, K940 and R971 are represented by spheres. Averaged electrostatic potential isosurfaces are drawn in blue (corresponding to the isovalue of 0.06 kcal/mol) and red (−0.06 kcal/mol). (A) Image 5 of system 1. (B) System 2 that is alchemically transformed from image 5 of system 1. (C) System 1 that is alchemically transformed from image 15 of system 2. For comparison, the helices of image 15 (gray) are drawn with those of image 15 (cyan and magenta). (D) Image 15 of system 2.
Figure 3—figure supplement 2
Electrostatic features with protonated D924 and E346.
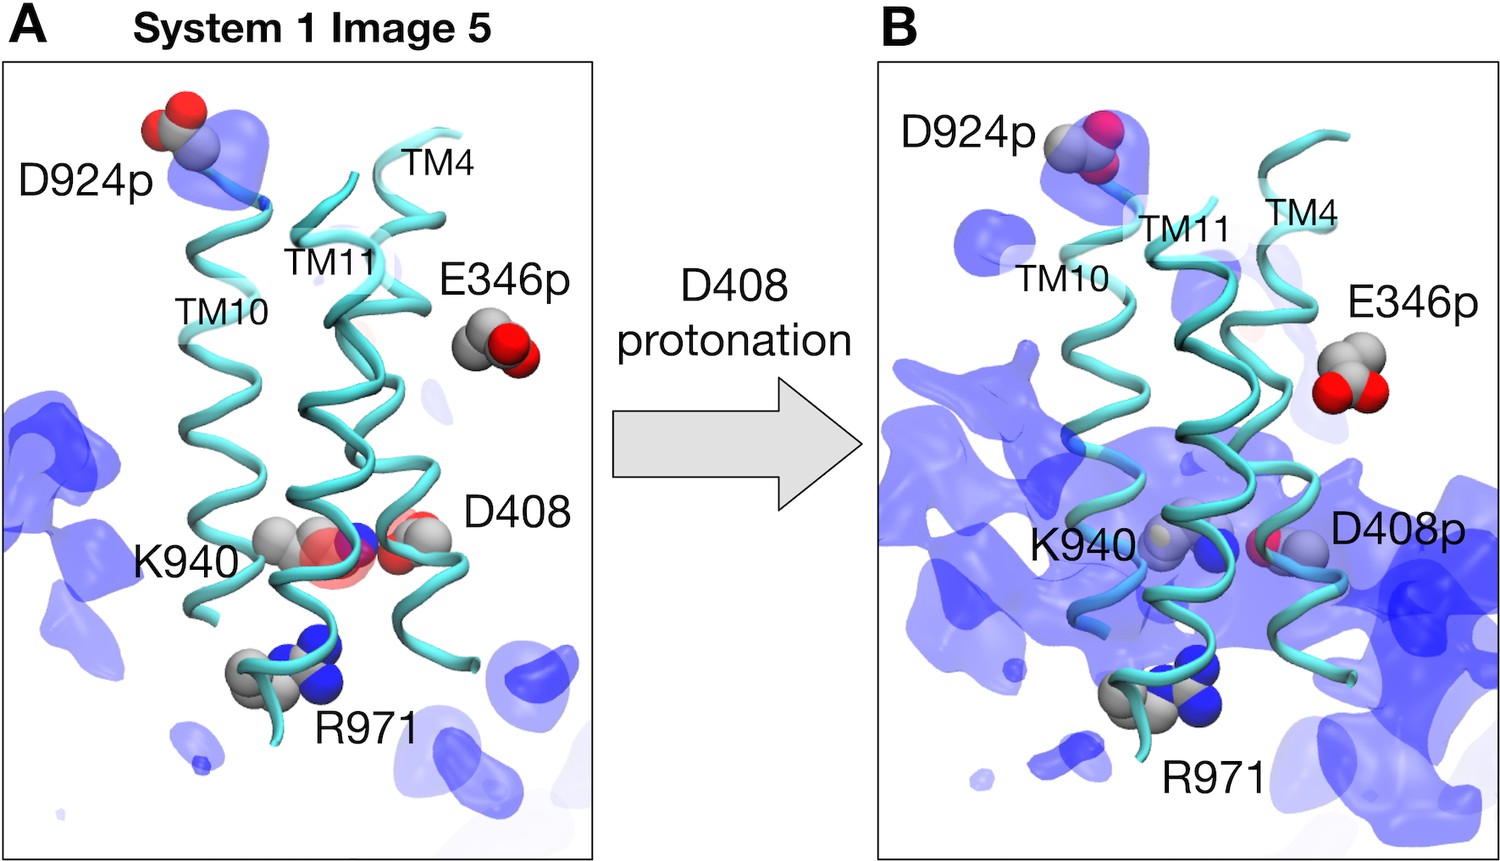
(A) Representative structure of transmembrane helices 4, 10 and 11 for protomer I (cyan) at image 5 of system 1 are drawn with cartoons. Deprotonated D408, K940, R971, protonated D924, and protonated E346 are represented by spheres. Averaged electrostatic potential isosurfaces are drawn in blue (corresponding to the isovalue of 0.06 kcal/mol) and red (−0.06 kcal/mol). (B) After protonating D408 toward system 2.
Figure 3—figure supplement 3

Downshift and upshift motions of transmembrane helices.
Z-coordinates of center-of-masses of transmembrane helices are plotted as a function of image index. Line colors indicate transmembrane helices. Solid lines are helices in the R1 repeat (except for TM2), and broken lines are in the R2 repeat (except for TM8).
Figure 3—figure supplement 4
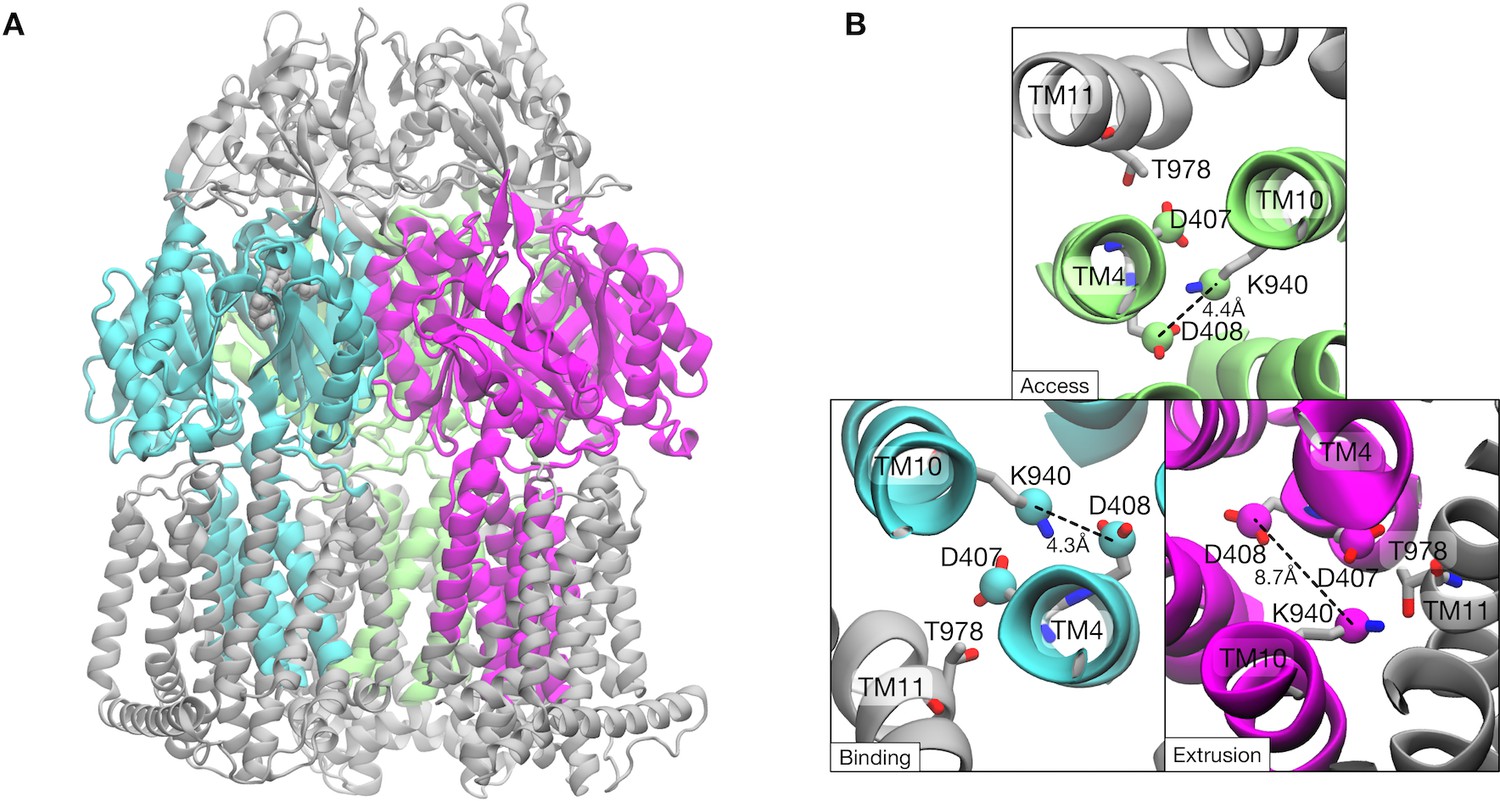
Comparison of transmembrane helix positions in the crystal structure.
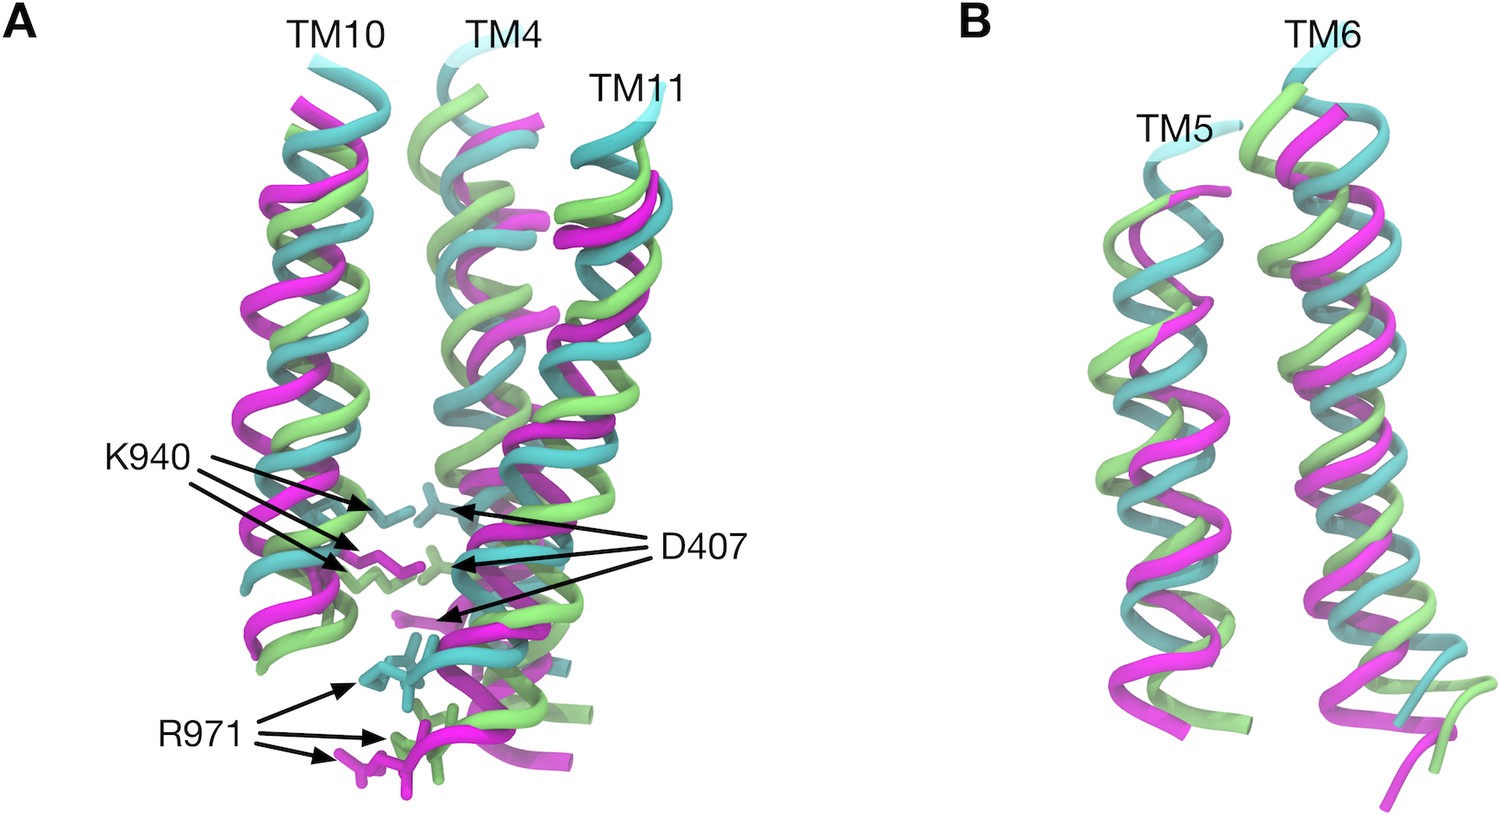
(A) Transmembrane helices 4, 10 and 11 in the Binding (cyan), Extrusion (magenta) and Access (lime) states are superimposed. (B) Transmembrane helices 5 and 6 are superimposed. Here, we first defined the z-axis from the minor principal axis of the completer AcrB trimer of the crystal structure (PDB entry: 4DX5). Then, the transmembrane helices of different states were superimposed. The least-squares fittings of structures were performed only in the xy-plane and z-coordinates were kept.
Figure 3—figure supplement 5
Water molecule distributions in transmembrane domain.
2500 snapshots of water atoms are drawn with red points (oxygen) and white points (hydrogen) at (A) image 5 of system 1 and (B) image 15 of system 2. Cyan indicates the protomer I (Binding → Extrusion), magenta indicates the protomer II (Extrusion → Access), and lime indicates the protomer III (Access → Binding).
Figure 4
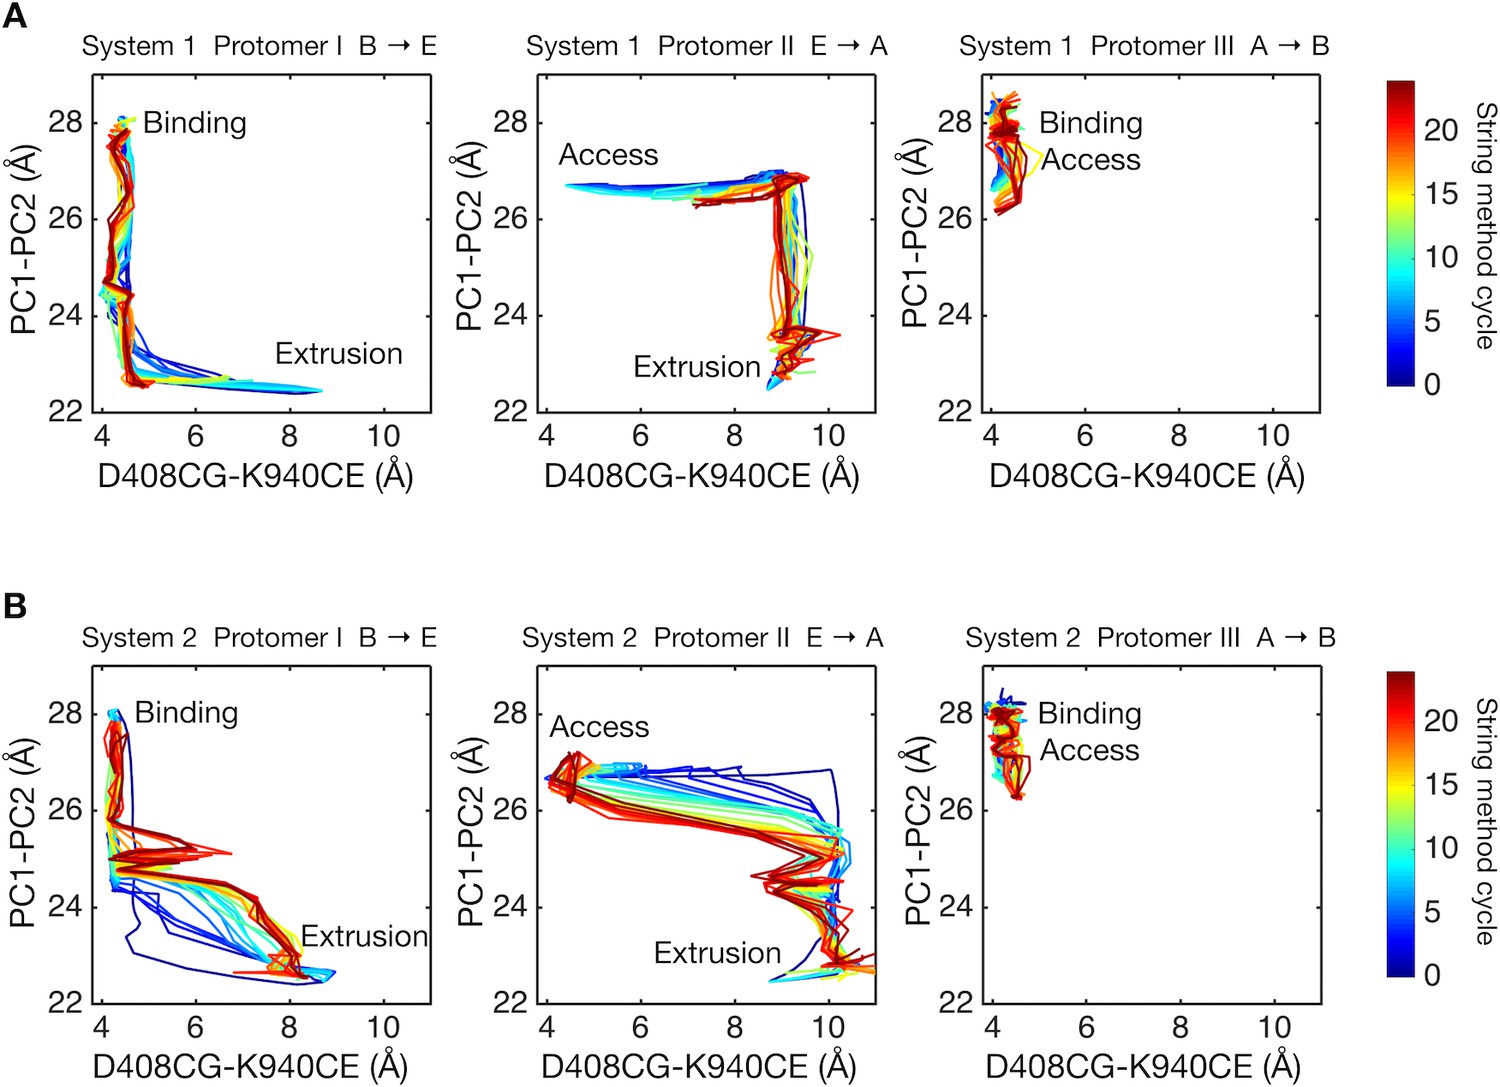
Two-dimensional visualization of conformational pathways.
(A) Conformational pathways of system 1 are monitored by distance between the Cγ-atom of D408 and the Cε-atom of K940 (illustrated in Figure 1D), and by the center-of-mass distance between the PC1 and the PC2 subdomains. These quantities are deterministic because they are involved in the collective variables used with the string method calculation. Dark blue lines indicate the initial pathway generated by the targeted MD simulations. Dark brown lines are the final converged pathways obtained by the string method. (B) Conformational pathways of system 2.
Figure 5 with 2 supplements
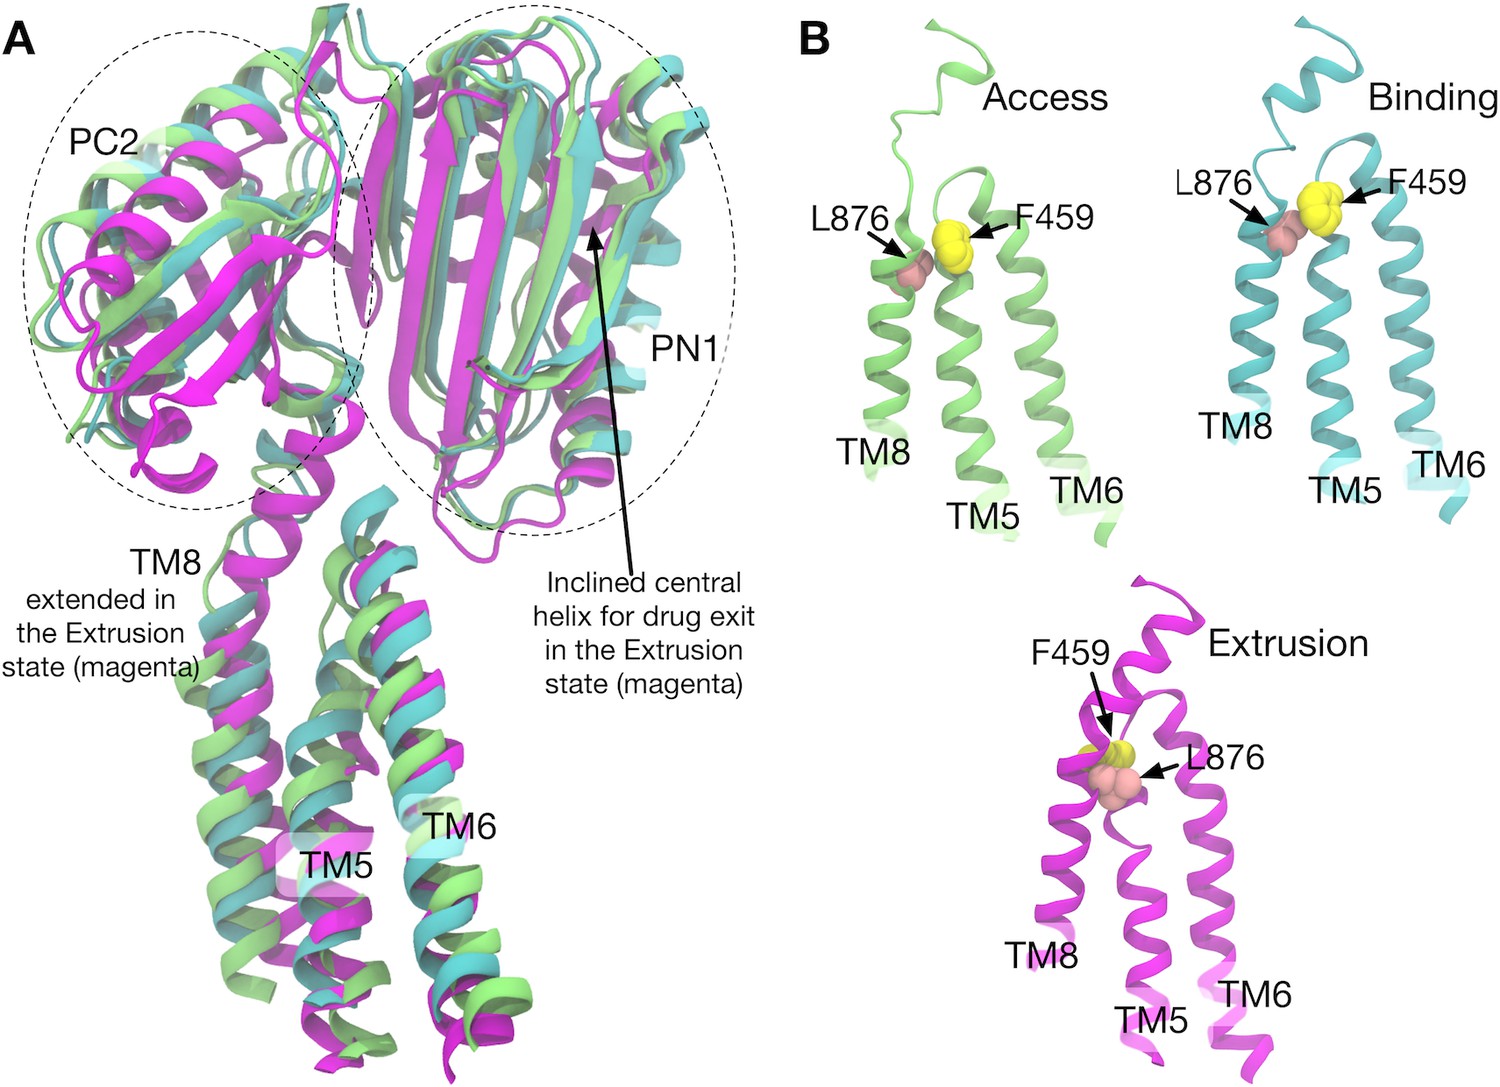
Comparison of the structures of transmembrane helices 8, 5, 6 and porter subdomains PC2 and PN1 in the crystal structure.
(A) Side view of TM8, TM5, TM6 and porter subdomains PC2 and PN1 in the Binding (cyan), Extrusion (magenta) and Access (lime) states, in which the structures are superimposed. (B) Relative positions of F459 (yellow) on TM5 and L876 (pink) on TM8 are compared in different states.
Figure 5—figure supplement 1
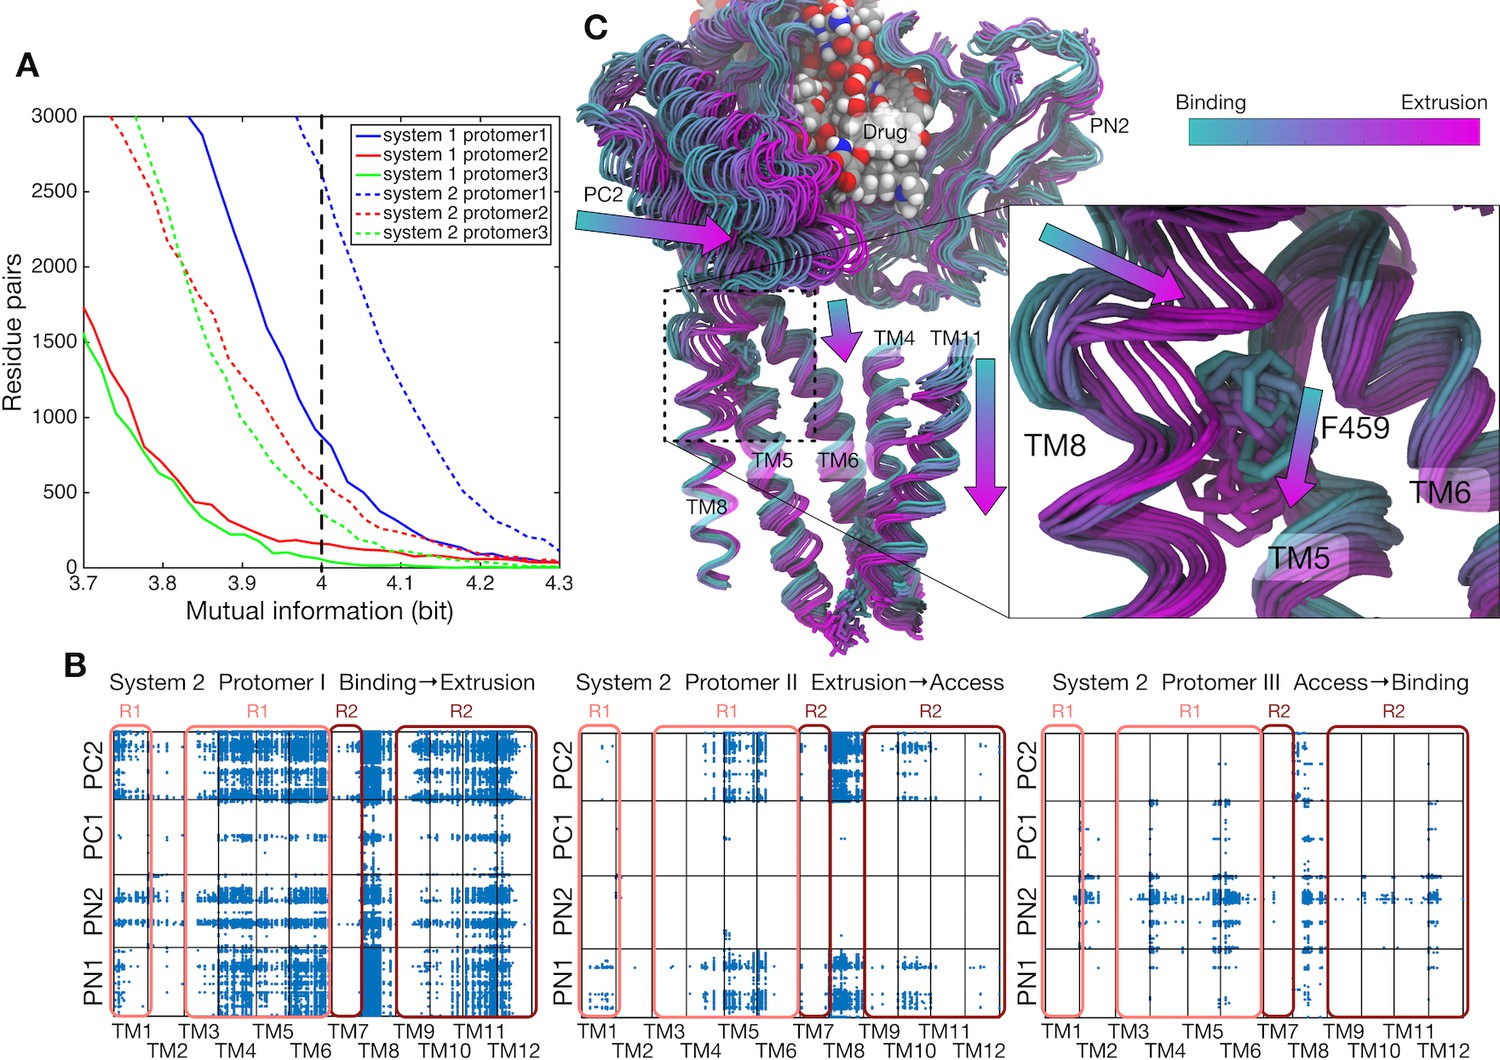
Correlations between the transmembrane helices and the porter domain motions.
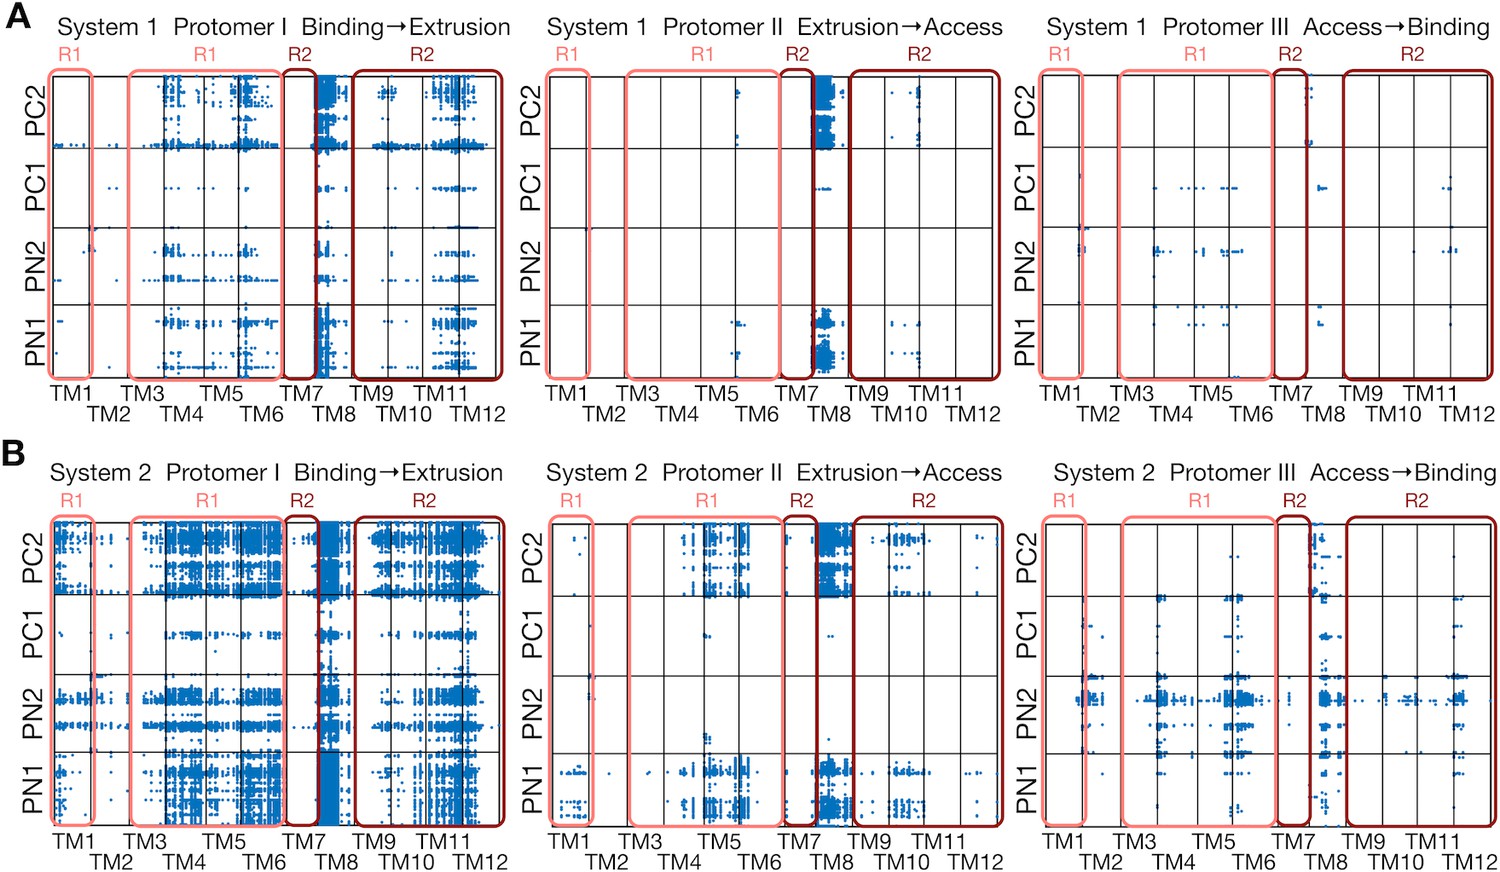
(A) Number of residue pairs between TM helices and the porter domain as a function of mutual information for each protomer of systems 1 and 2. (B) Correlated residue pairs between TM helices and the porter domain evaluated by mutual information along the minimum free energy pathway of system 2. Each blue dot represents a highly correlated residue pair with mutual information greater than 4.0 bit (indicated by the black broken line in the panel [A]). (C) Representative snapshots of protomer I along the conformational pathway of system 2. PN2 and PC2 on the porter domain, TM4–TM6, TM8 and TM11 on the TM domain, and the drug are shown. According to the image index, the color of the structure changes from cyan (corresponding to the B state) to magenta (the E state). F459 on TM5 and the drug are represented by sticks and spheres, respectively.
Figure 5—figure supplement 2
Comparison between systems 1 and 2.
(A) Correlated residue pairs between TM helices and the porter domain evaluated by mutual information along the minimum free energy pathway of system 1. Each blue dot represents a correlated residue pair whose mutual information is greater than 4.0 bit. (B) The same plot for system 2.
Figure 6
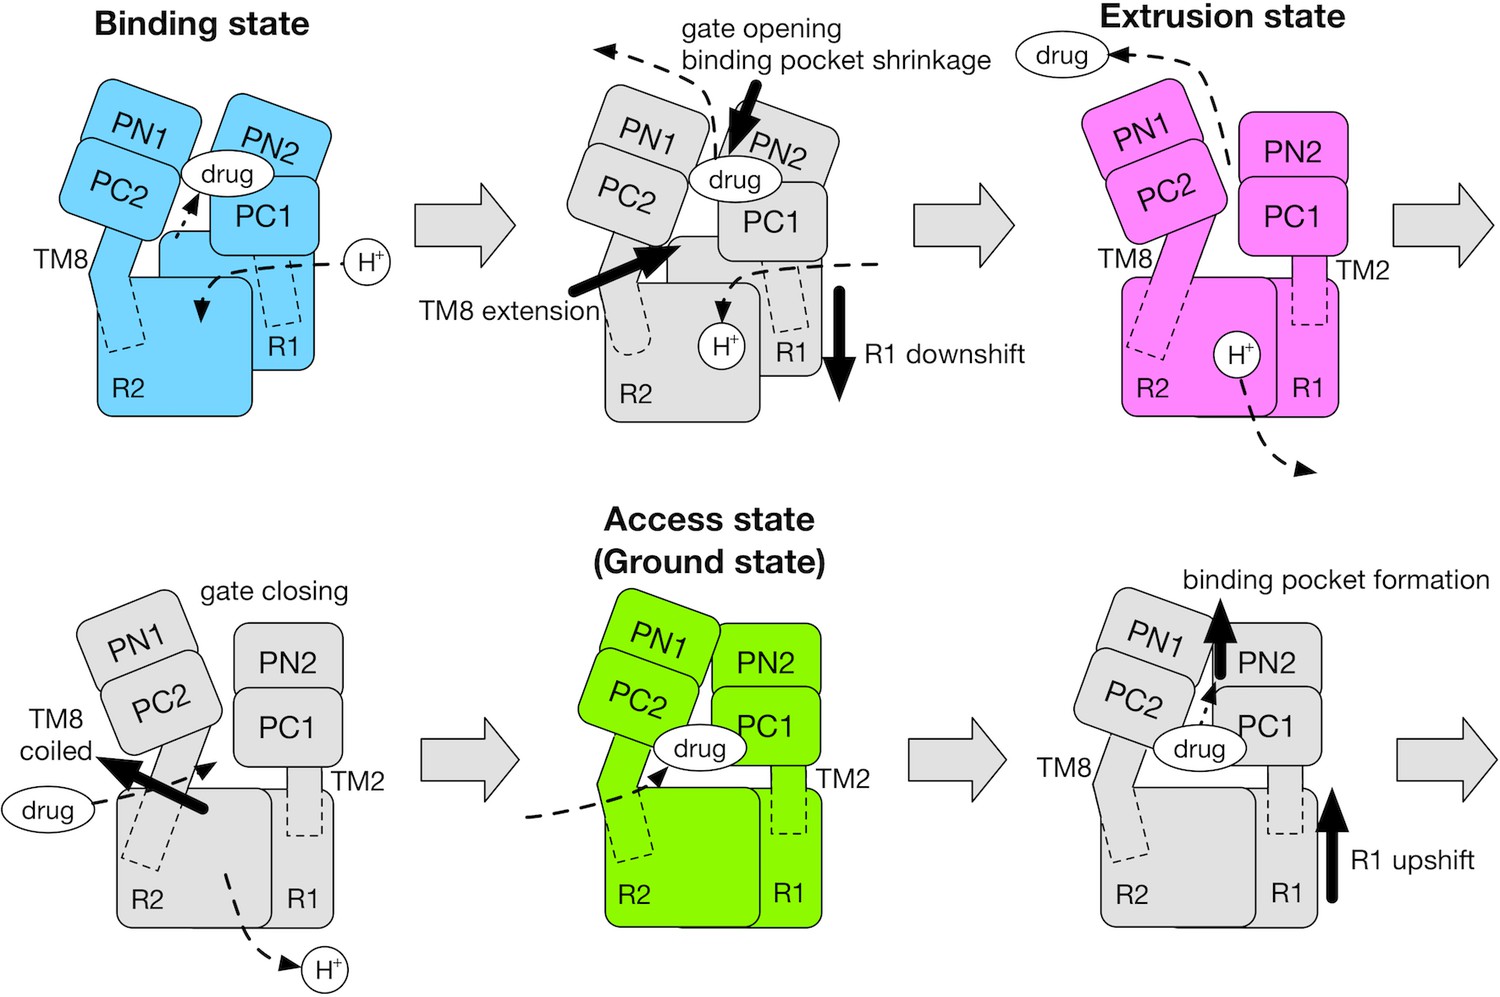
Schematic for the mechanism of the functional rotation.
Relative motions of the transmembrane domain (consisting of R1 and R2 repeats, and TM2 and TM8) and the porter domain (consisting of the PN1, PN2, PC1 and PC2 subdomains) are represented by thick black arrows. The coil-to-helix and reverse helix-to-coil transitions in TM8 are also indicated by thick black arrows. The accessibility of protons/drug to the TM/porter domain is indicated by small black arrows with broken lines. The funnel domain is omitted for visual clarity.
Additional files
-
Transparent reporting form
- https://doi.org/10.7554/eLife.31715.019
Download links
A two-part list of links to download the article, or parts of the article, in various formats.
Downloads (link to download the article as PDF)
Open citations (links to open the citations from this article in various online reference manager services)
Cite this article (links to download the citations from this article in formats compatible with various reference manager tools)
Energetics and conformational pathways of functional rotation in the multidrug transporter AcrB
eLife 7:e31715.
https://doi.org/10.7554/eLife.31715


