Diverse modes of synaptic signaling, regulation, and plasticity distinguish two classes of C. elegans glutamatergic neurons
- The Rockefeller University, United States
Abstract
Synaptic vesicle release properties vary between neuronal cell types, but in most cases the molecular basis of this heterogeneity is unknown. Here, we compare in vivo synaptic properties of two neuronal classes in the C. elegans central nervous system, using VGLUT-pHluorin to monitor synaptic vesicle exocytosis and retrieval in intact animals. We show that the glutamatergic sensory neurons AWCON and ASH have distinct synaptic dynamics associated with tonic and phasic synaptic properties, respectively. Exocytosis in ASH and AWCON is differentially affected by SNARE-complex regulators that are present in both neurons: phasic ASH release is strongly dependent on UNC-13, whereas tonic AWCON release relies upon UNC-18 and on the protein kinase C homolog PKC-1. Strong stimuli that elicit high calcium levels increase exocytosis and retrieval rates in AWCON, generating distinct tonic and evoked synaptic modes. These results highlight the differential deployment of shared presynaptic proteins in neuronal cell type-specific functions.
https://doi.org/10.7554/eLife.31234.001Introduction
Neurotransmitter release is a highly regulated process that varies at different synapses, and at the same synapse over time (Atwood and Karunanithi, 2002). Although presynaptic diversity is widely observed, it is challenging to define its role in intact circuits under physiological patterns of activity (Regehr, 2012); more often, a synapse is examined ex vivo at calcium concentrations or temperatures that alter its properties. Studies in the zebrafish retina represent one example in which synapses of two distinct neuronal classes, ON- and OFF-bipolar cells, have been compared in vivo in intact animals, leading to insights into their similarities and differences (Odermatt et al., 2012). Here, we extend this approach to the central nervous system of the nematode worm Caenorhabditis elegans, and relate diversity in synaptic properties to requirements for specific synaptic proteins in individual neurons.
The well-studied neural circuitry of C. elegans, which includes 302 neurons and about 9000 synaptic connections, presents an opportunity to study presynaptic diversity in a well-defined context (Varshney et al., 2011; White et al., 1986). Most synaptic proteins are conserved between C. elegans and other animals; indeed, behavioral genetics in C. elegans led to the initial identification of the SNARE (soluble N-ethylmaleimide–sensitive factor attachment receptor) regulatory proteins unc-13 and unc-18 (Brenner, 1974; Gengyo-Ando et al., 1993; Maruyama and Brenner, 1991). However, the study of synaptic transmission in C. elegans has been largely limited to the neuromuscular junction (NMJ) due to the challenges of electrophysiology in this small animal (Richmond and Jorgensen, 1999). As a result, the synaptic properties of neurons in the central nervous system have only begun to be explored (Lindsay et al., 2011).
Several reporters of synaptic activity that are suitable for in vivo analysis are based on pHluorin, a highly pH-sensitive variant of the green fluorescent protein (Miesenböck et al., 1998). pHluorin and its derivatives are minimally fluorescent at the acidic pH conditions characteristic of the synaptic vesicle lumen, but highly fluorescence at neutral extracellular pH. As a result, synaptic vesicle exocytosis results in a sharp increase in the fluorescence of pHluorin fusion proteins targeted to the synaptic vesicle lumen. Their subsequent endocytosis and reacidification quenches fluorescence, providing readouts at multiple stages of the synaptic vesicle cycle (Di Giovanni and Sheng, 2015; Fernandez-Alfonso and Ryan, 2008; Li et al., 2005; Sankaranarayanan and Ryan, 2000).
The genetic tractability and transparency of C. elegans are ideal for pHluorin imaging, and indeed, pHlourin-synaptobrevin fusion proteins have been used to study steady-state synaptic properties at the neuromuscular junction and in several other neurons (Dittman and Kaplan, 2006; Oda et al., 2011; Voglis and Tavernarakis, 2008). However, the standing plasma membrane levels of pHlourin-synaptobrevin fusion proteins make them ill-suited to real-time analysis (Dittman and Kaplan, 2006). By contrast, the vesicular glutamate transporter (VGLUT) has a minimal residence time on the plasma membrane in mammalian neurons (Voglmaier et al., 2006), and therefore is better suited for pHluorin imaging of vesicle dynamics (Balaji and Ryan, 2007).
We show here that EAT-4 VGLUT-pHlourin fusions can be used to study dynamic release and retrieval of synaptic vesicles from individual neurons in intact C. elegans. Using VGLUT-pHluorin fusions, we show that the release and retrieval of glutamatergic synaptic vesicles in two sensory neurons, AWCON and ASH, are kinetically distinct and matched to their signaling properties. We further demonstrate differential contributions of SNARE regulators to synaptic dynamics in AWCON and ASH, and describe activity-dependent regulation of AWCON exo- and endocytosis.
Results
VGLUT-pHluorin reports synaptic activity in AWCON and ASH neurons
The AWCON and ASH sensory neurons, which sense attractive odors and repulsive chemical and physical stimuli, respectively, are dynamically and molecularly distinct (Bargmann, 2006; Serrano-Saiz et al., 2013). Based on calcium imaging studies, the AWCON olfactory neurons are tonically active at rest, inhibited (likely hyperpolarized) by odor stimuli, and transiently activated upon odor removal before a return to baseline (Chalasani et al., 2007; Gordus et al., 2015; Kato et al., 2014)(Figure 1A). This pattern resembles that of vertebrate photoreceptors, which employ a similar cGMP sensory transduction cascade (Bargmann, 2006; Zhang and Cote, 2005). By contrast, calcium imaging and electrophysiological studies of the ASH nociceptive neurons indicate that they are strongly activated by noxious chemical and mechanical stimuli, and recover quickly upon stimulus removal (Chatzigeorgiou et al., 2013; Hilliard et al., 2005; Kato et al., 2014)(Figure 1B). Like vertebrate nociceptive neurons, ASH neurons signal via G protein-regulated TRPV channels (Hilliard et al., 2005; Kato et al., 2014). Both AWCON and ASH signal to downstream neurons through glutamatergic synapses and the vesicular glutamate transporter EAT-4 (Chalasani et al., 2007; Lee et al., 1999).
Figure 1 with 2 supplements see all
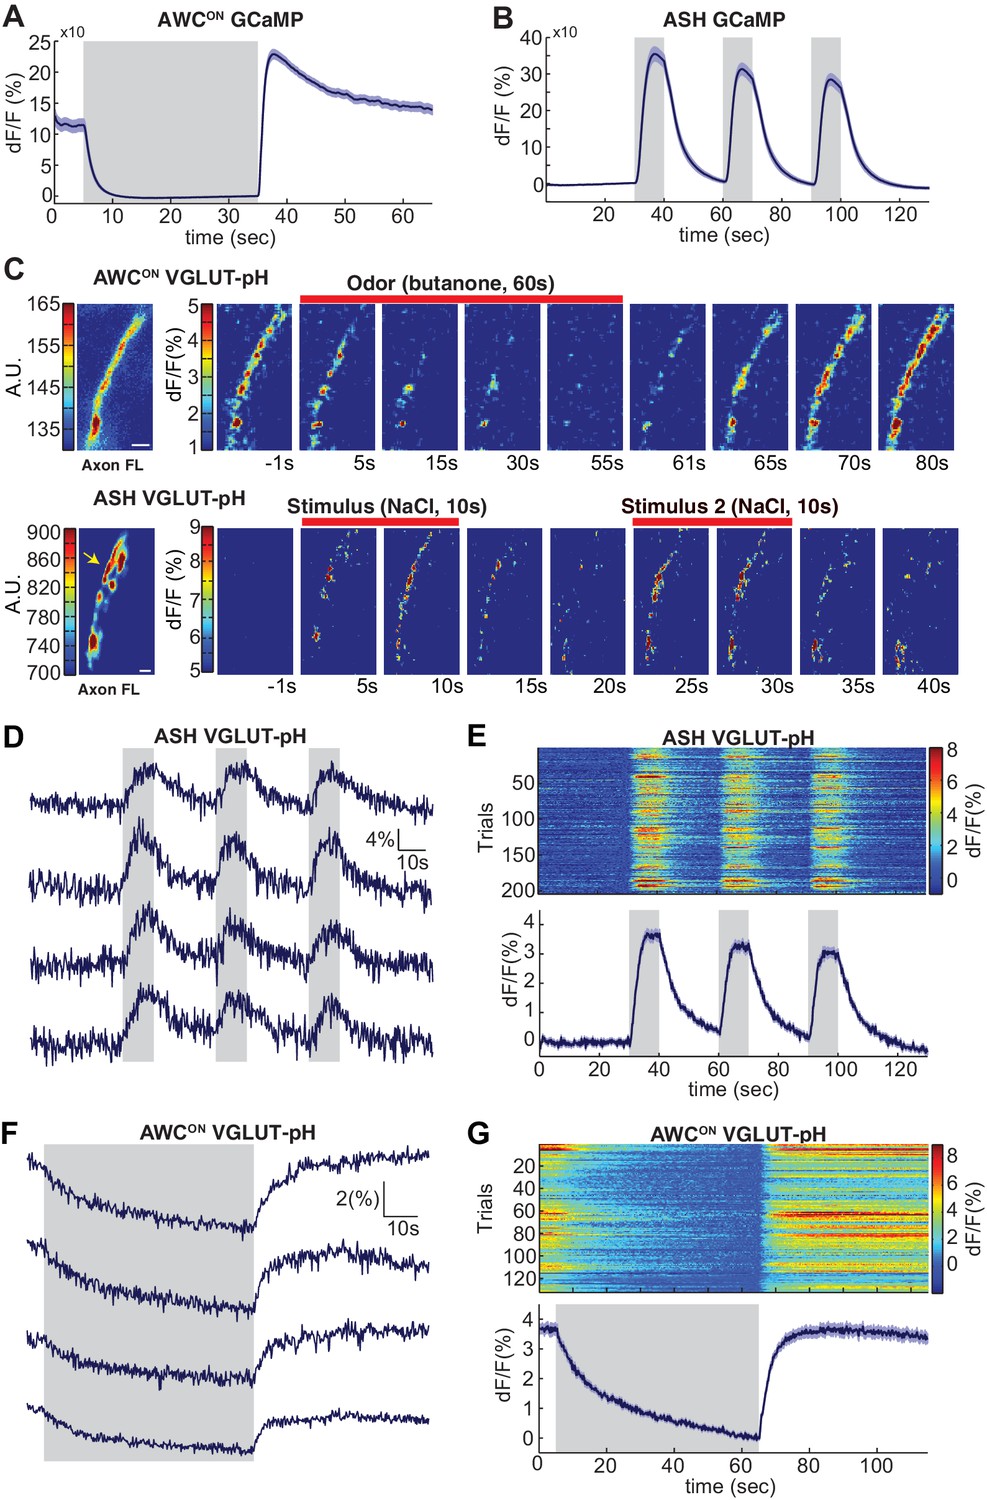
Sensory stimuli evoke VGLUT-pH signals in AWCON and ASH neurons.
(A) AWCON GCaMP5A responses in the cell body upon butanone stimulation (n = 47, 16 animals, 2–3 trials each). (B) ASH GCaMP3 responses in the cell body upon 500 mM NaCl stimulation (n = 39, 13 animals, three trials each). Gray shaded areas mark stimulus period. (C) Individual AWCON and ASH VGLUT-pH responses. Left: Fluorescence intensity of VGLUT-pH along the axon prior to stimulation (a.u. arbitrary units). White scale bars = 2 um. Right: Images of VGLUT-pH fluorescence changes upon butanone (AWCON) or NaCl (ASH) stimulation at t = 0 (red bars), presented as change in fluorescence versus reference F (F at ~t = 55 s for AWCON, t=-1s for ASH, see Materials and methods). Recordings were smoothed using a running average (three frames, three pixels in x and y). (D,F) Single trials of ASH (D) and AWCON (F) VGLUT-pH responses from four individuals. Top trace in each panel is from the axon in (C). (E,G) Population ASH (E) and AWCON (G) VGLUT-pH responses. Top panel: Heat map of individual trials, three trial per animal, presented in sequential order. Bottom panel: Mean response from all trials. AWCON: 132 trials from 44 animals, three trials each. ASH: 204 trials from 68 animals, three trials each. Blue shading around traces indicates S.E.M.
-
Figure 1—source data 1
Source data for Figure 1.
- https://doi.org/10.7554/eLife.31234.005
To image synaptic vesicle (SV) endo- and exocytosis from single neurons in intact animals, we inserted super-ecliptic pHluorin into the first lumenal domain of EAT-4 (VGLUT-pH) and expressed this fusion protein using cell-specific promoters for AWCON and ASH (Figure 1—figure supplement 1A–C). Immobilized animals were imaged in microfluidic chips that enable the precise delivery and removal of chemical stimuli and simultaneous monitoring of cell fluorescence at high magnification (Chalasani et al., 2007; Chronis et al., 2007). AWCON responses were elicited by addition and removal of butanone odor, while ASH responses were elicited by addition and removal of a noxious 0.5 M NaCl stimulus, under conditions that gave robust signals with GCaMP calcium sensors (Figure 1A,B).
The VGLUT-pH reporter was exclusively localized to the axon in both AWCON and ASH, with a semi-punctate distribution in synaptic regions (Figure 1C, left panels). Delivery of butanone to AWCON resulted in a reduction of VGLUT-pH fluorescence with recovery after odor removal (Figure 1C, top). Delivery of NaCl to ASH resulted in an increase in VGLUT-pH fluorescence, followed by a decrease after NaCl removal (Figure 1C, bottom). In both neurons, responses were observed across the ~20 µm region of the axon that was imaged, and could be followed with single trial resolution (Figure 1D–G & Materials and methods). AWCON and ASH synapses appeared to be highly reliable, as over 97% of stimuli triggered a detectable VGLUT-pH response (Figure 1E,G).
In ASH, VGLUT-pH fluorescence rose rapidly upon stimulus addition, and fell immediately upon stimulus removal, closely resembling the calcium response (Figure 1D,E, compare 1B). These results are consistent with a model in which ASH synaptic vesicle exocytosis is induced by stimulus-triggered calcium entry, and terminates rapidly with subsequent endocytosis and reacidification. In a control experiment, pHluorin tethered to the extracellular face of the ASH plasma membrane as a CD4 fusion protein did not respond to NaCl with fluorescence changes (Figure 1—figure supplement 1D–E), indicating that the signal reflects synaptic vesicle dynamics and not changes in extracellular pH.
In AWCON, VGLUT-pH fluorescence decreased throughout a one minute odor presentation, and odor removal resulted in a rapid increase to pre-stimulus levels without an overshoot (Figure 1F,G). The properties are consistent with a kinetic model in which the AWCON neuron has tonic synaptic vesicle release, with basal VGLUT-pH fluorescence determined by steady-state levels of exocytosis versus endocytosis and reacidification. In this model, odor addition reduces calcium and synaptic vesicle exocytosis, and odor removal triggers a calcium increase, synaptic vesicle exocytosis, and a return to the pre-stimulus steady state.
A close examination of VGLUT-pH signals after odor removal showed that AWCON fluorescence had an initial fast rate of increase for ~1 s, and then transitioned to a slower rate of increase over the following ~5 s (Figure 2A,B, Figure 2—figure supplement 1A). These dynamics suggest that synaptic vesicle exocytosis is transiently enhanced above its basal level immediately after odor removal, in agreement with the known calcium overshoot in the AWCON cell body (e.g. Figure 1A). To better understand the relationship between somatic calcium, synaptic calcium, and exocytosis in AWCON, we fused a GCaMP calcium sensor to the synaptic vesicle protein synaptogyrin (Figure 1—figure supplement 1C). This protein labeled the axons in a punctate pattern consistent with synapses, and should detect calcium levels in the immediate vicinity of synaptic vesicles. Synaptic calcium levels monitored with synaptogyrin-GCaMP rose and fell substantially more quickly than those in the cell body (Figure 2C,D; compare Figure 1A). The peak rate of calcium entry, at ~1 s after odor removal, occurred at the same time as the peak rate of VGLUT-pH fluorescence increase (Figure 2B,D,G).
Figure 2 with 1 supplement see all
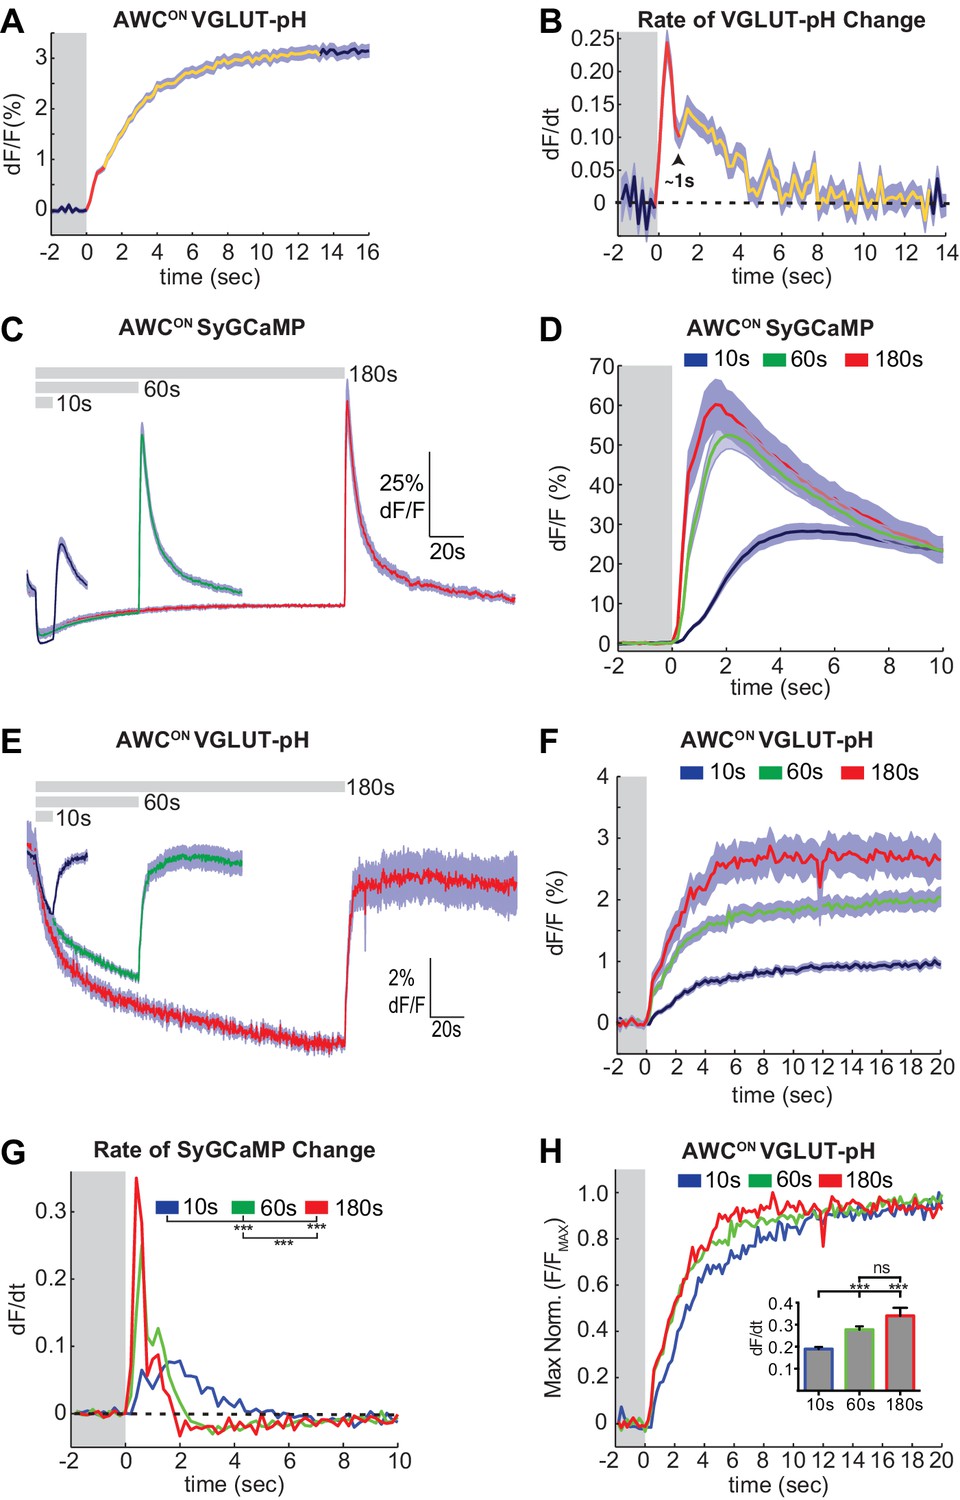
Two kinetic phases of VGLUT-pH responses and calcium influx in AWCON.
(A) Mean AWCON Vglut-pH signal upon odor removal (60 s stimulus, n = 219 trials, 1–3 trials per animal). Trace is colored according to transitions in time derivative in (B). (B) Mean time derivative of AWCON VGLUT-pH signals in (A). (C) AWCON synaptic calcium responses to butanone pulses measured with syGCaMP; traces aligned to odor addition. 10 s pulses: n = 42 (7 animals, six trials each). 60 s pulses: n = 21 (7 animals, three trials each). 3 min pulses: n = 7 (7 animals, one trial each). (D) syGCaMP responses from (C) aligned to odor removal. (E) AWCON VGLUT-pH responses to butanone pulses; traces aligned to odor addition. 10 s pulses: n = 120 (20 animals, six trials each). 60 s pulses: n = 59 (21 animals, 2–3 trials each). 3 min pulses: n = 14 (14 animals, one trial each). (F) VGLUT-pH responses from (E) aligned to odor removal. (G) Mean time derivative of AWCON syGCaMP signals in (D) shows different peak rates 1 s after odor removal (***p<0.0001, one-way ANOVA with Tukey’s correction). (H) Average VGLUT-pH odor removal responses from (F) after normalizing response magnitude. Inset: Average peak time derivative of AWCON VGLUT-pH signals 1 s after odor removal. ***p<0.0001, ns (p=0.14), One-way ANOVA with Tukey’s correction. For time derivative plots each individual trial was smoothed with a running average (three frames) before taking the derivative. Units are change in dF/F (%) per 200 ms. Gray areas in A,B,D,F-H mark odor stimulus periods. Shading indicates S.E.M.
-
Figure 2—source data 1
Source data for Figure 2.
- https://doi.org/10.7554/eLife.31234.008
Varying the duration of odor exposure prior to odor removal allowed a more focused comparison of synaptic calcium dynamics and VGLUT-pH dynamics in AWCON (Figure 2C–F). Removing odor after a 10 s exposure elicited a small synaptic calcium overshoot within the first second (Figure 2D,G), and a small increase in exocytosis during the same interval (Figure 2H). Both synaptic calcium and exocytosis rates were elevated more substantially for ~1 s after a 60 s or 180 s odor exposure (Figure 2F–H). This correspondence suggests that the transient synaptic calcium overshoot following long odor stimuli evokes a brief pulse of synaptic vesicle release above the tonic level.
The SNARE complex drives tonic and evoked synaptic vesicle release
Synaptic vesicle release is triggered by the SNARE complex, which is composed of the plasma membrane proteins syntaxin and SNAP-25, and the vesicle-associated protein synaptobrevin. Expressing the light chain of tetanus toxin (TeTx), which cleaves synaptobrevin (Schiavo et al., 1992), in either AWCON or ASH eliminated their VGLUT-pH responses, as predicted if the VGLUT-pH signals report synaptic vesicle dynamics (Figure 3A,B). Notably, AWCON VGLUT-pH fluorescence did not decrease upon odor addition in TeTx animals, suggesting that both tonic AWCON exocytosis and the evoked exocytosis after long odor stimuli require the SNARE complex.
Figure 3

The SNARE complex is required for VGLUT-pH responses in AWCON and ASH.
(A,B) VGLUT-pH responses are eliminated by cell-specific expression of TeTx light chain. (A) AWCON str-2 promoter driving TeTx n = 25 (9 animals, 2–3 trials each). AWCON wt (TeTx-array negative animals tested in parallel) n = 28 (10 animals, 2–3 trials each). (B) ASH sra-6 promoter driving TeTx n = 33 (11 animals, three trials each). ASH wt (TeTx-array negative animals tested in parallel) n = 24 (8 animals, three trials each). (C,D) VGLUT-pH responses in unc-64(e246) (partial loss of function) syntaxin mutants. (C) AWCON unc-64(e246) n = 30 (10 animals, three trials each). AWCON wt n = 23 (9 animals, 2–3 trials each). (D) ASH unc-64(e246) n = 24 (8 animals, three trials each). ASH wt n = 18 (6 animals, three trials each). (E, F) VGLUT-pH responses in ric-4(md1088) (partial loss of function) SNAP-25 mutants. (E) AWCON ric-4(md1088) n = 12 (4 animals, three trials each). AWCON wt n = 15 (5 animals, three trials each). (F) ASH ric-4(md1088) n = 16 (6 animals, 2–3 trials each). ASH wt n = 32 (11 animals, 2–3 trials each). Mutations are described in Supplementary file 2. All differences are significant (p<0.0001, unpaired t-test), as detailed in Supplementary file 3A. Gray areas mark stimulus periods. Shading indicates S.E.M.
-
Figure 3—source data 1
Source data for Figure 3.
- https://doi.org/10.7554/eLife.31234.010
Mutant analysis supported the roles of SNARE-complex proteins in sensory exocytosis. Null mutations in C. elegans SNARE-complex proteins are inviable, but partial loss of function in syntaxin (unc-64) and SNAP-25 (ric-4) are viable, with reduced synaptic vesicle release at the neuromuscular junction (Liu et al., 2005; Martin et al., 2011). Both unc-64(e246) (Figure 3C,D) and ric-4(md1088) (Figure 3E,F) had diminished VGLUT-pH responses in AWCON and ASH. These results are consistent with a requirement for the SNARE complex in tonic and evoked glutamate release from AWCON and evoked glutamate release from ASH.
SNARE regulators can differentially affect AWCON and ASH
A suite of conserved presynaptic proteins including SNARE-associated proteins, scaffold proteins, and small GTPases affect synaptic release in many animals, but their apparent importance varies between reports. Among these presynaptic regulators are UNC-13 and UNC-18 (Augustin et al., 1999; Varoqueaux et al., 2002; Verhage et al., 2000). UNC-13 is implicated in priming synaptic vesicles prior to release; it is a multidomain protein with a MUN domain that can open a closed conformation of syntaxin, and three C2 domains, which bind phorbol esters, phospholipids, and in some cases calcium (Richmond et al., 1999). ASH neurons had no detectable VGLUT-pH response to sensory stimuli in unc-13 null mutants, indicating an absolute requirement for this protein in ASH synaptic vesicle mobilization (Figure 4B). By contrast, AWCON neurons in unc-13 null mutants had a significant, albeit reduced, increase in VGLUT-pH signal after odor removal indicative of residual synaptic activity (Figure 4A).
Figure 4
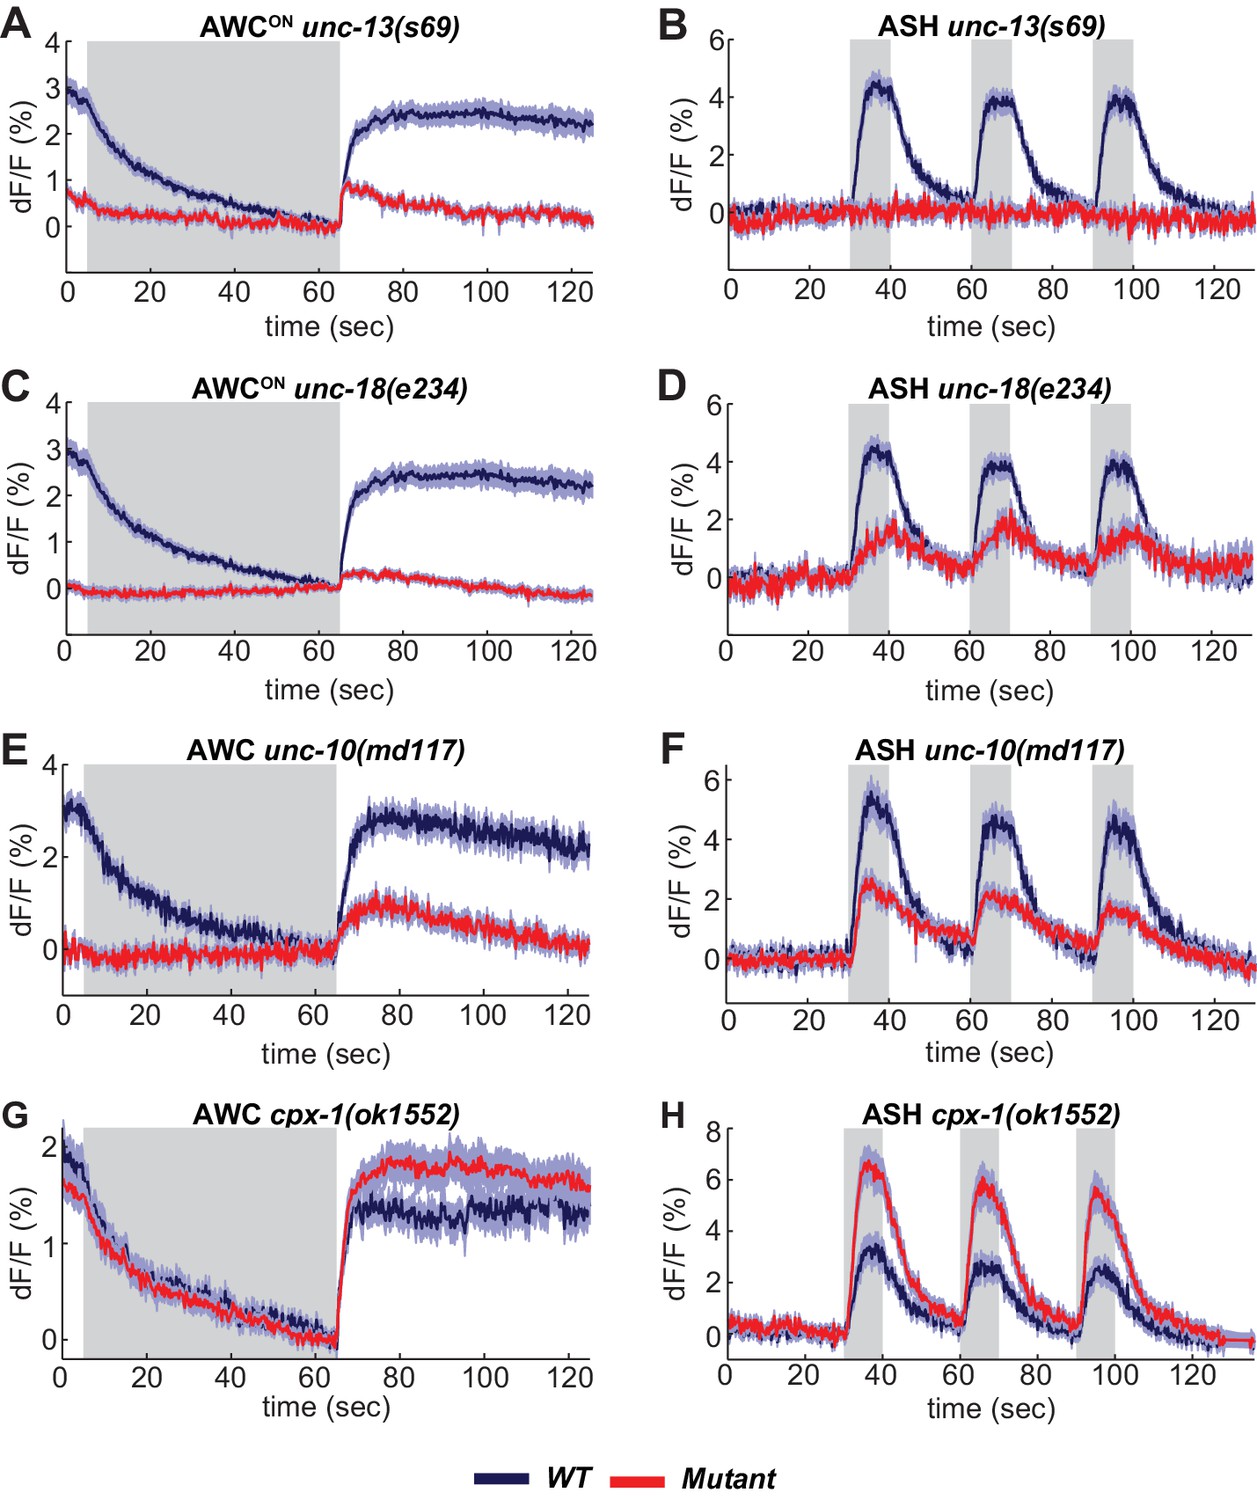
SNARE regulators differentially affect AWCON and ASH.
(A,B) VGLUT-pH responses in unc-13(s69) null mutants. (A) AWCON responses in unc-13(s69), n = 25 (9 animals, 2–3 trials each) and wt, n = 33 (11 animals, three trials each). (B) ASH responses in unc-13(s69), n = 18 (7 animals, 1–3 trials each) and wt, n = 42 (14 animals, three trials each). (C,D) VGLUT-pH responses in unc-18(e234) mutants. (C) AWCON responses in unc-18(e234), n = 25 (9 animals, 1–3 trials each) and wt, n = 33 (11 animals, three trials each). (D) ASH responses in unc-18(e234), n = 22 (8 animals, 1–3 trial each) and wt, n = 42 (14 animals, three trials each). (E,F) VGLUT-pH responses in unc-10(md117) mutants. (E) AWCON responses in unc-10(md117), n = 23 (8 animals, 1–3 trials each), and wt, n = 27 (9 animals, three trials each). (F) ASH responses in unc-10(md117), n = 33 (12 animals, 2–3 trials each), and wt, n = 24 (8 animals, three trials each). (G,H) VGLUT-pH responses in cpx-1(ok1552) mutants. (G) AWCON responses in cpx-1(ok1552), n = 36 (12 animals, three trials each), and wt, n = 17 (6 animals, 2–3 trials each). (H) ASH responses in cpx-1(ok1552), n = 38 (13 animals, 2–3 trials each), and wt n = 33 (11 animals, three trials each). WT and mutants are significantly different in panels A-F and H, as detailed in Supplementary file 3B. Gray areas mark stimulus periods. Shading indicates S.E.M.
-
Figure 4—source data 1
Source data for Figure 4.
- https://doi.org/10.7554/eLife.31234.012
UNC-18 also interacts with syntaxin, and regulates syntaxin localization as well as activity (McEwen and Kaplan, 2008; Ogawa et al., 1998). AWCON VGLUT-pH responses were nearly eliminated in unc-18 null mutants (Figure 4C). However, unc-18 ASH neurons responded to stimuli by mobilizing VGLUT-pH, albeit to a lesser extent than the wild-type (Figure 4D). These results reveal heterogeneity in the requirements for SNARE regulators in different cell types: ASH has a stronger requirement for unc-13 and a weaker requirement for unc-18 than AWCON (Statistics in Supplementary file 3B).
Synaptic vesicle release was reduced but not eliminated in both ASH and AWCON neurons by mutations affecting the scaffold protein UNC-10/RIM (Figure 4E,F). ASH neurons showed enhanced synaptic vesicle release in mutations for the SNARE regulator cpx-1/complexin mutants (Figure 4H); a similar trend in AWCON was not statistically significant (Figure 4G, Supplementary file 3B).
Cytoplasmic pH is increased by neuronal activity, independent of synaptic release
As a counterpoint to the VGLUT-pHluorin experiments, we examined the effect of sensory stimuli on cytoplasmic pH in AWCON and ASH neurons. Activity-dependent increases or decreases in cytoplasmic pH have been documented in both vertebrate and invertebrate neurons (Chesler, 2003; Rossano et al., 2013; Zhang et al., 2010). Similarly, expressing an untagged super-ecliptic pHluorin in the cytoplasm of AWCON and ASH neurons (cyto-pH) reported robust stimulus-dependent pH changes. Odor addition increased cyto-pH fluorescence in AWCON, suggesting alkalinization, and odor removal decreased cyto-pH fluorescence, suggesting activity-dependent acidification (Figure 5A). These pH changes were opposite in sign to the signals defected by VGLUT-pH (compare Figure 5A to 1G), and were strongest in the axon, intermediate in the cell body, and weak in the sensory dendrite (Figure 5A). In ASH, NaCl stimuli elicited a decrease in cyto-pH fluorescence suggestive of acidification, again the opposite sign of the VGLUT-pH signal (Figure 5B).
Figure 5
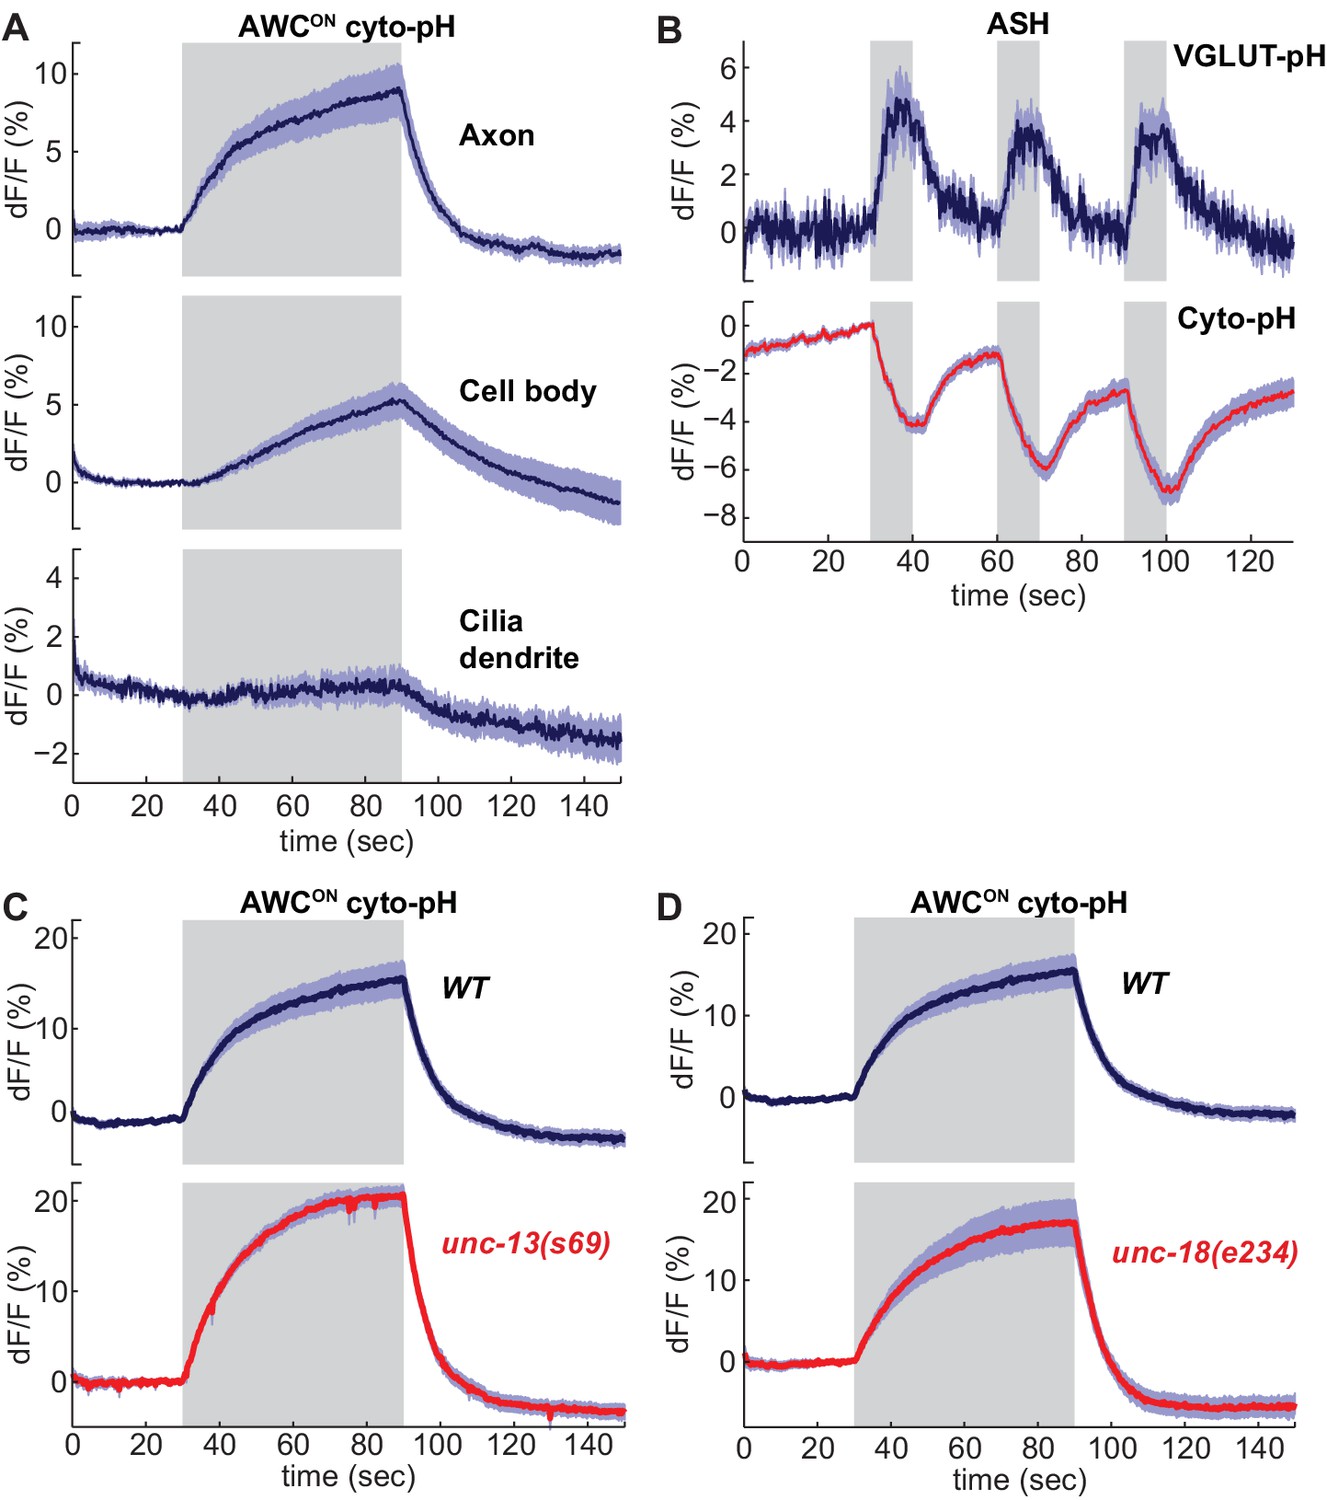
Sensory stimuli evoke cytoplasmic pH changes in AWCON and ASH.
(A) Average cyto-pH signals at different subcellular sites of AWCON. Axon and cell body, n = 9 (3 animals, three trials each), Cilia-dendrite n = 6 (2 animals, three trials each). (B) Average ASH VGLUT-pH response (top) and cyto-pH response (bottom), tested in parallel under the same stimulus conditions. VGLUT-pH n = 9 (3 animals, three trials each). cyto-pH n = 27 (9 animals, three trials each). (C,D) Average AWCON cyto-pH responses in (C) unc-13(s69) and (D) unc-18(e234) mutants. Mutants and wild-type controls were measured on the same days; neither mutant was significantly different from wild-type (p>0.12, one-way ANOVA with Tukey’s correction). unc-13(s69) n = 15 (5 animals, three trials each). unc-18(e234) n = 11 (4 animals, 2–3 trials each). wt n = 18 (6 animals, three trials each). Gray areas mark stimulus periods. Shading indicates S.E.M.
-
Figure 5—source data 1
Source data for Figure 5.
- https://doi.org/10.7554/eLife.31234.014
Unlike VGLUT-pH responses, AWCON cyto-pH signals were normal in unc-13 or unc-18 mutations (Figure 5C,D). These results suggest that cytoplasmic pH changes are independent of synaptic vesicle release.
The endocytosis-reacidification process is accelerated by AP180/pCALM
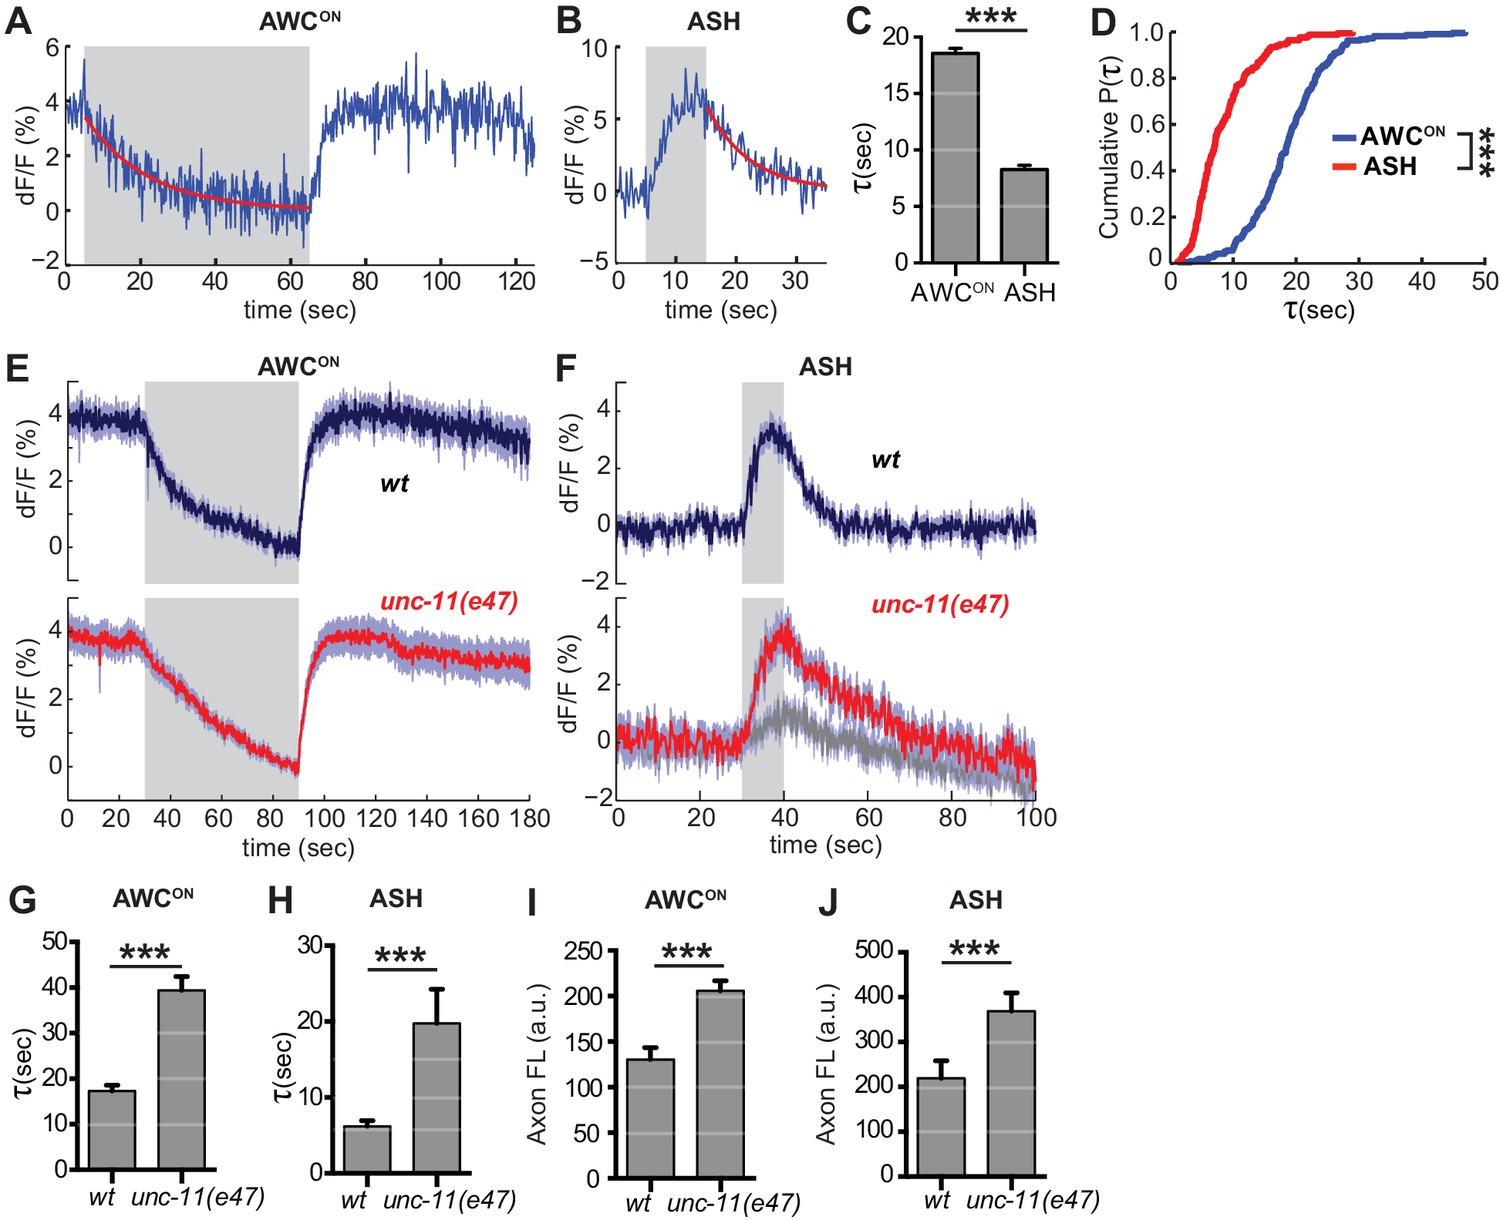
The decrease in VGLUT-pH fluorescence at synapses represents the recapture of the protein from the cell surface by endocytosis and the acidification of the resulting synaptic vesicles (Balaji and Ryan, 2007; Sankaranarayanan and Ryan, 2000)(Figure 1—figure supplement 1C). To estimate the rate of this combined retrieval step, we fit fluorescence decreases from individual AWCON and ASH trials to an exponential decay function (Figure 6A,B) (Smith et al., 2008). A large fraction of traces were consistent with single exponential decay, with an 18 s time constant for AWCON and an 8 s time constant for ASH (Figure 6C,D); a subset of traces were consistent with double exponential decay (Figure 6—figure supplement 1). The measured decay constants within and between neurons did not correlate with axon fluorescence before endocytosis (Figure 6—figure supplement 2), suggesting that VGLUT-pH expression levels did not saturate the endocytosis machinery (Sankaranarayanan and Ryan, 2000).
Figure 6 with 2 supplements see all
Synaptic vesicle retrieval is accelerated by AP180/CALM.
(A,B) Representative single exponential fits (red) to single trials of (A) AWCON and (B) ASH VGLUT-pH decays upon stimulus addition or removal, respectively. For each neuron, some responses were consistent with double exponential decay models (Figure 6—figure supplement 1). (C) Average time constant of AWCON and ASH decays from single exponential fits. AWCONn = 218 (76 animals, 2–3 trials each). ASH n = 168 (56 animals, 2–3 trials each). ***p<0.0001, unpaired t-test. (D) Empirical cumulative distribution plot of data in (C). Distributions differ by Kolmogorov-Smirnov test, ***p<0.0001. (E,F) Average VGLUT-pH responses in unc-11(e47) mutants. (E) AWCON responses in unc-11(e47) n = 27 (10 animals, 2–3 trials each), wt n = 15 (5 animals, three trials each). One unc-11(e47) animal did not respond and was removed from the analysis. (F) ASH responses in unc-11(e47) mutants. wt n = 21 (7 animals, three trials each). unc-11(e47) n = 23 (8 animals, 2–3 trials each). Red trace: mean of 9 trials (five animals, 1–2 trails each) with clear responses to odor addition. Magnitude of response does not differ from wt (p=0.72, peak odor response); Gray trace: mean of 14 trials that produced weak or non-detectable responses to odor addition, significantly different from wt (p<0.0001, peak odor response). One-way ANOVA, Tukey’s correction. (G,H) Average time constants from single exponential fits (initial 20 s of decay) of data in (E,F). For ASH unc-11(e47) mutants, only data from the red trace was used. Unpaired t-test, p<0.0001. AWCON unc-11(e47) n = 25 (10 animals, 2–3 trials each); wt n = 15 (5 animals, three trials each). ASH n as in (F). (I,J) Average axon fluorescence (first 5 frames of the recording). (I) AWCON wt n = 12 animals, unc-11(e47) n = 19 animals. (J) ASH wt n = 7 animals, unc-11(e47) n = 8 animals. Unpaired t-test, p<0.0001. Gray areas mark stimulus periods. Shading and error bars indicate S.E.M.
-
Figure 6—source data 1
Source data for Figure 6.
- https://doi.org/10.7554/eLife.31234.018
Among the proteins most strongly implicated in synaptic vesicle retrieval is the adaptor protein AP180, which clusters synaptic vesicle proteins (Gimber et al., 2015; Koo et al., 2011) and interacts with AP-2/clathrin at a sorting stage immediately after endocytosis (Koo et al., 2015). The C. elegans AP180/CALM homolog unc-11 has long been proposed to affect endocytosis, as well as affecting synaptic vesicle morphology and protein sorting (Nonet et al., 1999). Indeed, in AWCON neurons upon odor addition, and in ASH neurons after stimulus removal, unc-11(e47) null mutants had significantly slowed VGLUT-pH retrieval (Figure 6E–H). Exocytosis may also be impacted in unc-11(e47) mutants, as a significant fraction of trials produced weak or undetectable responses in ASH (Figure 6F, gray trace). Baseline VGLUT-pH fluorescence was higher in unc-11(e47) mutants than in wild-type for both neurons, consistent with increased VGLUT-pH on the cell surface or in other neutral compartments (Figure 6I,J).
Activity-dependent regulation of VGLUT-pH retrieval in AWCON
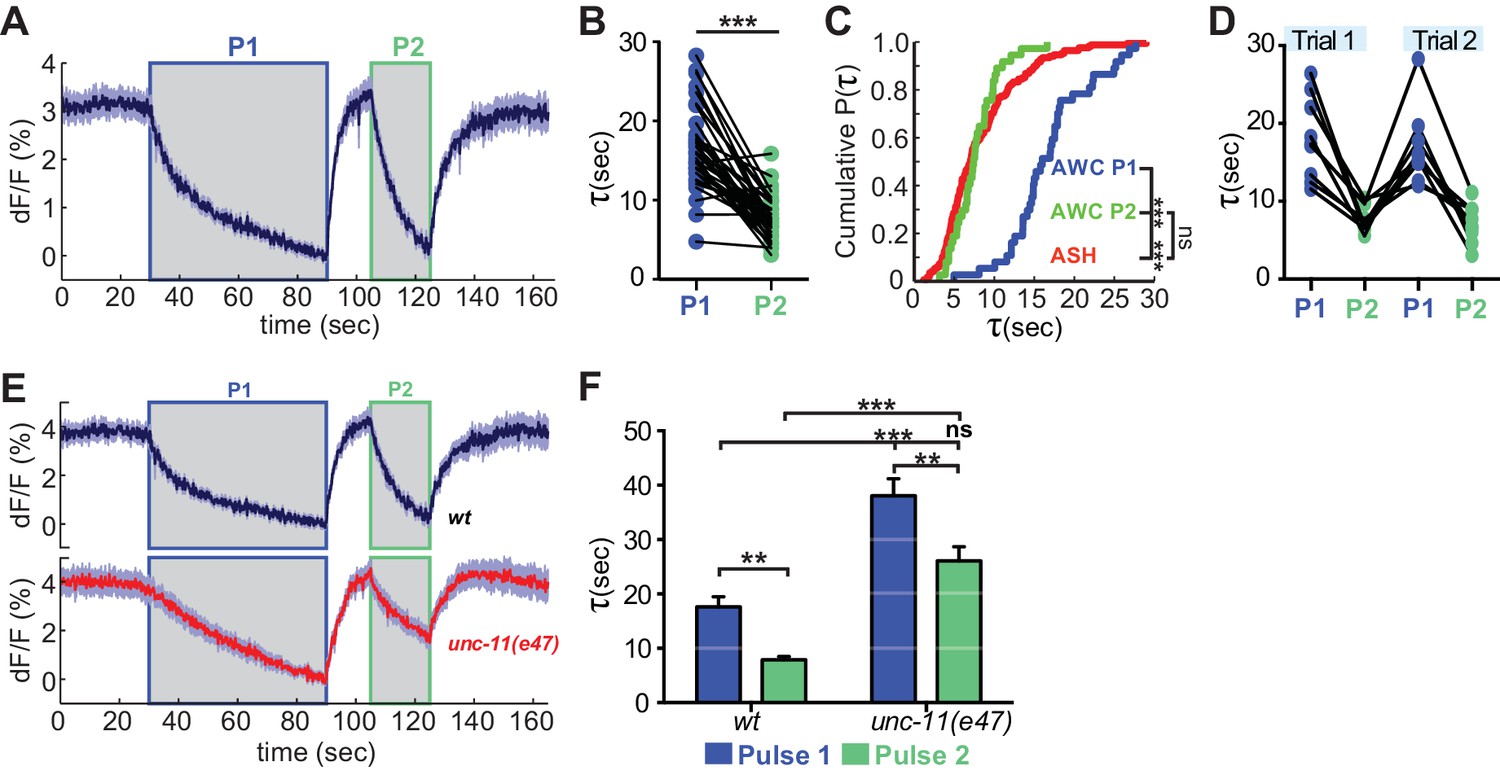
The distinct endocytosis and recapture rates in AWCON and ASH could reflect either cell type-specific or cell state-specific processes. With respect to cell state, the GCaMP signals in AWCON and ASH suggest that the calcium levels in ASH at the end of a NaCl stimulus resemble those in AWCON after odor removal, not the basal calcium levels when odor is added (Figure 1A,B; see Materials and methods). This difference in calcium levels could affect vesicle traffic, as endocytosis in other systems is accelerated at high calcium concentrations (Leitz and Kavalali, 2016; Neves et al., 2001; Sankaranarayanan and Ryan, 2001). To separate the effects of cell type and cell state, we compared VGLUT-pH retrieval in AWCON at basal and elevated calcium levels. Odor was delivered to AWCON, removed after one minute to elicit a calcium overshoot, and then delivered again after 10 s while calcium levels were still elevated (Figure 7A). Strikingly, AWCON VGLUT-pH retrieval was accelerated during the second odor pulse, matching the ~8 s retrieval time observed in ASH (Figure 7B,C). The effect was temporary (lasting <70 s) but could be induced again after another 60 s odor pulse (Figure 7D). unc-11(e47) mutants were also regulated by the dual odor-pulse protocol, and delayed compared to wild-type under both conditions (Figure 7E,F). These results indicate that VGLUT-pH retrieval in AWCON is regulated by activity, consistent with calcium-dependent acceleration of endocytosis.
Figure 7
Recent neural activity modulates AWCON VGLUT-pH retrieval.
(A) Average AWCON VGLUT-pH response to two successive odor stimuli, applied for 60 s (P1) and 20 s (P2). n = 39 (13 animals, three trials each). (B) Time constants from single-term exponential fits to P1 and P2 from (A) performed on the initial 20 s of the decay for each pulse. n = 37 (13 animals, 2–3 trials each). Paired t-test, ***p<0.0001. (C) Cumulative distribution plot of time constants for AWC P1, AWC P2, and ASH VGLUT-pH decays. AWC P1 and AWC P2 data from (B) and ASH data from Figure 6D. Kruskal-Wallis and Dunn’s test for multiple comparisons, ***p<0.0001, ns p=0.1. (D) Time constants for P1 and P2 from two consecutive trials of the stimulation protocol in (A) (n = 8 animals, 70 s between trials). (E) Average AWC VGLUT-pH signals in wt and unc-11(e47) mutants. wt n = 21 (7 animals, three trials each). unc-11(e47) n = 25 (9 animals, three trials each) (two non-responding trials removed). (F) Average time constants from single exponential fits (initial 20 s of decay) of data in (E). wt n = 21 (7 animals, three trials each). unc-11(e47) n = 22 (8 animals, 2–3 trials each). Two-way ANOVA, ***p<0.0001, **p<0.008, ns (p=0.07). Gray areas marks stimulus periods. Shading and error bars indicate S.E.M. ns = not significant.
-
Figure 7—source data 1
Source data for Figure 7.
- https://doi.org/10.7554/eLife.31234.020
Protein kinase C epsilon regulates AWCON exocytosis downstream of calcium
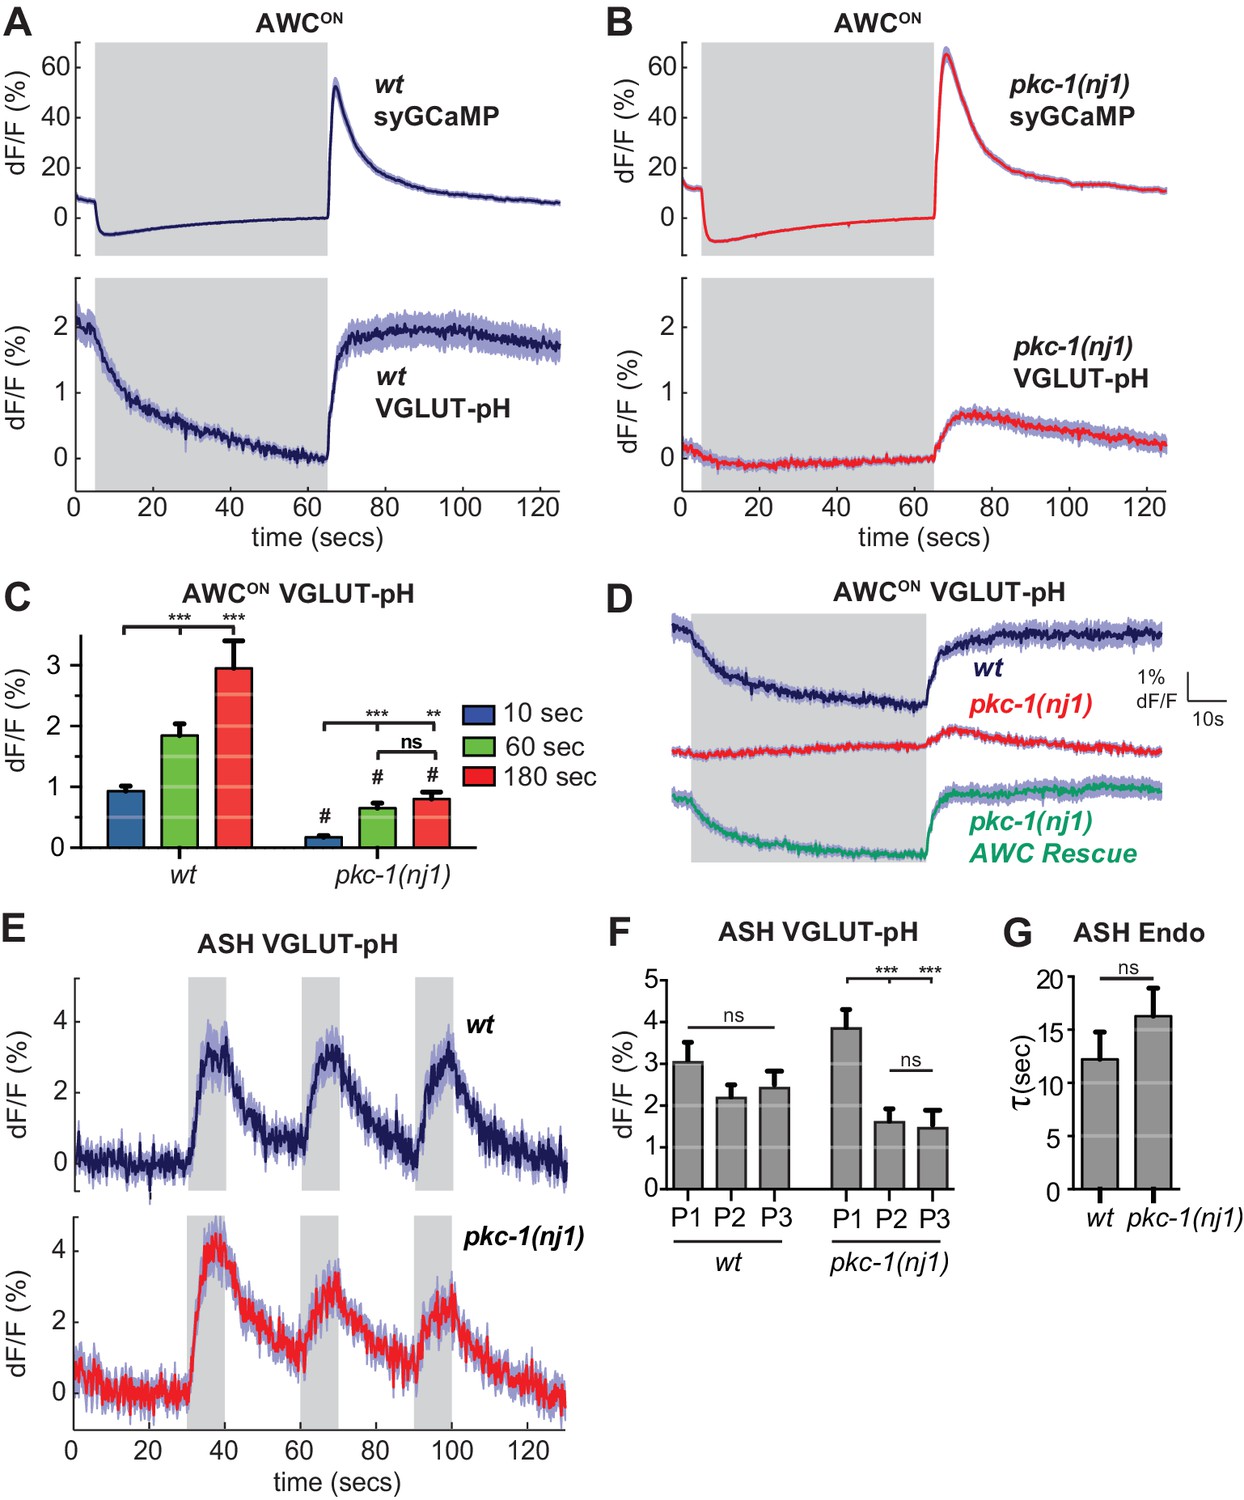
As a first step toward using VGLUT-pH imaging to examine more selective regulators of synaptic transmission, we examined mutants in the protein kinase C epsilon (novel class) encoded by pkc-1. pkc-1 is required for normal behavioral responses to odors detected by AWCON, and has previously been suggested to act at a step downstream of AWCON calcium entry (Tsunozaki et al., 2008). We confirmed the normal calcium response to odor stimulation in pkc-1 mutants (Figure 8—figure supplement 1A,B), and additionally determined that synaptic calcium signals detected with synaptogyrin-GCaMP were normal or slightly increased in pkc-1 mutants (Figure 8A,B, top). By contrast, VGLUT-pH signals in mutants with the kinase-inactivating mutation pkc-1(nj1) were severely diminished across all conditions, resembling those of strong SNARE mutants (Figure 8B,C). Three additional pkc-1 alleles had related defects: in each case, the response to odor addition was nearly eliminated, and the response to odor removal was diminished to a greater or lesser degree (Figure 8—figure supplement 1D).
Figure 8 with 1 supplement see all
pkc-1 regulates AWCON glutamate release downstream of calcium influx.
(A,B) AWCON synaptic calcium (top) and VGLUT-pH (bottom) responses in (A) wild-type and (B) pkc-1(nj1) mutant animals. wt SyGCaMP n = 21 (7 animals, three trials each), pkc-1 SyGCaMP n = 25 (9 animals, 1–3 trials each). wt VGLUT-pH n = 29 (10 animals, 2–3 trials each), pkc-1(nj1) VGLUT-pH n = 48 (17 animals, 2–3 trials each). (C) Average AWCON VGLUT-pH peak response magnitude after odor removal for indicated stimulation durations. #, different from wild-type p<0.0001. **p=0.0026, ***p<0.0001. Two-way ANOVA Tukey’s correction. 10 s pulses: wt n = 60 (10 animals, six trials each). pkc-1(nj1) n = 102 (17 animals, 4–6 trials each). 60 s pulses: as in (A,B). 3 min pulses: wt n = 8 (8 animals, one trial each). pkc-1(nj1) n = 15 (15 animals, one trial each). (D) Expression of pkc-1 cDNA in AWCON rescues pkc-1(nj1) VGLUT-pH responses. wt n = 18 (6 animals, three trials each). pkc-1(nj1) n = 30 (10 animals, three trials each). pkc-1(nj1) AWCON rescue n = 30 (10 animals, three trials each). (E) ASH VGLUT-pH responses in pkc-1(nj1) mutants. wt n = 15 (5 animals, three trials each). pkc-1(nj1) n = 15 (6 animals, 2–3 trials each). (F) Average ASH VGLUT-pH peak responses for each stimulus pulse (P1-3) within a trial. Data from (E). Two-way ANOVA Tukey’s correction. ***p<0.0001. (G) Average time constants from single exponential fits of data in (E, first pulse). Supporting statistical analysis for all panels is detailed in Supplementary file 3C and Source Data. Gray areas mark stimulus periods. Shading and error bars indicate S.E.M. ns = not significant.
-
Figure 8—source data 1
Source data for Figure 8.
- https://doi.org/10.7554/eLife.31234.023
Selective transgenic expression of a pkc-1 cDNA in AWCON resulted in full rescue of the VGLUT-pH defect and the behavioral defect (Figure 8D, Figure 8—figure supplement 1C), indicating that pkc-1 affects synaptic vesicle exocytosis cell autonomously in AWCON.
In contrast with AWCON, VGLUT-pH signals in ASH neurons were only slightly affected by pkc-1: pkc-1 mutants substantially preserved both exocytosis and retrieval dynamics in ASH (Figure 8E–G). A subtle pkc-1 defect was observed upon repetitive stimulation, where VGLUT-pH exocytosis responses were diminished compared to wild-type (Figure 8F). This effect was temporary and recovered within ~1 min.
Discussion
Physiological sensory stimuli elicit different patterns of synaptic vesicle exocytosis and retrieval in the AWCON and ASH sensory neurons, as inferred from real-time changes in VGLUT-pH fluorescence. The ASH neuron has two distinct synaptic states: a basal state with low-calcium levels and low exocytosis, and a stimulated state with high calcium levels and increased exocytosis. The AWCON neuron has three states: a basal state with tonic exocytosis and retrieval, an odor-evoked low-calcium state in which exocytosis is suppressed but retrieval continues, and a transient state after the removal of a long-duration odor stimulus with high calcium, accelerated exocytosis, and accelerated endocytosis.
VGLUT-pH signals in AWCON and ASH are correlated with sensory-evoked calcium dynamics across a variety of conditions, and their sensitivity to genetic manipulations of the conserved SNARE proteins and regulators of endocytosis support the conclusion that they reflect endogenous synaptic vesicle dynamics. The graded properties inferred for AWCON neurons are consistent with those of C. elegans motor neurons measured at the neuromuscular junction (Liu et al., 2009), in agreement with the absence of sodium-based action potentials in nematode neurons (Goodman et al., 1998; Liu et al., 2009). Another point of similarity between AWCON and motor neurons is the existence of distinct basal and evoked synaptic release modes (Richmond et al., 1999; Francis et al., 2005; Martin et al., 2011), which may differentially transmit signals to downstream behavioral circuits (Kato et al., 2014).
Cell type-specific regulation of the synaptic vesicle machinery in sensory neurons
The SNARE complex is required at all known synapses, but the detailed functions of the highly conserved SNARE regulators are still being determined. We found that the requirements for SNARE regulators differed between neurons. Both AWCON and ASH had a partial requirement for unc-10/RIM. unc-13 was essential for all VGLUT-pH responses in ASH, in agreement with previous studies of postsynaptic responses to ASH stimulation (Lindsay et al., 2011), whereas unc-18 was less important. By contrast, AWCON was more strongly dependent on unc-18 than unc-13. Thus the synaptic requirement for unc-13 and unc-18 may differ across different synapses or conditions, even in cells in which both genes are expressed and active (Atwood and Karunanithi, 2002; Crawford and Kavalali, 2015; Kasai et al., 2012)
In unc-13 mutants, AWCON did not respond to odor addition with a normal decrease in VGLUT-pH, but did exhibit some exocytosis immediately after odor removal. These dynamics suggest that tonic AWCON release cannot be maintained in unc-13(lf) mutants, but synaptic vesicles can be released after a large calcium influx. This result, among others, suggests that the underlying difference between ASH and AWCON cannot be explained entirely by the tonic-evoked distinction: in ASH, unc-13 is required for evoked release, but in AWCON, it is more important in tonic exocytosis.
Complexin interacts with the SNARE proteins synaptobrevin and syntaxin, modifying their function to inhibit basal release and facilitate evoked release (Malsam et al., 2008; Martin et al., 2011; McMahon et al., 1995; Rizo and Xu, 2015; Wragg et al., 2013; Xue et al., 2009). The striking increase in ASH VGLUT-pH signals in cpx-1(lf) mutants, which was not expected based on previous complexin studies, points to another difference between ASH and AWCON. The sources of these differences might reside in cell type-specific calcium channels, synaptic vesicle pools, or endocytosis machinery.
Many questions about synaptic vesicle dynamics in wild-type and mutant neurons remain to be addressed. We have not examined the roles of different calcium sources in AWCON and ASH, although previous studies have demonstrated that both CaV2 unc-2 channels and CaV1 egl-19 channels contribute to calcium entry at the neuromuscular junction (Tong et al., 2017), and both channels are also implicated in the signaling functions of AWCON and ASH (Saheki and Bargmann, 2009; Zahratka et al., 2015). The full relationship between the VGLUT-pH vesicle pools and releasable synaptic vesicle pools is also unknown, although it is encouraging that the VGLUT-pH signals are similar to those observed in biophysically well-characterized systems (Ariel and Ryan, 2010). Finally, for all mutants except pkc-1, we have not determined whether the defects are intrinsic to AWCON and ASH, and therefore it is possible that some of the phenotypes described here are indirect consequences of gene action in other cells, large-scale circuit changes, or altered neuromodulation.
The PKC-1 protein kinase C homolog regulates synaptic vesicle release in AWCON
A striking difference between AWCON and ASH was their dependence on the protein kinase C epsilon homolog PKC-1. pkc-1 mutants had severe defects in VGLUT-pH mobilization in AWCON, with a near complete elimination of the response to odor addition. Different alleles varied in their severity with respect to odor removal, where two alleles that affected the conserved protein kinase domain but spared other protein domains had the strongest phenotypes. These kinase-dead alleles might interfere with interacting proteins, or they might prevent compensation by related kinases whose functions partially overlap with PKC-1 (Madhani et al., 1997; Okochi et al., 2005).
ASH function was nearly normal in pkc-1 mutants, although a subtle defect could be uncovered by pulsing ASH with multiple stimuli. Previous studies at the neuromuscular junction indicated that pkc-1 affects neuropeptide release but not fast synaptic transmission from cholinergic and GABAergic motor neurons (Sieburth et al., 2007). Moreover, pkc-1 mutants have near-normal locomotion, contrasting with the severe locomotion defects in SNARE mutants, providing further evidence of residual fast synaptic transmission at the neuromuscular junction. We suggest that the motor neurons, like ASH, can mobilize synaptic vesicles without pkc-1, in contrast with AWCON where pkc-1 has a substantial role.
Protein kinase C is a well-established potentiator of neurotransmitter release at mammalian synapses (Wierda et al., 2007), a result consistent with those observed here. Interestingly, one of the targets of mammalian PKC is the homolog of UNC-18, Munc18-1, paralleling our observation that AWCON exocytosis has a strong requirement for both UNC-18 and PKC-1. In mouse hippocampal neurons, Munc18-1 clustering at synapses is regulated by activity, calcium influx, and protein kinase C phosphorylation, and correlates with synaptic strength (Cijsouw et al., 2014). At the mouse Calyx of Held, Munc18-1 PKC phosphorylation sites are important for post-tetanic potentiation, a form of plasticity that enhances neurotransmitter release (Genc et al., 2014). C. elegans UNC-18 shares consensus PKC phosphorylation sites, which may be phosphorylated by PKC-2, a different PKC, in thermosensory neurons (Edwards et al., 2012). PKC has other synaptic targets as well; for example, it phosphorylates the calcium sensor synaptotagmin-1 at hippocampal synapses to potentiate synaptic vesicle release (de Jong et al., 2016).
unc-13 and unc-18 mutants have severe locomotion defects and cannot be easily tested for sensory behaviors, but the more agile pkc-1 mutants have been shown to be repelled, rather than attracted, by odors sensed by AWCON (Tsunozaki et al., 2008). Their responses to temperature sensed by AFD neurons can also have a reversed valence, with attraction to high temperatures that are normally repulsive (Luo et al., 2014; Okochi et al., 2005). The behavioral reversal in sensory responses could be related to dynamics of residual glutamate signaling, or it could result from an alternative form of neurotransmission such as neuropeptide release.
Activity-dependent cytoplasmic pH decreases in glutamatergic neurons
Stimuli that evoke calcium increases in AWCON and ASH result in decreased cytoplasmic pH, as reported by pHluorin fluorescence changes. One potential source of the cytoplasmic change is proton mobilization during calcium extrusion by the plasma membrane calcium ATPase (Rossano et al., 2013; Schwiening and Willoughby, 2002; Trapp et al., 1996; Zhang et al., 2010). During periods of elevated calcium levels, pumps are active and acidify the neuron by exchanging protons for calcium ions; when the activity of the neuron decreases and calcium is extruded, activity of the pumps decreases, and the neuron returns to baseline pH levels (Trapp et al., 1996). Consistent with calcium-driven acidosis, both calcium dynamics and pH changes were faster in the axon than in the soma.
The stimulus-induced, exocytosis-independent cytoplasmic pH changes we observed in AWCON and ASH are worth future study, and may have unintended technical effects on other imaging experiments. For example, GCaMP fluorescence increases by as much as 10% for a 0.1 pH unit increase at physiological pH (Kneen et al., 1998; Nakai et al., 2001), and therefore stimulus protocols that alter cytoplasmic pH may confound GCaMP imaging in the same cells.
Synaptic vesicle retrieval in glutamatergic neurons
In simple stimulus protocols, ASH neurons had a faster apparent rate of synaptic vesicle retrieval – the combination of endocytosis and reacidification -- than AWCON neurons. However, the distribution of AWCON decay rates was shifted to faster timescales after a previous stimulation with odor (the acceleration effect), producing a distribution similar to that of ASH. The acceleration effect in AWCON endocytosis may be mediated by the large calcium influx generated by the removal of the first odor pulse, as calcium affects endocytosis in other species (Leitz and Kavalali, 2016; Neves et al., 2001; Sankaranarayanan and Ryan, 2001). Alternative or additional sources of this activity-dependent signal in AWCON include cGMP, which can accelerate endocytosis (Bargmann, 2006; Petrov et al., 2008) or cytoplasmic alkalinization (Zhang et al., 2010), as the AWCON axon becomes significantly alkalinized during odor stimulation.
The average basal and accelerated time constants of synaptic vesicle retrieval in AWCON are ~18 s and ~8 s, within the range reported in other systems. For example, the time constant of endocytosis in hippocampal neurons at physiological temperatures is ~6 s (Balaji and Ryan, 2007), and in goldfish retinal OFF-bipolar cells, the time constants for fast and slow endocytosis measured using a capacitance clamp were 1 s and >10 s, respectively (Neves and Lagnado, 1999). We did not detect signals on the timescale of the ultrafast endocytosis observed in C. elegans motor neurons and mammalian neurons (Watanabe et al., 2013a, 2013b). If ultrafast endocytosis is present in these sensory neurons, the time constant we measure is likely to represent subsequent reacidification.
The AP180/pCALM homolog UNC-11 is required for efficient vesicle retrieval in AWCON and ASH. Our results are consistent with current models of AP180/CALM action that emphasize a role in clathrin-dependent sorting at a stage after endocytosis, but before the generation of mature, acidic synaptic vesicles (Lindner and Ungewickell, 1992; Soykan et al., 2017; Watanabe et al., 2014). It is worth noting that this protein has multiple functions in vesicle generation, including effects on the molecular composition and size of synaptic vesicles (Koo et al., 2015, 2011; Nonet et al., 1999; Zhang et al., 1998).
Conserved neuronal cell types in divergent animals
How similar, and how divergent, are neuronal cell types in different animals? In genetics, the concept of orthologous genes serves as a valuable framework for cross-species comparisons; whether such orthologous relationships apply to neuronal cells is a subject of debate (Vergara et al., 2017). The argument for cell type conservation has been mainly based on developmental transcription factors, rather than mature neuronal properties (Vergara et al., 2017). Here, we found that AWCON neurotransmission, like its sensory signaling, resembles that of vertebrate photoreceptor neurons. Both AWCON and photoreceptors have basal sensory activity that is suppressed with stimulation, cGMP-based transduction machinery, and circuitry that bifurcates into two streams of ON/OFF neurons (Chalasani et al., 2007). We observed that these similarities extend to the synaptic dynamics of AWCON and zebrafish and goldfish OFF-bipolar neurons, which resemble photoreceptors (Morgans, 2000; Odermatt et al., 2012). Both AWCON and OFF-bipolar neurons have fast and slow modes of synaptic vesicle exocytosis and retrieval that are modulated by neuronal activity (Neves et al., 2001; Neves and Lagnado, 1999). Moreover, synaptic vesicle priming in photoreceptor and bipolar neurons of the mammalian visual system has been suggested to be largely independent of Munc-13 (Cooper et al., 2012), and we observed residual synaptic vesicle release from AWCON in unc-13(lf) mutants. The extensive similarity between vertebrate retinal neurons and C. elegans olfactory neurons suggests that they are evolutionarily conserved cell types.
The differences between neuronal cell types across animals are also very substantial – for example, most C. elegans neurons do not have sodium-based action potentials (and neither do vertebrate photoreceptors). It remains to be seen how widely the idea of orthologous cell types holds, but it makes specific predictions. For example, we found that ASH and AWCON sensory neurons had different synaptic dynamics and molecular requirements: are ASH neurons similar to vertebrate nociceptors in their synaptic properties, as they are in their sensory use of TRPV channels? If neurons do fall into conserved classes, the convergence of genetics, behavior, and imaging tools such as pHluorins in C. elegans provide an avenue to uncovering their basic properties and underlying molecular mechanisms with single-cell resolution in vivo.
Materials and methods
C. elegans culture
Request a detailed protocolC. elegans strains were maintained under standard conditions on NGM plates at 21–22°C and fed OP50 bacteria (Brenner, 1974). Wild-type animals correspond to the Bristol strain N2. Transgenic lines were generated using standard methods by injecting young adult hermaphrodites with the desired transgene and a co-injection plasmid that expresses a fluorescent marker. In some cases, empty vector was included to increase the overall DNA concentration to a maximum of 100 ng/µl. A full strain list and the identity of mutants are presented in Supplementary files 1 and 2.
Molecular biology
Request a detailed protocolFor cell-specific expression in AWCON and ASH we used the promoters str-2 and sra-6, respectively. The VGLUT-pH expression construct was created by subcloning super-ecliptic pHluorin (GenBank AAS66682.1) into the first luminal loop domain of the C. elegans vesicular glutamate transporter eat-4, based on homology to mammalian VGLUT-1 (Voglmaier et al., 2006). Using site-directed mutagenesis (Stratagene quickchange protocol) we inserted a KPN-1 restriction site into the eat-4.a cDNA (wormbase CDS ZK512.6a) after the conserved glycine residue at position 106. Super-ecliptic pHluorin was inserted into this site using primers that added a 14 amino acid linker.
Forward primer:
‘5-GAATCGTAGGTACCTCTACCTCTGGAGGATCTGGAGGAACCGGAGG
ATCTATGGGAAGTAAAGGAGAAGAACTTT-3
Reverse primer:
‘5-GAATCGTAGGTACCTCCGGTTCCTCCAGATCCTCCGGTTCCTCCGG
TTCCTCCACCGGTTTTGTATAGTTCATCCA-3’
syGCaMP was created by fusing GCaMP3 to the C-terminus of synaptogyrin-1 (sng-1). sng-1 cDNA (wormbase CDS T08A9.3) was isolated from a N2 whole worm cDNA library and subcloned into a pSM expression vector containing GCaMP3 using AflII and SacII restriction enzymes. sng-1 was fused to GCaMP3 through a 6x Glycine-Serine linker.
Forward primer: 5'- CAAATGATGACAGCGAAGTGGCTTAAGCATGGTATTGATATCTGAGC-3
Reverse primer:5'- GAATCGTAccgcggGAACCACTACCACTACCataaccatatcct tccgactga-3'
To create CD4-pH, Super-ecliptic pHlourin was localized to the extracellular surface by fusion to a modified form of CD4 (Feinberg et al., 2008). CD4-pH was produced by exchanging the spGFP 1–10 in the pSM vector CD4-2::spGFP1-10 (Feinberg et al., 2008) for super-ecliptic pHluorin using the restriction sites Nhe1 and Sal1. The inserted super-ecliptic pHluorin contained the N-terminal linker domain: Gly-Gly--Gly--Gly--Gly-Ser-Gly--Gly--Gly--Gly-Ser.
AWCON pkc-1 rescue: pkc-1.a cDNA (corresponding to wormbase’s CDS F57F5.5a sequence) was isolated from N2 whole worm cDNA libraries and subcloned into the pSM expression vector using Nhe1 and Kpn1 restriction sites. AWCON expression was achieved using the str-2 promoter (vector str-2:pkc-1.a_cDNA:sl2:mCherry). Expression was confirmed for each animal tested by checking for co-expression of mCherry. pkc-1 cDNA isolation primers:
Forward:
‘5-GAATCGTAGCTAGCATGCTGTTCACAGGCACCGTGC-3’
Reverse:
‘5-GAATCGTAGGTACCTTAGTAGGTAAAATGCGGATTGA-3’
Imaging activity-dependent fluorescence reporters
Request a detailed protocolAll imaging experiments for a given condition or observation were repeated on at least two separate days using independently prepared buffers and stimuli. The number of trials per animal and the total number of animals are reported along with the total trial number in the figure legends. The interval length for all trials was 30 s in addition to the time recorded before or after the stimulation. For AWCON recordings in which the pulse length was varied, stimulation was ordered sequentially as follows: 6 trials with 10 s pulses, 3 trials with 60 s pulses, and a single 3 min pulse. Order of stimulation did not appear to affect results. Most stimulation protocols involved multiple trials per animal, as detailed in figure legends. Each trial was considered a biological replicate for the purpose of statistical analysis. No more than three trials were conducted per animal except for Figure 2C and 2E (10 s odor pulses). For all experiments, wild-type controls and mutants were measured in parallel, cycling individual animals from each genotype: wild-type, mutant, repeat.
GCaMP reporters were empirically chosen to match the dynamic range of signaling in the relevant neuron and compartment. The higher-affinity GCaMP5A protein detects both calcium increases and decreases in AWCON cell body, whereas the lower-affinity GCaMP3 protein preferentially reports the peak calcium levels in AWCON axons and the ASH cell body, declining only slightly after odor addition to AWCON.
Imaging was conducted on a Zeiss Axiovert 100TV wide-field microscope on animals loaded into custom-built PDMS microfluidic chambers (Chronis et al., 2007). Images of synapses were acquired through a 100 × 1.4 NA Zeiss APOCHROMAT objective onto an Andor ixon +DU-987 EMCCD camera using Metamorph 7.7.6–7.7.8 acquisition software. Camera settings: 14-bit EM-GAIN enabled digitizer (3MHz); baseline clamped; overlapped recording mode; 0.3 uS vertical clock speed; binning = 1. Most experiments used a pre-amplifier gain of 5x. Illumination was provided by a Lumencore SOLA-LE solid-state LED lamp. Illumination input was passed through a 1.3 ND filter. Narrow bandwidth blue light illumination (484–492 nm) was produced using the CHROMA 49904-ET Laser Bandpass filter set. Images were cropped around the head of animal. Stimulus triggering was performed through Metamorph via digital input from a National Instruments NI-DAQmx box to an Automate Valvebank 8 II actuator that triggered Lee Corporation solenoid valves. Custom journals specified pre-programmed recording parameters and performed automated file naming and storage.
TIFF time-stacks were acquired at five frames per second (fps) using a 200 msec acquisition time in most cases; for AWCON GCaMP5 cell body recordings, TIFF time-stacks were acquired using a 40x objective at 10 fps, 100 msec acquisition time.
Animals were age-synchronized by picking L4s onto fresh NGM OP50 seeded plates 12–18 hr before experiments. For recordings of AWCON activity, animals were starved for 20–30 min in S basal buffer (Brenner, 1974) prior to loading into the microfluidic chamber. All imaging was conducted in S basal buffer. To prevent movement, animals were paralyzed with 1 mM (-)-Tetramisole hydrochloride (Sigma-Aldrich, St. Louis, MO) during acquisition (Gordus et al., 2015). After loading in the microfluidic chambers, animals were allowed to acclimate for 5 min before imaging. For recordings of ASH activity, a 90 s recording was performed before any stimulation to allow animals to adapt to the blue light.
Butanone (Sigma) or NaCl (Fisher) stimuli were prepared fresh on the day of the experiment from pure stock solutions. The final butanone concentration was 11.2 µM (10−6 dilution, prepared by serial 10−3-fold dilutions) and the final NaCl concentration was 500 mM. Stimulus and control solutions were prepared in S basal buffer in amber glass vials. Control buffer and stimuli were delivered via 30 mL syringe reservoirs (Fisher).
Acquisition of fluorescence measurements
Request a detailed protocolTo extract fluorescence measurements from VGLUT-pHluorin images, we developed custom semi-automated tracking software in ImageJ. Images were first corrected for x-y drift using image registration that placed the axon at a specific set of image coordinates for the entire recording by shifting each frame in x and/or y (Tseng et al., 2011). The microfluidic device prevents most z-plane drift, but images in which significant z-plane drift was detected were discarded. To aid in axon selection, images underwent rolling-ball background subtraction and then were averaged over space (two pixels in x and y) and time (average of time-stack) (Figure 1—figure supplement 2). The entire segment of the axon that was in view was then specified by the user and outlined by hand with the aid of pixel intensity thresholding. From this axon outline, intensity and pixel information was extracted from the raw drift-corrected recording along with local background measurements along the axon (Figure 1—figure supplement 2E). This process was also used to acquire measurements of AWCON syGCaMP images.
The sra-6p promoter used for ASH imaging is also expressed in the ASI and PVQ neurons, whose axons are posterior to the ASH axon. VGLUT-pH fluorescence could also be detected in these other axons (mainly PVQ) but did not significantly respond to stimulation. In any given experiment, we recorded VGLUT-pH signals from a single ASH axon, either the on right or left side of the animal. Because of ASI and PVQ VGLUT-pH fluorescence, only the anterior background ROIs were used in analysis of ASH VGLUT-pH recordings.
For cell body measurements of GCaMP responses in AWCON and ASH we used a custom written ImageJ script (Gordus et al., 2015) to track cell body position and extract intensity measurements.
To validate the analysis of the entire axon as a single integrated measurement in VGLUT-pH experiments, we measured VGLUT-pH responses from small equally spaced ROIs along the axon. These were obtained by taking the outlined axon segment as in (Figure 1—figure supplement 2E) and cutting the axon into smaller ROI segments, each eight pixels long in the y-axis, and performing a correlation analysis on a dataset of AWCON VGLUT-pH recordings from wild-type animals stimulated with a 60 s pulse of 11.2 uM butanone. For 120 stimulated axons, all ROIs along the axon were positively correlated with the mean integrated axon fluorescence (Figure 1—figure supplement 2F). There was scatter in the strength of this correlation across different ROIs, potentially consistent with heterogeneity among synaptic regions (Figure 1—figure supplement 2F), but given the small magnitude of the signal this possibility was not examined further.
For technical reasons, we were unable to estimate the total releasable vesicle pool by the methods used in other systems. Attempts at fluorescence dequenching by soaking the animal in NH4Cl were unsuccessful. Strong stimuli, which are used to deplete the vesicle pool in other systems, inhibit AWCON rather than activating it, and ASH habituates rapidly to stimulation.
Quantification of fluorescence changes; background and bleaching correction
Request a detailed protocolIn all traces, dF/F was calculated as:
(1)
=fluorescence of the ROI minus the corrected background at time (t)
= fluorescence of the ROI minus the background at a reference time point or value.
For AWCON, Fo was set to the mean background-corrected signal two seconds before odor removal. For ASH recordings, Fo was set to the mean background-corrected signal two seconds before the first stimulus for each trial. In each case, Fo corresponded to a stable baseline within and across recordings.
VGLUT-pH has a low baseline signal that is relatively close in intensity to the background autofluorescence generated by the surrounding tissue of the head. This became problematic when attempting to apply background subtraction and perform comparisons of fluorescence change using the deltaF function (dF/F) described above (Equation 1). The deltaF function normalizes the fluorescence change to its baseline intensity, allowing a comparison of signal changes between conditions with different absolute values, but is highly sensitive to fluctuations in Fo when Fo is small. For VGLUT-pH, a further confound is created by reporter localization to parts of secretory pathway(s) that do not participate in synaptic release. These can be seen as small puncta that contribute to Fo but not to fluorescence changes. To prevent background correction from shifting Fo into a realm where small variations in Fo generate large fluctuations in deltaF, we subtract only the fluctuations in the background signal (Equation 2):
(2)
=background at time (t)
=minimum background value during the recording.
VGLUT-pH has very slow bleaching kinetics (Ariel and Ryan, 2010; Balaji and Ryan, 2007), essentially showing little to no bleaching over the timecourse of our recordings. This is likely the result of the reporter existing mainly within synaptic vesicles in the quenched state, and the rapid cycling of the fluorescent form back into this state. Unlike the VGLUT-pH reporter, background autofluorescence does show significant bleaching, and therefore using this background signal for correction can result in an artificial increase in the VGLUT-pHuorin signal over time. To avoid this artifact, we corrected for background bleaching before performing background correction. Bleaching was assumed to be approximately linear and was modeled by line fitting using the Matlab function ‘polyfit.’ A threshold for specifying significant bleaching was set to a 0.5% drop in mean fluorescence intensity over 2 min of recording time. Bleaching was corrected by subtracting the linear fit from the background signal.
Statistical analysis and curve fitting
Request a detailed protocolAll statistical tests are indicated in figure legends, and were performed using Prism 7 GraphPad software. Additional supporting statistical analysis for each figure can be found in the corresponding Source Data files. Unless otherwise stated, all acquired data for a given condition were included in the analysis. A given genotype or condition was tested in at least four animals recorded over at least two different days, unless the same condition was replicated in another presented dataset. This minimum number was based on the high reliability of stimulus-evoked responses in wild-type animals (non-responders/trials: ASH, 5/204; AWCON, 2/132). For mutant strains, data were collected for at least ten trials and typically for 20–30 to enable detection of intermediate effects.
Fitting of decay curves was performed in Matlab using the ‘fit’ function with a custom ‘fitType’ equation. For single exponential fits fitType = a1*exp (-x/tau1)+C. For double exponential fits fitType = a1*exp (-x/tau1)+a2*exp (-x/tau2)+C. For triple exponential fits fitType = a1*exp (-x/tau1)+a2*exp (-x/tau2)+a3*exp (-x/tau3)+C. In each case, all ‘a’ and ‘tau’ variables are fitted parameters and are constrained to be greater than zero. C = the baseline to which traces decayed, normalized to zero. Unless stated otherwise, fitting was applied to the entire decay period of the trace, which corresponds to the odor-addition phase for AWCON or the 20 s immediately following NaCl removal for ASH. For comparison of AWCON decays during different stimulus durations (60 s vs 20 s, Figure 7), we fit both traces using the initial 20 s to keep comparisons consistent. Decay constant averages reported for a given condition were performed as follows: each individual trace for a given data set was fitted individually, and each fit was plotted on its trace and then inspected. Traces that could not be fit due to high noise or did not exhibit a decay were removed from the analysis and is reflected in the change in n reported in the figure legends.
Comparing exponential fits using AICC
Request a detailed protocolTo compare models we used the Akaike’s Information Criterion (AIC) as described in (Motulsky and Christopoulos, 2004): AIC = , where N = number of data points, K = number of parameters, and SS = is the sum of the square of the vertical distances of the points from the curve. We used the corrected version for small N: AICC = . AICC was performed for the fit on each individual trace. To determine of the relative likelihood of two models, we computed the probability that one model is more likely than the other (AICP): AICP = , where Δ = the difference in AICC scores. All AIC-based analysis was conducted in Matlab using custom scripts.
Butanone chemotaxis assays
Request a detailed protocolButanone chemotaxis assays were conducted on square plates containing 20 ml chemotaxis agar (1.6% Agar, 5 mM potassium phosphate buffer pH 6.0, 1 mM CaCl2, 1 mM MgSO4) poured 18–24 hr before the assay. Adult animals were removed from NGM growth plates with chemotaxis buffer (5 mM potassium phosphate buffer pH 6.0, 1 mM CaCl2, 1 mM MgSO4), transferred to 1.5 ml microcentrifuge tubes (Eppendorf) and washed twice with chemotaxis buffer. 1 µl of 1 M sodium azide spotted at the location of odor and control spots was used to immobilize animals that reach odor sources. ~100–350 animals were spotted onto the center of the chemotaxis plate. Two 1 µl spots of butanone diluted in ethanol (1:1000) were spaced on one edge of the plate, opposite to two 1 µl spots of ethanol control. The liquid drop containing the animals was then wicked away to start the assay. Assays were allowed to run for 1–2 hr and then moved to 4°C prior to counting. The chemotaxis index was calculated as = (# animals on odor side – # animals on control side) / (Total # counted animals).
References
-
Optical mapping of release properties in synapsesFrontiers in Neural Circuits 4:18.https://doi.org/10.3389/fncir.2010.00018
-
Diversification of synaptic strength: presynaptic elementsNature Reviews Neuroscience 3:497–516.https://doi.org/10.1038/nrn876
-
Regulation and modulation of pH in the brainPhysiological Reviews 83:1183–1221.https://doi.org/10.1152/physrev.00010.2003
-
Munc18-1 redistributes in nerve terminals in an activity- and PKC-dependent mannerThe Journal of Cell Biology 204:759–775.https://doi.org/10.1083/jcb.201308026
-
Munc13-independent vesicle priming at mouse photoreceptor ribbon synapsesJournal of Neuroscience 32:8040–8052.https://doi.org/10.1523/JNEUROSCI.4240-11.2012
-
Distinct initial SNARE configurations underlying the diversity of exocytosisPhysiological Reviews 92:1915–1964.https://doi.org/10.1152/physrev.00007.2012
-
Green fluorescent protein as a noninvasive intracellular pH indicatorBiophysical Journal 74:1591–1599.https://doi.org/10.1016/S0006-3495(98)77870-1
-
EAT-4, a homolog of a mammalian sodium-dependent inorganic phosphate cotransporter, is necessary for glutamatergic neurotransmission in caenorhabditis elegansJournal of Neuroscience 19:159–167.
-
Ca2+ dependence of synaptic vesicle endocytosisThe Neuroscientist 22:464–476.https://doi.org/10.1177/1073858415588265
-
Clathrin-associated proteins of bovine brain coated vesicles. An analysis of their number and assembly-promoting activityThe Journal of biological chemistry 267:16567–16573.
-
Membrane fusion: SNAREs and regulationCellular and molecular life sciences : CMLS 65:2814–2832.https://doi.org/10.1007/s00018-008-8352-3
-
UNC-18 promotes both the anterograde trafficking and synaptic function of syntaxinMolecular Biology of the Cell 19:3836–3846.https://doi.org/10.1091/mbc.E08-02-0160
-
Neurotransmitter release at ribbon synapses in the retinaImmunology and Cell Biology 78:442–446.https://doi.org/10.1046/j.1440-1711.2000.00923.x
-
BookFitting Models to Biological Data Using Linear and Nonlinear Regression: A Practical Guide to Curve FittingOxford; New York: Oxford University Press.
-
A high signal-to-noise Ca(2+) probe composed of a single green fluorescent proteinNature Biotechnology 19:137–141.https://doi.org/10.1038/84397
-
UNC-11, a Caenorhabditis elegans AP180 homologue, regulates the size and protein composition of synaptic vesiclesMolecular Biology of the Cell 10:2343–2360.https://doi.org/10.1091/mbc.10.7.2343
-
Functional properties of the unc-64 gene encoding a Caenorhabditis elegans syntaxinJournal of Biological Chemistry 273:2192–2198.https://doi.org/10.1074/jbc.273.4.2192
-
Diverse regulation of sensory signaling by C. elegans nPKC-epsilon/eta TTX-4The EMBO Journal 24:2127–2137.https://doi.org/10.1038/sj.emboj.7600697
-
The role of cGMP-dependent signaling pathway in synaptic vesicle cycle at the frog motor nerve terminalsJournal of Neuroscience 28:13216–13222.https://doi.org/10.1523/JNEUROSCI.2947-08.2008
-
Short-term presynaptic plasticityCold Spring Harbor Perspectives in Biology 4:a005702.https://doi.org/10.1101/cshperspect.a005702
-
UNC-13 is required for synaptic vesicle fusion in C. elegansNature Neuroscience 2:959–964.https://doi.org/10.1038/14755
-
The synaptic vesicle release machineryAnnual Review of Biophysics 44:339–367.https://doi.org/10.1146/annurev-biophys-060414-034057
-
Presynaptic CaV2 calcium channel traffic requires CALF-1 and the alpha(2)delta subunit UNC-36Nature Neuroscience 12:1257–1265.https://doi.org/10.1038/nn.2383
-
Calcium accelerates endocytosis of vSNAREs at hippocampal synapsesNature Neuroscience 4:129–136.https://doi.org/10.1038/83949
-
PKC-1 regulates secretion of neuropeptidesNature Neuroscience 10:49–57.https://doi.org/10.1038/nn1810
-
Synaptic vesicle endocytosis: fast and slow modes of membrane retrievalTrends in Neurosciences 31:559–568.https://doi.org/10.1016/j.tins.2008.08.005
-
Structural properties of the Caenorhabditis elegans neuronal networkPLoS Computational Biology 7:e1001066.https://doi.org/10.1371/journal.pcbi.1001066
-
The structure of the nervous system of the nematode Caenorhabditis elegansPhilosophical Transactions of the Royal Society B: Biological Sciences 314:1–340.https://doi.org/10.1098/rstb.1986.0056
-
Serotonin differentially modulates Ca2+ transients and depolarization in a C. elegans nociceptorJournal of Neurophysiology 113:1041–1050.https://doi.org/10.1152/jn.00665.2014
-
cGMP signaling in vertebrate retinal photoreceptor cellsFrontiers in Bioscience 10:1191–1204.https://doi.org/10.2741/1612
Article and author information
Author details
Cornelia I Bargmann

Funding
Howard Hughes Medical Institute
- Cornelia I Bargmann
Jensam Foundation
- Cornelia I Bargmann
The funders had no role in study design, data collection and interpretation, or the decision to submit the work for publication.
Acknowledgements
We thank Aditya Rangan for guidance in kinetic modeling, Andrew Gordus for sharing his image analysis code, Tim Ryan and Jeremy Dittman for extensive discussions of synaptic imaging, and Johannes Larsch, Aylesse Sordillo, Qiang Liu, Sagi Levy, and Daniel Colon-Ramos for discussions and comments on the manuscript. This work was supported by the Howard Hughes Medical Institute and by a gift from the Jensam Foundation.
Version history
- Received: August 14, 2017
- Accepted: November 20, 2017
- Accepted Manuscript published: November 21, 2017 (version 1)
- Version of Record published: November 28, 2017 (version 2)
Copyright
© 2017, Ventimiglia et al.
This article is distributed under the terms of the Creative Commons Attribution License, which permits unrestricted use and redistribution provided that the original author and source are credited.
Metrics
-
- 3,853
- views
-
- 614
- downloads
-
- 32
- citations
Views, downloads and citations are aggregated across all versions of this paper published by eLife.
Download links
A two-part list of links to download the article, or parts of the article, in various formats.
Downloads (link to download the article as PDF)
Open citations (links to open the citations from this article in various online reference manager services)
Cite this article (links to download the citations from this article in formats compatible with various reference manager tools)
Diverse modes of synaptic signaling, regulation, and plasticity distinguish two classes of C. elegans glutamatergic neurons
eLife 6:e31234.
https://doi.org/10.7554/eLife.31234
Further reading
-
- Neuroscience
The central tendency bias, or contraction bias, is a phenomenon where the judgment of the magnitude of items held in working memory appears to be biased toward the average of past observations. It is assumed to be an optimal strategy by the brain and commonly thought of as an expression of the brain’s ability to learn the statistical structure of sensory input. On the other hand, recency biases such as serial dependence are also commonly observed and are thought to reflect the content of working memory. Recent results from an auditory delayed comparison task in rats suggest that both biases may be more related than previously thought: when the posterior parietal cortex (PPC) was silenced, both short-term and contraction biases were reduced. By proposing a model of the circuit that may be involved in generating the behavior, we show that a volatile working memory content susceptible to shifting to the past sensory experience – producing short-term sensory history biases – naturally leads to contraction bias. The errors, occurring at the level of individual trials, are sampled from the full distribution of the stimuli and are not due to a gradual shift of the memory toward the sensory distribution’s mean. Our results are consistent with a broad set of behavioral findings and provide predictions of performance across different stimulus distributions and timings, delay intervals, as well as neuronal dynamics in putative working memory areas. Finally, we validate our model by performing a set of human psychophysics experiments of an auditory parametric working memory task.
-
- Neuroscience
The brain regulates food intake in response to internal energy demands and food availability. However, can internal energy storage influence the type of memory that is formed? We show that the duration of starvation determines whether Drosophila melanogaster forms appetitive short-term or longer-lasting intermediate memories. The internal glycogen storage in the muscles and adipose tissue influences how intensely sucrose-associated information is stored. Insulin-like signaling in octopaminergic reward neurons integrates internal energy storage into memory formation. Octopamine, in turn, suppresses the formation of long-term memory. Octopamine is not required for short-term memory because octopamine-deficient mutants can form appetitive short-term memory for sucrose and to other nutrients depending on the internal energy status. The reduced positive reinforcing effect of sucrose at high internal glycogen levels, combined with the increased stability of food-related memories due to prolonged periods of starvation, could lead to increased food intake.


