Paxillin facilitates timely neurite initiation on soft-substrate environments by interacting with the endocytic machinery
- Academia Sinica, Taiwan
- University of California, Davis, United States
Figures
Figure 1 with 3 supplements
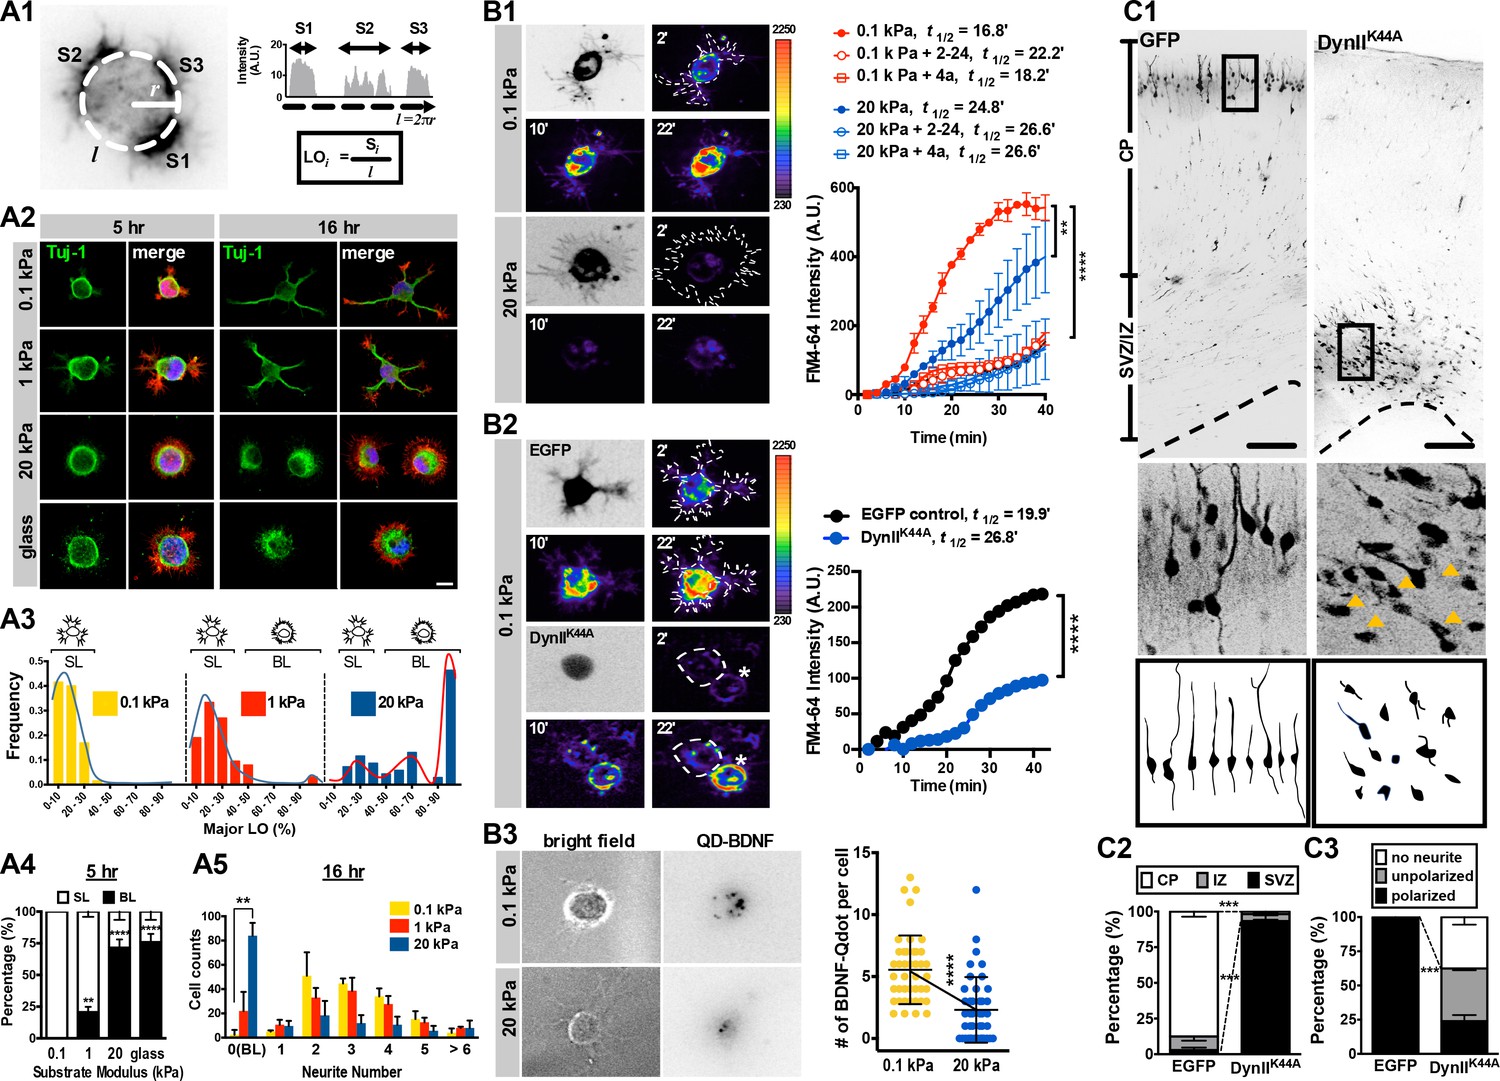
Morphology and endocytic activity of neurons grown on substrates of varying stiffness.
(A) Substrate modulus-dependent biphasic distribution of lamellipodium occupancy. (A1) Representative intensity profile of phalloidin-stained hippocampal neurons on a soft hydrogel (E = 0.1 kPa). Lamellipodium occupancy (LO) of each phalloidin-positive segment is calculated by the formula shown in the box at bottom right. (A2) Representative images of neurons grown on substrates for 5 hr or 16 hr and stained with phalloidin (Red), DAPI (Blue), and antibodies against Tuj-1 (Green), as indicated. Scale bar: 20 μm. (A3) Histograms of LO distributions at 5 hr showing two distinct patterns in 0.1, 1, or 20 kPa cultures (n > 68 cells for each experiment). Simplified drawings above histograms illustrate the typical segmented lamellipodium (‘SL’) and broad lamellipodium (‘BL’) phenotypes in 5 hr neuronal cultures, as indicated. (A4 and A5) Histograms summarizing the percentages of lamellipodium phenotypes seen in 5 hr cultures (A4) and the distributions of neurite numbers (A5) in 16 hr cultures. Data represent mean ±SEM (n > 3 independent experiments; 150 cells for each culture; *p<0.05; **p<0.01; ****p<0.0001; one way ANOVA with Dunnett’s post hoc test). (B) Enhanced membrane endocytosis in 0.1 kPa cultures. Time-lapse images (20 frames; 2 min intervals) of neurons isolated from E17.5 rat cortices transfected in utero at E16 without (B1) or with (B2) IRES constructs harboring control EGFP and/or a dominant-negative dynamin II mutant (DynIIK44A), cultured on 0.1 kPa or 20 kPa gels for 5 hr, followed by endocytosis assay in the presence or absence of the endocytosis inhibitors Dynole 2–24 or Dyngo 4a, as indicated. Dashed lines surround the region of interest (ROI) in quantitative FM4-64 measurements. Asterisks in B2 mark non-transduced neighboring cells. Graph at right summarizes the accumulation curves of FM4-64 signal (±SEM, n > 3 independent experiments, 10–20 cells per group, normalized to t = 0 value; ****p<0.0001; two-way RM ANOVA with Dunnett’s post hoc test), which reflects the rate of FM4-64 uptake at different time-points after FM4-64 loading. The data were fitted to a single exponential to determine the time (t1/2) required to reach half of the plateau value. (B3) Representative images of neurons plated on 0.1 kPa or 20 kPa gels overnight, followed by incubation of quantum dot-conjugated brain-derived neurotrophic factor (QD-BDNF) for 5 hr. Dot plot showing that 0.1 kPa cultures exhibited a significantly higher level (n = 39–46 cells from three independent experiments; **p<0.001; ****p<0.0001; one-way ANOVA with Dunnett’s post hoc test) of QD-BDNF internalization (as reflected by a ~2-fold greater quantity of intracellular QD-BDNF) than 20 kPa cultures. (C) Expression of DynIIK44A prevents neurite formation and cortical neuron migration in vivo. (C1) Fluorescence images of P0 rat cortices transfected in utero at E16 with IRES constructs harboring control EGFP and/or DynIIK44A. The middle panels show 16x magnifications of boxed regions of the corresponding P0 cortex in the top panels. The bottom panels show sample tracings of 2D projections from confocal images of typical cortical neurons in the corresponding P0 cortex. Bar, 100 μm. (C2 and C3) Histograms showing the localization (C2) and the percentage (C3) of transfected cortical neurons exhibiting unipolar/bipolar polarized processes (‘polarized’), multiple short neurites without a long tailing process (‘unpolarized’), or no process (‘no neurite’; arrowheads in the middle panels) in the cortical plate (‘CP’) or subventricular zone/intermediate zone (‘SVZ/IZ’) regions. Datasets (mean ±SEM, n > 150 cells per cortex, >5 cortices each; ***p<0.001, multiple t test) showing significant differences are marked.
Figure 1—figure supplement 1
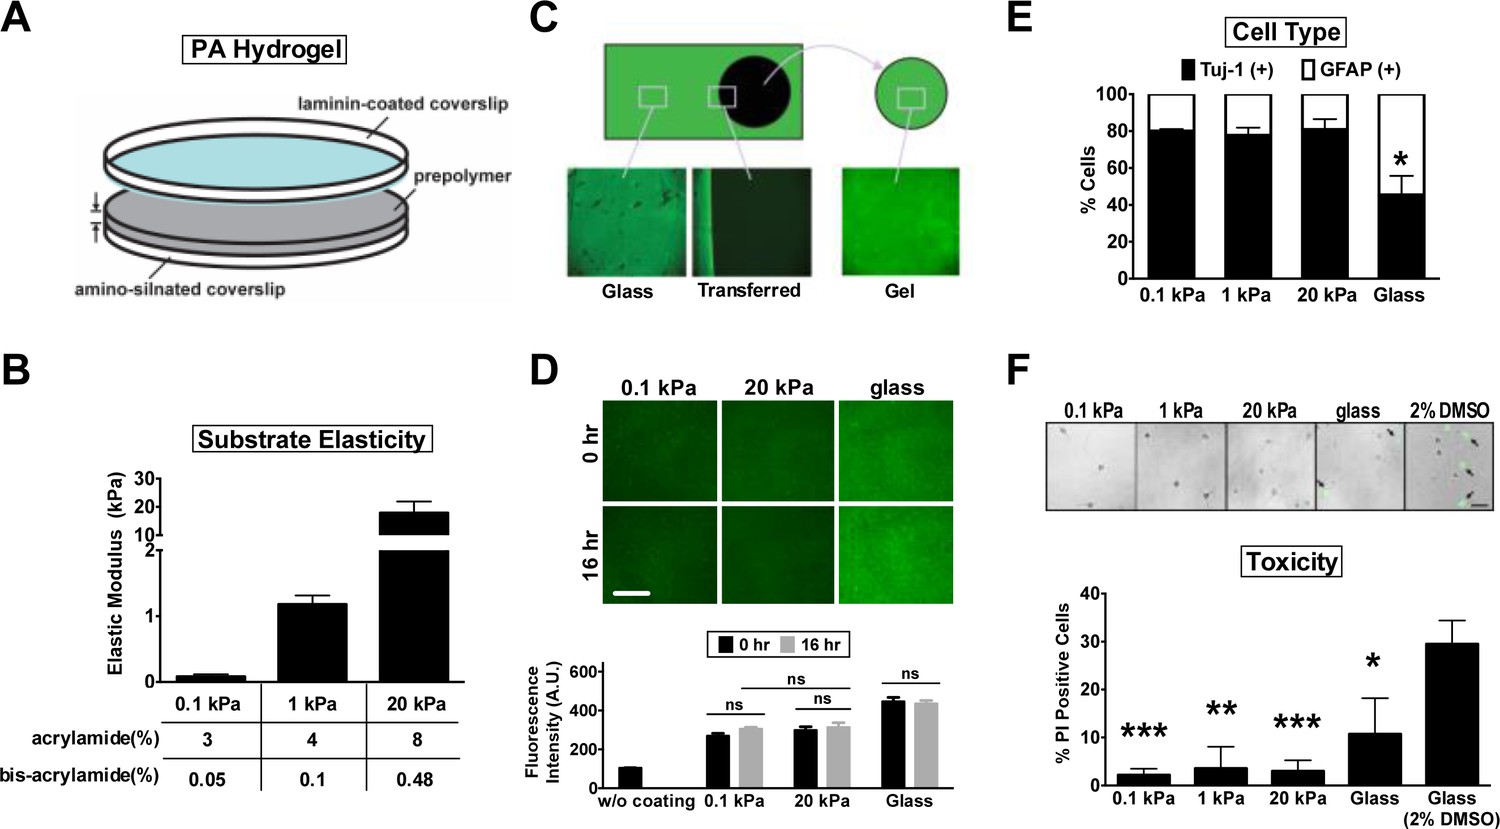
Hippocampal neurons cultured on polyacrylamide hydrogels of varying stiffness.
(A) Schematic of the three-layer assembly of polyacrylamide (PA) hydrogels (diameter = 1.8 mm, thickness = 200 μm). Light blue, the poly-L-Lysine/laminin-coated side of the coverslip. (B) Atomic force microscopy measurement of elastic modulus (±SEM, n = 3) of PA gels. Table shows the ratio of acrylamide and bis-acrylamide used to determine the crosslink density and the stiffness (0.1 kPa, 1 kPa, and 20 kPa) of the polymers. (C, D) Transfer printing of laminin on hydrogels. (C) Representative images of PA hydrogel peeled from laminin-coated coverslips, both immunostained with antibodies against laminin (shown in green). Note that laminin was completely transferred from the laminin-coated coverslip to the gel surface. (D) Quantification of laminin fluorescence intensity (±SEM, n > 3; ‘ns’, no significance; t-test) on the gel surface before and after incubation for 16 hr with culture medium. Acid-washed coverslips were pre-coated with laminin (a stock concentration of 1.62 mg/ml) in a 1:50 dilution. Note that the staining intensity of surface laminin was comparable between 0.1 kPa and 20 kPa gels. (E) Cell type enrichment analysis for hippocampal cultures. Cultured neurons plated on substrates were immunostained with antibodies against the neuron-specific marker Tuj-1 and the astroglial marker glial fibrillary acidic protein (GFAP). Histogram showing percentages (±SEM; n > 200 cells for each group from more than three independent experiments; *p<0.05; relative to that of 0.1 kPa culture, t-test) of Tuj-1- or GFAP-positive cells in hippocampal cultures at 3 days in vitro (DIV). (F) Cell viability analysis for hippocampal neurons cultured on PA gels and glass. DIV3 cultures were subjected to propidium iodide (PI) staining. Arrow, apoptotic cells with fragmented nuclei (PI positive). Dimethyl sulfoxide (2%) was used as a positive control of maximum cytotoxicity. Data represent mean ±SEM (n > 200 cells for each group from more than three independent experiments; *p<0.05; ***p<0.001; relative to that of glass culture, t-test).
Figure 1—figure supplement 2
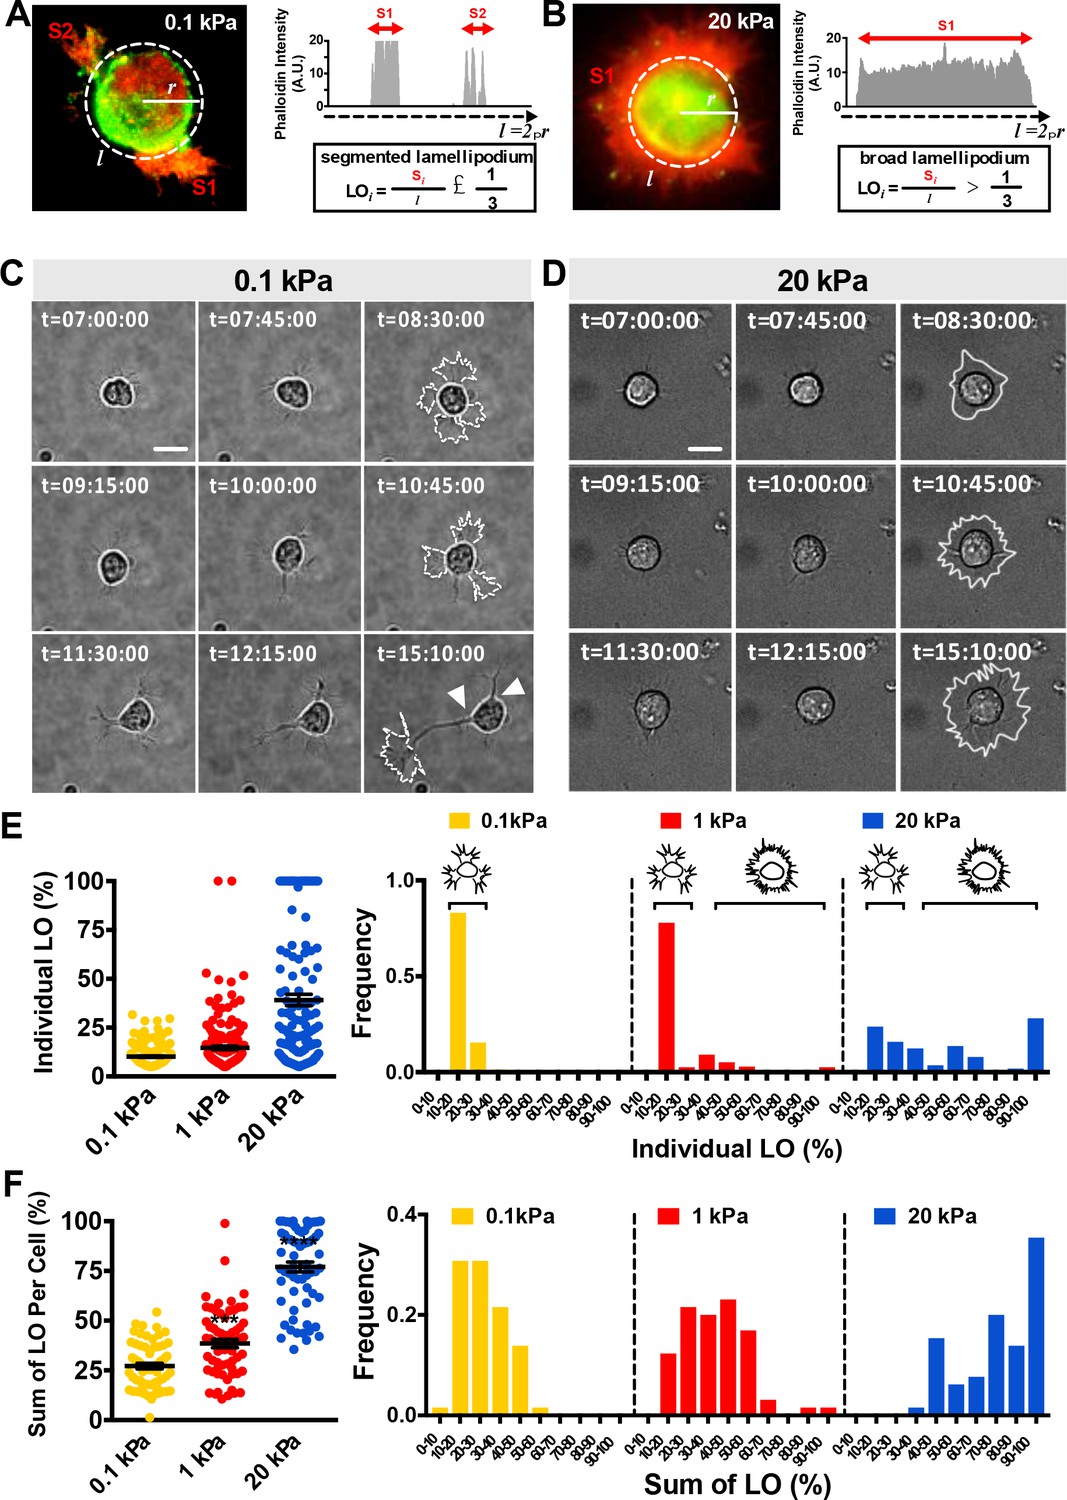
Differential lamellipodium phenotypes of neurons grown on hydrogels.
(A, B) Phalloidin intensity profiling of neurons on soft (E = 0.1 kPa; A) and stiff (E = 20 kPa; B) hydrogels stained with phalloidin (Red) for F-actin filaments and antibodies against Tuj-1 (Green), as indicated. Lamellipodium occupancy (LO) of phalloidin-positive segments (‘S’) along the cell periphery was calculated according to the formula shown in the lower panel. Cells exhibiting typical morphologies of the segmented lamellipodium (‘SL’, A) or broad lamellipodium (‘BL’, B) are shown. (C, D) Time-lapse bright-field images of newly plated neurons on 0.1 kPa (C) or 20 kPa (D) gels. Note that neurite initiation sites (arrowheads at time-point = 15:10:00) are correlated with the positions of initial segmented lamellipodia (delimited by the dashed line in panel C; individual LO < 0.33). Broad lamellipodia of a neuron grown on a 20 kPa gel are delimited by solid lines in panel D. Scale bar = 20 μm. (E, F) Distribution of individual lamellipodium occupancy (E) and total lamellipodium occupancy (F) from the same sets of experiments shown in main Figure 1A3. Simplified drawings above histograms illustrate the typical segmented lamellipodium and broad lamellipodium phenotypes of hippocampal neurons grown on soft (E = 0.1 kPa or 1 kPa) and stiff (E = 20 kPa) PA hydrogels.
Figure 1—figure supplement 3
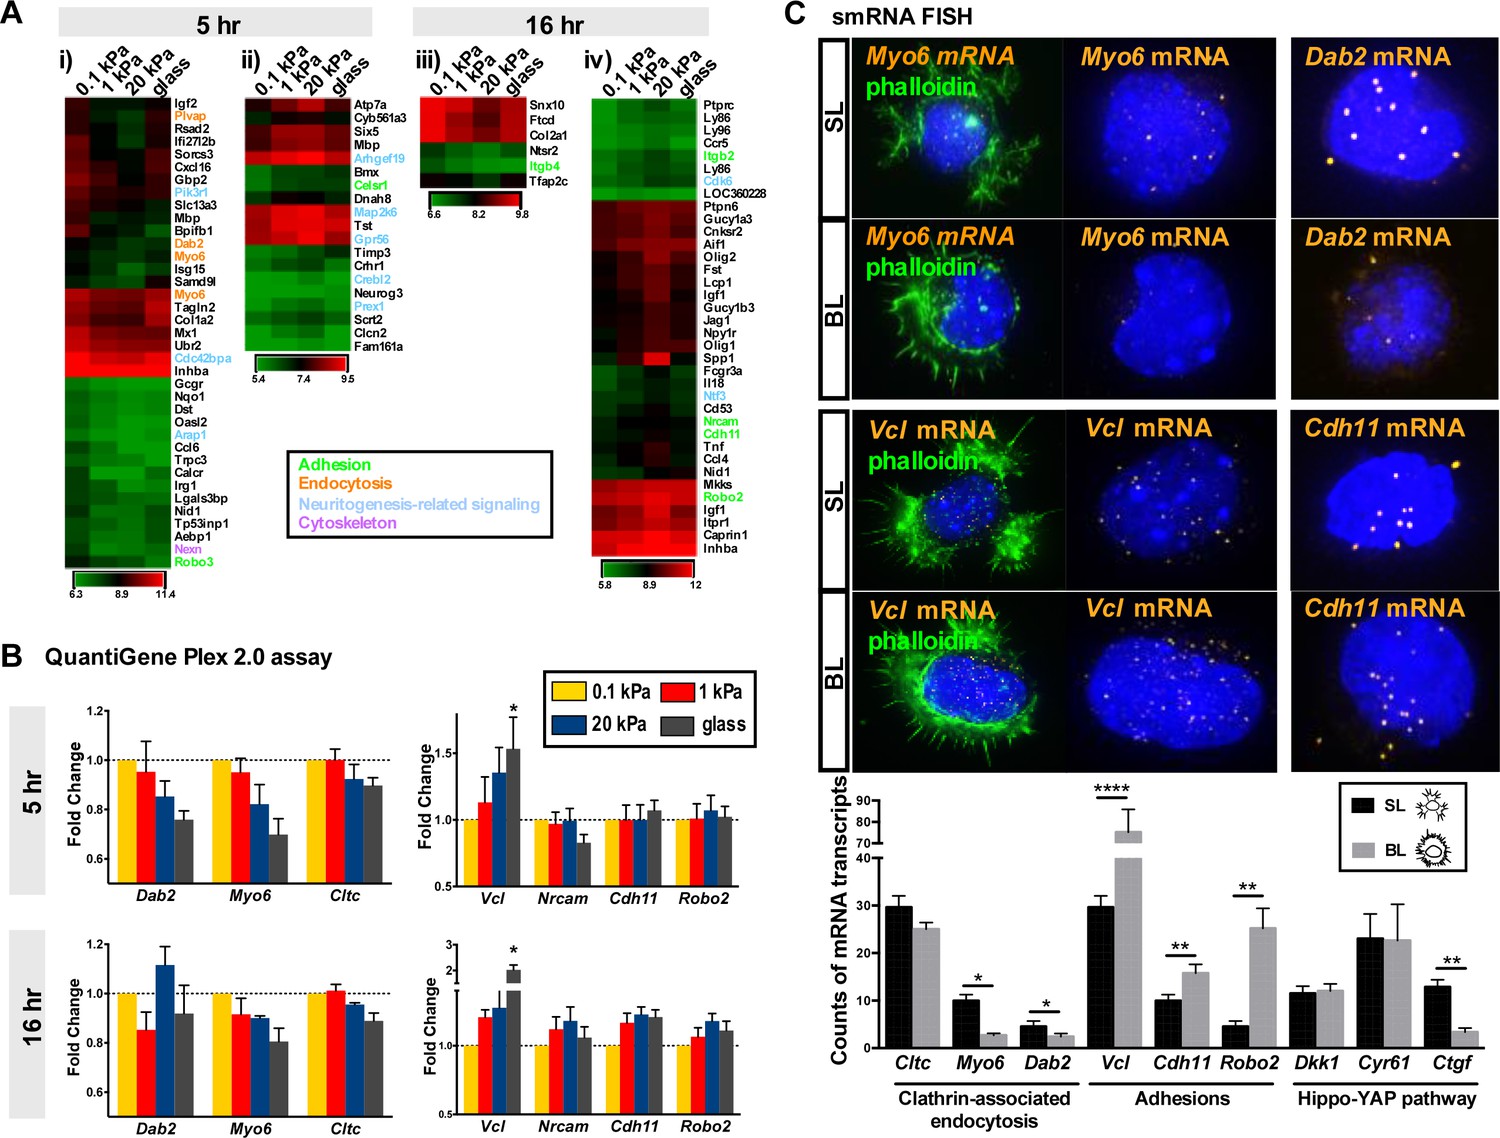
Differential gene expression pattern of neurons grown on hydrogels.
(A) Up-regulation of clathrin-associated endocytosis genes in 0.1 kPa cultures. Gene expression patterns emerging from microarray analysis were grouped into four modules: expression increased with substrate softness in 5 hr (i) or 16 hr (iii) cultures, or increased with substrate stiffness in 5 hr (ii) or 16 hr (iv) cultures (cut off: >1.5-fold change, p<0.05, n = 3 independent experiments). Normalized expression levels are represented by a color-coded heatmap. (B) A QuantiGene Plex branched-chain DNA amplification assay validated the relatively increased levels of mRNAs encoding the clathrin-associated endocytosis factors Dab2, Myo6, and Cltc in neurons grown on 0.1 kPa gels. Data represent fold changes in RNA levels (±SEM; n = 4–5 independent experiments; relative to that of 0.1 kPa culture; *p<0.05; t test). (C) Representative single-molecule RNA fluorescence in situ hybridization (smRNA FISH) images of mRNA encoding Myo6, Dab2, Chd11, Vcl, or Cry61 on segmented lamellipodium (SL) or broad lamellipodium (BL) neurons in 5 hr cultures, as indicated. Histograms showing average number (±SEM; n = 42–52 cells; *p<0.05; **p<0.01; ****p<0.0001; t test) of smRNA FISH puncta for each gene per single neurons of the SL and BL cells.
Figure 2 with 1 supplement

Substrate modulus-dependent Rac1 increase and lamellipodium segmentation require endocytic activity.
(A) Inhibition of endocytosis suppresses Rac1 activity in 0.1 kPa cultures. (A1–A3) Representative images of 5 hr neuronal cultures treated with the endocytosis inhibitors dynasore (50 μM, 1 hr), Dynole 2–24 (2–24, 2 μM, 1 hr), Dyngo 4a (4a, 2 μM, 1 hr) or monodansylcadaverine (MDC, 100 μM, 1 hr) and immunostained with antibodies against Rac1, GTP-bound Rac1 (‘active Rac1’; A1, left panel), or RhoA (A1, right panel). The same staining procedure was applied to the IUE neuron (A2, arrow) expressing control EGFP and/or DynIIK44A as shown in A2. Asterisks mark non-transduced neighboring cells. Intensities of active Rac1 and RhoA correspond to linear pseudocolor maps. (A3) Histograms, all from experiments similar to those described above, showing that endocytosis inhibition significantly decreases levels of total Rac1 and active Rac1 (but not RhoA) at lamellipodial protrusions (at 5 hr) in 0.1 kPa cultures. Data represent mean intensity ±SEM (n > 50 per group from three independent experiments; ***p<0.001; one-way ANOVA with Dunnett’s post hoc test). (B) Representative FRET-based imaging of hippocampal neurons transfected with a FRET indicator for GTP-bound Rac1 (Rac1-2G; see Materials and methods). (B1) Images of monomeric Teal fluorescent protein 1 (mTFP1) and FRET signals (presented as pseudocolor maps in a linear scale) acquired from neurons plated on 0.1 kPa gels in the presence or absence of dynasore (50 μM) or MDC (100 μM) for 1 hr. Bar, 20 μm. (B2) Traces depict active Rac1 levels at protrusions, measured across the dashed line as shown in B1, and indicated by FRET signal calculated as the ratio of Venus to mTFP1 fluorescence [F(Venus)/F(mTFP1)]. (B3) Quantitative measurement of FRET signals (±SEM, n = 5 cells for each group; *p<0.05, compared to time = 0 value; multiple t tests) before and after bath application of 50 μM dynasore or 100 μM MDC. Arrow marks drug addition (time = 0). (C) Inhibition of endocytosis decreases the probability of lamellipodium segmentation and delays neurite initiation on soft gels. (C1) Representative fluorescent images of neurons plated on 0.1 kPa gels for 5 hr in the absence or presence of indicated endocytosis inhibitors. Scale bar: 20 μm. (C2) Representative fluorescent images of transfected IUE neurons (arrow) expressing control EGFP and/or a dominant-negative dynamin II mutant (DynIIK44A), cultured on 0.1 kPa gels for 16 hr, and stained with phalloidin (Red), DAPI (Blue), and antibodies against Tuj-1 (Green). Asterisks mark non-transduced neighboring cells. Scale bar: 20 μm. Histograms summarize the percentages (±SEM; ***p<0.001, one way ANOVA with Dunnett’s post hoc test) of 16 hr neurons bearing neurites in the presence or absence of dynasore (50 μM, 5 hr treatment) or MDC (100 μM, 5 hr treatment), as indicated.
Figure 2—figure supplement 1
Increased Rac1 activity in neurons grown on 0.1 kPa gels.
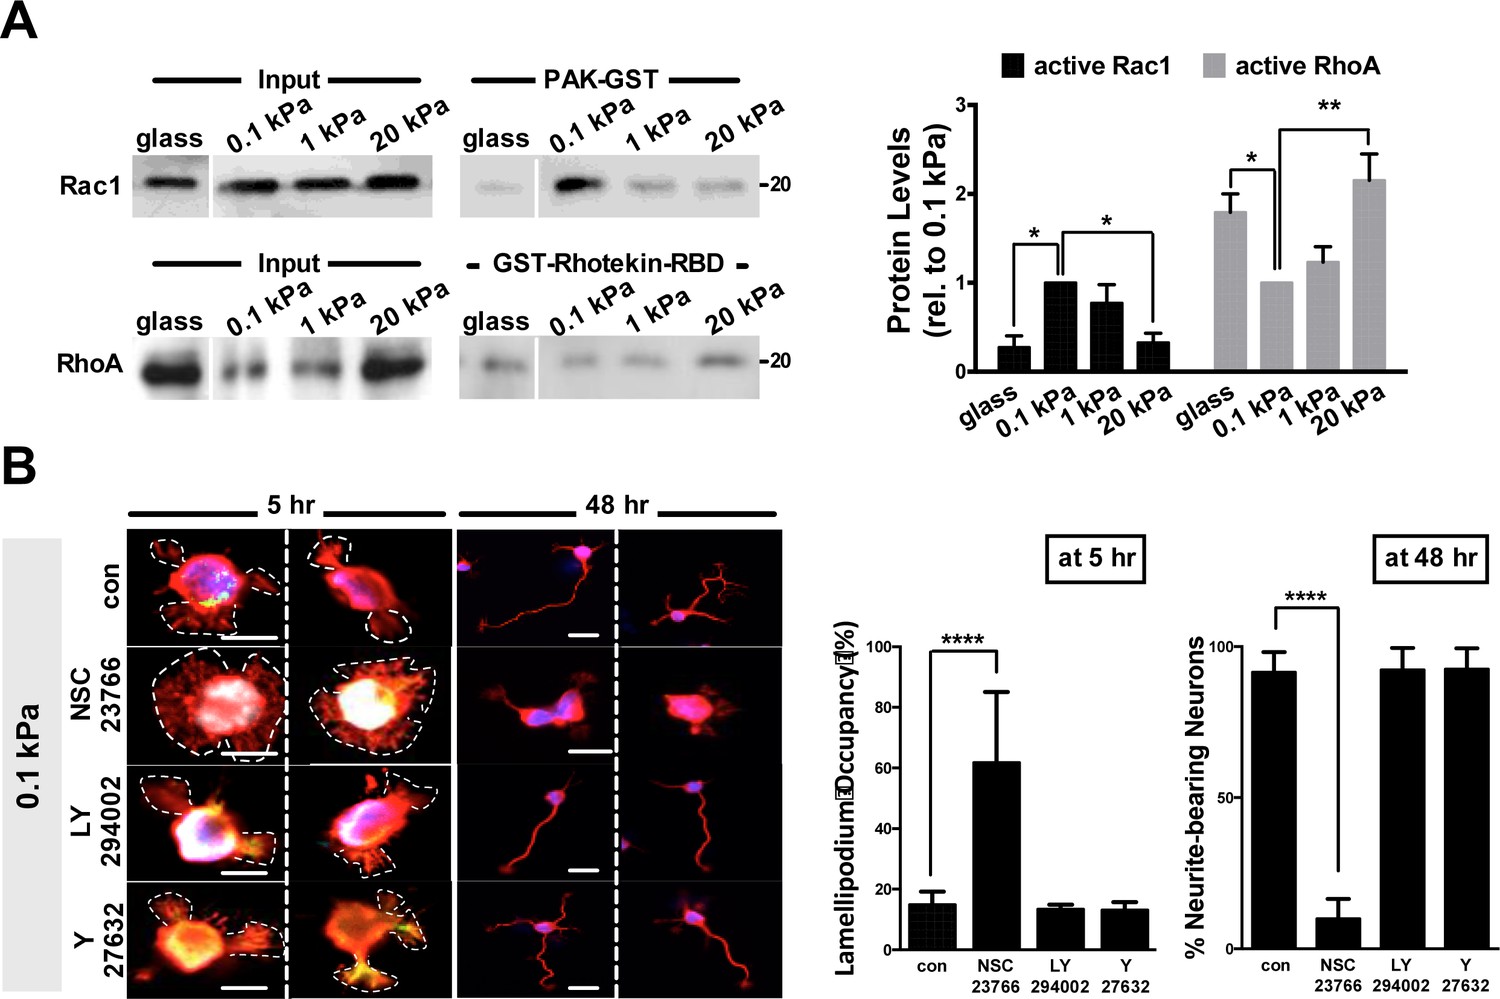
(A) Active Rac1 and active RhoA pull-down assay of neurons grown on 0.1 kPa or 20 kPa hydrogels. Cell lysates obtained from cortical neurons grown on substrates (5 hr of culture) were subjected to a GST resin pull-down assay using PAK-GST (upper panel) or GST-Rhotekin-RBD (lower panel), as indicated. The precipitants were analyzed by Western blotting with antibodies specific against Rac1 or RhoA. Histograms reflect quantitative measurement of band intensities (±SEM, n = 3; normalized to the corresponding protein input and relative to that of 0.1 kPa culture; *p<0.05; **p<0.001, t test) of the active GTP-bound forms of Rac1 or RhoA. (B) Pharmacological inhibition of Rac1 activation significantly increases the lamellipodium occupancy in 5 hr neuronal cultures on 0.1 kPa gels. Right panel shows representative images of neuronal cultures on 0.1 kPa gels, in the absence and presence of the selective Rac1-GEF inhibitor NSC-23766 (1 µM; 1 hr treatment), the PI3K inhibitor LY-294002 (10 µM; 1 hr treatment), or the ROCK inhibitor Y-27632 (25 µM; 1 hr treatment), stained with phalloidin (red) at the 5 hr or 48 hr time-points after cell plating, as indicated. Dashed line delimits lamellipodium area. Bar, 20 µm. Histograms summarize average lamellipodium occupancy in 5 hr neurons and percentages of neurite-bearing neurons in 16 hr cultures (±SEM; n = 300 total cells for each group from three independent experiments; ****p<0.0001, unpaired t test) from all experiments similar to that shown in the right panel.
Figure 3 with 3 supplements
Substrate modulus-dependent expression of paxillin and its association with endocytic and adhesion machineries.
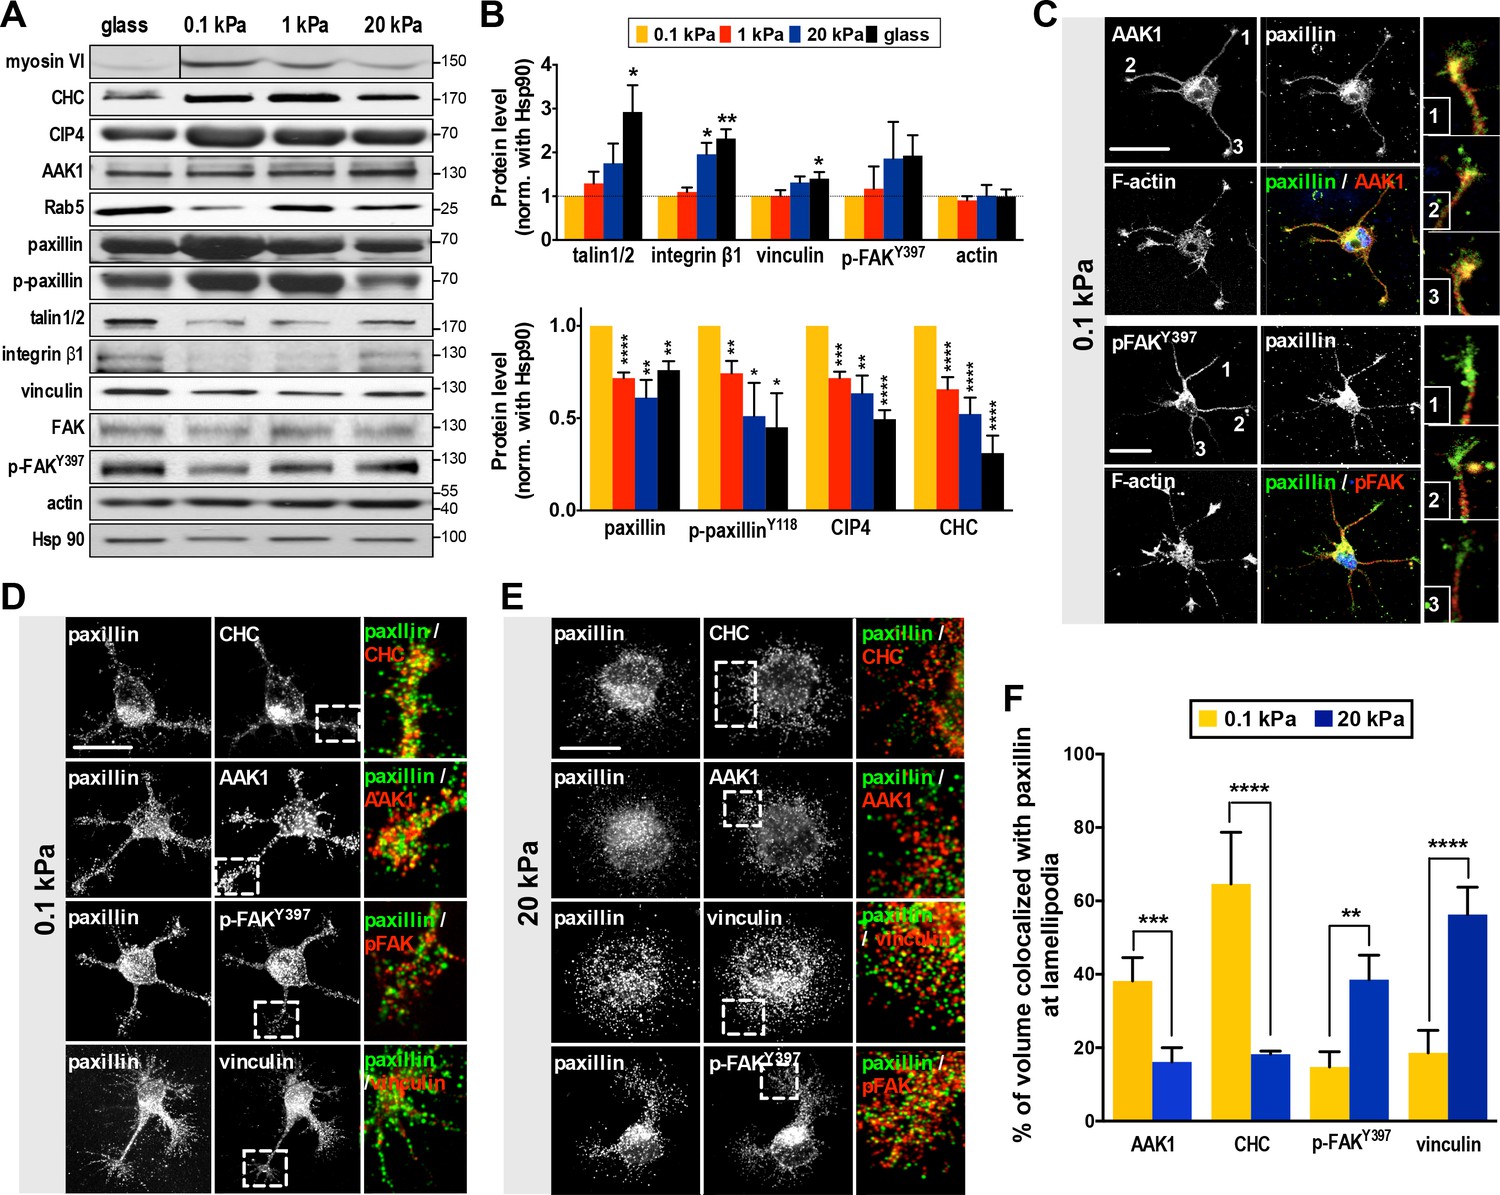
(A) Representative western blots of endocytic or adhesion molecules. Cell lysates obtained from cortical neurons grown on substrates with differing stiffness were subjected to immunoblotting with antibodies to indicated proteins. (B) Summary histograms, all from experiments similar to that described in A, showing greater (>2 fold) abundance of paxillin, phospho-paxillinY118 (p-paxillin), myosin VI (myo6), CIP4 and clathrin heavy chain (CHC) proteins in neurons grown on soft substrates (0.1 and 1 kPa) compared to those grown on stiff substrates (20 kPa and glass). Note the inverse expression of endocytic factors and adhesion molecules (i.e., talin1/2, integrinβ1, vinculin and p-FAKY397). Data represent mean ±SEM (n ≥ 3, normalized to control actin; compared to 0.1 kPa cultures; *p<0.05; **p<0.01; ***p<0.001; t-test). (C–F) Paxillin co-localizes with the endocytosis complex at neuronal growth cones on soft substrates. (C) Representative confocal images of 16 hr neurons on 0.1 kPa gels co-immunostained with antibodies against paxillin (Green in merge panel), adaptor-associated kinase1 (AAK1, Red in merge panel), p-FAKY397 (Red in merge panel), or F-actin, as indicated. Right panels show the region of interest ROI (marked by numbers) of neurite tips represented at higher magnification. Bar: 20 μm. (D and E) Similar to C, except the resolution of images has been enhanced (~1.7X higher) using Airyscan. Note that surface rendering was applied at neurite tips to more clearly show co-localization (yellow) of paxillin with indicated factors. Bar: 20 μm. (F) Histograms, all from experiments similar to those described in d and e, summarizing percentages of paxillin co-localized with indicated endocytic or adhesion factors on hydrogels. Data represent percentages (±SEM, n = 15 neurons for each set of experiments; ROI, 5 × 5 µm within one lamellipodium; **p<0.01; ***p<0.001; ****p<0.0001; t test).
Figure 3—figure supplement 1
Paxillin associates with free-floating vesicles in rat embryonic brain lysate.
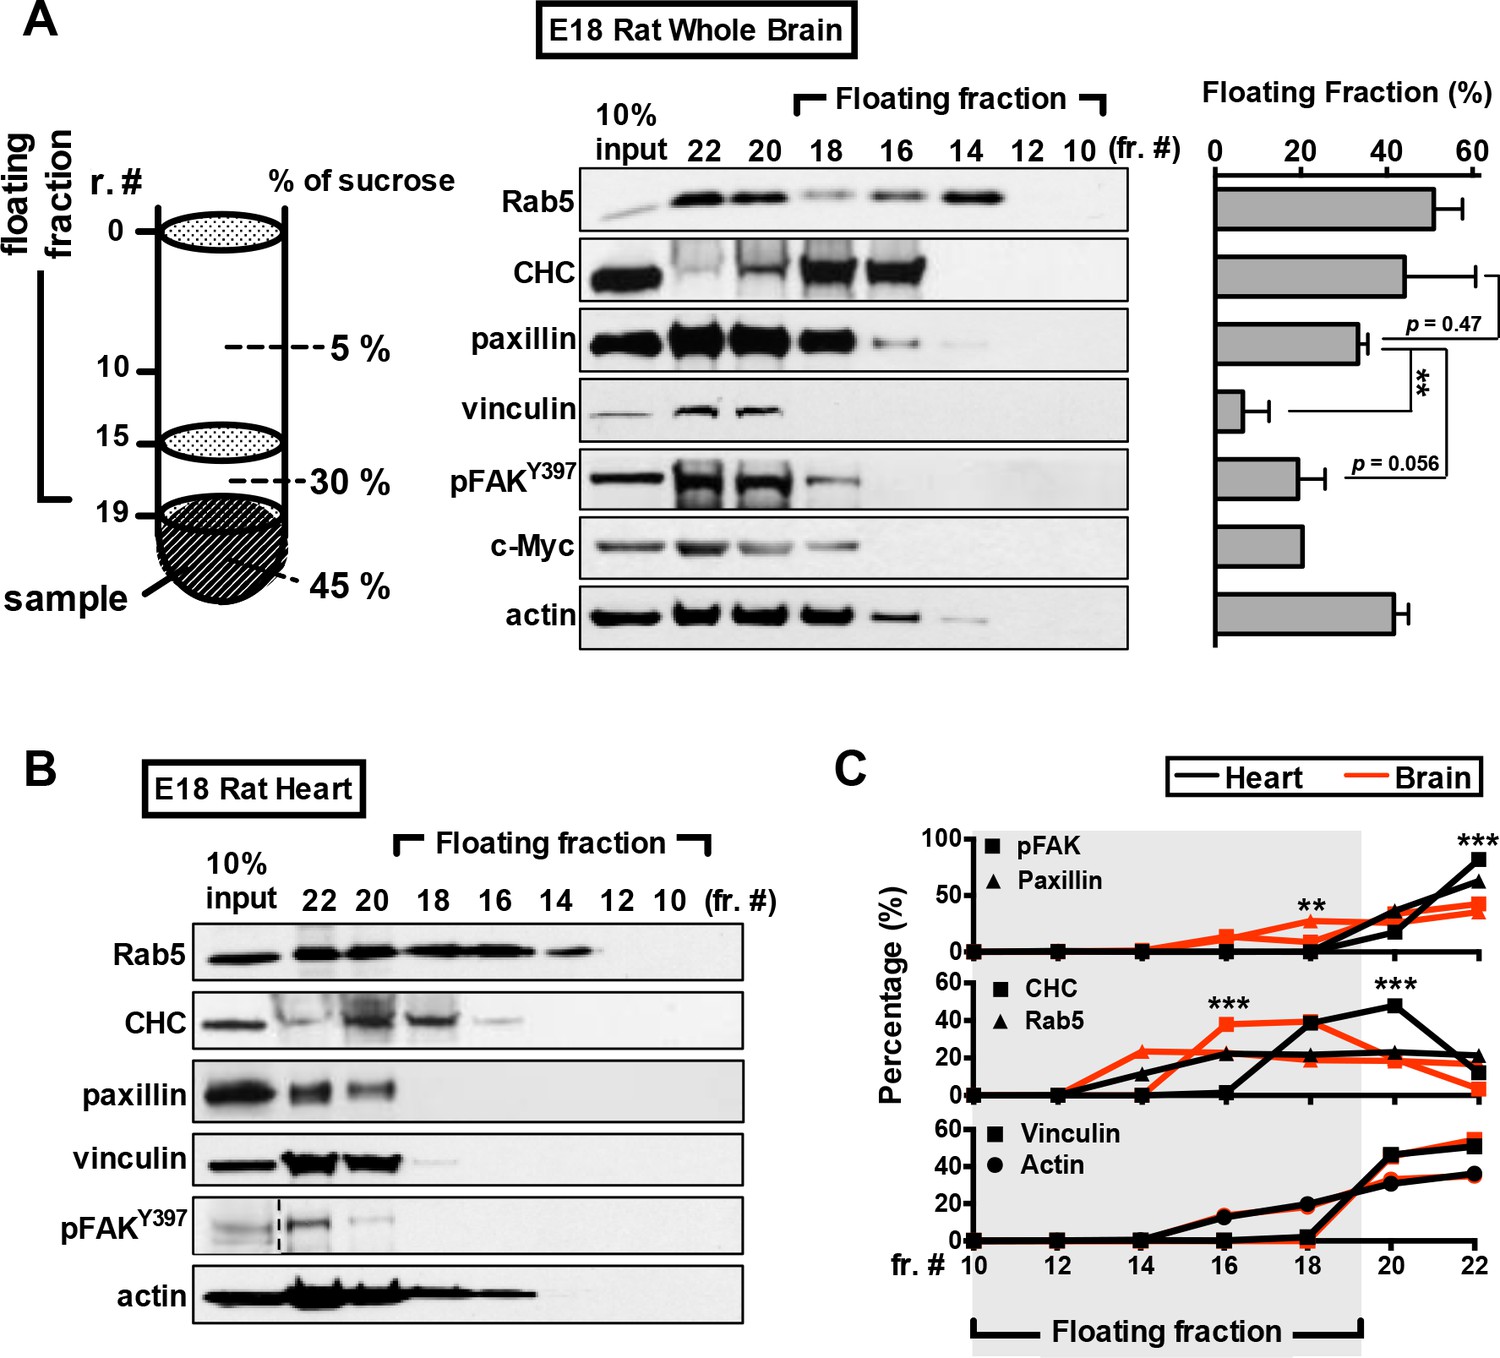
(A–C) Membrane flotation assay of embryonic brain (A) and heart (B) tissue lysates. Representative western blot of gradient fractionations probed with antibodies against endocytic factors (Rab5 and CHC), adhesion-associated molecules (vinculin, and phospho-FAKY397), paxillin, and actin, as indicated. Histogram in A reflects quantitative measurements of the protein levels (±SEM; n = 3 independent experiments; **p<0.01; compared to that of paxillin; multiple t test for each fraction) found in the floating fraction (collective measurement from fraction 10 to fraction 18) out of the total gradient fractions. (C) Traces depict the differential protein levels (±SEM; from all experiments similar to that described in A and B, ***p<0.001; multiple t test) in each gradient fraction between embryonic brain and heart lysates, as indicated.
Figure 3—figure supplement 2
Ectopically expressed paxillin displays predominantly retrograde motility.
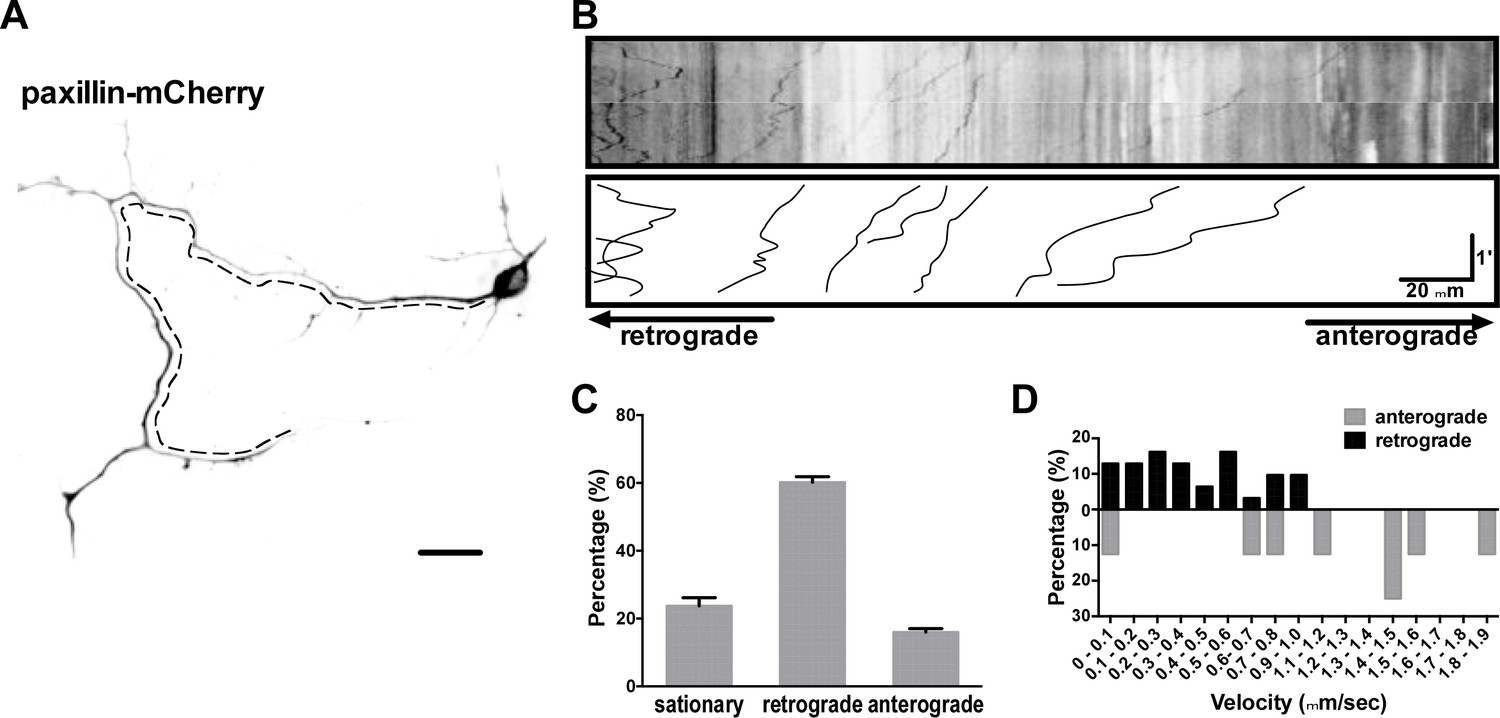
Representative image (A) and kymograph (B) of paxillin-mCherry trajectories (x-axis, distance; y-axis, time) generated from 180 s time-lapse images (90 frames; 0.5 frames per second), showing bidirectional movement of paxillin-mCherry along the axon (dashed line). Summary of directionality (C) and velocity distribution (D) of paxillin-mCherry along axons from all experiments similar to that described in B. Data represent means ±SEM (n = 15 cells).
Figure 3–video 1
Fast transport of paxillin-mCherry.
A 180 s video (0.5 frames per second) shows bidirectional, long-range movements of paxillin-mCherry in a DIV5 neuron grown on 0.1 kPa gel.
Figure 4 with 1 supplement
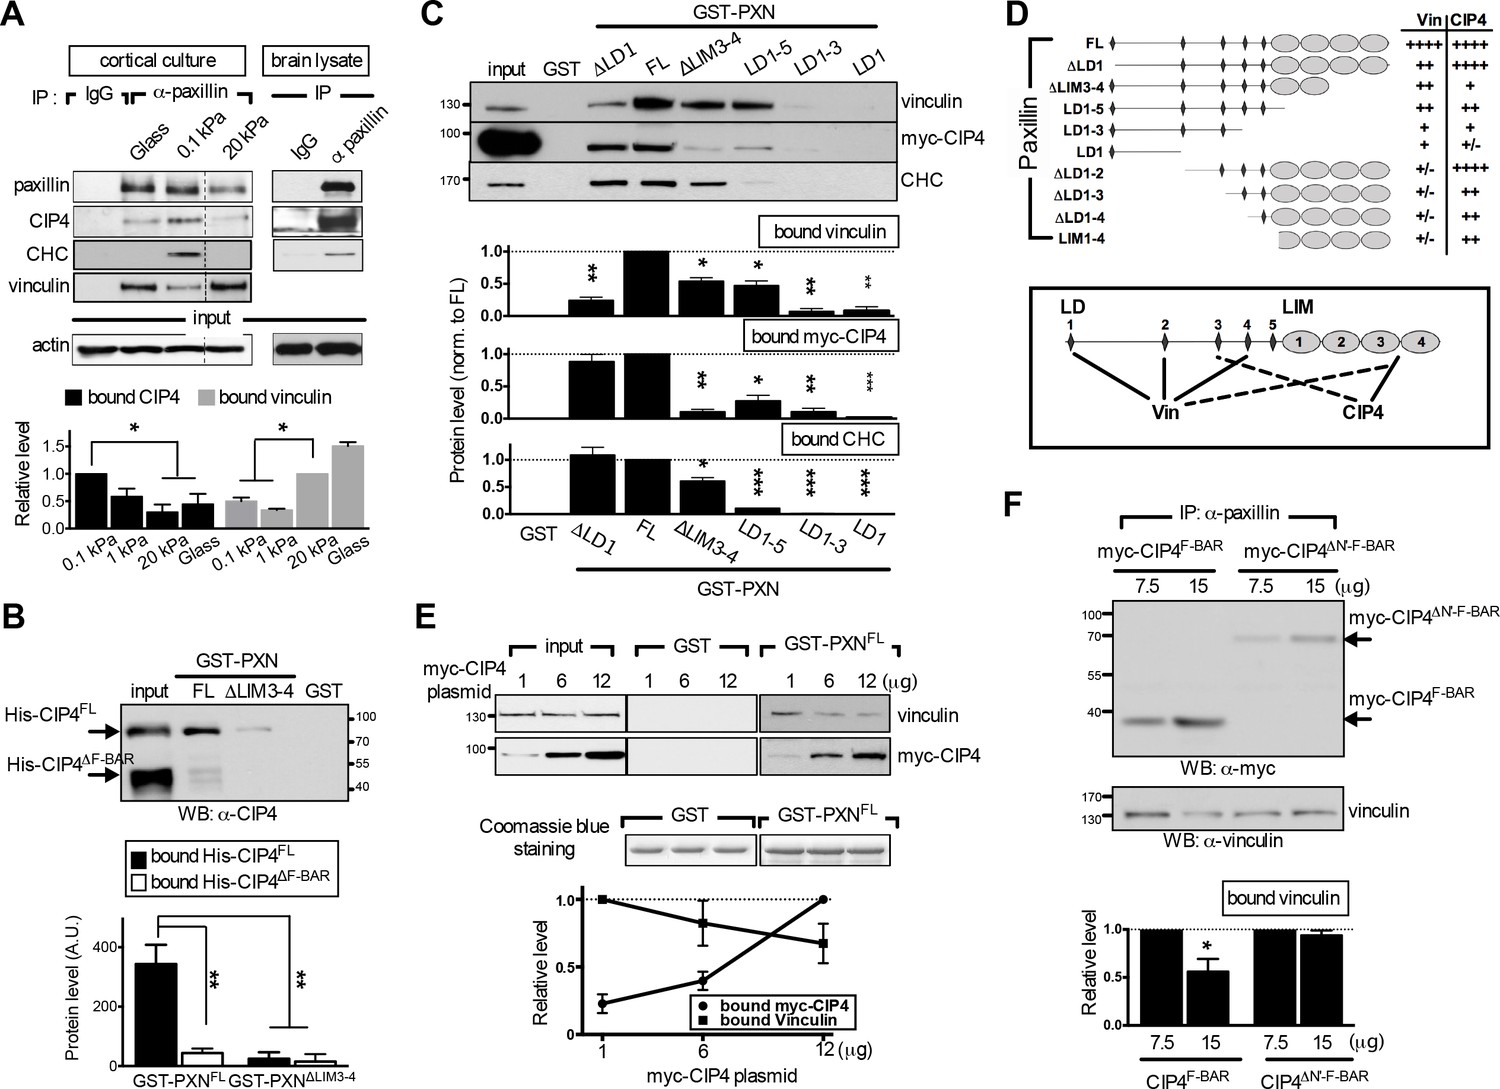
The endocytic F-BAR protein CIP4 directly associates with paxillin and competes with vinculin for paxillin binding.
(A) Paxillin preferentially binds endocytic factors in neurons grown on soft substrates. Paxillin-associated complexes were immunoprecipitated (IP) in lysates made from E17.5 rat brain or from cortical neuronal cultures grown on different substrates using a specific paxillin antibody and were then detected by western blot analysis. Normal rabbit IgG (‘IgG’) served as a negative control. Histograms show the opposing binding preference of paxillin toward CIP4/CHC or vinculin when grown on soft (0.1 kPa or 1 kPa) versus rigid (20 kPa or glass) substrates. Data represent mean intensity ±SEM (n = 3 independent experiments; *p<0.05; t-test). (B) Western blot showing direct interaction of paxillin with CIP4. Bacterially expressed His-CIP4 was purified by fast protein liquid chromatography and subjected to a GST pull-down assay using GST-PXNFL, GST-PXN∆LIM3-4 or GST alone. Precipitants were analyzed by western blotting with antibodies specific to CIP4. Histograms summarize protein levels as determined by immunoblotting of full-length (His-CIP4) or F-BAR domain-deleted (His-ΔF-BAR) CIP4 pulled-down by GST-paxillin variants (±SEM, n = 3; normalized to the corresponding GST-PXNFL or GST-PXN∆LIM3-4 inputs; **p<0.01, t test). (C and D). Mapping of paxillin domains interacting with CIP4 or vinculin. (C) GST pull-down and immunoblotting of vinculin, myc-CIP4, and CHC in lysates of myc-CIP4-expressing HEK293T cells. Histograms reflect quantification of levels of proteins pulled-down by GST fusions of full-length (“FL“) or LIM domain- and/or LD motif-deleted forms of paxillin, all from experiments similar to those shown in top panels (±SEM, n ≥ 3 independent experiments; *p<0.05; **p<0.01; ***p<0.001; t test). (D) Schematic of GST fusion proteins used in c. Table summarizing relative CIP4 or vinculin (‘Vin’) binding by paxillin deletion mutants or full-length protein. Solid lines mark primary sites of interaction, and dashed lines mark accessory interaction motifs for strong binding to vinculin or CIP4. Binding strength relative to full-length paxillin indicated as: ‘++++' >75% > ‘+++' >50% > ‘++' >25% > '+' >5% > '+/-'. (E) In vitro protein interaction and competitive binding assays in HEK293T cells transfected with various amounts (1, 6, and 12 µg) of plasmids encoding myc-tagged CIP4 protein (myc-CIP4) and/or control vectors, as indicated. Cell lysates were subjected to a GST pull-down assay with GST-PXNFL or GST alone, and immunoblotted with vinculin and myc antibodies. Line chart depicts averaged protein levels as determined by immunoblotting of CIP4 or vinculin pulled-down by GST-PXNFL (±SEM, n = 4; normalized to band intensity of corresponding GST-paxillin variant). (F) In vivo protein interaction and competitive binding assays in HEK293T cells transfected with various amounts (7.5 μg and 15 μg) of plasmids encoding the F-BAR domain (‘F-BAR’) alone or F-BAR-domain-deleted (‘ΔN’-F-BAR’) CIP4 and/or control vectors, as indicated. Cell lysates were immunoprecipitated by paxillin antibodies and blotted with myc or vinculin antibodies. Histograms show relative protein levels as determined by immunoblotting of vinculin co-immunoprecipitated by paxillin antibodies (±SEM, n = 3; *p<0.05, t test).
Figure 4—figure supplement 1
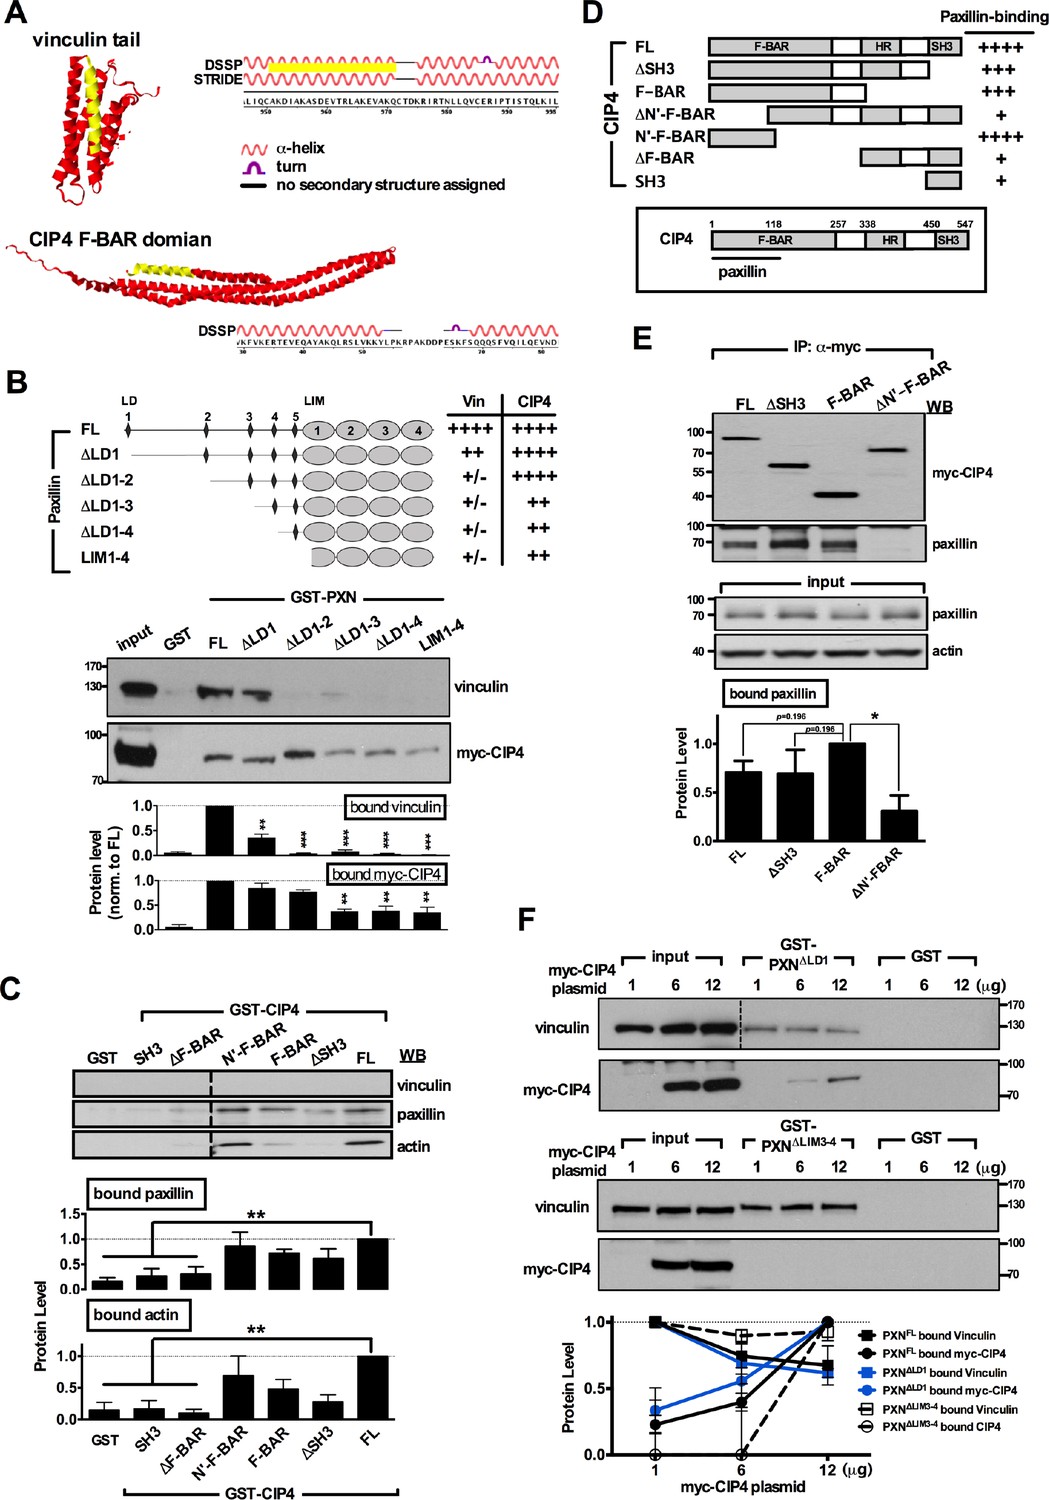
Paxillin associates with the F-BAR domain of CIP4.
(A) Structures of the vinculin tail (PDB ID: 1QKR; top panel) and the CIP4 F-BAR domain (PDB ID: 2EFK; bottom panel) constructed by JMOL, version 14.4.4. Yellow marks indicate the predicted paxillin-binding subdomain (PBS) for vinculin (951K to 970Q) or CIP4 (35R to 55P). Secondary structures were predicted by the DSSP or STRIDE databases. (B) Mapping of paxillin domains interacting with CIP4 or vinculin. GST pull-down and immunoblotting of vinculin and myc-CIP4 in lysates of myc-CIP4-expressing HEK293T cells. Histograms reflect quantification of levels of proteins pulled-down by GST fusions of full-length ('FL') or LD motif-deleted forms of paxillin, all from experiments similar to those shown in top panels (±SEM, n ≥ 3 independent experiments; **p<0.01; ***p<0.001; multiple t test). Schematic of GST fusion proteins and table summarizing relative CIP4 or vinculin (‘Vin’) binding by paxillin deletion mutants or full-length protein shown in the top panel. Binding strength relative to full-length paxillin indicated as: ‘++++' >75% > ‘+++' >50% > ‘++' >25% > '+' >5% > '+/-'. Note that although CIP4 primarily associates with LIM domains, deletion of the paxillin LD1-3 domain reduced its affinity for CIP4. (C) Mapping of CIP4 domains interacting with paxillin. GST fusion proteins of full-length CIP4 (‘FL’) or its variants with F-BAR domain, HR1 and/or SH3 domain truncations were subjected to GST pull-down assays in HEK293T cell lysates, followed by immunoblotting for paxillin and actin. Histogram reflects quantitative measurement of relative protein levels (±SEM, n ≥ 3 independent experiments; compared to that of FL experiment; **p<0.01; t-test) pulled down by GST-CIP4, as indicated. (D) Schematic of GST fusion proteins used in B. Table summarizes relative paxillin binding by CIP4 deletion mutants or full-length protein. Binding strength relative to that of full-length CIP4 is represented as: ‘++++' >75% > ‘+++' >50% > ‘++' >25% > '+'. (E) In vivo protein interactions in HEK293T cells co-transfected with plasmids encoding paxillin-GFP and myc-tagged CIP4 deletion mutants or full-length protein, as indicated. Cell lysates were immunoprecipitated by myc antibody and blotted with paxillin or myc antibodies. Histograms show relative protein levels as determined by immunoblotting for paxillin co-immunoprecipitated by myc antibody. Data represents mean (±SEM from more than three independent experiments; compared to that of F-BAR experiment; *p<0.05; t-test). (F) In vitro protein interaction and competitive binding assays in HEK293T cells transfected with various amounts (1, 6, and 12 µg) of plasmids encoding myc-tagged CIP4 protein (myc-CIP4) and/or control vectors, as indicated. Cell lysates were subjected to a GST pull-down assay with GST-PXNFL, GST-PXN∆LD1, GST-PXN∆LIM3-4 or GST alone, and immunoblotted with vinculin and myc antibodies. Line chart depicts averaged protein levels as determined by immunoblotting of CIP4 or vinculin pulled-down by GST-PXN variant (±SEM, n = 3–4; normalized to band intensity of corresponding GST-paxillin variant).
Figure 5 with 2 supplements
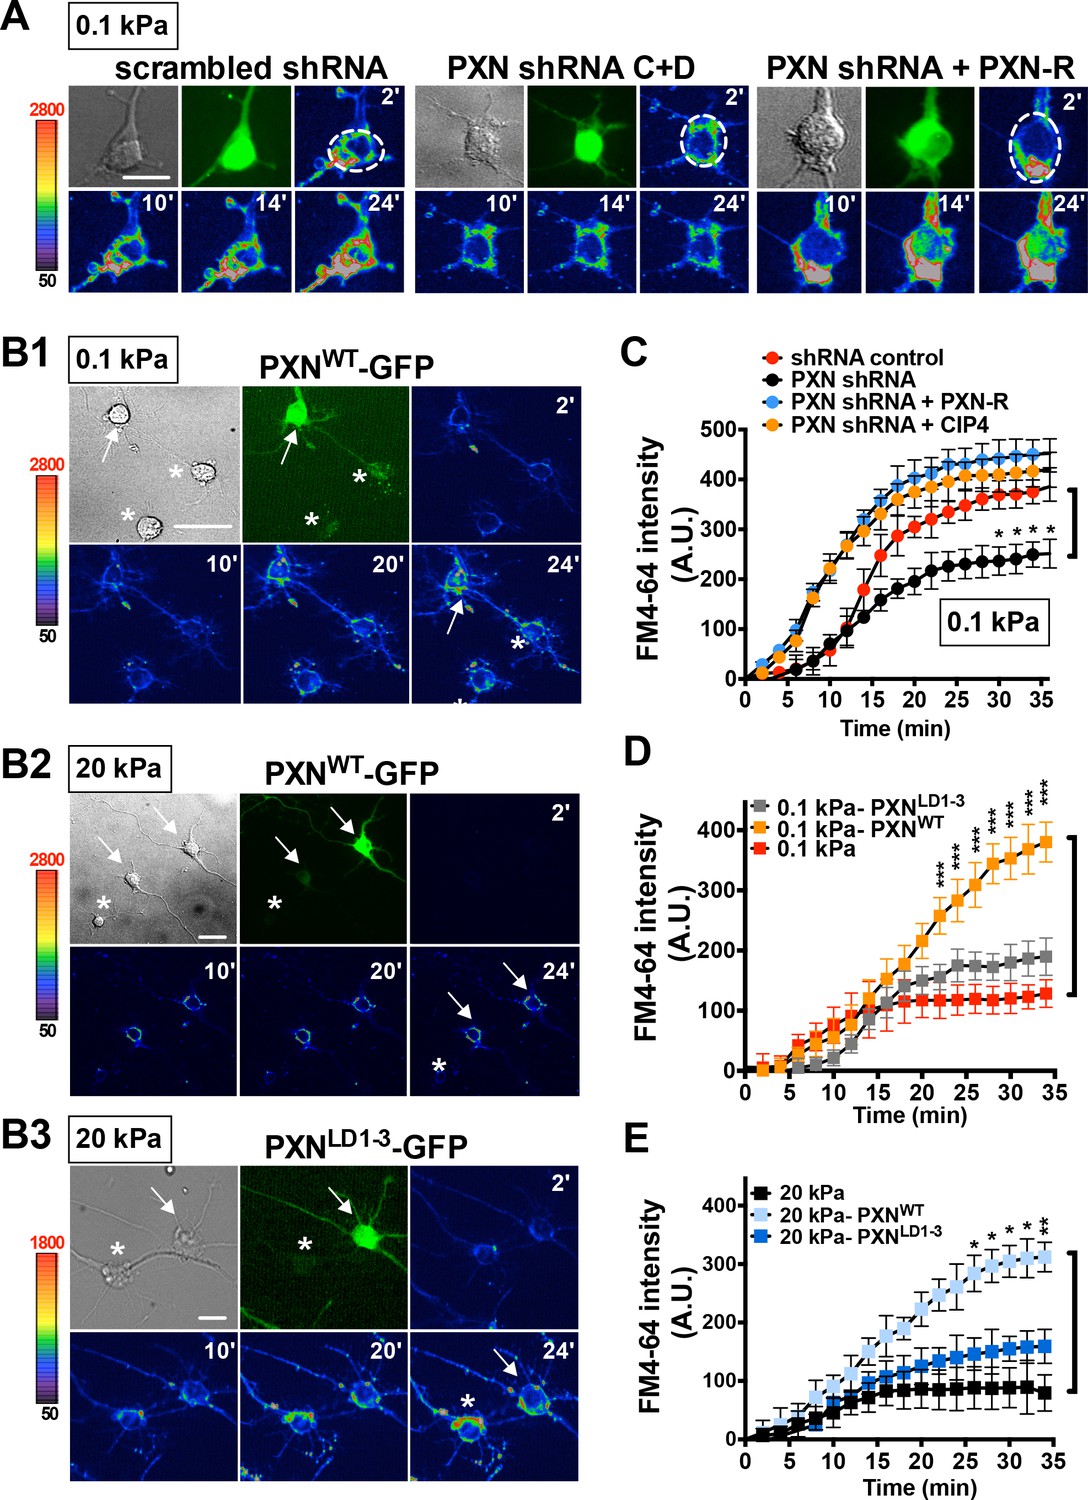
Paxillin is required for endocytosis promoted by a soft surface.
(A) Paxillin knockdown suppresses the endocytic activity of neurons grown on 0.1 kPa gels. Representative time-lapse images of FM4-64 uptake in 3-DIV neurons on substrates of varying elasticity. Hippocampal neurons on 0.1 kPa gels were transduced with lentiviral particles harboring an shRNA-resistant construct (‘PXN-R’) and/or constructs harboring scrambled control or paxillin (‘PXN shRNA C + D’) shRNA at 5 hr after cell plating. Dashed circles surround the region of interest (ROI) in quantitative FM4-64 measurements. Bar: 20 μm. (B) Similar to A, except constructs encoding GFP fusions of wild-type paxillin (‘PXNWT-GFP’; B1 and B2) or the corresponding LIM domain deletion mutant (‘PXNLD1-3-GFP’; B3) were used for lentiviral transduction. Asterisk: non-transduced neighboring cells. Arrows: neurons expressing GFP-tagged paxillin proteins. Bar: 20 μm. (C–E) Quantitative measurements of cumulative FM4-64 intensity (±SEM, n > 3 independent experiments, 7–12 cells for each set of experiments; *p<0.05; **p<0.001; ***p<0.0001; compared to control groups; multiple t tests), all from experiments similar to those described in A and B. Note that ectopic expression of wild-type paxillin, but not PXNLD1-3, restored rapid endocytic FM4-64 uptake on 20 kPa stiff gels.
Figure 5—figure supplement 1
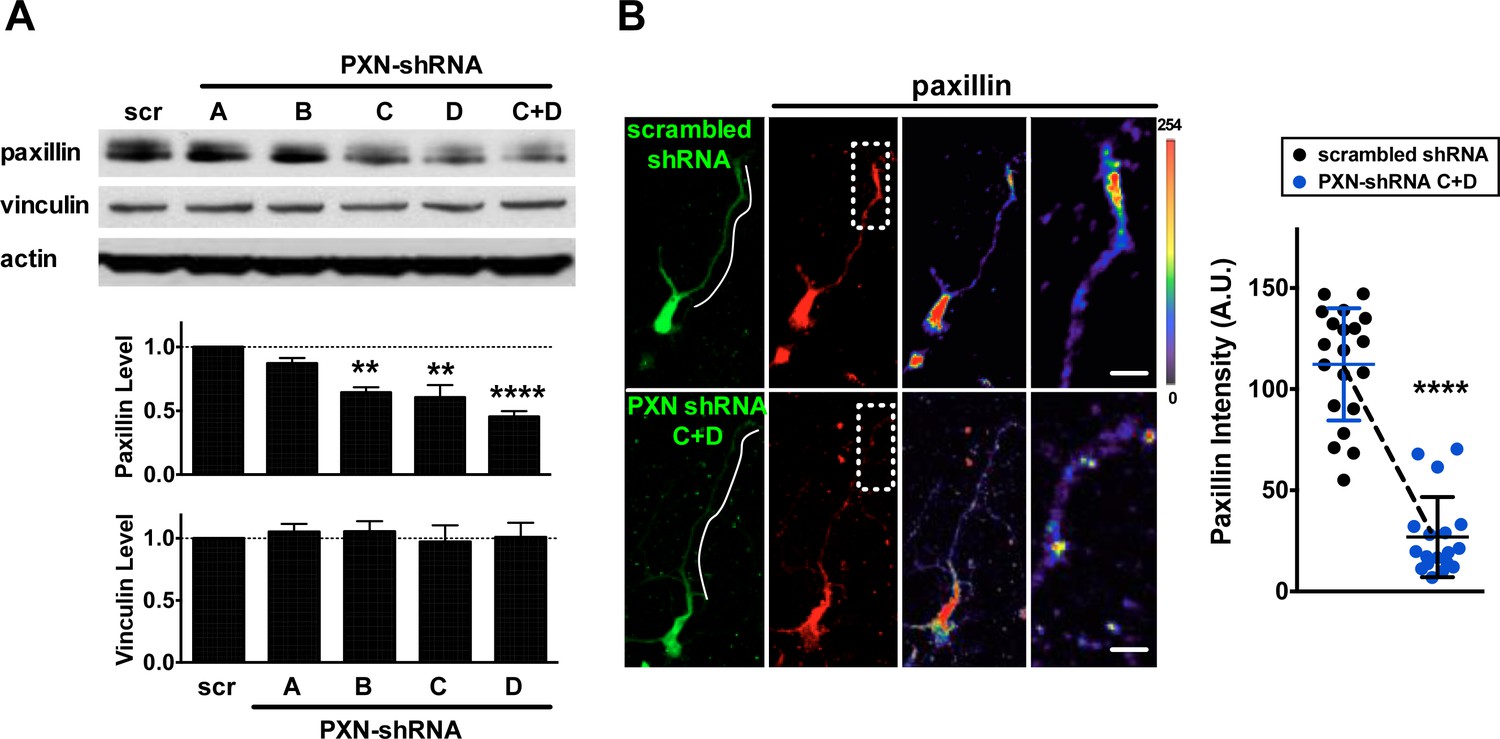
Knockdown efficiency of PXN shRNAs.
(A) Western blot showing efficiency of shRNA-mediated paxillin knockdown. Mouse neuroblastoma Neuro-2a (N2a) cells were transfected with plasmids encoding scrambled shRNA (‘scr’) or one of four paxillin shRNAs (sequence A, B, C, or D) targeting to different regions of the paxillin sequence. Summary histograms showing that shRNA D exerted a ~2-fold suppression on paxillin expression and it had no effect on vinculin expression. Data represent mean ±SEM (n = 5, normalized to control actin, compared to that of scr experiment; *p<0.05; t-test **p<0.01, ****p<0.0001; t test). (B) Images of neurons transfected with plasmids encoding scrambled shRNA or paxillin shRNAs (shRNA C + shRNA D), immunostained with antibody specific against paxillin. Right-most panels show the region of interest (ROI, dashed box) of neurite tips at a higher magnification, with the intensity of paxillin staining coded by pseudocolors in a linear scale. Bar: 5 μm. Dot plot reflects quantification of paxillin immunostaining intensity (±SEM, n = 20 cells each, normalized to EGFP intensity and relative to scramble control; ****p<0.0001; one-way ANOVA with Dunnett’s post hoc test).
Figure 5—figure supplement 2

Endocytic function and distribution patterns of CIP4 protein in 0.1 kPa neuronal cultures.
(A) CIP4 knockdown suppresses endocytic activity of neurons grown on 0.1 kPa gels. (A1) Western blot showing efficiency of shRNA-mediated CIP4 knockdown. HEK293T cells were transfected with plasmids encoding scrambled shRNA (‘scr’) or one of four CIP4 shRNAs (sequence A, B, C, or D) targeting to different regions of the CIP4 sequence. (A2) Representative time-lapse images of FM4-64 uptake in 5 hr neurons grown on 0.1 kPa gels. Time-lapse images (20 frames; 2 min intervals) of neurons isolated from E17.5 rat cortices which were transfected in utero at E16 with constructs encoding scrambled control or CIP4 (‘CIP4 shRNA A-D’) shRNA, and/or CIP4-GFP, cultured on 0.1 kPa for 5 hr, followed by endocytosis assay. Dashed circles surround the region of interest (ROI) for quantitative FM4-64 measurements. Asterisk marks non-transduced neighboring cells. Graph at right summarizes the accumulation curves of FM4-64 signal (±SEM, n > 3 independent experiments, 5–10 cells per group, normalized to t = 0 value; compared to that of scrambled control experiment *p<0.05; multiple t tests for each time point). (B) Images of neurons transfected with plasmids encoding CIP4-GFP, stained with phalloidin and DAPI. Right-most panels show the region of interest (ROI, dashed box) of neurite tips at a higher magnification. Note that CIP4-GFP was distributed along the enlarged lamella edge when neurons were cultured on 20 kPa gels. (C) Fluorescence images (C1) of P0 rat cortices transfected in utero at E16 with IRES constructs harboring GFP control or CIP4-GFP. The bottom panels show 4x magnifications of boxed regions corresponding to the P0 cortex in the top panels. Bar, 100 μm. (C2) Histograms showing the percentages (±SEM, n > 3 cortices each; ‘n.s.”, not significant, multiple t test) of neurons residing in the cortical plate (‘CP’), intermediate zone (‘IZ’), or subventricular zone (‘SVZ’) regions. (C3) Histograms showing the percentage (±SEM, n > 150 cells per cortex, >3 cortices each; ‘n.s.', not significant, multiple t test) of transfected cortical neurons exhibiting unipolar/bipolar polarized processes (‘polarized’), multiple short neurites without a long tailing process (‘unpolarized’), or no process (‘no neurite’) in cortices.
Figure 6
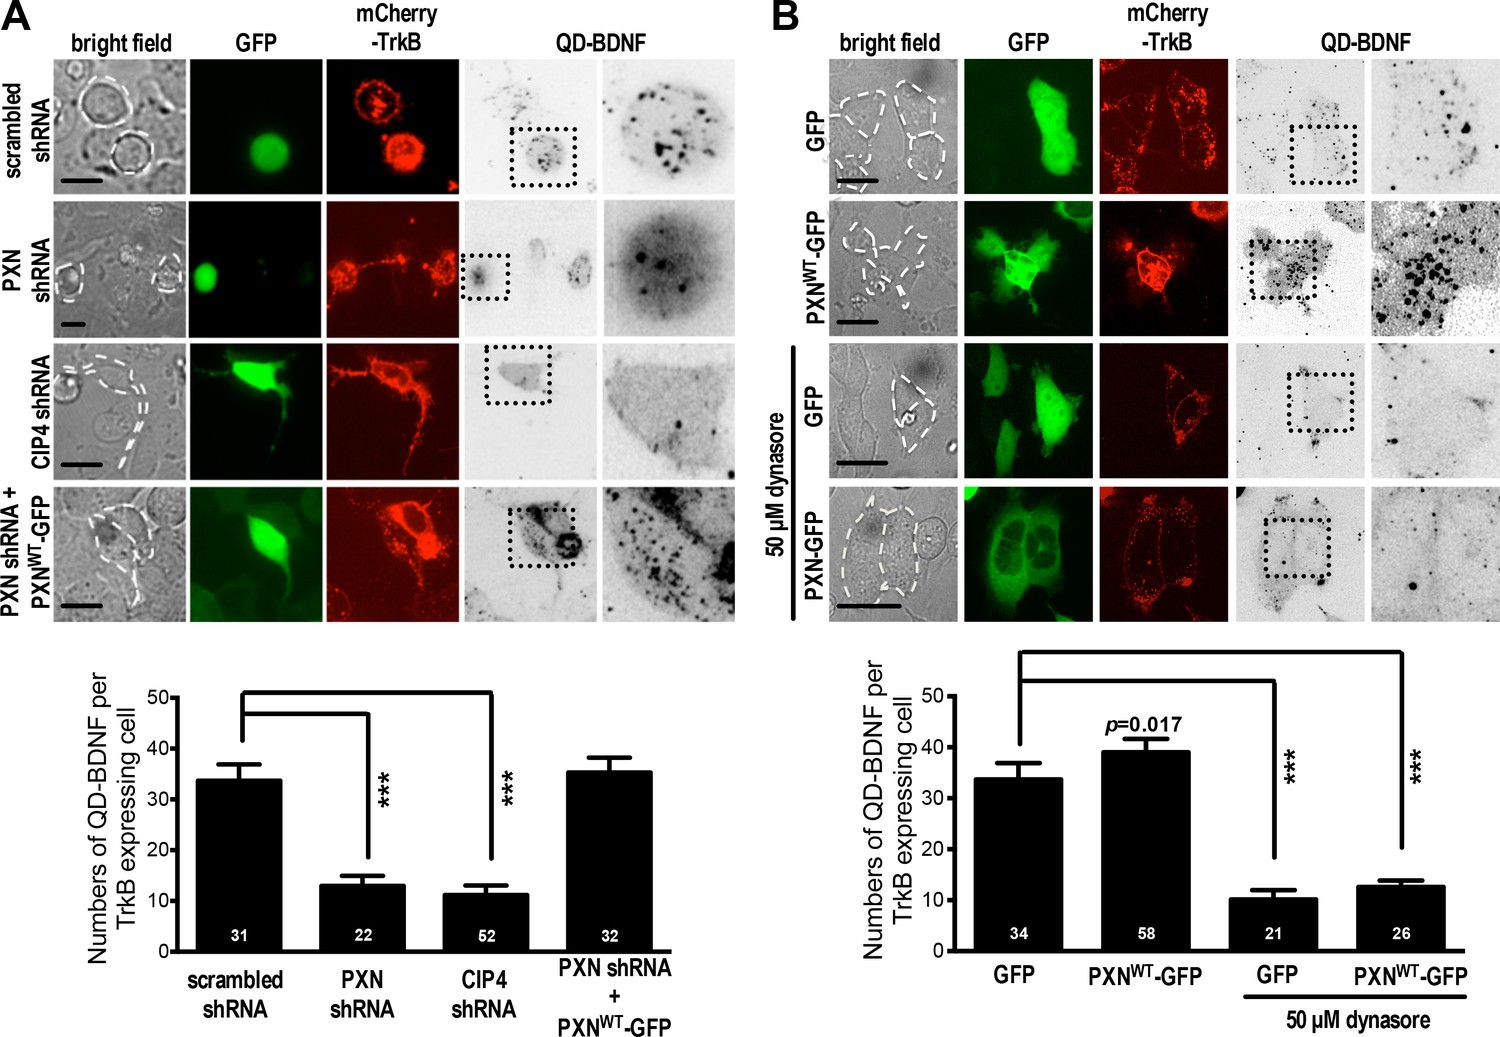
Paxillin facilitates QD-BDNF uptake.
(A) QD-BDNF internalization assay on HEK293T cells co-transfected with expression vectors encoding the BDNF receptor TrkB (Red), together with shRNA constructs (Green) and/or wild-type paxillin, as indicated. Histograms showing that co-transfection of paxillin shRNA C and shRNA D significantly reduced QD-BDNF internalization (as reflected by an ~8-fold reduction in the quantity of intracellular QD-BDNF). Data represent means ±SEM (n ≥ 3 independent experiments, 26–52 cells for each set of experiments; compared to scrambled shRNA control; ***p<0.001; ANOVA with Dunnett’s post hoc test). (B) Similar to A, except cells were pre-incubated with or without the dynamin inhibitor dynasore (50 μM, 30 min). Histograms show that dynamin is required for paxillin to promote QD-BDNF internalization. Data represent means ±SEM (n ≥ 3 independent experiments, 21–58 cells for each set of experiments; compared to GFP control; ***p<0.001; ANOVA with Dunnett’s post hoc test).
Figure 7 with 3 supplements
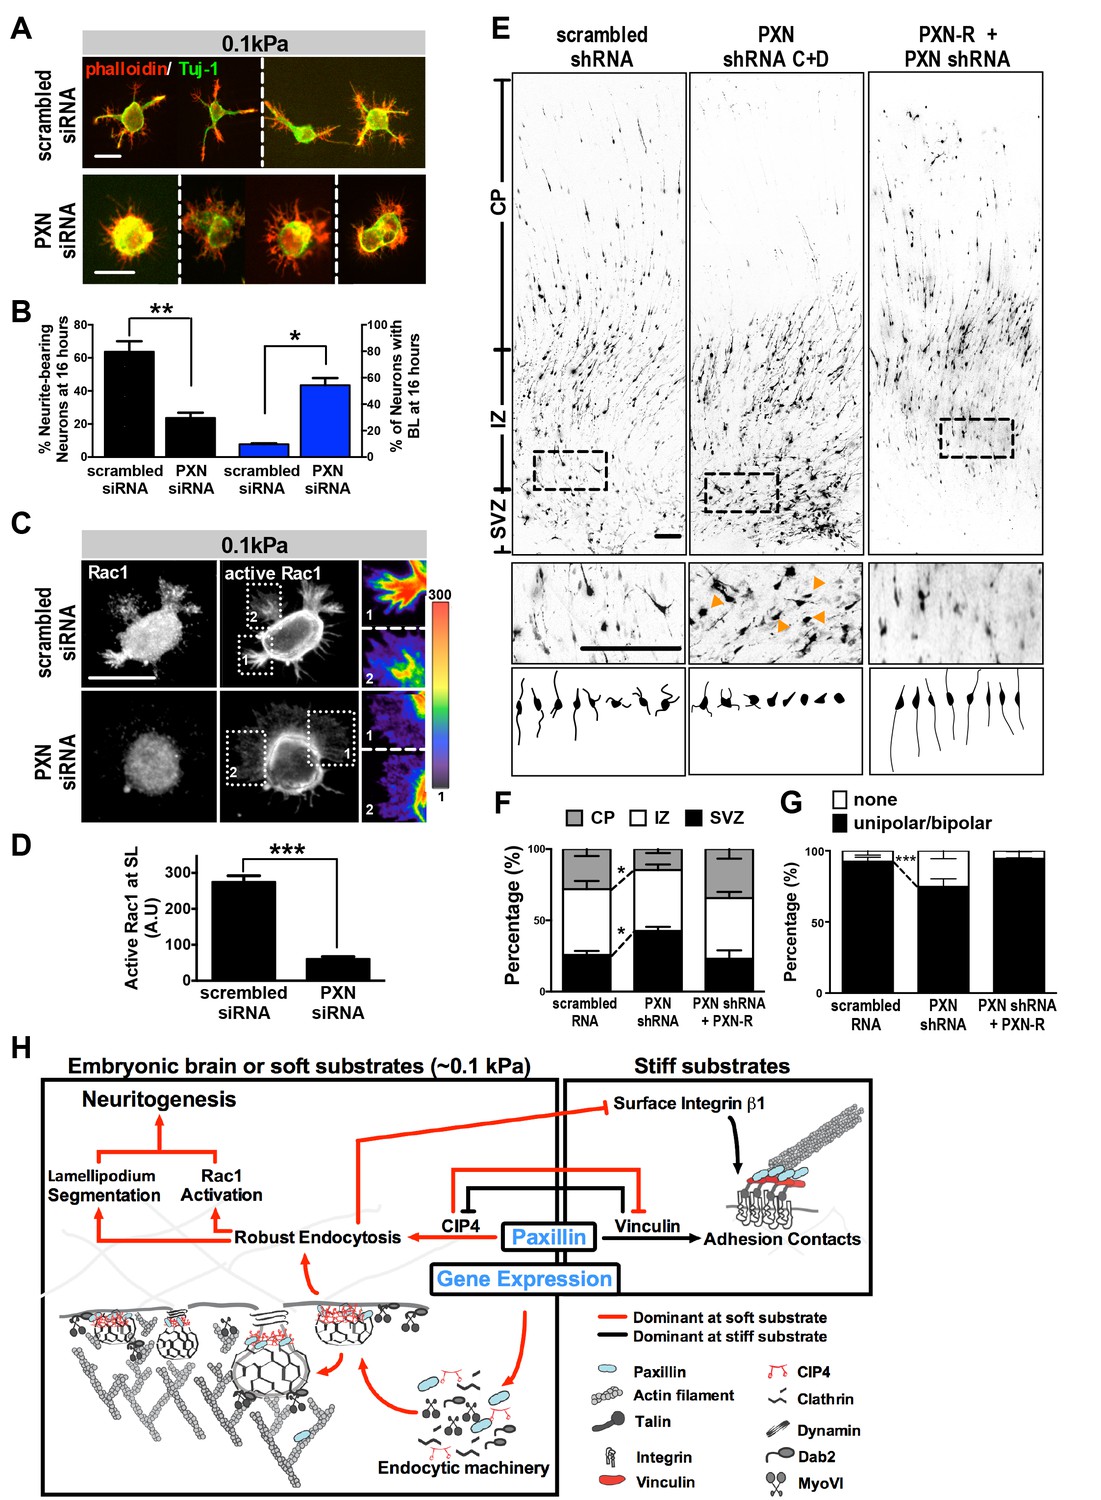
Paxillin knockdown alters neurite formation and neuronal migration in vitro and in vivo.
(A and B). Paxillin knockdown impairs lamellipodium segmentation and neurite formation in neuronal cultures on 0.1 kPa gels. (A) Images of 16 hr hippocampal neurons transfected with scrambled control or paxillin siRNA at 30 min after cell plating on 0.1 kPa gels, followed by phalloidin staining for F-actin (Red) and immunostaining for the neuronal marker Tuj-1 (Green) at 16 hr after cell plating. (B) Histograms showing that paxillin knockdown significantly decreased the percentage of neurite-bearing neurons (left y-axis) and increased the percentage of neurons exhibiting the BL phenotype (right y-axis) in 0.1 kPa cultures. Data represent mean (±SEM; n > 3 independent experiments, >250 cells for each group; *p<0.05; **p<0.01; t test). (C) Similar to A, except that 16 hr neuronal cultures were immunostained with antibodies against active Rac1-GTP (Gray). Fluorescence intensity of active Rac1 (boxed region) is coded by pseudocolors in the linear scale (right panel in C). Scale bar: 20 μm. (D) Quantification of active Rac1 levels at segmented lamellipodia (averaged pixel value of a 2 µm X 2 µm area) in 0.1 kPa cultures transfected with paxillin-siRNA or control scrambled siRNA. Data represent mean ±SEM (n > 3 independent experiments, >250 cells for each group; ***p<0.001; ANOVA with Dunnett’s post hoc test). (E) Paxillin knockdown promotes aberrant neurite formation and cortical neuron migration in vivo. Fluorescence images of E20 rat cortices transfected in utero at E17.5 with IRES constructs harboring EGFP plus scrambled-shRNA control, paxillin shRNA C + D, and/or shRNA C + D resistant PXN-R. The middle panels show 4x magnifications of boxed regions of the corresponding E20 cortex in the top panels. Bottom panels show sample tracings of 2D projections from confocal images of eight typical cortical neurons in the subventricular zone (‘SVZ’) of the corresponding E20 cortex. Bar, 100 μm. (F) Histograms showing the percentage (±SEM, n = 3 cortices each; *p<0.05, two-tailed t test) of neurons residing in the cortical plate (‘CP’), intermediate zone (‘IZ’), or subventricular zone (‘SVZ’) regions. (G) Calculation of the percentages (±SEM, n > 150 cells per cortex,>5 cortices each; ***p<0.001, multiple t test) of transfected cortical neurons exhibiting unipolar/bipolar processes or no process (‘none’; arrowheads in e) in the cortical SVZ/IZ region for cortices described in e. Datasets (connected by dashed lines) showing significant differences are marked. (H) Schematic illustrating the proposed substrate elasticity-controlled, paxillin-dependent bistable mechanism, comprising a genetic response and mutual inhibition of endocytosis by adhesion and vice versa. Growth on a soft substrate shifts neurons to a Rac1-activated neuritogenic state.
Figure 7—figure supplement 1
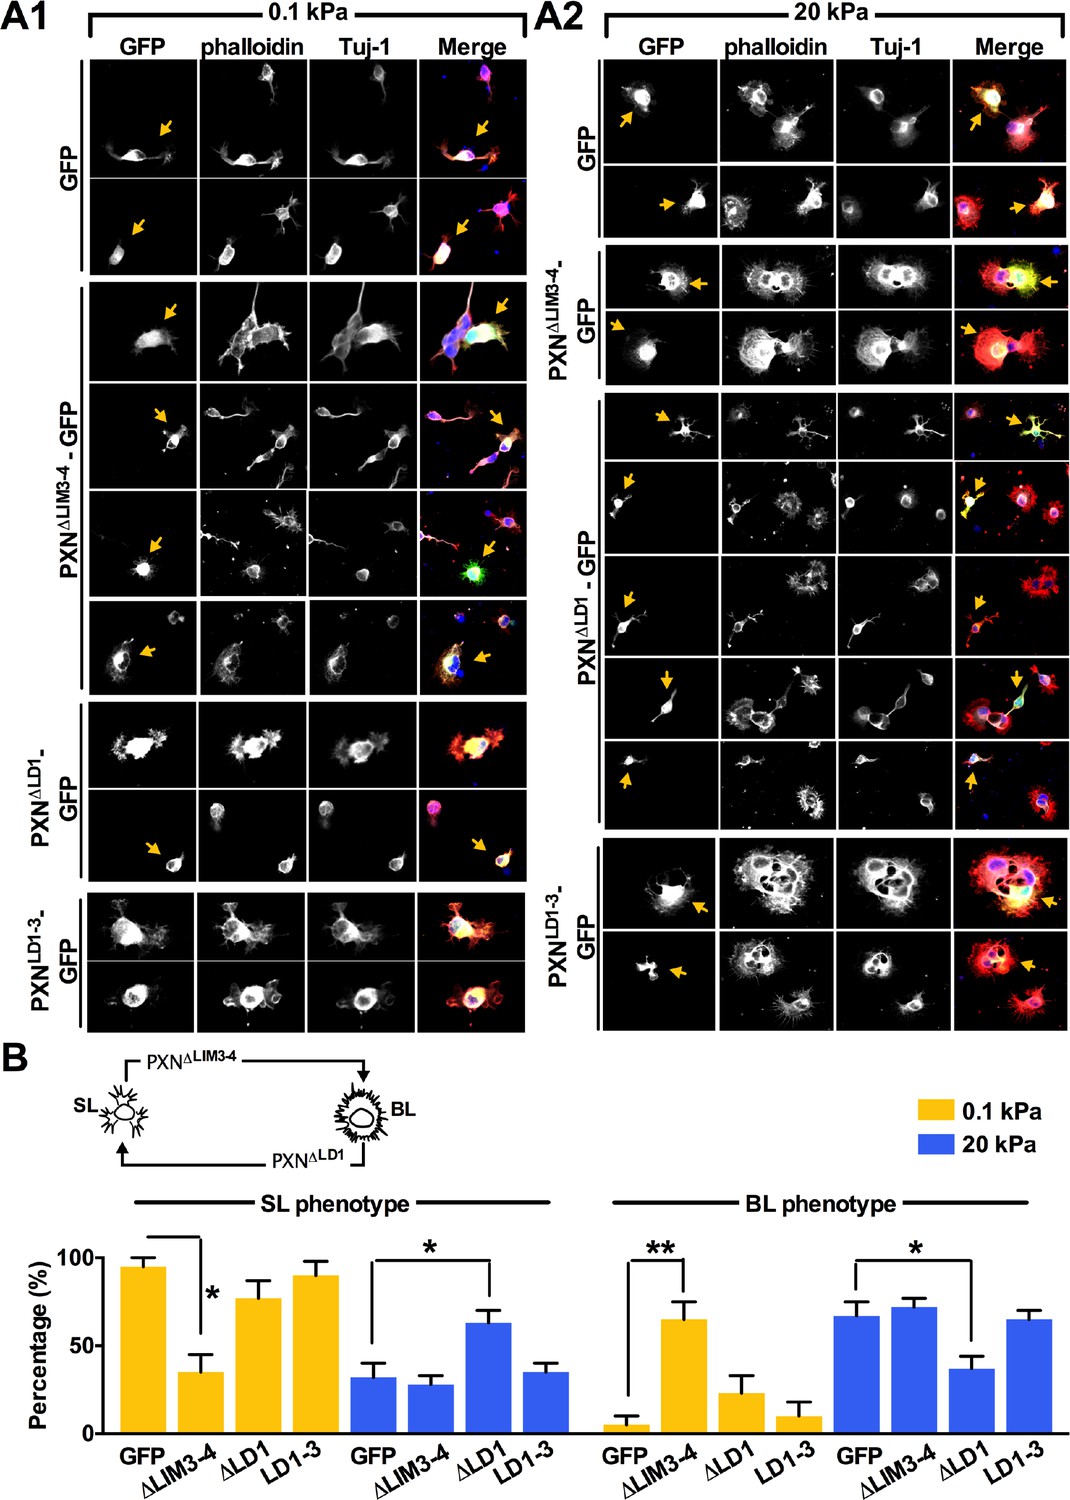
Manipulation of paxillin-binding affinity leads to a SL-BL phenotypic switch.
(A) Representative fluorescent images of transfected IUE neurons (yellow arrows) expressing control EGFP and/or a paxillin deletion mutation (Green), cultured on 0.1 kPa (A1) or 20 kPa (A2) gels for 16 hr, and stained with phalloidin (Red), DAPI (Blue), and antibodies against Tuj-1 (Gray). (B) Histograms summarize the percentages (±SEM; *p<0.05; **p<0.001, one-way ANOVA with Dunnett’s post hoc test) of 16 hr neurons bearing segmented lamellipodia (‘SL’) or broad lamellipodia ('BL’) in neurons expressing different paxillin deletion mutations, as indicated. The top panel shows schematic of the neurite phenotype switch observed in the PXN∆LIM3-4 expressing neuron on 0.1 kPa gel and the PXN∆LD1 expressing neuron on 20 kPa gel.
Figure 7—figure supplement 2
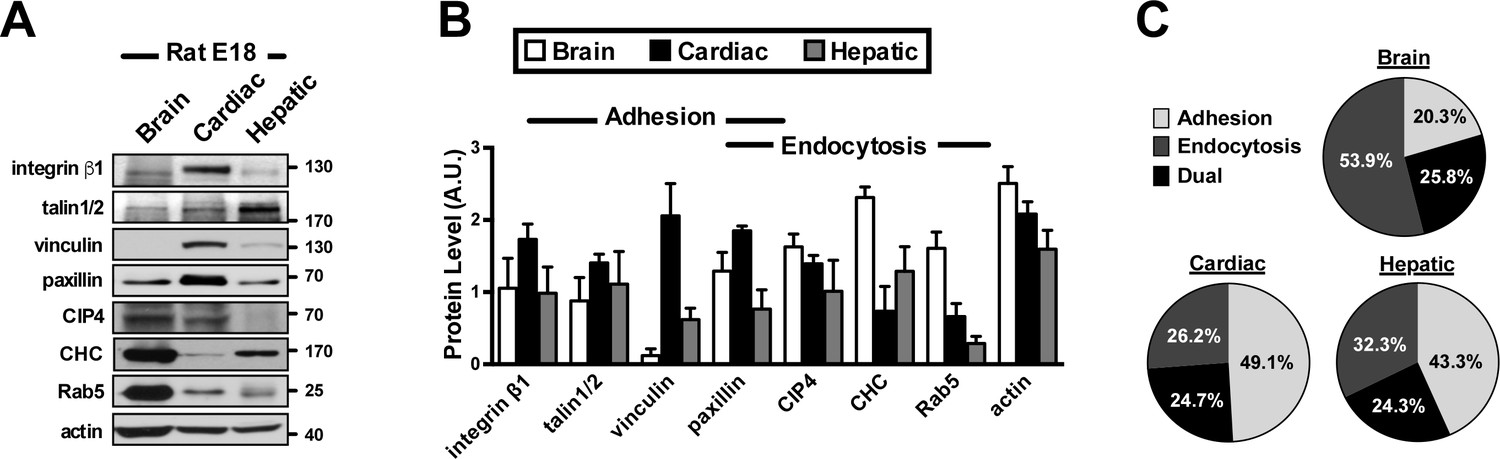
Differential protein abundances between the endocytosis and adhesion machineries in embryonic brain, cardiac, and hepatic tissues.
Representative Western blots (A) and quantitative analysis (B) of embryonic E18 brain, heart and liver lysates. Note that endocytic factors (CHC, Rab5 and CIP4) are more abundant in brain than in heart. Data represent mean ±SEM in more than three independent experiments. (C) Pie charts depicting the relative levels of adhesion and endocytic factors in brain, cardiac and hepatic tissues at E18, from all experiments similar to that described in B. The size of each pie slice is proportional to the sum of adhesion molecules (including integrin β1, talin1/2, vinculin and paxillin) or endocytic accessory factors (including paxillin, CIP4, CHC and Rab5) over all proteins measured. Paxillin and actin are assigned to dual function (endocytosis and adhesion). Note that endocytic factors are highly abundant in embryonic brain tissue.
Figure 7—figure supplement 3
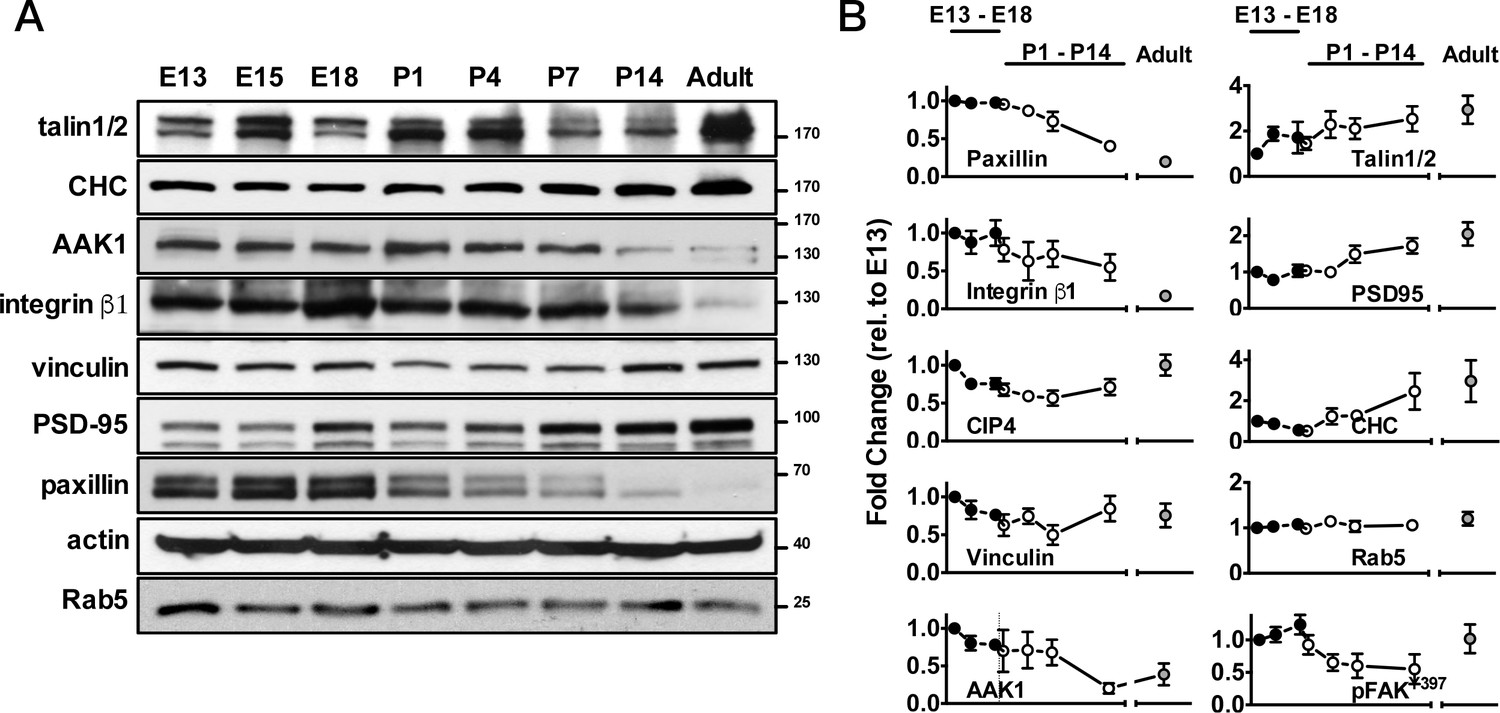
Expression time-course of adhesion- or endocytosis-related proteins in developing mouse cerebral cortex.
(A) Western blots of mouse brain lysates showing protein expression profiles at different developmental stages (including E13, E15, E18, P1, P4, P7, P14, and adult), as indicated. (B) Quantification of protein levels, from all experiments similar to that described in A, at different time-points compared to corresponding levels at E13. Data represents mean ±SEM from more than three independent experiments.
Appendix 1—figure 1
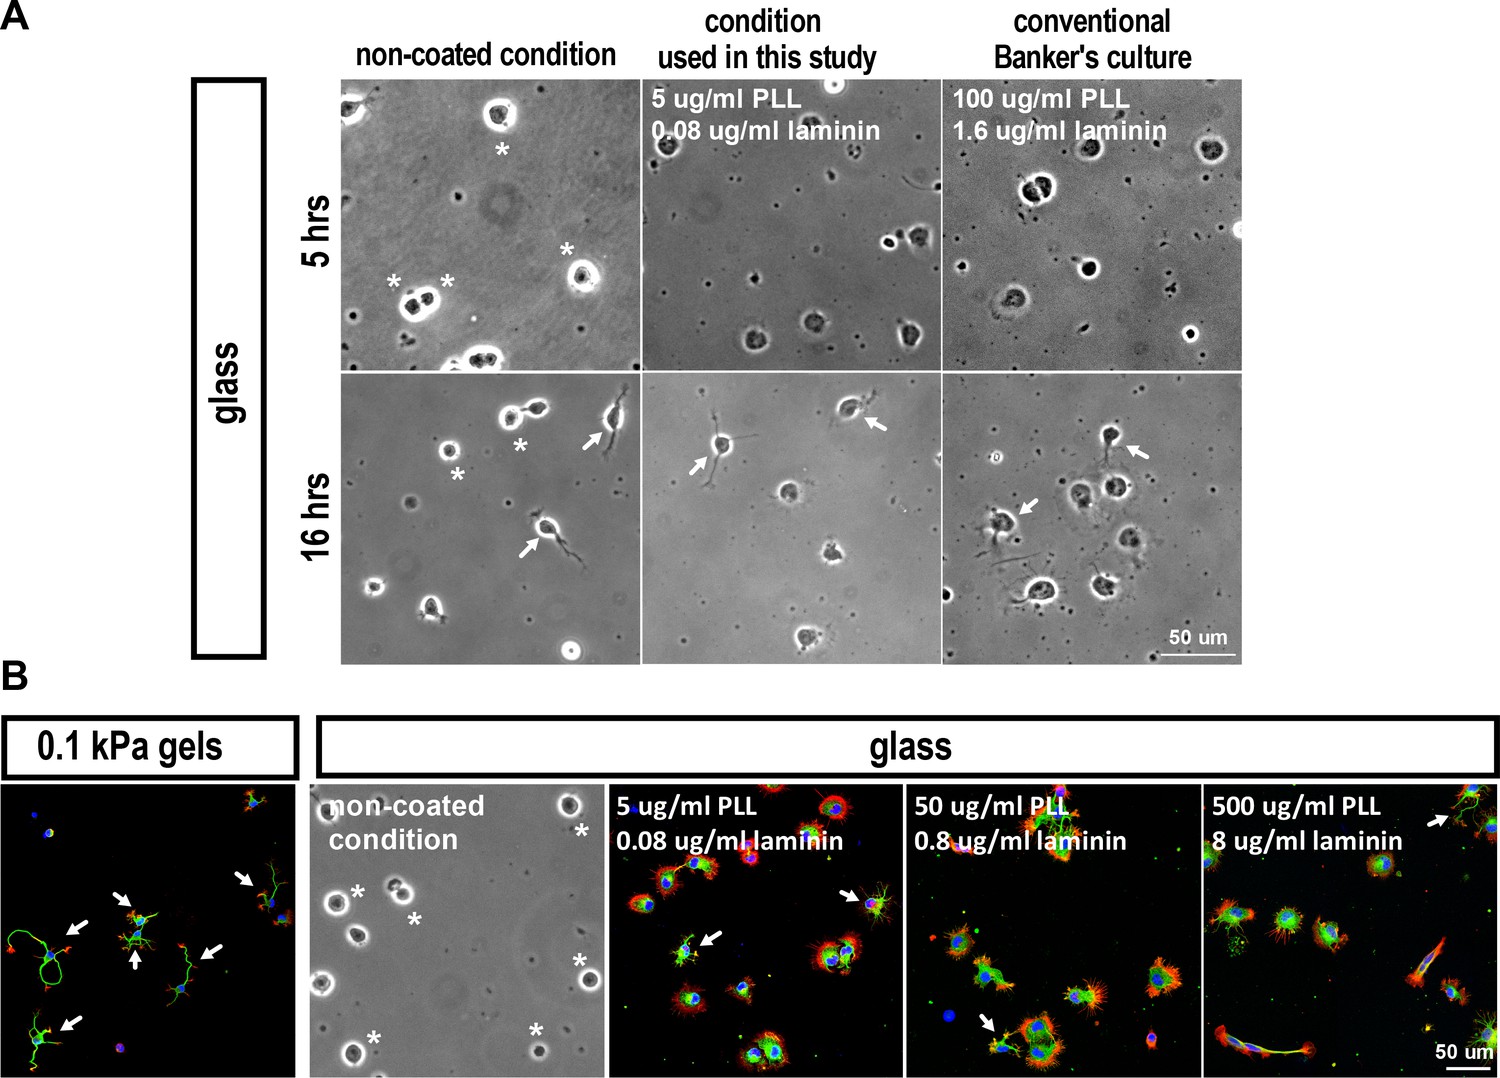
Images of hippocampal neuronsunder differing culture conditionsfor 5 or 16 hr.
(A) Bright-field images of hippocampal neurons cultured on coverslips (glass) coated under differing conditions for 5 or 16 hr, as indicated. (B) Images of neurons grown on 0.1 kPa gels or coverslips with varied coatings for 5 hr, stained for F-actin (phalloidin; red), microtubules (anti-Tuj-1; green), and nuclei (DAPI; blue). Asterisks mark cells with no lamellipodial protrusions. Arrows mark neurite-bearing neurons.
Appendix 1—figure 2

Proposed model for the biphasic behavior in neuronal morphogenesis (related to Figure 3).
(A) The probability of segmentation depends on a ‘P’ factor that can bind to both endocytosis and adhesion complexes. When bound to the former, P factor enhances endocytosis and cells activate Rac1 and expression of factors required for the endocytic machinery (including P factor itself), providing a positive feedback that is modulated by substrate softness to accelerate segmentation. On stiff substrates, P factor is sequestered to cell-substrate adhesions, promoting a low-endocytosis and non-segmentable state. (B) Numerical simulations show that, based on the proposed model, cells can form a bistable switch between a high (Red line) and a low (Blue line) endocytosis state, dependent on the substrate modulus. (C) Numerical results show that the probability of segmentation depends on the substrate modulus and endocytic activity. (D) Numerical results show delayed onset of lamellipodium segmentation in cells grown on rigid substrates. For (B–D), see below model for details and parameters.
Appendix 1—figure 3
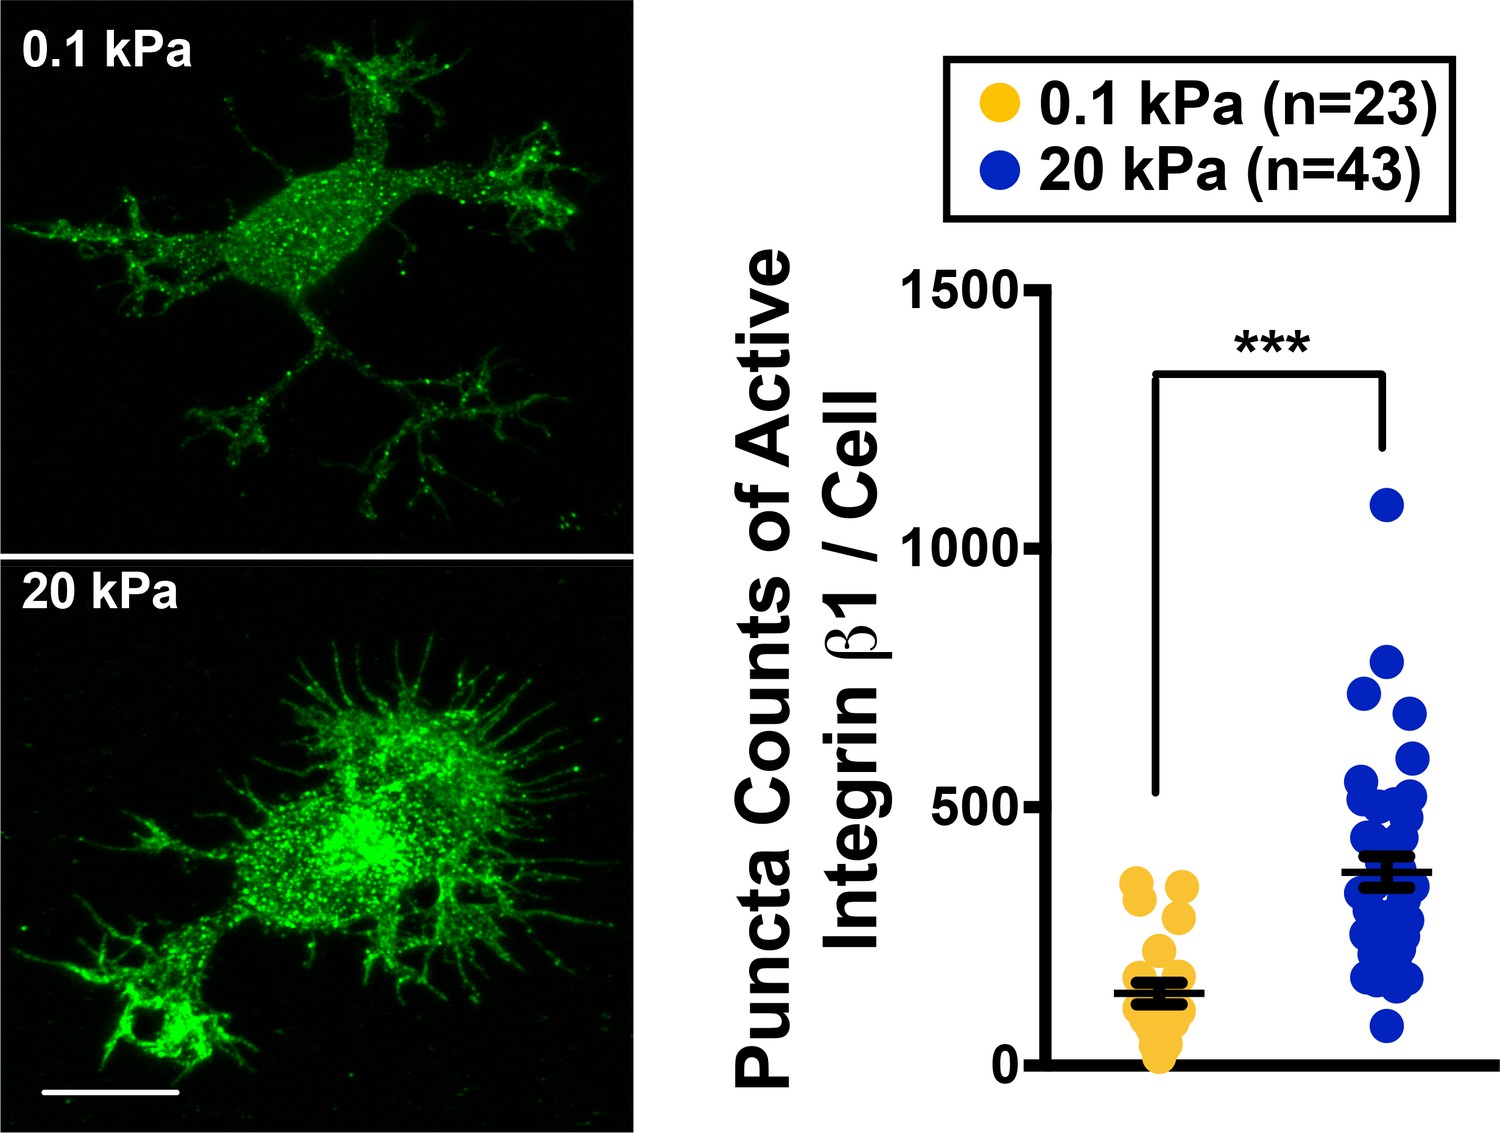
Active Integrin β1 staining of neurons grown on 0.1 kPa or 20 kPa gels.
Right panel shows representative images of neuronal cultures stained with antibody specific against activated integrin β1 at the 16 hr time points after cell plating. Scale bar: 5 μm. Dot plot: quantification for puncta density of activated integrin 1 (n = 23–43 cells each, ***p<0.001; t test).
Tables
Key resources table
| Reagent type (species) or resource | Designation | Source or reference | Identifiers | Additional information |
|---|---|---|---|---|
| cell line | HEK293T | ATCC | ATCC Cat# CRL-3216, RRID:CVCL_0063 | |
| antibody | anti-FLAG M2 | Sigma-Aldrich | Sigma-Aldrich Cat# F1804, RRID:AB_262044 | dilution: 1:1000 |
| c-Myc Tag Monoclonal Antibody (9E10) | Thermo Fisher Scientific | Thermo Fisher Scientific Cat# MA1-980, RRID:AB_558470 | dilution: 1:1000 | |
| Anti-beta III tublin Antibody | Millpore | Millipore Cat# AB9354, RRID:AB_570918 | dilution: 1:1000 in IF | |
| MAP2 | Millpore; PMID:26244549 | Millipore Cat# AB5622, RRID:AB_11213363 | dilution: 1:1000 in IF | |
| actin | Millpore | Millipore Cat# MAB1501, RRID:AB_2223041 | dilution: 1:2000 | |
| Tau-1 | Millpore | Millipore Cat# MAB3420, RRID:AB_94855 | dilution: 1:1000 in IF | |
| Anti-Paxillin (N-Term), Rabbit Monoclonal, clone Y113 antibody | Millpore | Millipore Cat# 04–581, RRID:AB_838293 | dilution: 1:1000 in WB; 1:200 in IF | |
| p-PaxillinY118 | ECM Biosciences | ECM Biosciences Cat# PP4501 | dilution: 1:1000 | |
| Mouse Anti-Paxillin Monoclonal Antibody, Unconjugated, Clone 349 | BD Biosciences; PMID:28362576 | BD Biosciences Cat# 612405, RRID:AB_647289 | dilution: 1:1000 | |
| Anti-Vinculin, clone V284 antibody | millpore; PMID:28697342 | Millipore Cat# 05–386, RRID:AB_309711 | dilution: 1:1000 in WB; 1:200 in IF | |
| Anti-Integrin Beta1, activated, Clone HUTS-4, Azide Free antibody | Millore; PMID:28602620 | Millipore Cat# MAB2079Z, RRID:AB_2233964 | dilution: 1:1000 | |
| TRIP/CIP4 | Bethyl Laboratories; A301-186A | dilution: 1:1000 in WB; 1:200 in IF | ||
| Clathrin heavy chain antibody | Abcam; PMID:28231467, PMID:28575669 | Abcam Cat# ab21679, RRID:AB_2083165 | dilution: 1:1000 in WB; 1:200 in IF | |
| Talin 1 and 2 antibody [8D4] | Abcam | Abcam Cat# ab11188, RRID:AB_297828 | dilution: 1:1000 in WB | |
| Rabbit Anti-Rab5 Polyclonal Antibody, Unconjugated | Abcam; PMID:28408870, PMID:28669519 | Abcam Cat# ab18211, RRID:AB_470264 | dilution: 1:1000 in WB | |
| Integrin beta 1 antibody [EP1041Y] - Carboxyterminal end | Abcam; PMID:25330147, PMID:28552668, PMID:28609658 | Abcam Cat# ab52971, RRID:AB_870695 | dilution: 1:1000 in WB; 1:200 in IF | |
| Phospho-FAK (Tyr397) Antibody (31H5L17), ABfinity(TM) Rabbit Monoclonal | Thermo Fisher Scientific; PMID:22049075, PMID:25280968, PMID:26056143, PMID:26381152, PMID:26393679, PMID:26984758 | Thermo Fisher Scientific Cat# 700255, RRID:AB_2532307 | dilution: 1:1000 in WB; 1:200 in IF | |
| Rabbit Anti-FAK [pY397] Polyclonal Antibodies, Unconjugated antibody | Thermo Fisher Scientific; PMID:27474796, PMID:28069919, PMID:28520937 | Thermo Fisher Scientific Cat# 44–624G, RRID:AB_2533701 | dilution: 1:1000 in WB; 1:200 in IF | |
| Akt1/2/3 (H-136) antibody | Santa Cruz Biotechnology; PMID:27316329, PMID:27410235, PMID:28911175 | Santa Cruz Biotechnology Cat# sc-8312, RRID:AB_671714 | dilution: 1:200 in WB | |
| Rac 1 (C-11) antibody | Santa Cruz Biotechnology | Santa Cruz Biotechnology Cat# sc-95, RRID:AB_2176125 | dilution: 1:200 in WB | |
| Cdc42 (P1) antibody | PMID:28181299, PMID:28457749 | Santa Cruz Biotechnology Cat# sc-87, RRID:AB_631213 | dilution: 1:200 in WB | |
| Rho A (26C4) antibody | Santa Cruz Biotechnology; PMID:28287395, PMID:28323616 | Santa Cruz Biotechnology Cat# sc-418, RRID:AB_628218 | dilution: 1:200 in WB | |
| Anti-Active Rac1-GTP Mouse Monoclonal Antibody | NewEast Biosciences | NewEast Biosciences Cat# 26903, RRID:AB_1961793 | dilution: 1:200 in WB and IF | |
| Anti-RhoA antibody (mouse MAb)+control | Cytoskeleton Inc; PMID:27822498 | Cytoskeleton Cat# ARH03, RRID:AB_10708069 | dilution: 1:200 in WB and IF | |
| Anti-Rac1 specific mouse MAb antibody | Cytoskeleton Inc | Cytoskeleton Cat# ARC03-A, RRID:AB_10709099 | dilution: 1:200 in WB and IF | |
| Anti-Cdc42 Mouse Monoclonal Antibody | Cytoskeleton Inc | Cytoskeleton Cat# ACD03-A, RRID:AB_10716593 | dilution: 1:200 in WB and IF | |
| peptide, recombinant protein | PAK-GST, GST-Photekin-RBD | Cytoskeleton Inc | Cytoskeleton Inc Cat. #BK035; Cat. # BK036 |
Additional files
-
Transparent reporting form
- https://doi.org/10.7554/eLife.31101.022
Download links
A two-part list of links to download the article, or parts of the article, in various formats.
Downloads (link to download the article as PDF)
Open citations (links to open the citations from this article in various online reference manager services)
Cite this article (links to download the citations from this article in formats compatible with various reference manager tools)
Paxillin facilitates timely neurite initiation on soft-substrate environments by interacting with the endocytic machinery
eLife 6:e31101.
https://doi.org/10.7554/eLife.31101


