Live imaging of heart tube development in mouse reveals alternating phases of cardiac differentiation and morphogenesis
- Centro Nacional de Investigaciones Cardiovasculares, Spain
Figures
Figure 1 with 3 supplements
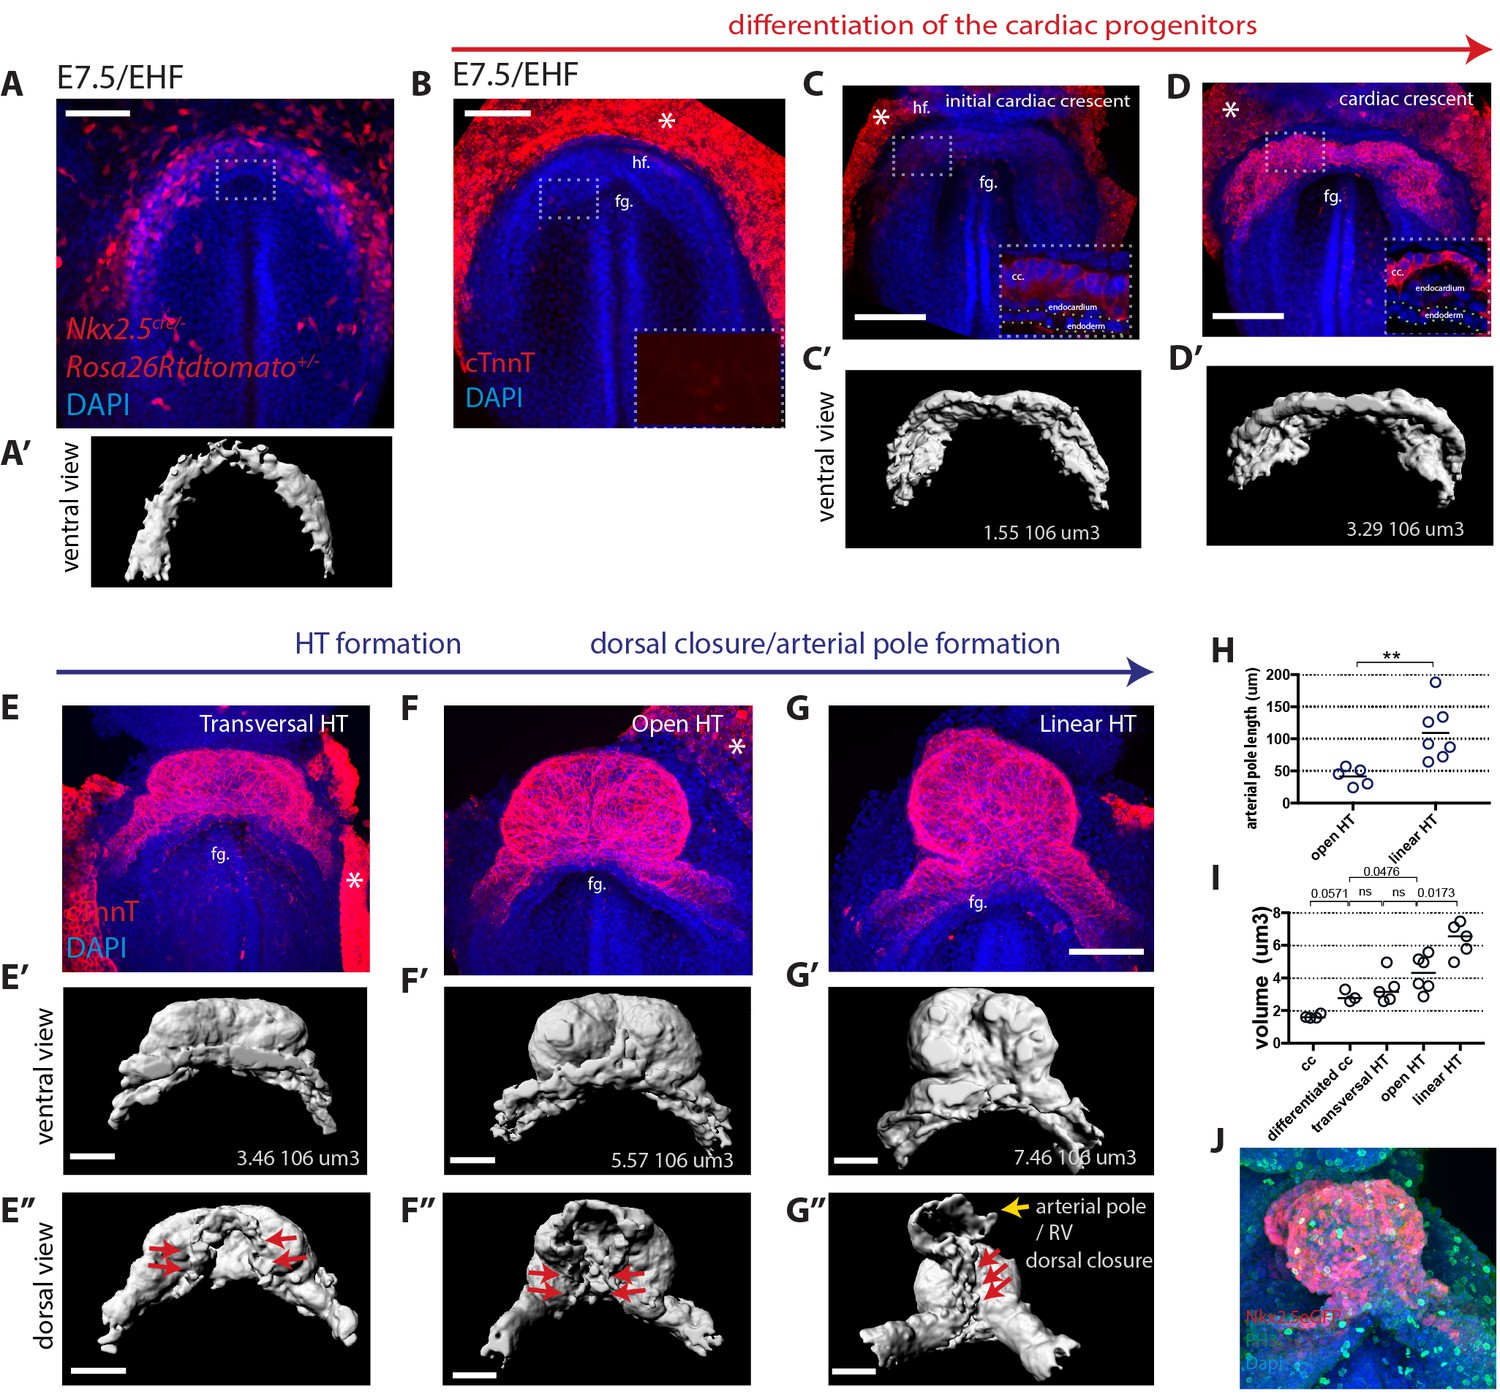
Overview of HT morphogenesis and growth.
(A) Frontal view of an Nkx2.5cre/+; Rosa26Rtdtomato embryo at EHF stage. (A’) 3D reconstruction of the tdtomato signal in the cardiogenic area. Signal from tdtomato+ endothelial cells identified by shape was manually masked. See also Video 1. (B–G) Immunostaining for cTnnT (red) and Dapi (blue) showing six consecutive stages during cardiac differentiation (B–D) and HT morphogenesis (E–G). (B) At EHF cTnnt is initially not detectable. (C–D) During early somitogenesis, cTnnT signal becomes detectable in the cc. Insets in (B–D): magnification of single optical sections showing cTnnT localization and cell shape. (C’–G’ and E’’–G’’) Corresponding 3D renderings from cTnnT signal reconstruction. Red arrows in (E’–G’) highlight the dorsal closure of the HT. Yellow arrow in G’’ highlights the arterial pole (prospective RV). See also Video 2. (H) Quantification of the arterial pole/RV length in the open HT (41.4 ± 14.0 μm, n = 5) and after dorsal closure (109 ± 43.44 μm, n = 7), mean ±SD, p=0.0025. (I) Quantification of the cardiac volume at the different stages of HT development. (Initial cc: 1.63.106 μm3 ± 0.13, n = 4, cc: 2.89.106 ± 0.37 μm3, n = 3, transversal HT: 3.367. 106 μm3 ± 0.95, n = 5, open HT: 4.29.106 μm3 ± 1.08, n = 6, linear HT: 6.37. 106 μm3 ± 1.01, n = 5, mean ±SD). p-Values are indicated on the graph. (J) Immunostaining of an Nkx2.5eGFP embryo for PH3 (red) and Dapi (blue) at HT stage, showing proliferative cells in the ventricle. Scale bars: 100 μm.
-
Figure 1—source data 1
Source data for Figure 1H and I.
- https://doi.org/10.7554/eLife.30668.007
Figure 1—figure supplement 1
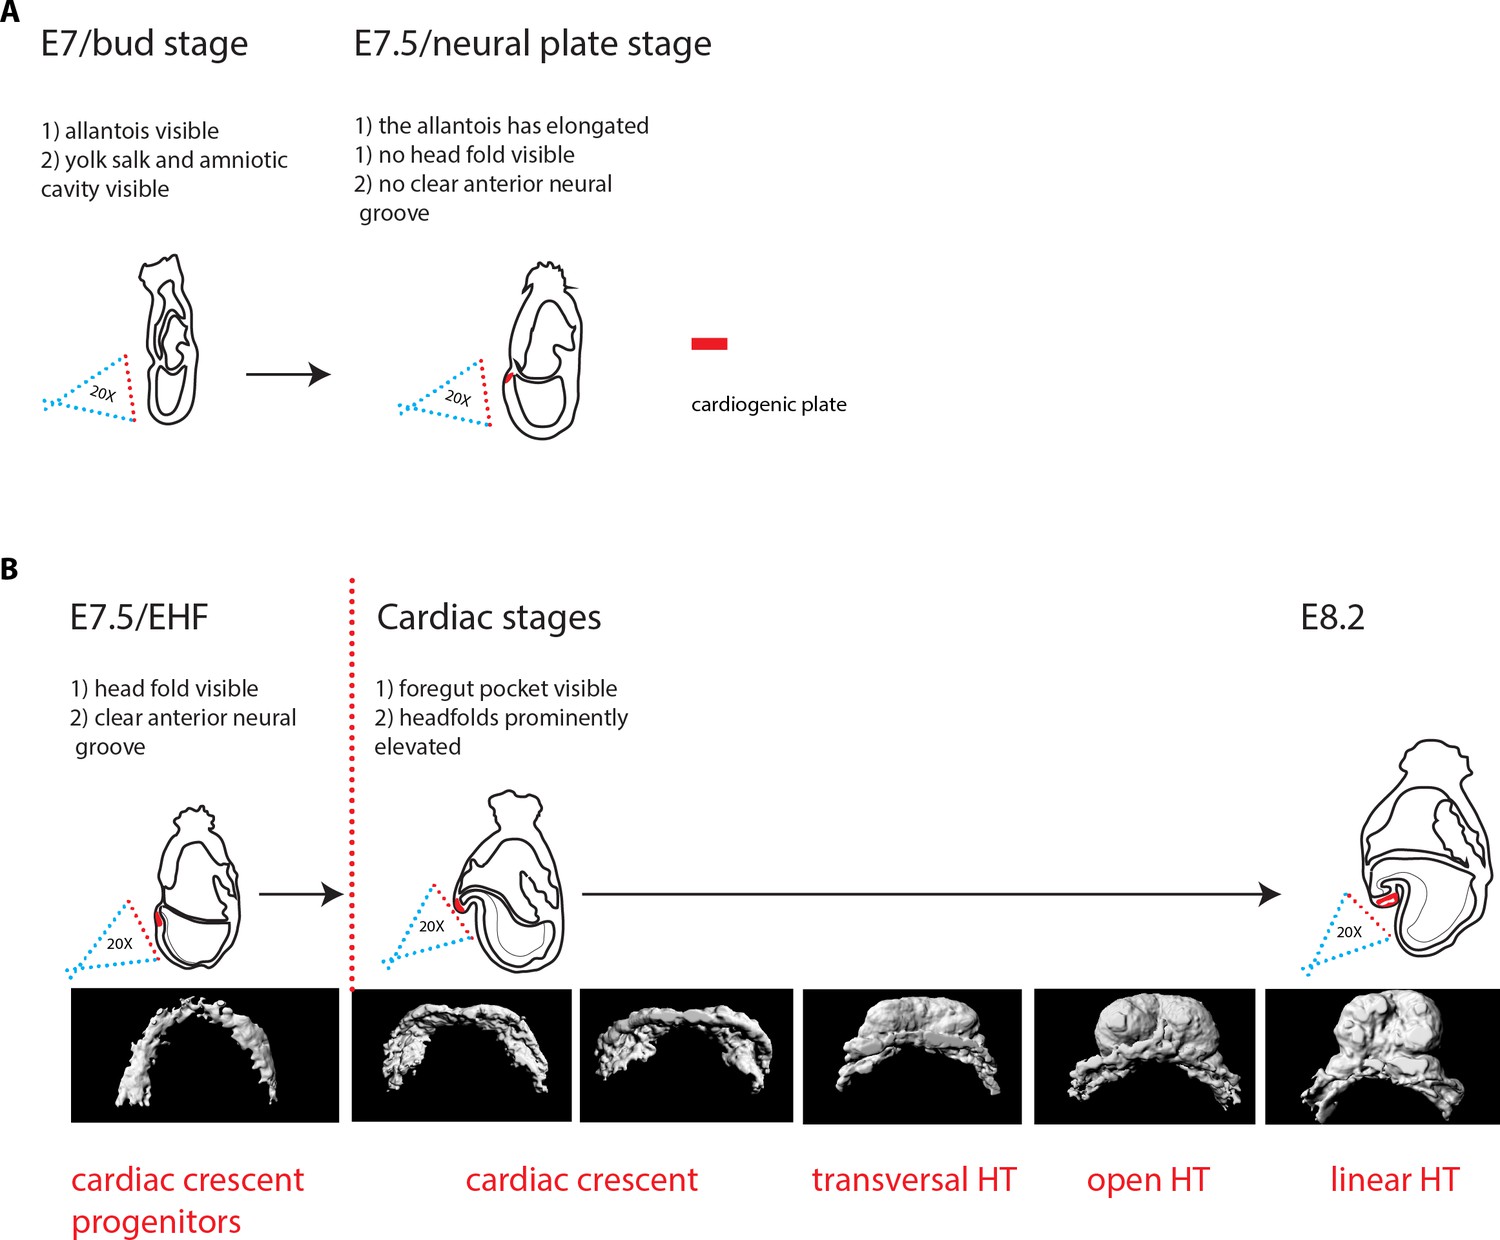
Criteria for embryo staging.
We determined the developmental stage of embryos based on morphological landmarks (Downs and Davies, 1993; Lawson and Wilson, 2016). (A) At bud stage/E7, a small allantois bud is visible. At neural plate stage/E7.5, the allantois is larger and projects into the yolk sack cavity. The anterior neuroectoderm is enlarged. (B) At EHF/E7.5, the neural plate starts to form the head fold. During somitogenesis, a clearly visible foregut pocket appears and the head folds are located dorsally and anteriorly to the cardiac primordium. The cc has differentiated. It transforms successively into the transversal HT, the open HT and the linear HT closed dorsally and with a prominent arterial pole/RV. Scale bars: 100 μm.
Figure 1—figure supplement 2
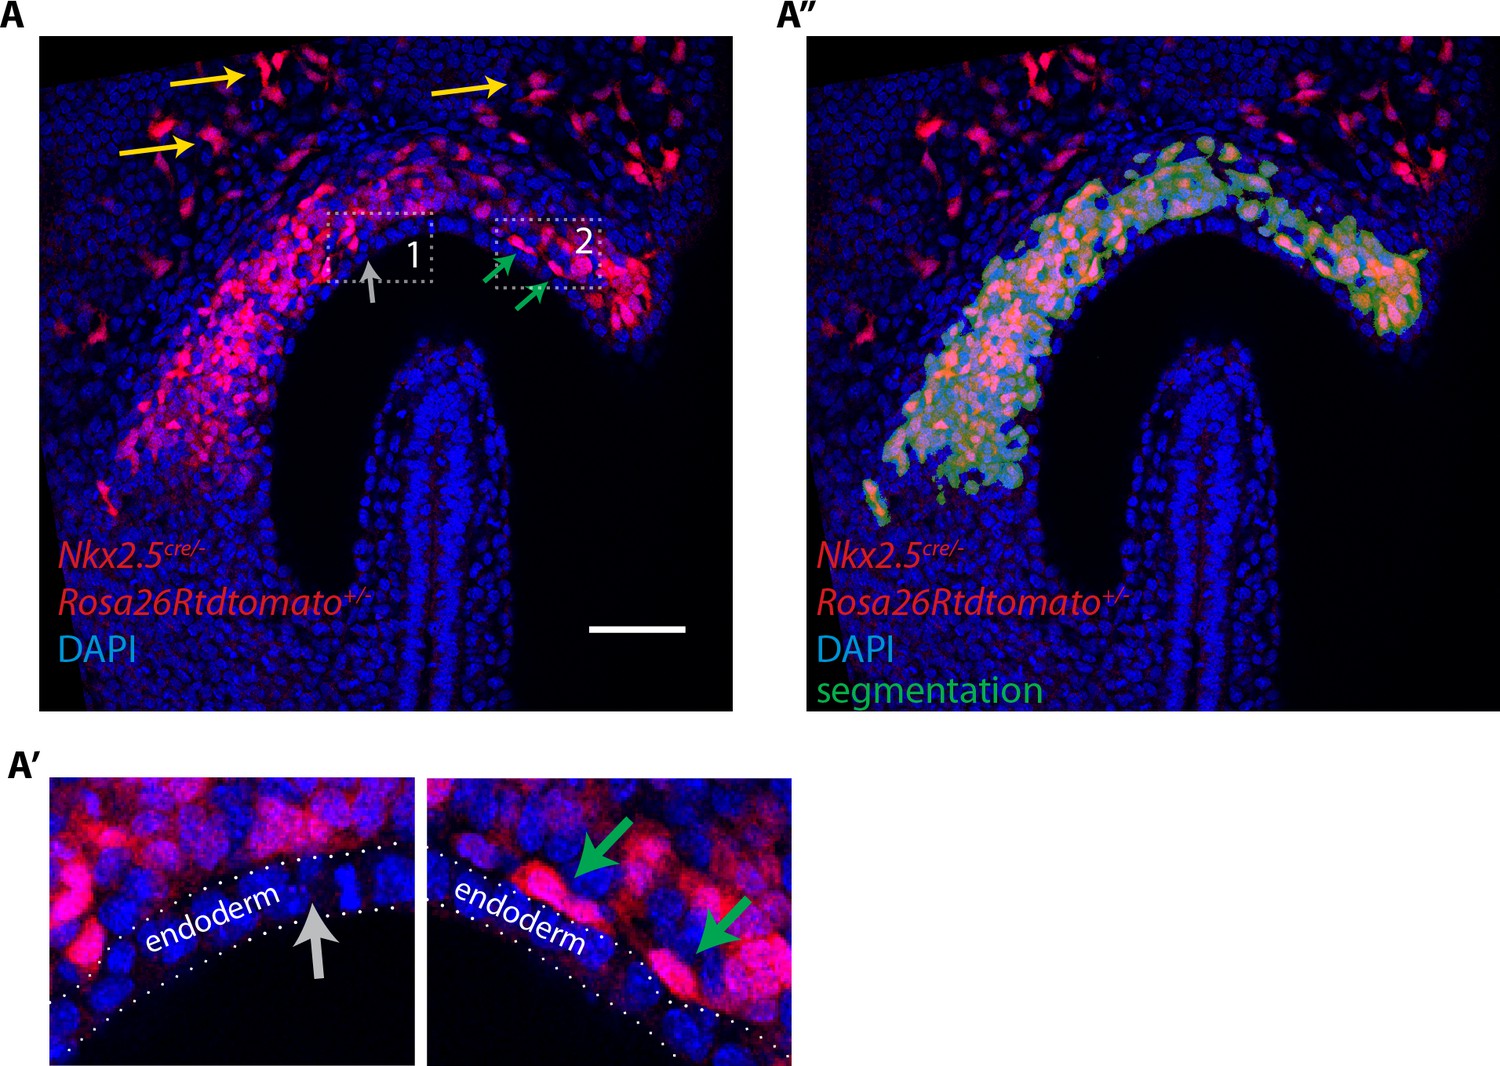
Lineage tracing using the Nkx2.5cre driver shows a contribution of labeled cells to the cardiogenic regions but not to the endoderm at EHF stage.
(A, A’) Nkx2.5cre/+; Rosa26Rtdtomato+/- embryo at EHF stage (same embryo as in Figure 1A. Here a single optical section is shown). Tdtomato labeling is detected in the cardiac progenitors, endothelial (yellow arrow) and endocardial cells (green arrows). No labeling is detected in the endoderm (gray arrow). (A’’) Segmentation of cardiac crescent progenitors (shown in dark green) used for the 3D reconstruction shown in Figure 1A’ overlaid with the raw image and. Scale bars: 100 μm.
Figure 1—figure supplement 3
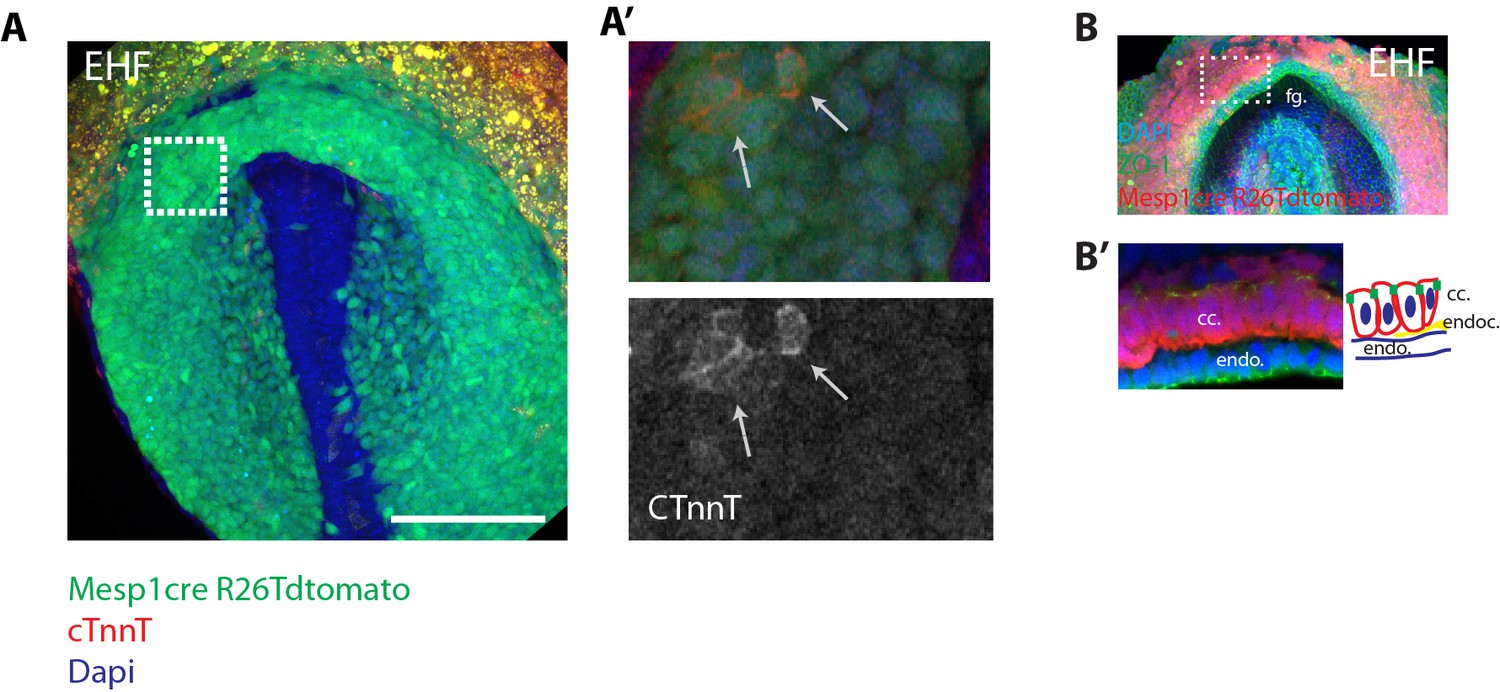
Faint cTnnT signal starts to be detected at EHF stage in apico-basally polarized cc cells.
(A) A Mesp1cre/+; Rosa26Rtdtomato+/- embryo at EHF stage showing mesodermal labeling (green)- immunostaining against cTnnT (red) and Dapi (blue). Note that the embryo is at a slightly more advanced developmental stage than those shown in (Figure 1B) because the foregut pocket is more invaginated. (A’) White inset in (A). Faint cTnnT signal (red) in few mesodermal cells (arrows) can be detected. (B–B’) Mesp1cre/+; Rosa26Rtdtomato+/- embryo showing the mesoderm in red and immunostained against the tight junction component zona-occludens-1 (ZO-1) (green) and Dapi (blue). The cc cells (as seen in transversal sections) have an AB polarized epithelial morphology. fg: foregut, endo: endoderm, endoc: endocardium. Scale bars: 150 μm.
Figure 2 with 2 supplements
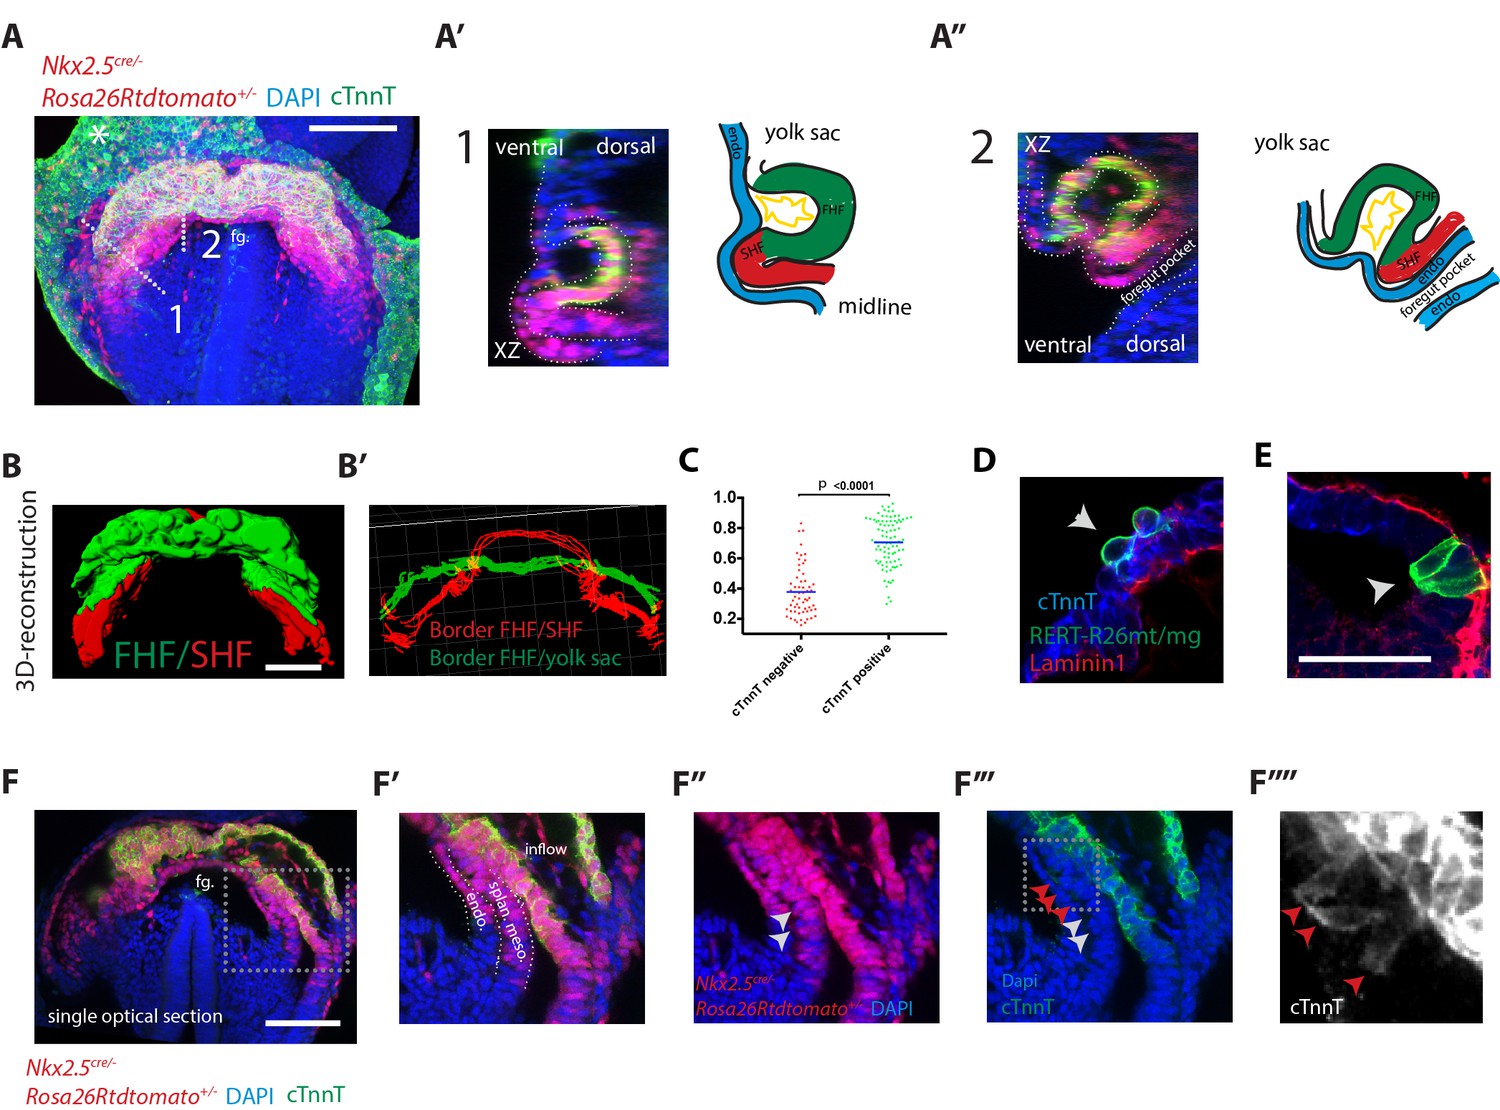
Visualization of the boundary between FHF and SHF.
(A–A’’) An Nkx2.5cre/+; Rosa26Rtdtomato+/- embryo immunostained for cTnnT (green) and Dapi (blue) showing cells of the Nkx2.5+ lineage populating both the FHF and SHF. (A’ and A’’) Cross-sections in xz along the dotted lines 1 and 2 shown in (A), and corresponding schematics highlighting the endoderm (blue), FHF (green), SHF (red) and endocardium (yellow). Note that tdtomato signal is also detected in the endoderm and endocardium. (B) 3D reconstruction of the FHF (green) and SHF (red); (B’) 3D drawing of the border between the FHF and SHF (in red) and the FHF and yolk sack (in green) (based on the embryo shown in (A). For SHF rendering, the tdtomato+ splanchnic mesoderm was depicted. The FHF was rendered using the cTnnT signal. See also Video 3. (C) Quantification of the cell roundness (rnd) index of cardiomyocytes at HT stage on single optical sections. Black bars indicate mean. Rnd index for cTnnT+ (green) cells is 0.71 ± 0.16 and for cTnnT- (red) cells is 0.38 ± 0.16, mean ±SD, exact p value < 0.0001. (D–E) Membrane-GFP labeling of typical cTnnT +FHF (D) and cTnnT-SHF (E) cells at longitudinal HT stage. The specimen is immunostained for cTnnT (blue), the basement membrane marker Laminin1 (red) and GFP (green). (F) Single optical section of the same embryo shown in (A, B). (F’–F’’’) Inset: red arrows point to cells localizing weak cTnnT signal and have columnar cell shape in the SHF. White arrows point to cTnnT-negative SHF cells. splan. meso: splanchnic mesoderm, endo: endoderm, fg: foregut. In all the embryos immunostained for cTnnT, the yolk sack signal is non-specific background (indicated by an asterisks). Scale bars: 100 μm except in (D–E): 50 μm.
-
Figure 2—source data 1
Source data for Figure 2C.
- https://doi.org/10.7554/eLife.30668.011
Figure 2—figure supplement 1
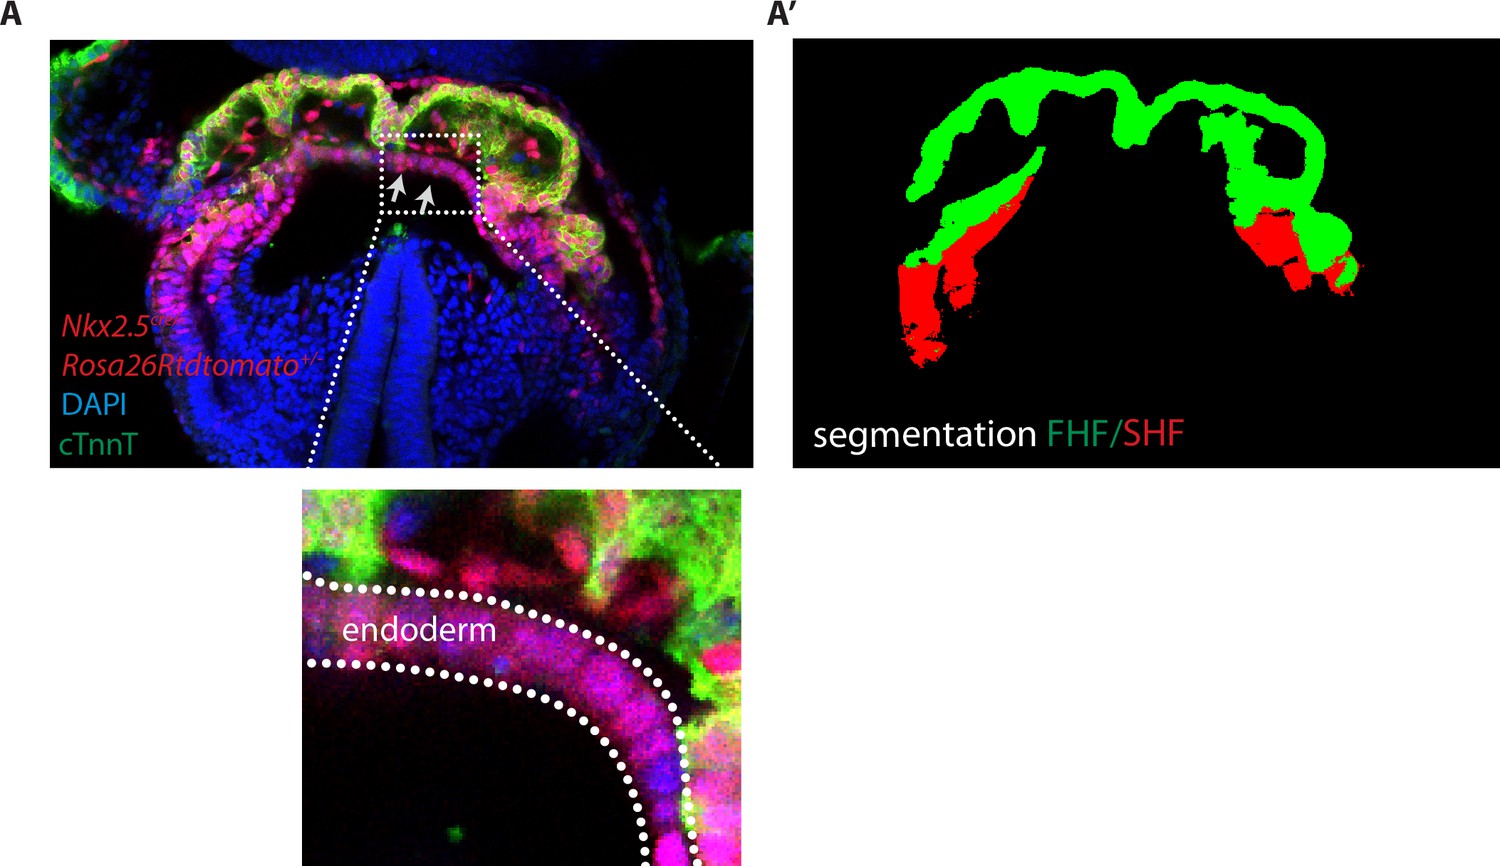
Image segmentation of the FHF and SHF.
(A) Single optical section of an Nkx2.5cre/+; Rosa26Rtdtomato+/- embryo immunostained for cTnnT (green) and Dapi (blue). Gray arrows highlight tdtomato signal in the endoderm (A’) Segmentation of the FHF and SHF. Segmentation of the FHF (green) is based on the cTnnT signal while the segmentation of the SHF is based on the tdtomato positive and cTnnT negative signal (in red). tdtomato labeling in the endoderm and endocardium has been removed manually.
Figure 2—figure supplement 2
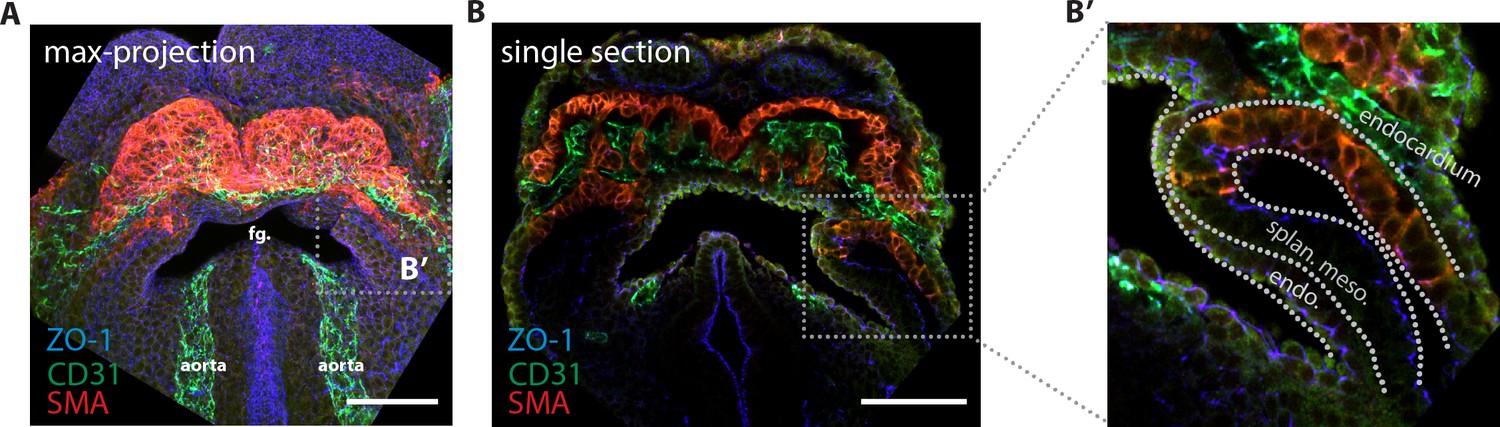
Endocardium localization in the cardiac crescent.
(A) Maximum z-projection and (B, B’) single optical section of an embryo immunostained for smooth muscle actin (SMA, labeling differentiated cardiomyocytes) (red), CD31 (labeling the endocardium) (green) and ZO-1 (blue). endo: endoderm, splan. meso: splanchnic mesoderm Scale bars: 150 μm.
Figure 3 with 3 supplements
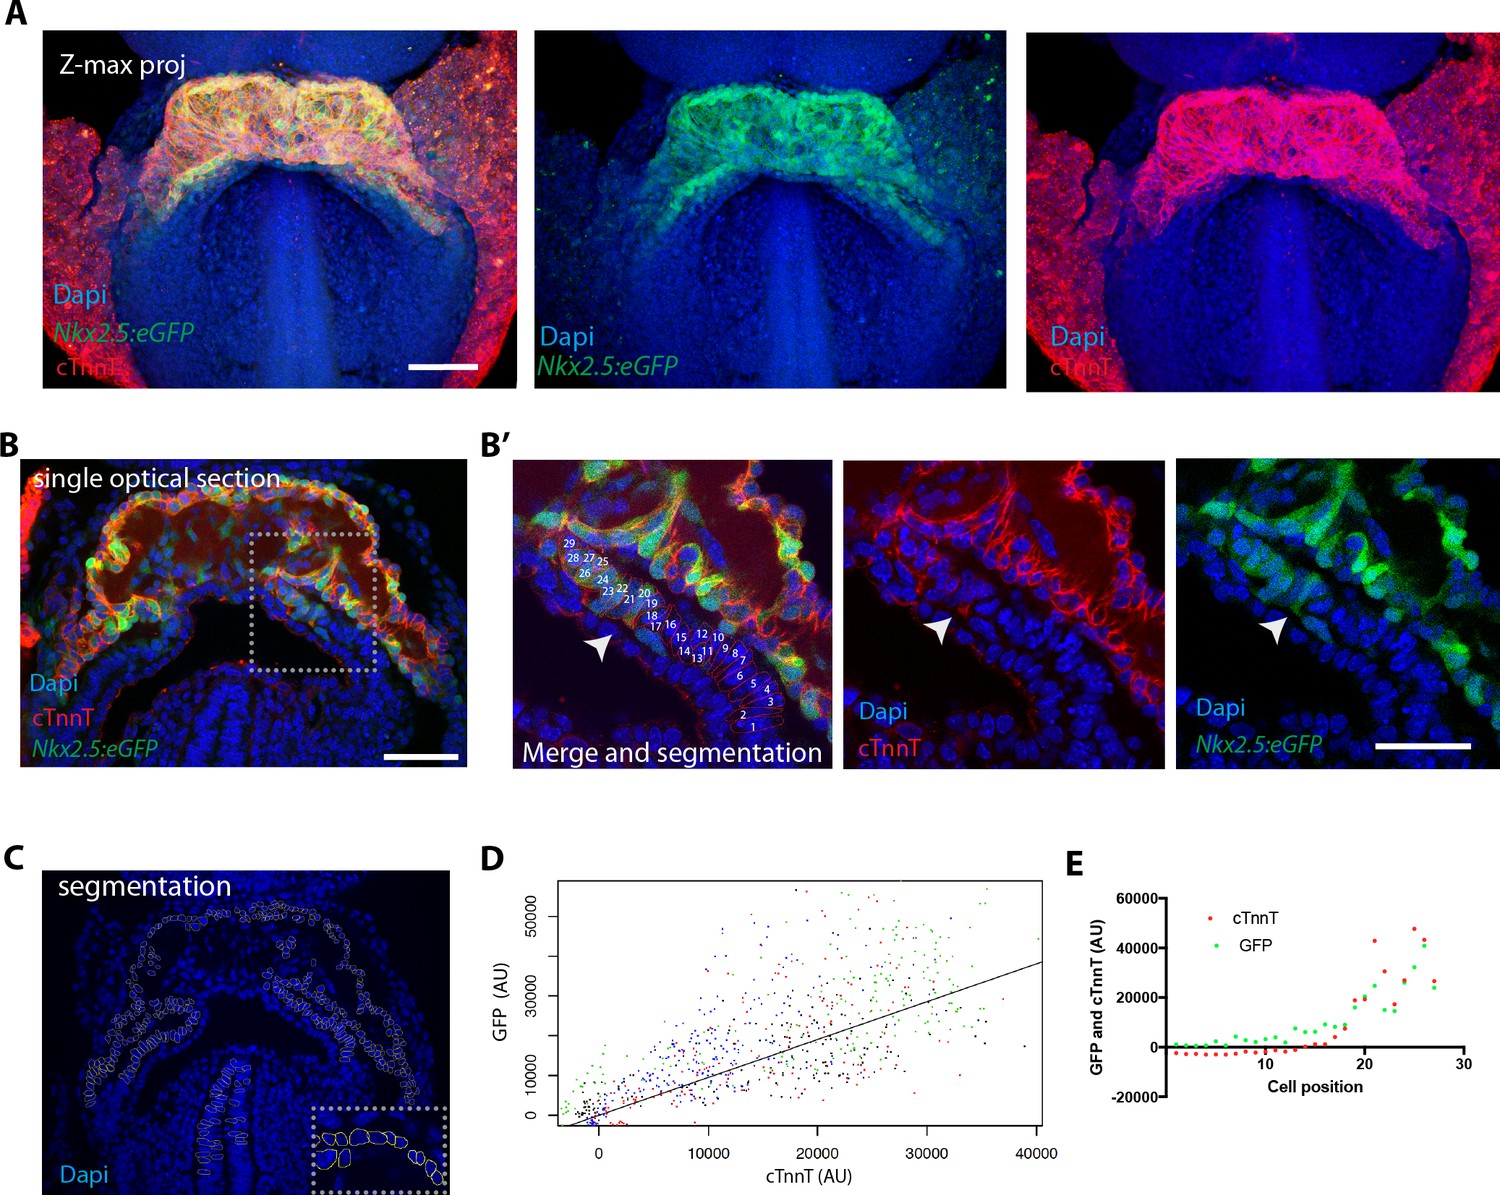
The Nkx2.5eGFP transgene is robustly expressed in cTnnT-positive cardiomyocytes.
(A) z-maximum projection of an Nkx2.5eGFP embryo at transversal HT stage immunostained for cTnnT (red) and Dapi (blue) showing high GFP level in differentiated cardiomyocytes. (B) Single optical section of an Nkx2.5eGFP embryo at transversal HT stage immunostained for cTnnT (red) and Dapi (blue). (B’) Inset in (B): arrow points the transition between cTnnT+ and cTnnT- domains, corresponding to FHF and SHF, respectively. Dotted line represents the linescan measured in (D) (C) Example of manual segmentation based on Dapi nuclei in cells located in the splanchnic mesoderm and in the neural tube. (D) Linear mixed-effects model to find the relationship between the background-substracted GFP and cTnnT levels adjusted by embryo (GFP = 0.95*cTnnT). (E) GFP and cTnnT mean intensities measured within manually segmented cells along the boundary from SHF to cTnnT-positive FHF (B’) (n = 130 cells analysed in four independent embryos). Scale bar: 100 μm.
-
Figure 3—source data 1
Source data for Figure 3D and E.
- https://doi.org/10.7554/eLife.30668.019
Figure 3—figure supplement 1
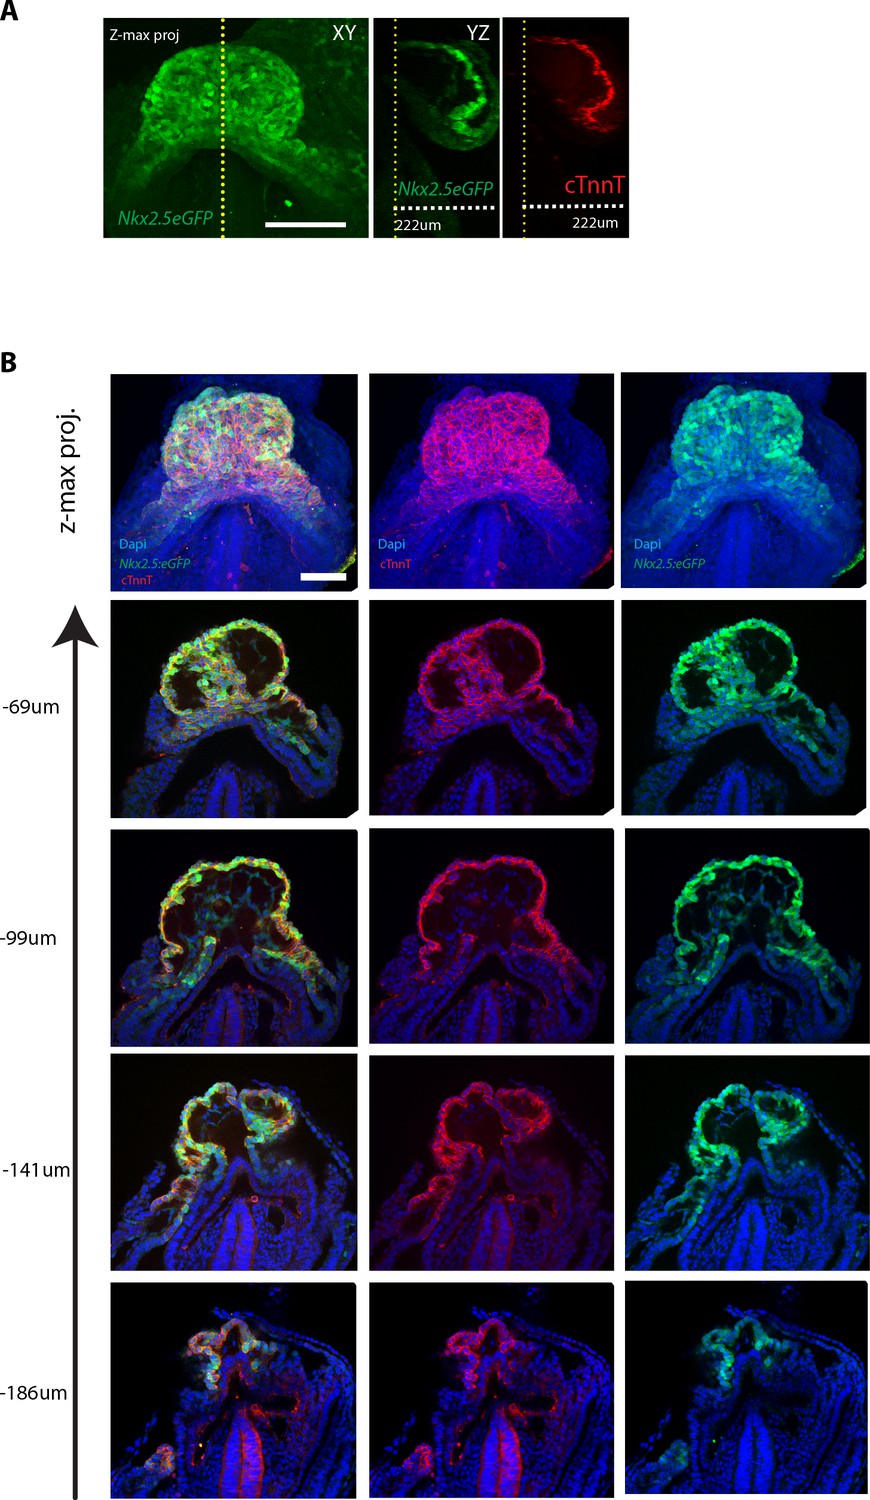
The Nkx2.5eGFP and cTnnT labeling at different z-levels.
(A) z-maximum projection and yz view of a Nkx2.5eGFP embryo immunostained against cTnnT showing overlap between eGFP signal and cTnnT localisation along the z dimension. (B) z-maximum projection and optical sections at different z-level of an Nkx2.5eGFP embryo, immunostained for cTnnT (red) and Dapi (blue), showing overlapping expression of GFP and cTnnT signal. Scale bar: 100 μm.
Figure 3—figure supplement 2

High GFP levels are detected in strongly labeled cTnnT cells.
(A,B) Normalized GFP and cTnnT mean level for single segmented cell. Each dot represents a single segmented cell (A) located in the FHF and SHF and (B) located at the boundary zone between the FHF and SHF (n = 130 cells analyzed from eight embryos). (C) Linear mixed-effects model to find the relationship between the background substracted GFP and cTnnT levels adjusted by embryo for cell located at the boundary between the FHF and SHF (GFP = 0.94*cTnnT, R2 = 0.77, p<2.2e-16). Cells are being considered positive for cTnnT when their mean intensity value is above 0. Note that small GFP signal can be detected in the cTnnT-negative SHF cells.
Figure 3—figure supplement 3
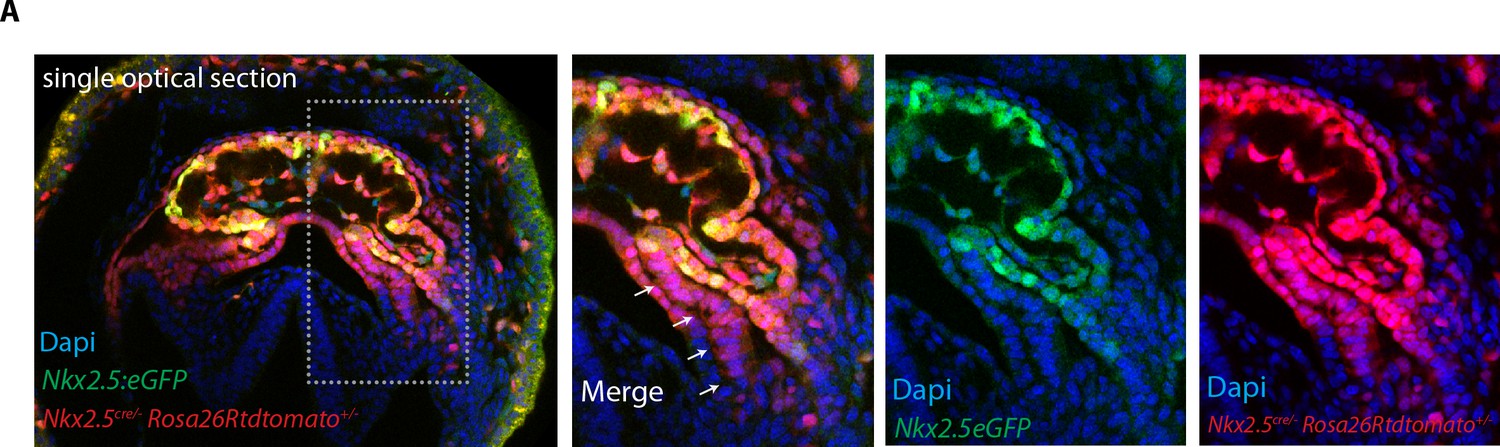
Nkx2.5Cre genetic tracing labels both the FHF and SHF.
(A) The GFP expression of the Nkx2.5eGFP reporter does not fully overlap with tdtomato expression pattern in Nkx2.5cre/+; Rosa26Rtdtomato+/-; Nkx2.5eGFP embryos at the level of the splanchnic mesoderm/SHF. Scale bar: 100 μm.
Figure 4 with 2 supplements
Live-imaging of cardiac differentiation and morphogenesis.
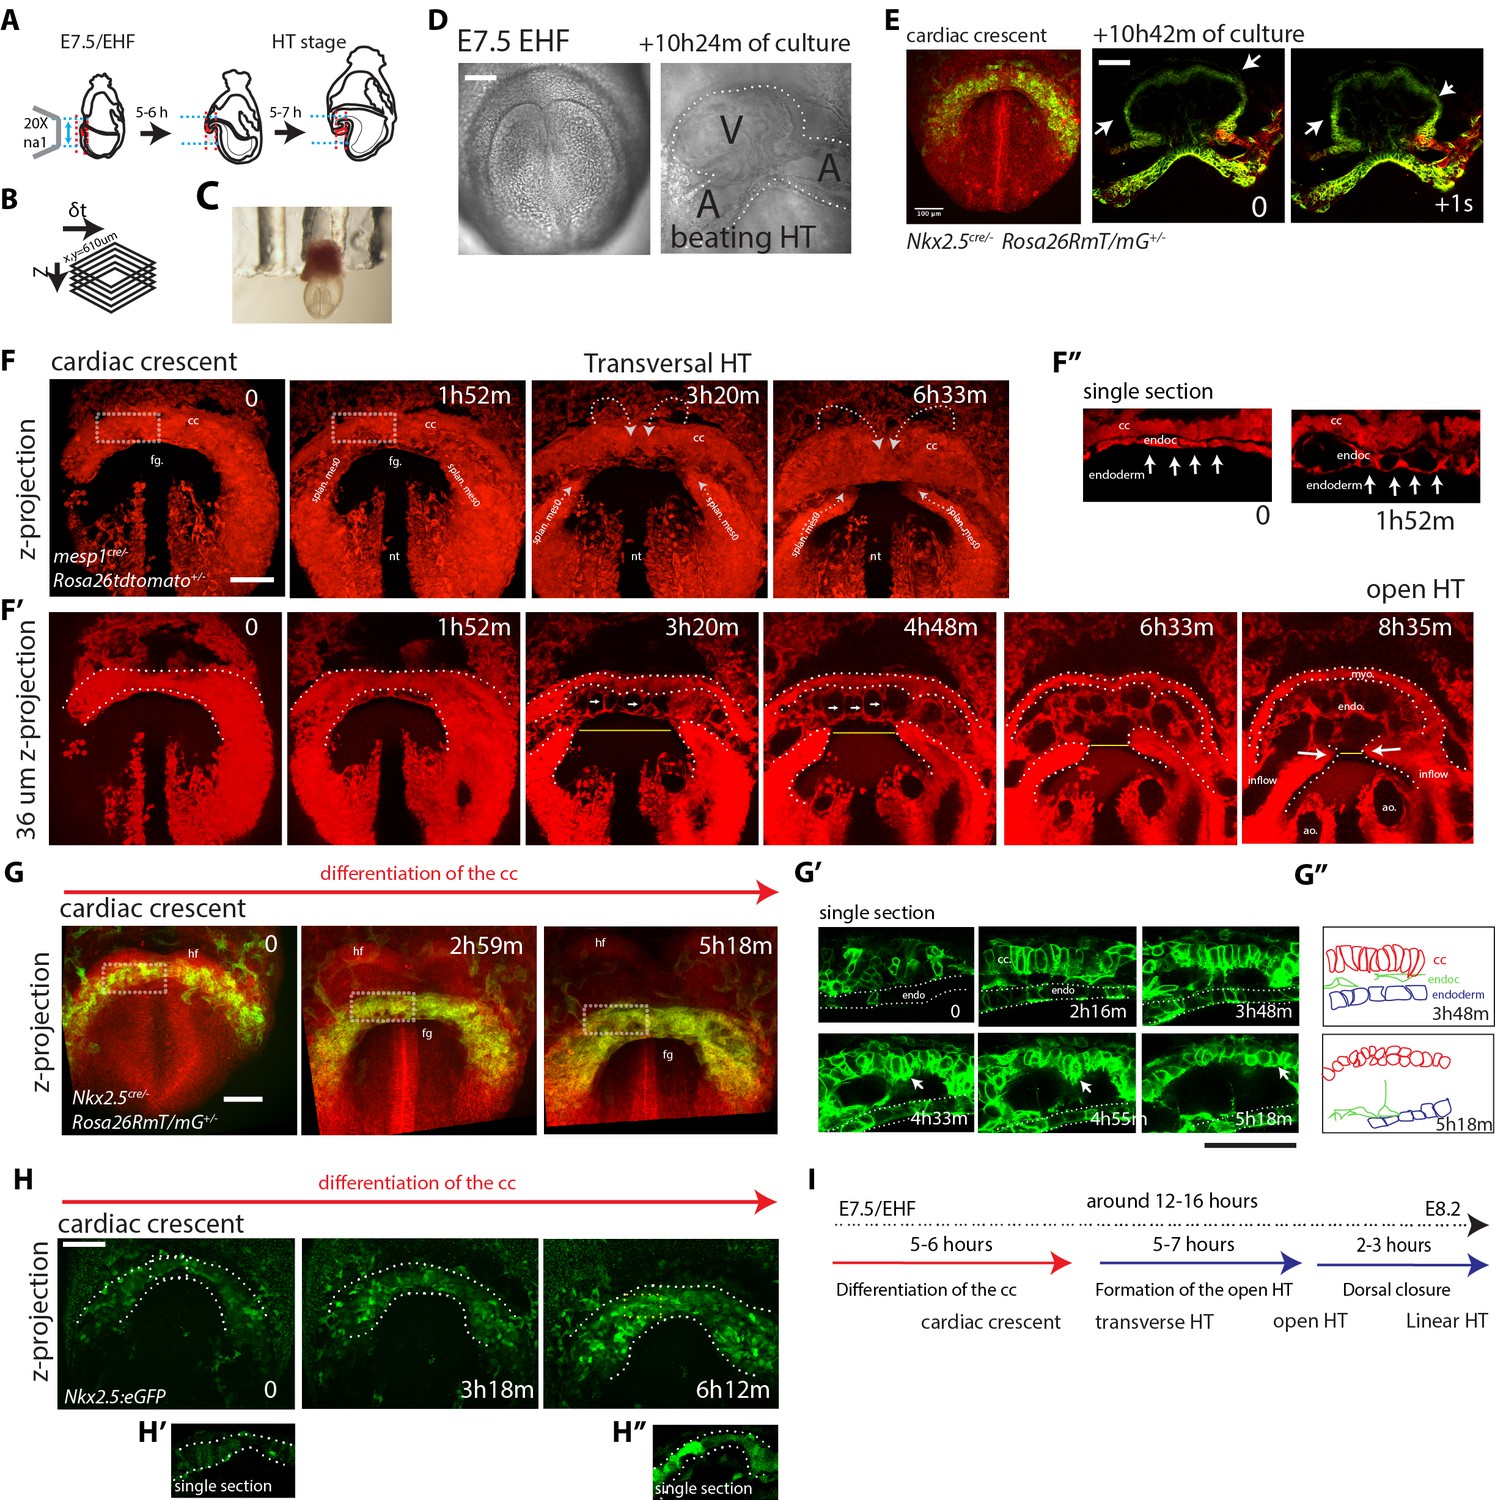
(A) Schematic of the set up for imaging live mouse embryos from EHF up to completion of HT formation. (B) Parameters xyzt during live-imaging. (C) An embryonic holder maintains the embryo still during live-imaging. (D–E) After over 10 hr of ex-vivo culture inside the two-photon chamber, the embryo has grown and the cardiac crescent has transformed into a beating heart tube. Arrows in (E) point to the deformation of the heart ventricle due to heart beats. See also Video 4. (F–F’’) Time-lapse video sequence of a Mesp1cre/+; Rosa26Rtdtomato+/- embryo –reporting anterior mesoderm–, showing the transition from cardiac crescent stage to heart tube stage. Note that at the initial time point, the foregut pocket is already visible. Arrows indicate the major tissue movements visible (folding of the cardiac crescent, medial movement of the splanchnic mesoderm). The differentiation of cardiomyocytes detaching from the endoderm is visible in (F’). White arrows point to the endocardium. The formation of the endocardial lumen in the transversal HT is visible in F’. By 8h35m, the open HT is fully formed and beating regularly. Yellow lines represent distances between the left and right splanchnic mesoderm. Images are z-max projection of 84 sections covering 180 μm (F) and 9 sections covering 36 μm (F’) acquired every 4 μm. See also Videos 5–6. (G–G’’) Time-lapse video of an Nkx2.5cre/+; Rosa26RmT/mG+/- embryo during the early stages of cardiac differentiation. Images are z-max projection of 87 sections acquired every 5 μm covering 437 μm. (G’) shows in a single optical section how progenitors change in cell shape and move away from the endoderm during differentiation toward cardiomyocytes (from inset in (G)). (G’’) Cartoon depicting the change in cell shape taking place during cardiac differentiation. See also Video 7. (H) Time-lapse video sequences of Nkx2.5eGFP embryos from transversal HT showing low GFP level prior to cardiomyocyte differentiation and increase in GFP intensity level during the stages cardiomyocytes undergo differentiation. (H’ and H’’), cardiomyocytes in single magnified optical sections. Images are z-maximum projections of 70 sections acquired every 6 μm covering 420 μm. See also Video 10. (I) Estimate of the timing between different heart tube development stages. fg: foregut cc: cardiac crescent, endoc: endocardium, ao: aorta, endo: endoderm. Scale bars: 100 μm.
-
Figure 4—source data 1
Source data for Figure Figure 4—figure supplement 2.
- https://doi.org/10.7554/eLife.30668.023
Figure 4—figure supplement 1
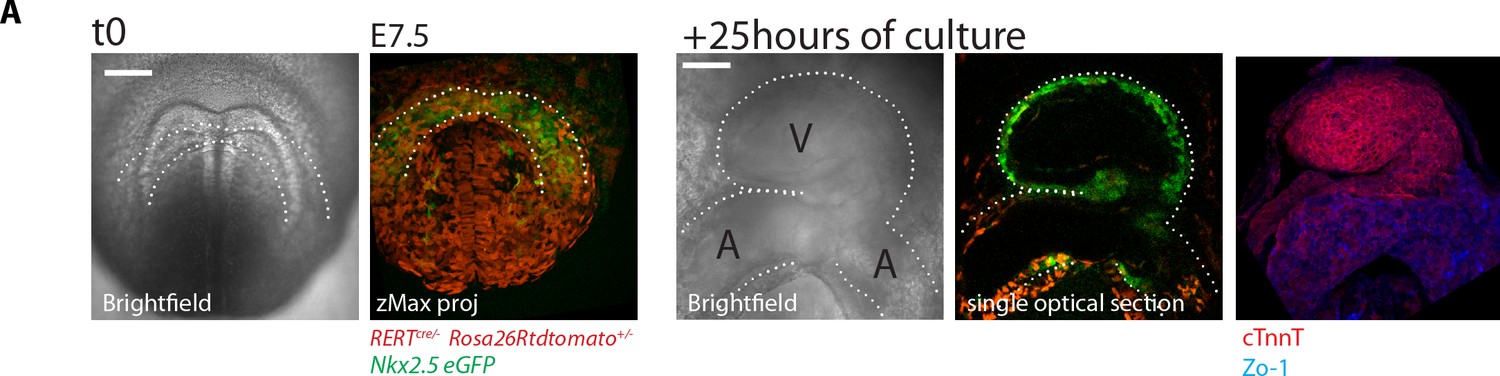
Embryos can be cultured and imaged under the two-photon microscope for up to 24 hr.
(A) Nkx2.5eGFP; RERT+/-; Rosa26Rtdtomato+/- embryo. Starting culture at E7.5, by the end of the 25 hr ex-vivo culture, the HT has formed and looped (experiment repeated three times independently). The embryo was subsequently fixed and immunostained for cTnnT (red) and ZO-1 (blue). V: prospective left ventricle, A: prospective atria. Scale bars: 100 μm.
Figure 4—figure supplement 2
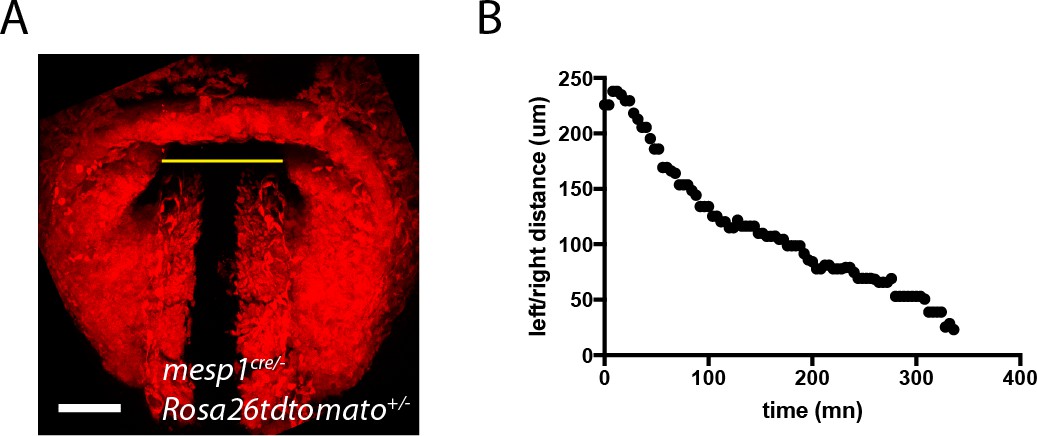
Quantification of the displacement of the splanchnic mesoderm during HT formation.
(A) z-max projection of a Mesp1cre/+; Rosa26Rtdtomato+/- embryo at transversal HT stage. The yellow line indicates the distance between the left and right splanchnic mesoderm. (B) One example of the changes in left/right distance measured over time.
Figure 5 with 3 supplements
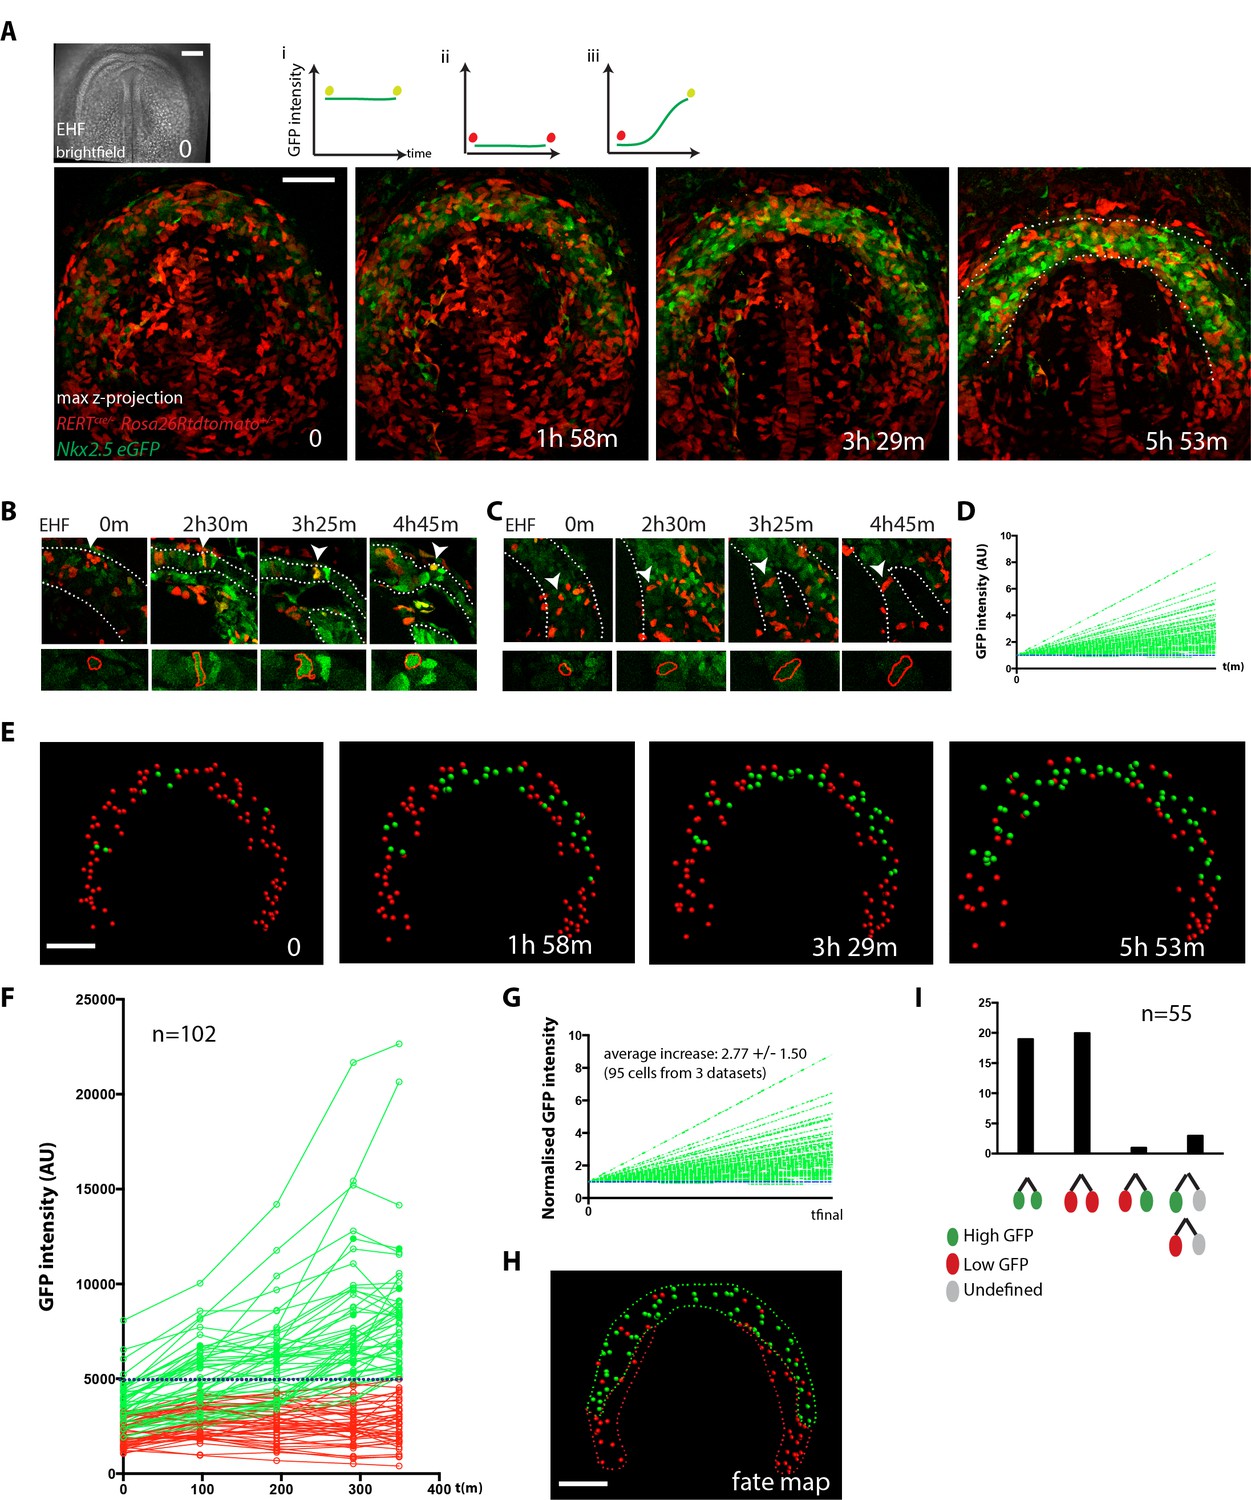
Live-imaging of cardiac differentiation at cellular resolution.
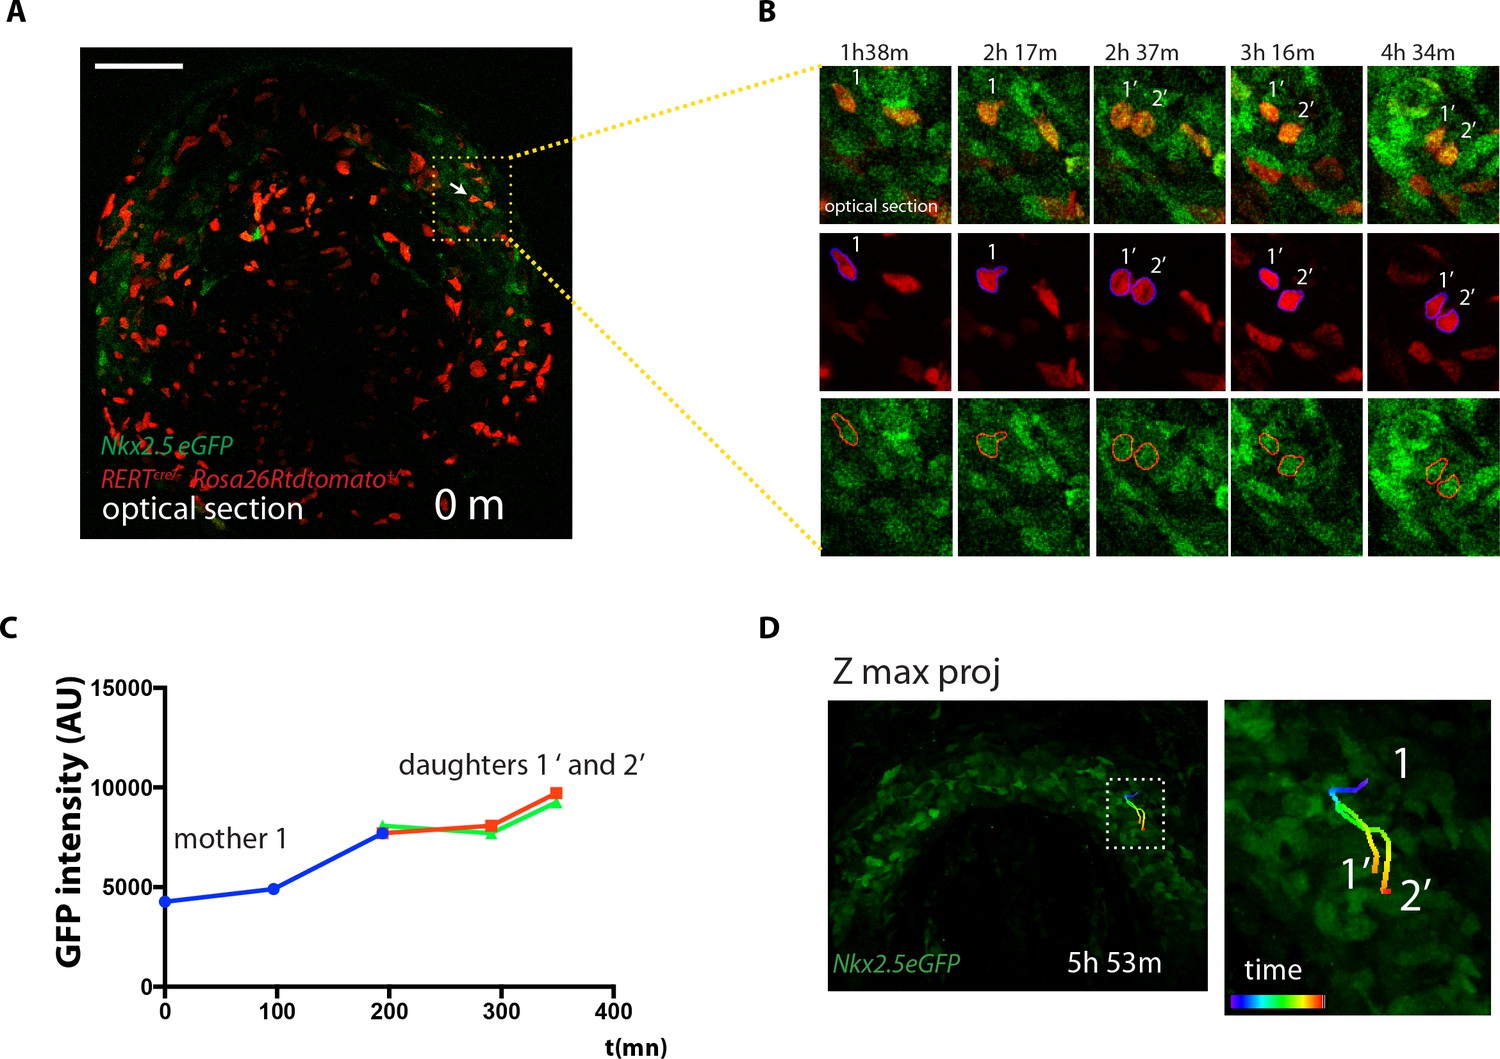
(A) Time course of an Nkx2.5eGFP; RERTcre/+; Rosa26Rtdtomato+/- embryo during stages when cc differentiation takes place -from EHF onwards-. Images are z-maximum projection of 76 sections acquired every 3 μm covering 228 μm. A bright-field image of the EHF embryo at the initial time point is also shown. (i, ii and iii) Rationale of the expected evolution of GFP expression: since tracks carry information on reporter expression, if a cell acquires a high level of GFP, we predict that it is committed to differentiate. See also Video 12. (B–D) Examples of time-lapse videos (B and C) and quantification of the GFP level (D) increasing in a single cell during differentiation (B) or remaining low in a cell located in the splanchnic mesoderm (C). A neural tube cell was additionally quantified (blue). Images are single optical sections. (E) Time course of individual cells tracked in the video shown in A. Cells with GFP levels above the median intensity value of all cells at the end of the recording are represented as green spheres and cells with lower GFP levels are shown as red spheres. (F) GFP level through time. Blue dotted line: median value (5249 a.u.). GFP level for each tracked cell was measured at five successive time points. Cell divisions are not represented for simplicity. (G) Normalized GFP level showing the relative increase in GFP levels for the GFP-positive cells at the end of the recording. Average increase: 2.77 fold ±1.50, mean ±SD, n = 95 cells from three independent videos. (H) The position of cells that differentiate (green) and cells that do not is shown in the cc at the initial time point (EHF stage). (I) The lineage from cardiac precursors share differentiation fate. Lineages of dividing progenitors (n = 55 from three independent videos) were identified during early stages of cardiac differentiation. Two daughter cells are defined as sharing the same fate if their GFP intensity levels do not differ by more than 1.5-fold and/or both show levels above or below the threshold value defined. Scale bars: 100 μm.
-
Figure 5—source data 1
Source data for Figure 5A,D,F,G,I and Figure 5—figure supplement 1C,D.
- https://doi.org/10.7554/eLife.30668.037
Figure 5—figure supplement 1
Live-imaging of Nkx2.5eGFP reporter line.
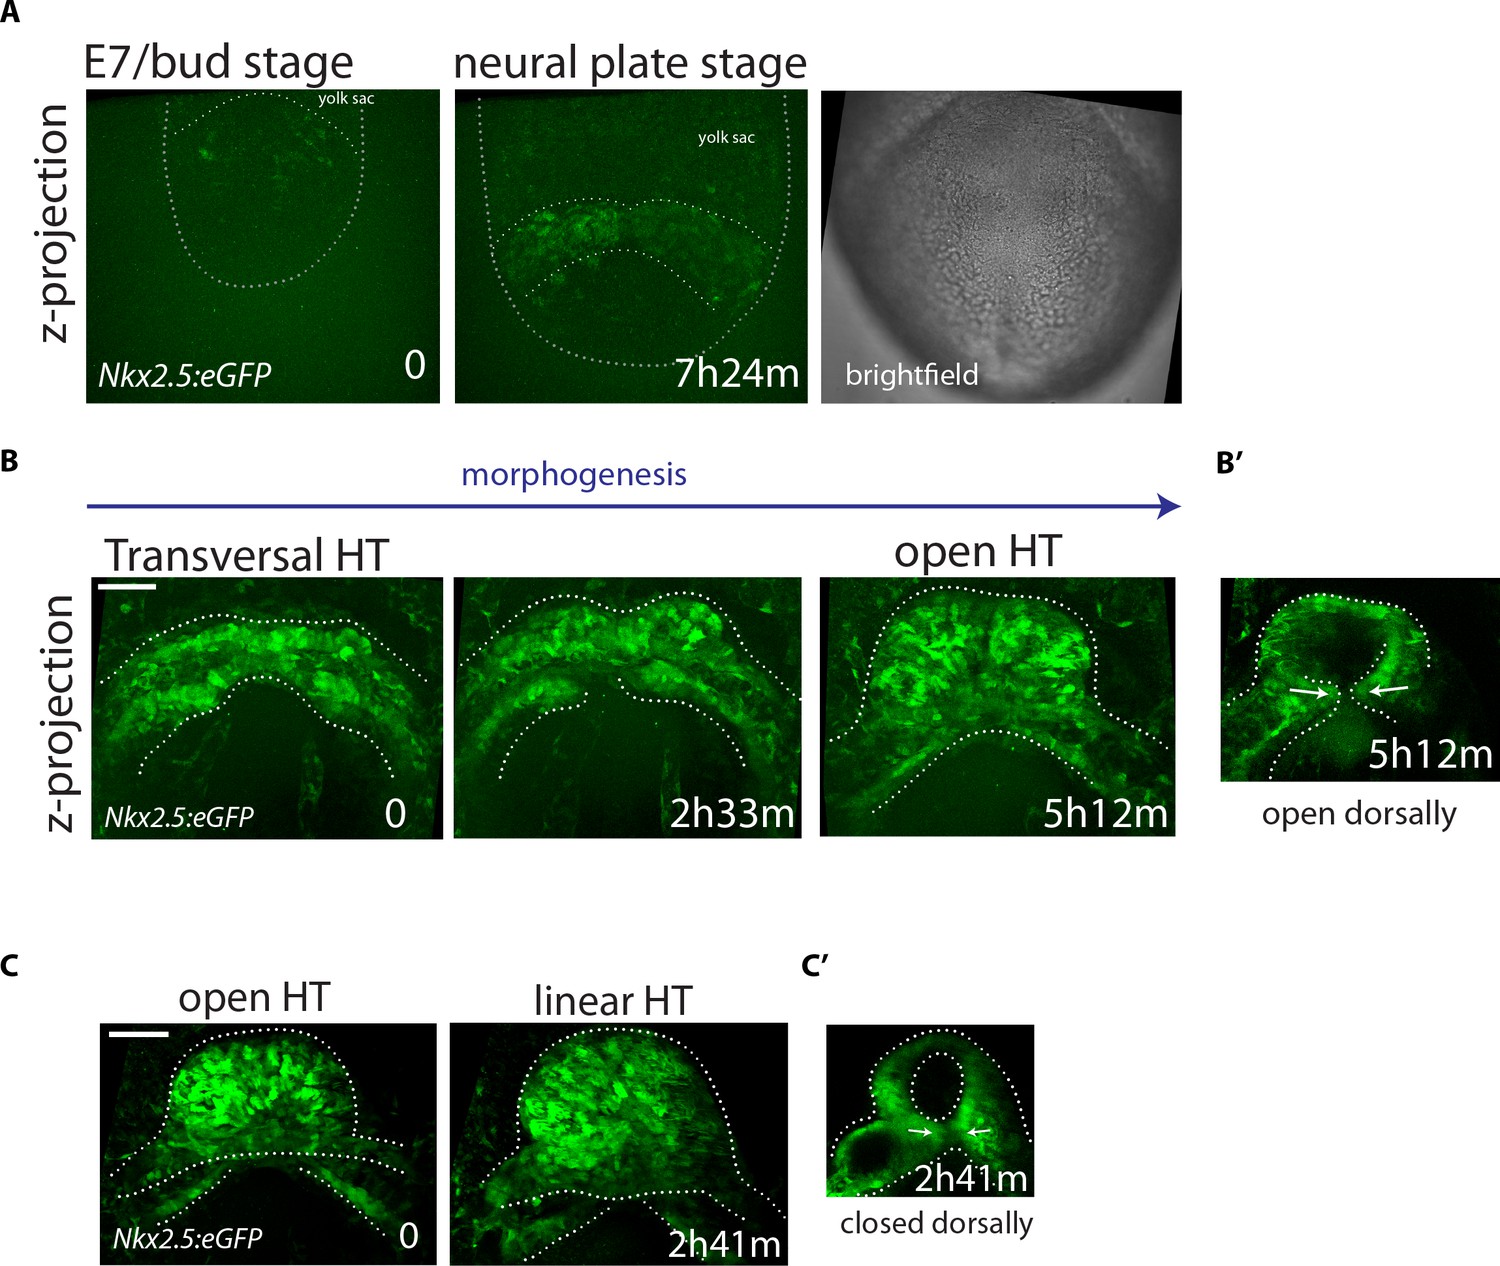
(A–C) Time-lapse video sequences of Nkx2.5eGFP embryos from Early Bud (A), cc (B) and open HT stage (C). Images are z-maximum projections of 75 sections acquired every 4 μm covering 300 μm in (A), 55 sections acquired every 6 μm covering 300 μm in (B) and 59 sections acquired every 5 μm covering 295 μm in (C). (B’ and C’): z-max projection covering 132 μm (B’) and 60 μm (C’) showing the dorsal opening and the dorsal closure of the HT at the end of the videos (representative of 3 embryos). See also Videos 9 and 11. Scale bars: 100 μm.
Figure 5—figure supplement 2
Endocardial cells show an elongated shape.
(A) Single optical section of a tamoxifen-induced Nkx2.5eGFP; RERT+/-; Rosa26Rtdtomato+/- embryo showing a single endocardial labeled cell (white arrow). Scale bars: 100 μm.
Figure 5—figure supplement 3
Cells divide during cardiac differentiation.
(A–C) Time-lapse video of a dividing tdtomato+ cell. Images are single optical sections (same embryo as shown in Figure 4A). The dividing tdtomato+ cell and daughter cells are segmented and mean GFP level is measured. (D) Full 4D track of the dividing cell showing close localization of the progeny in the cardiac crescent. Scale bars: 100 μm.Moorman AF.
Figure 6 with 1 supplement

No cardiac differentiation is detected during early HT morphogenesis.
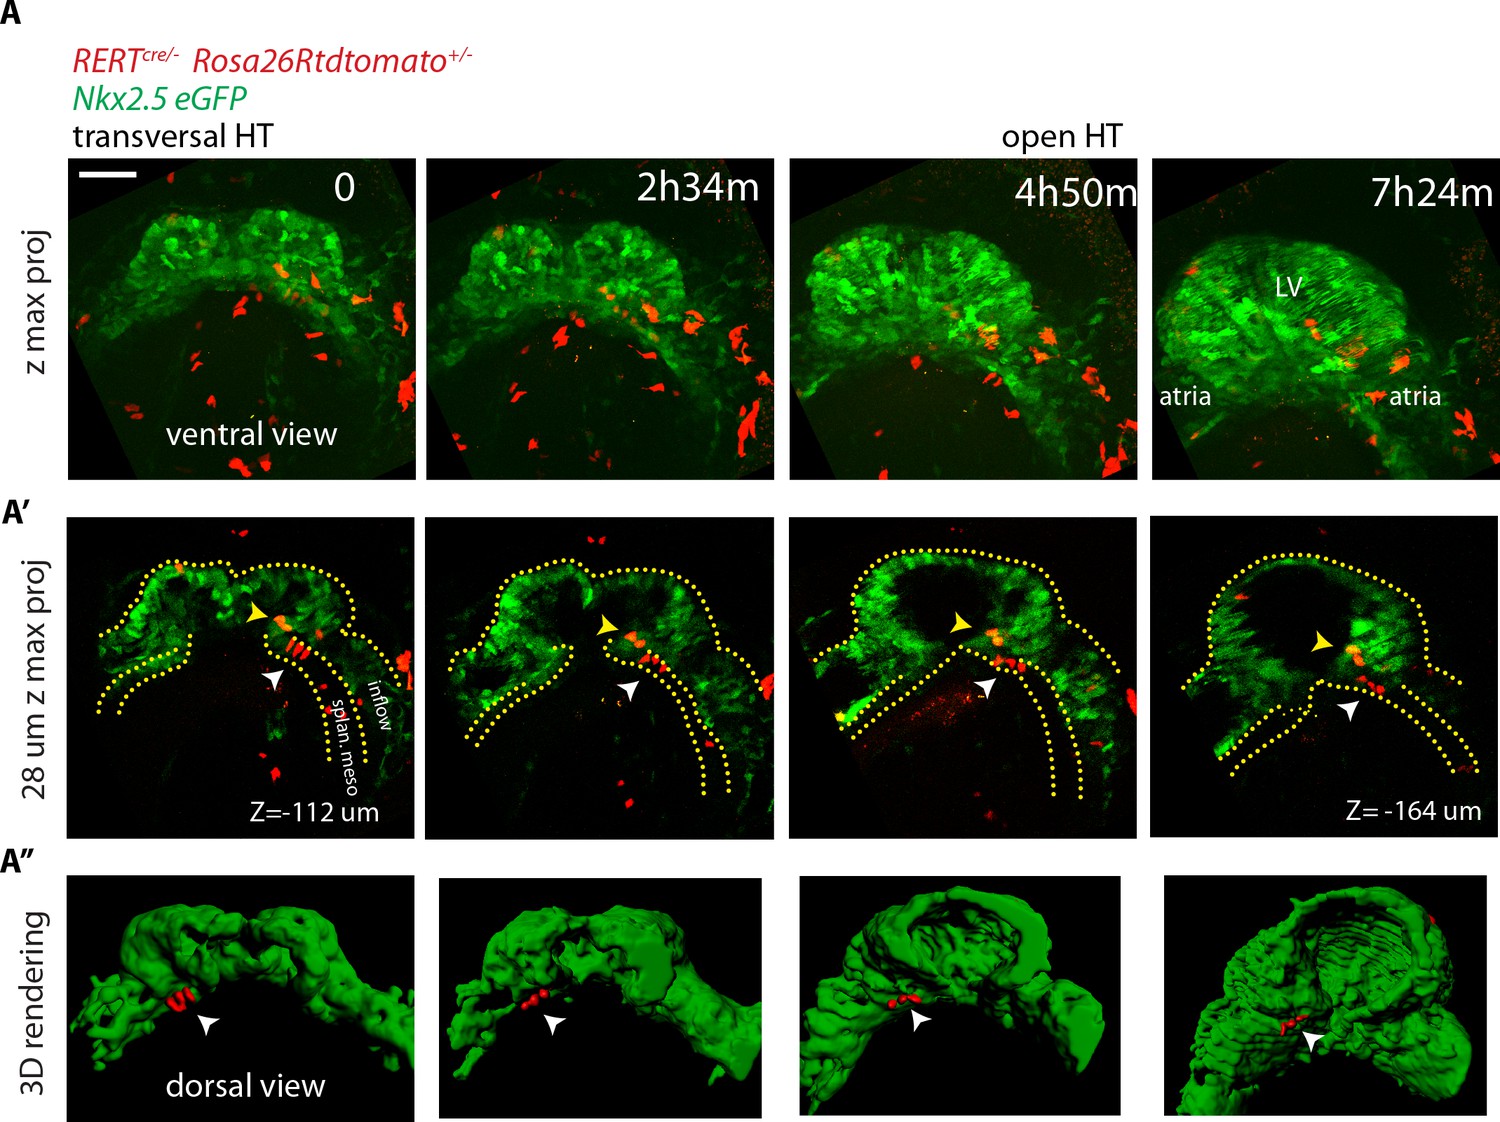
(A–B) Initial and final time points of two time-lapse videos of tamoxifen-induced Nkx2.5eGFP; RERT+/-; Rosa26Rtdtomato+/- embryos covering the transformation of the transversal HT into the open HT. Images are z-maximum projections of 44 sections acquired every 5 μm covering 220 μm in (A) and of 46 sections acquired every 6 μm covering 276 μm in (B). See also Video 13. (C, D) GFP levels over time of the cells tracked in (A, B). GFP level for each tracked cell was measured at four successive time points. Green tracks represent cardiomyocytes with GFP intensity above the median intensity value of all the tracked cells at the last time point, while red tracks represent cells with lower GFP level. Blue dotted line represents the median intensity value (10748 a.u. in (C) and 12248a.u. in (D)). Note that when cells divide, only one of the two daughter cells was represented for simplicity. (E) Distribution of the tracked cells from the time-lapse video shown in (A) at the initial and final times of the tracking period. tdtomato+, GFP- cells are represented by red spheres and tdtomato+, GFP +cells are represented by green spheres. (F) Example of tdtomato+ cardiomyocytes tracked in the beating ventricle. (G) Normalized progression of GFP level in cells classified as GFP+ showing stable GFP levels. Data collected from 125 tracked cells from four independent videos of 2h52m to 3h12m duration. Average increase: 1.1-fold ±0.28, mean ±SD. (H) Magnification extracted from the video in A (yellow inset) of tdtomato+ cells in the boundary zone between the undifferentiated and differentiated cells. (I) Quantification of GFP level through time of the three segmented cells shown in (H). Cells show stable GFP levels and do not differentiate. Images are z-maximum projections of 6 sections acquired every 5 μm covering 30 μm. Scale bars: 100 μm.
-
Figure 6—source data 1
Source data for Figure 6A,B,C,D,G,I, Figure 6—figure supplement 1A, Figure 6—figure supplement 1B and C.
- https://doi.org/10.7554/eLife.30668.041
Figure 6—figure supplement 1

Longer videos can capture both initial cardiac differentiation in the FHF and early HT morphogenesis.
(A) Initial and final images from a time-lapse video of a tamoxifen-induced RERT+/-; Rosa26Rtdtomato+/-; Nkx2.5eGFP embryo. Images are z-maximum projection of 44 sections acquired every 5 μm covering 220 μm. (B) GFP levels over time of the cells tracked in (A). GFP level for each tracked cell was measured at five successive time points. Green tracks represent cells with GFP intensity above the median intensity value of all the tracked cells at the last time point, while red tracks represent cells that maintain lower GFP levels. The blue dotted line represents the median intensity value. (C) Mean intensity value for all the green and red tracks and SD. Note that on average the GFP intensity of the green tracks becomes stable from around the transversal HT stage (around t = 300 m). Scale bars: 100 μm.
Figure 7
No cardiac differentiation is detected during early HT morphogenesis.
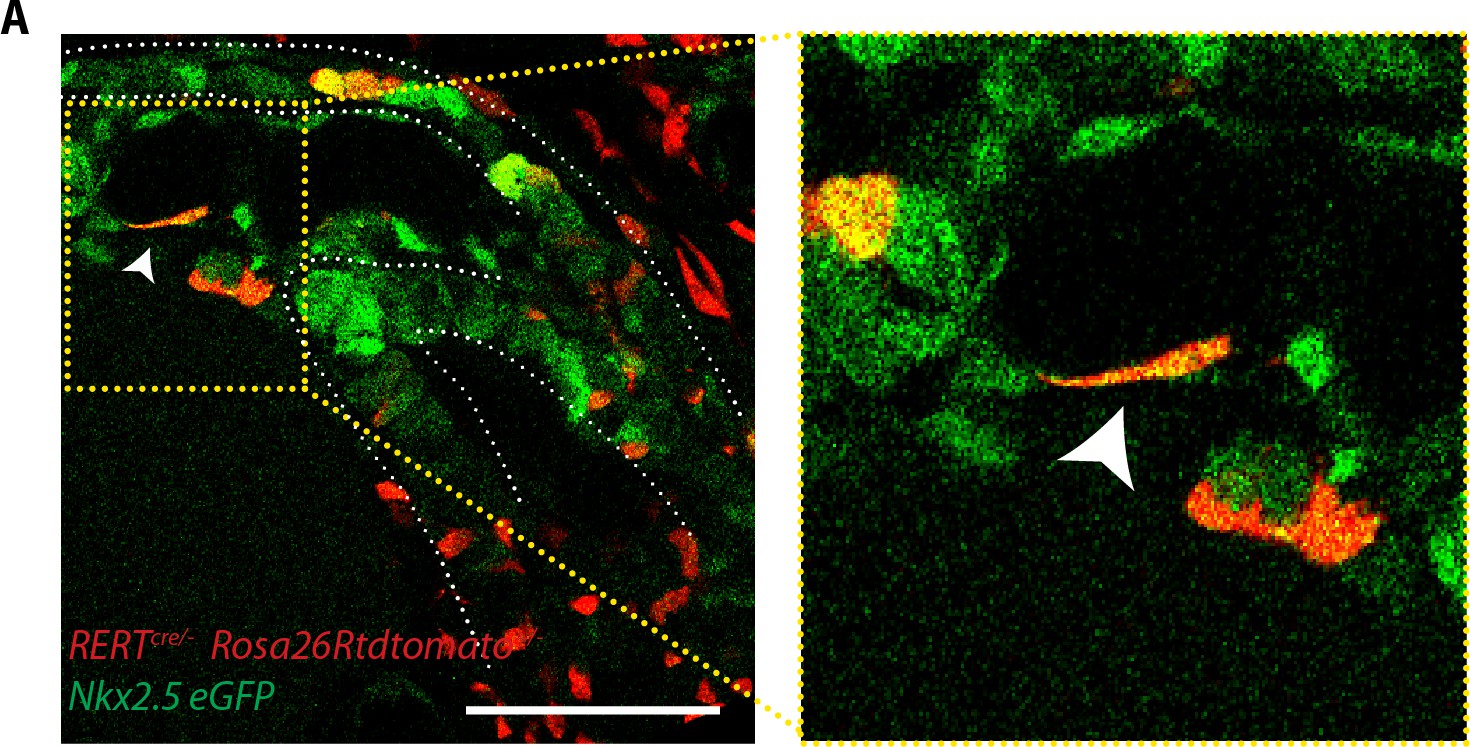
(A–A’’) Images from time-lapse Video 15 of a tamoxifen-induced RERT+/-; Rosa26Rtdtomato+/-; Nkx2.5eGFP embryo during the stages at which the transversal HT transforms into an open HT, showing cells located in the splanchnic mesoderm (white arrows in A’ and A’’), respecting the boundary with the HT (yellow arrows in J’ show two cells located in the HT). Lower doses of tamoxifen were injected in order to label only a very small proportion of cells in red. Images are z-maximum projection of 74 sections (A), acquired every 4 μm covering 296 μm and (A’) 7 sections covering 28 μm. (A’’) 3D reconstruction based of the Nkx2.5eGFP signal (green) and tdtomato +cells located in the splanchnic mesoderm. See also Video 14. Scale bars: 100 μm. Splan. meso: splanchnic mesoderm.
Figure 8 with 2 supplements
SHF Isl1-expressing cells do not contribute to the early open-heart tube.
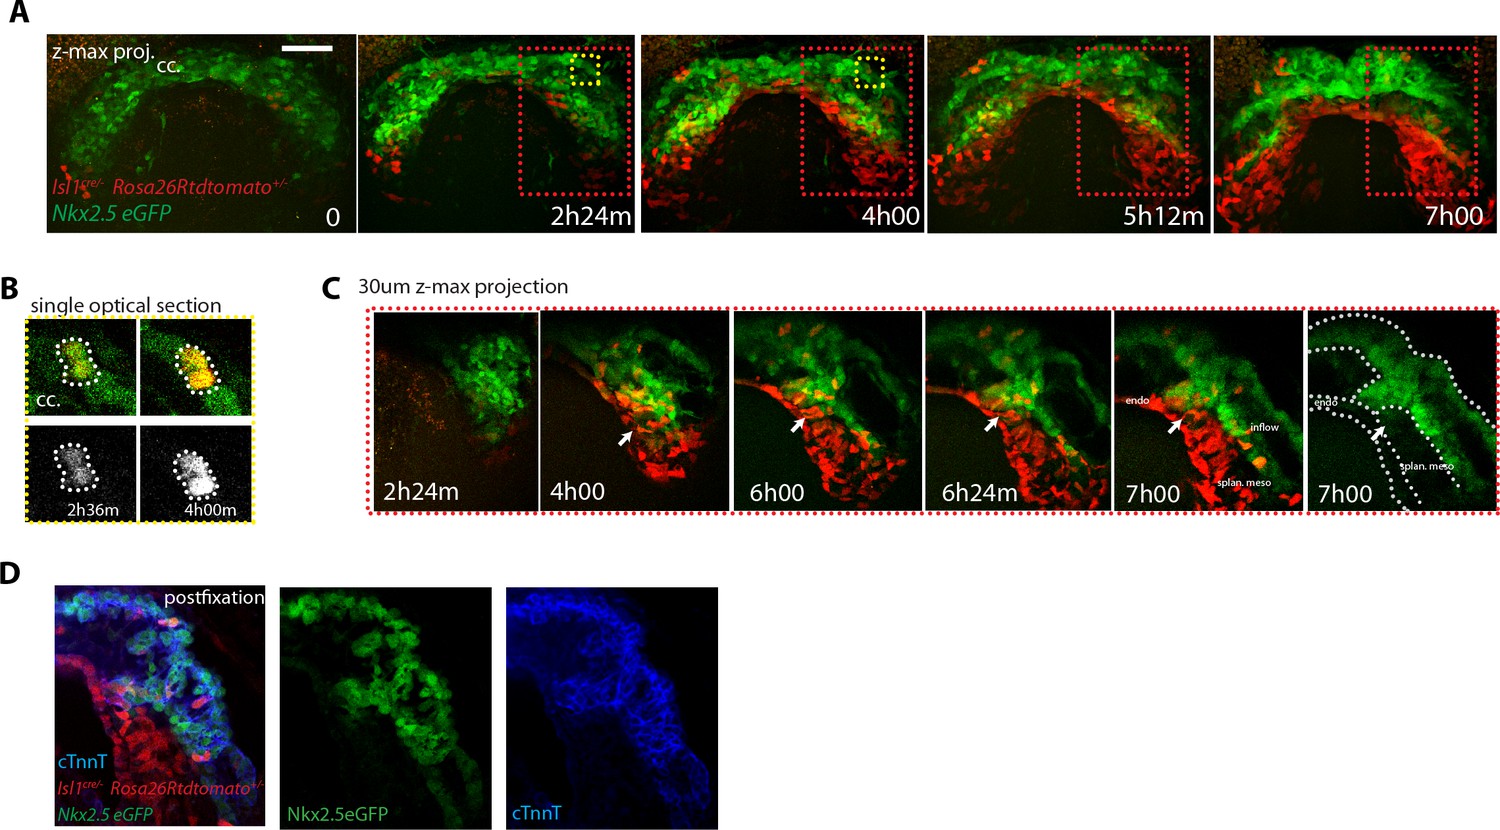
(A) Image sequence from time-lapse Video 16 of an Isl1cre/+; Rosa26Rtdtomato+/-; Nkx2.5eGFP embryo showing that recombination driven by Islet1cre of the Rosa26 locus is complete in the splanchnic mesoderm and scarce in the FHF (n = 3 videos from cc up to open HT stage). (B) Inset from A (yellow frame). Two cells of the Isl1+ lineage located in the cc increase their tdtomato level over time. (C) Inset from A (Red frame); increase of the tdtomato intensity in the splanchnic mesoderm over time. Arrow shows the boundary between SHF and FHF and points to a single cell in the SHF that retains a low level of GFP and a columnar shape. Note that tdtomato signal is also detectable in the endoderm. Images are z-maximum projection of 45 sections acquired every 5 μm and covering 225 μm in (A) and of 6 sections covering 30 μm in (C). (D) Same embryo as in (A) post-fixed and immunostained against cTnnT after live-imaging, showing that the red cells located in the splanchnic mesoderm are undifferentiated. Scale bars: 100 μm.
-
Figure 8—source data 1
Source data for Figure 8—figure supplement 2C.
- https://doi.org/10.7554/eLife.30668.048
Figure 8—figure supplement 1
GFP level in deeper z levels cannot be accurately quantified.
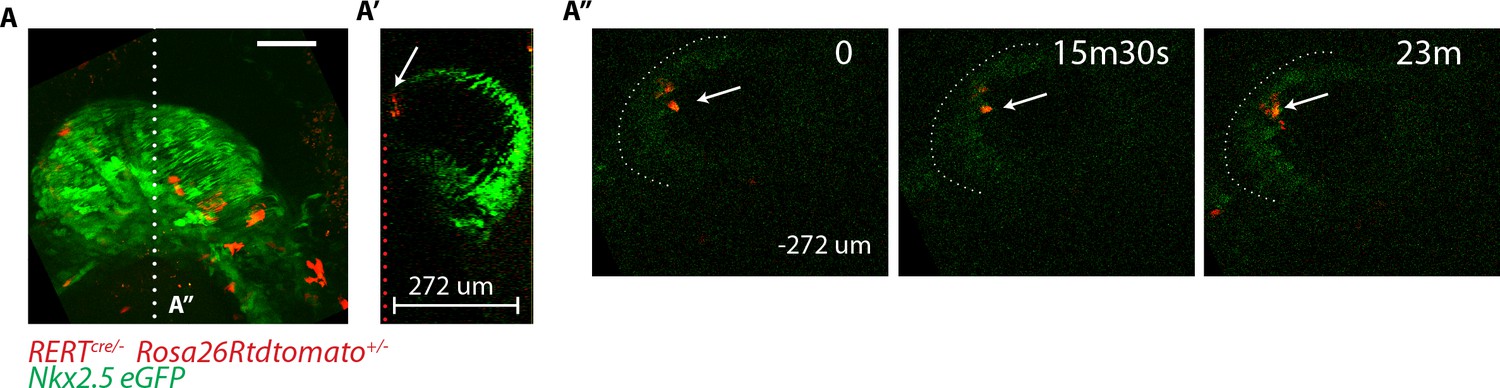
(A–A’’) RERT+/-; Rosa26Rtdtomato+/-; Nkx2.5eGFP embryo at transversal HT stage. (A) z-maximum projection of 74 sections acquired every 4 μm and covering 296 μm. Same embryo as in Figure 6A. (A’) Single optical z-section positioned at the white dotted line shown in (A). This z-section shows the green signal decay at deep z positions (z = 0 to −274 μm). (A’’) An xy frame corresponding to a −272 µm z-position (indicated by the red dotted line in (A’) at different time points during the video. The white arrow indicates td-tomato+ cells.
Figure 8—figure supplement 2
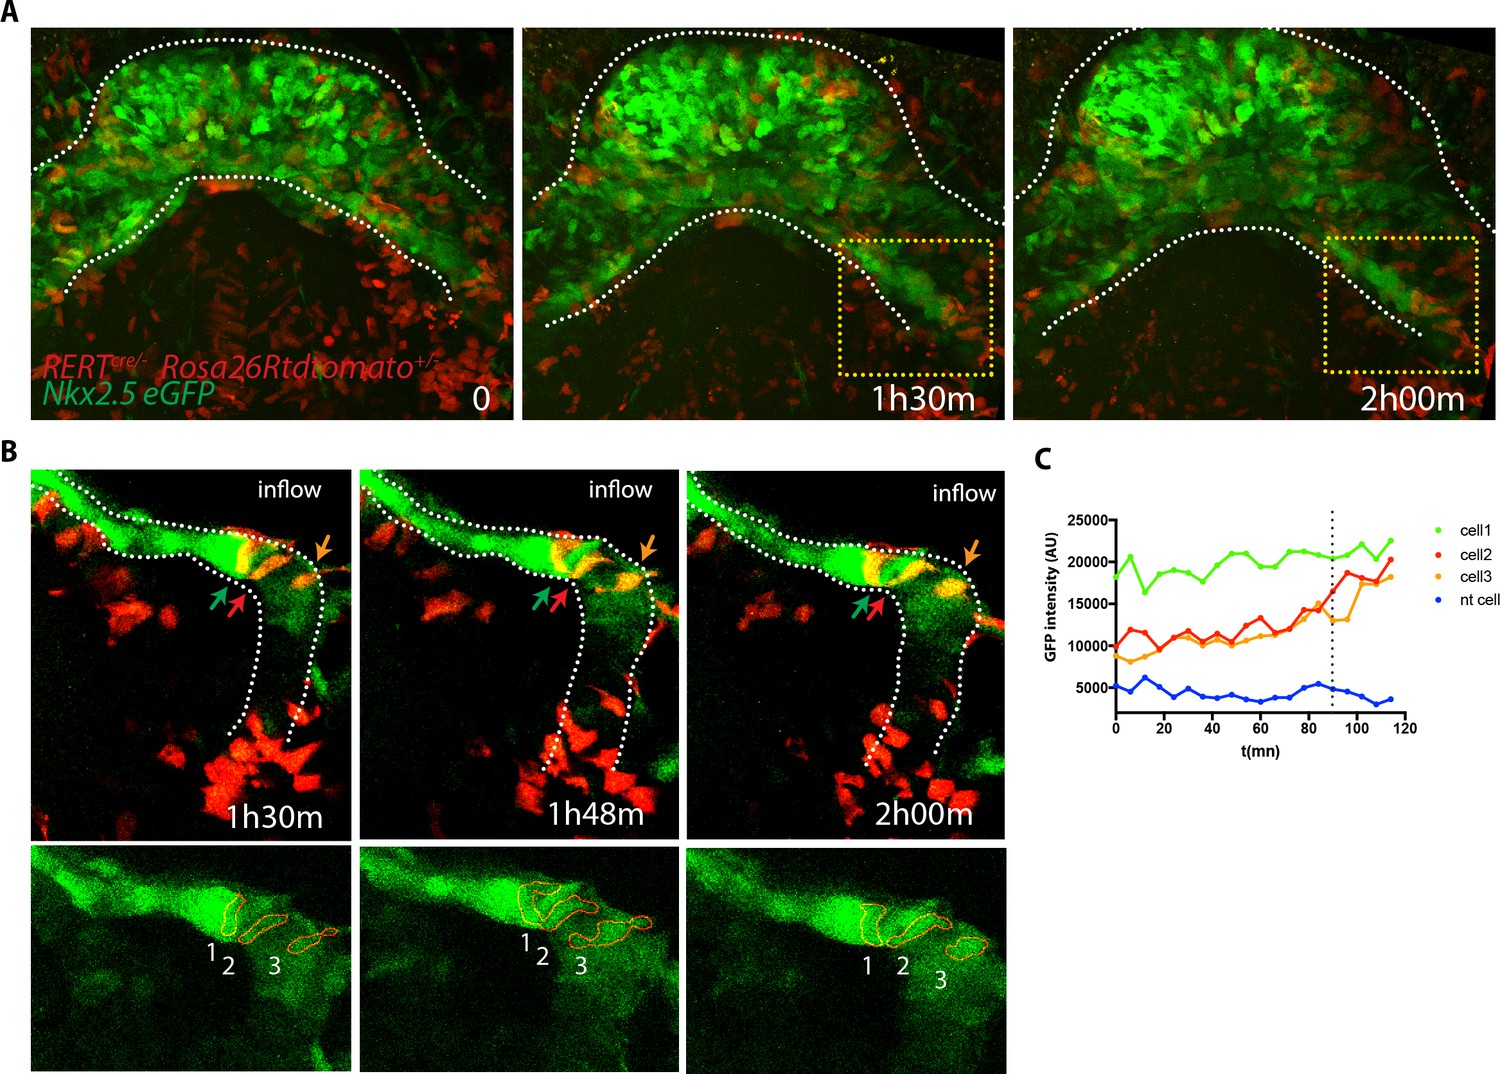
Cells increasing their GPF expression can be detected at the venous pole during activation of SHF contribution to the HT.
(A) Time course of a tamoxifen-induced RERT+/-; Rosa26Rtdtomato+/-; Nkx2.5eGFP embryo during linear HT formation. Images are z-maximum projection of 44 sections acquired every 5 μm covering 220 μm. (B) Time course of individual cells tracked within the yellow-framed region in video (A). (C) GFP levels over time of the cells tracked in (B) Cell 1 shows high GFP level throughout the video while cell 2 and 3 increase their GFP level over time. The blue line represents a neural tube cell. The dotted line marks the 1h30m time point. Scale bars100μm.
Figure 9
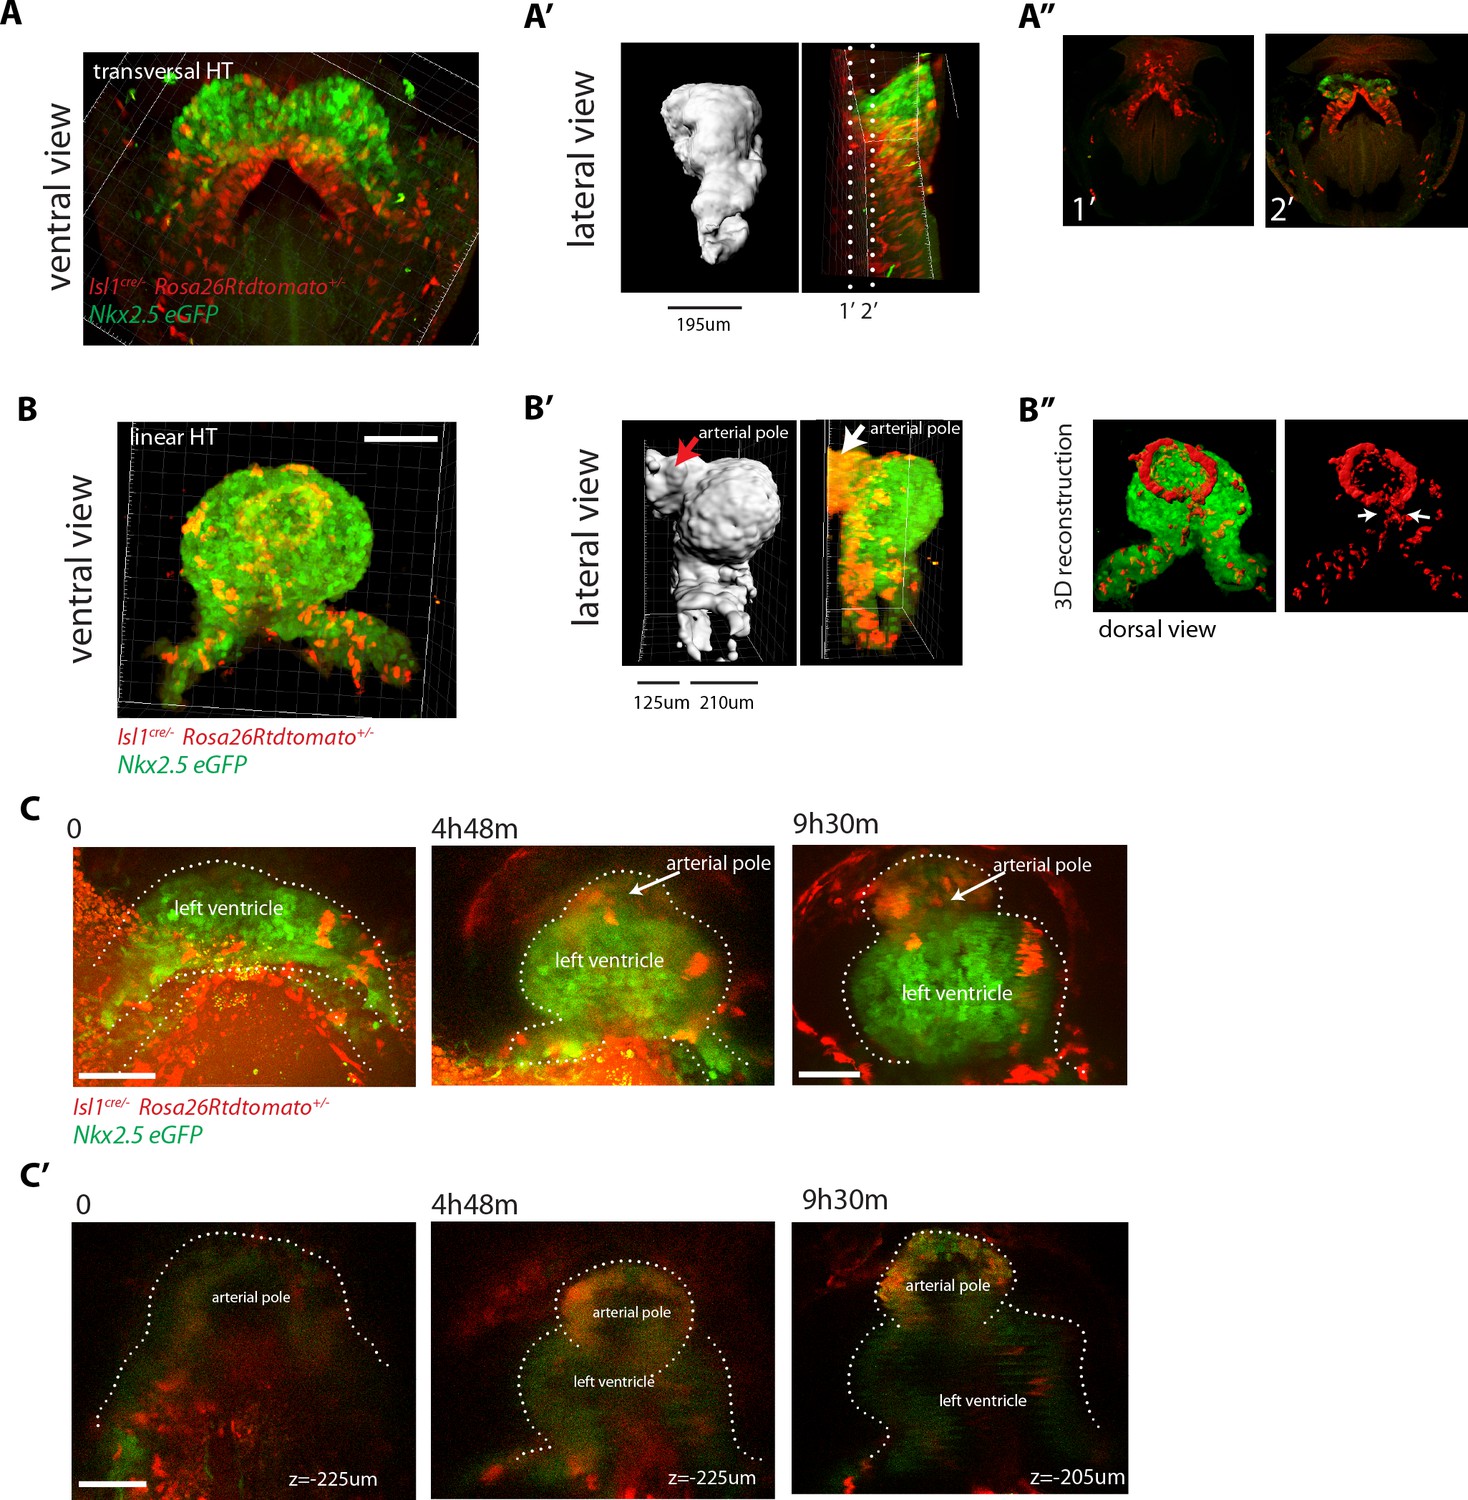
SHF Isl1-expressing cells contribute to the arterial pole during late linear HT morphogenesis.
(A, B) Isl1cre/+; Rosa26Rtdtomato+/-; Nkx2.5eGFP embryos showing no contribution of the Isl1 lineage to the transversal HT (A–A’’) but contributing robustly to the arterial pole and dorsal aspect of the linear HT (B– B’’). The presence of double-positive cells in these areas reveals the differentiation of Isl1 lineage cells into cardiomyocytes (A, B). Images are 74 and 134 optical sections acquired every 2.5 μm and covering 195 μm and 335 μm, respectively. In (B, B’) only the double-positive cells located in the linear HT are shown, while the tdtomato+ progenitors, located outside the linear HT are not shown. Lateral views are shown in (A’, B’) including 3D reconstructions. (A’’) Cross-sections in xy along the dotted lines shown in (A’). Dorsal views are shown in (B’’) including the 3D reconstruction of the tdtomato+ cells located in the linear HT. White arrows show the dorsal (mesocardial) regions of the linear HT. (C) Snapshots of an Ils1cre/+; Rosa26Rtdtomato+/-; Nkx2.5eGFP embryo at different time points during the third phase showing that the tdtomato+ SHF cells contribute to the arterial pole of the HT. Images are 52 optical sections acquired every 5 μm and covering 260 μm. The embryo was imaged continuously every 13 m for the first 6 hr of culture and then imaged once again at time point 9h30m. Note that at the last time point, the laser was increased at maximum power in order to reveal more clearly the red labeled cells at the arterial pole. The contrast had to be enhanced as well. (C’) Images at time points 0, 4h48m and 9h30m. Images at time points 0 and 4h48m are z-maximum projection of 5 sections covering 25 μm. Image at 9h30m is a single optical section. at: arterial pole. endo: endoderm, splan meso: splanchnic mesoderm. Scale bars: 100 μm.
Figure 10
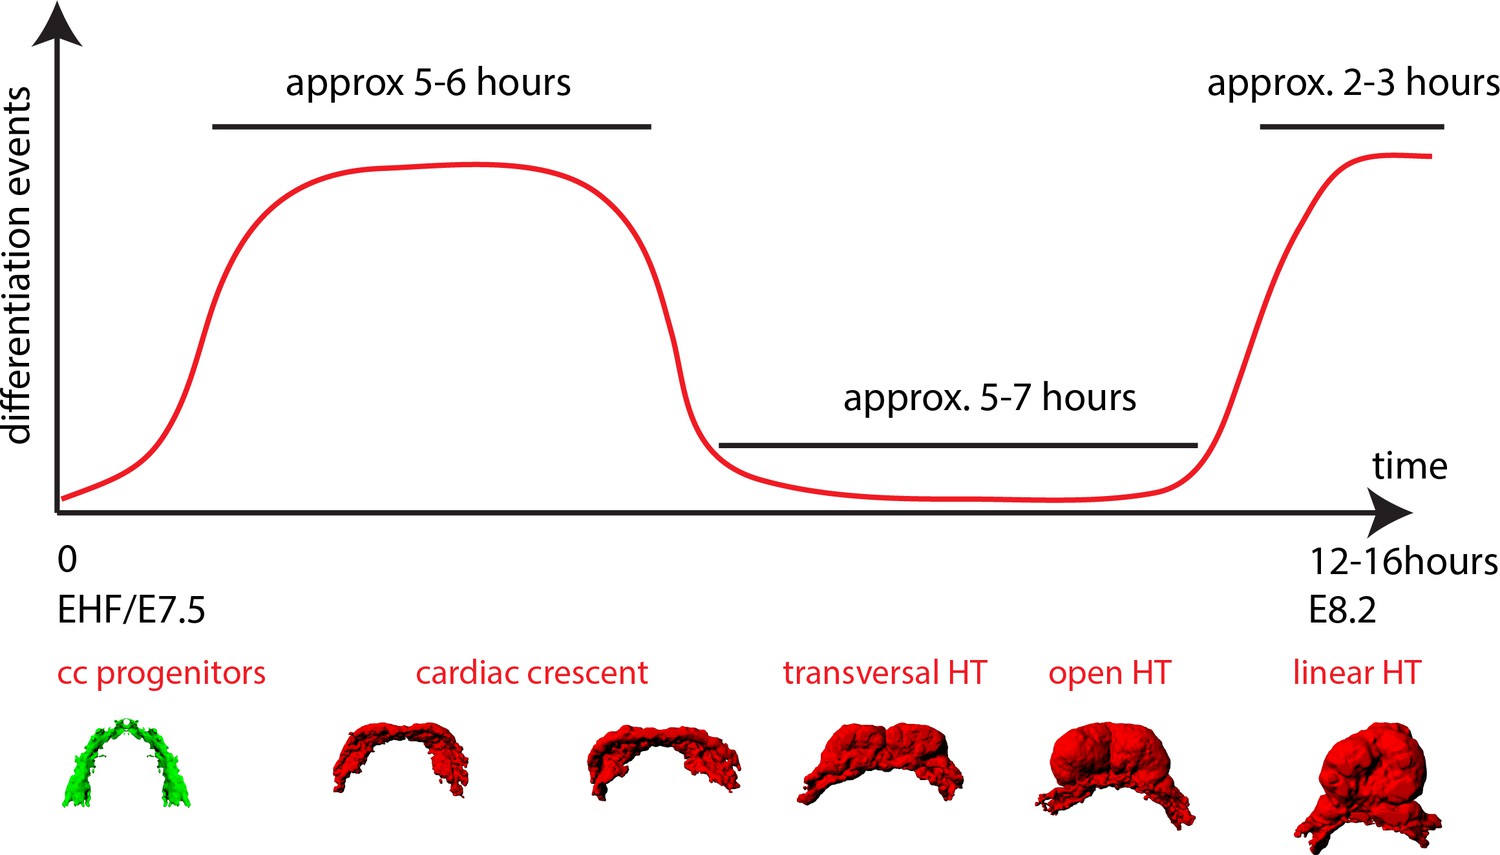
A model of cardiomyocyte differentiation dynamics during early heart development.
We propose that two distinct phases of cardiomyocyte differentiation take place during early heart development. At EHF stage the cc differentiates and starts folding. Cardiomyocytes round up and become contractile while the cardiac progenitors located in the splanchnic mesoderm remain undifferentiated. Subsequently, the cc. undergoes further morphogenesis to transform into a HT, initially open dorsally and no cardiomyocyte differentiation is detected during this transformation. Finally, cardiac differentiation resumes contributing new cardiomyocytes from the splanchnic mesoderm to the arterial pole (prospective RV) and the dorsal closure of the HT.
Videos
Video 1
3D reconstruction of the cardiac crescent at EHF stage, based on Nkx2.5cre/+Rosa26Rtdtomato+/- signal.
Related to Figure 1A.
Video 2
3D reconstruction of Mouse HT formation, based on embryos immunostained for cTnnT.
Five representative stages are represented. Related to Figure 1C–G.
Video 3
3D reconstruction of the FHF (green) and SHF (red).
Based on Nkx2.5cre/+Rosa26Rtdtomato+/- embryos immunostained for cTnnT. The border between cTnnT-negative and cTnnT-positive cells can be visualized at the interface between the red and green domains. Related to Figure 2B.
Video 4
z-maximum projection of an Nkx2.5cre/+; Rosa26RmT/mG+/- embryo at cc stage and single-section time-lapse video of the same embryo after 10 hr 42 m of ex-vivo culture (representative analysis from three embryos).
Interval between frames: 1 s. Related to Figure 4E.
Video 5
Time-lapse video of a Mesp1cre/+; Rosa26Rtdtomato+/- embryo from cc up to open HT stage (h:mm:ss) (representative analysis from four embryos).
Interval between frames: 4 m 30 s. Duration of the video: 13 hr 16 m 30 s. Related to Figure 4F.
Video 6
Same embryo as in Video 5.
Images are z-maximum projection of nine sections acquired every 4 μm covering 36 μm (h:mm:ss) and allows visualization of the inside of the cardiac lumen during HT formation. Interval between frames: 4 m 30 s. Duration of the video: 8 hr 10 m. Related to Figure 4F’.
Video 7
Time-lapse video of an Nkx2.5cre/+; Rosa26RmT/mG+/- embryo (h:mm:ss) (representative analysis from two embryos).
Interval between frames: 22 m. Duration of the video: 4 hr 02 m. Related to Figure 4G–G’.
Video 8
Brightfield time-lapse video of a wild type embryo, from cc stage showing the onset of cardiomyocyte contractility and the formation of the cardiac lumen (h:mm:ss) (representative analysis from two embryos).
Interval between frames: 1 m 03 s. Duration of the video: 6 hr 04 m 21 s. Representative analysis from two embryos.
Video 9
Same embryo shown in Video 14 zoomed-in at the level of the splanchnic mesoderm (mm:ss).
SHF cells (green arrows) displace antero-medially relative to the underlying endoderm (red arrow). In addition, SHF cells move apart from each other (distance between the green arrows increase from 61 to 83 μm over 3h12m). Related to Figure 6H.
Video 10
Time-lapse video sequences of Nkx2.5eGFP embryos from Early Bud/E7.5 stage (h:mm:ss).
(representative analysis from two embryos). Interval between frames: 12 m. Duration of the video: 7 hr 24 m Related to Figure 5—figure supplement 1A.
Video 11
Time-lapse video sequences of Nkx2.5eGFP embryos from cc to transversal HT stage (h:mm:ss).
(representative analysis from three embryos). Interval between frames: 24 m. Duration of the video: 6 hr 48 m. Related to Figure 4H.
Video 12
Time-lapse video sequences of Nkx2.5eGFP embryos from transversal HT to open HT stage (h:mm:ss) (representative analysis from three embryos).
Interval between frames: 8 m 09 s. Duration of the video: 5 hr 01 m 33 s. Related to Figure 5—figure supplement 1B.
Video 13
Cell tracks in 3D+t during stages when cc differentiation takes place -from EHF onwards- (h:mm:ss).
Cells are represented as green spheres if considered GFP+ at the end of the time-lapse analysis and as red spheres when considered GFP-(representative analysis from three embryos). Interval between frames: 19 m 18 s Duration of the video: 5 hr 28 m 06 s. Related to Figure 5A.
Video 14
Cell tracks in 3D+t during stages the open HT forms.
Cells are represented as green spheres if considered GFP+ at the end of the time-lapse analysis and as red spheres when considered GFP-(Representative analysis from three embryos). Interval between frames: 7 m 40 s. Duration of the video: 3 hr 12 m. Related to Figure 6A.
Video 15
Time-lapse video of a RERT+/-; Rosa26Rtdtomato+/-; Nkx2.5eGFP embryo during the stages at which the transversal HT transforms into the open HT (h:mm:ss).
Interval between frames: 19 m 19 s. Duration of the video: 7 hr 24 m 35 s. (2nd half) 3D reconstruction at three time points based of the eGFP signal (green) and red-labeled cells located in the splanchnic mesoderm. Related to Figure 7A.
Video 16
Time-lapse video of an Isl1cre/+; Rosa26Rtdtomato+/-; Nkx2.5eGFP embryo (h:mm:ss) (representative analysis from three embryos).
Interval between frames: 6 m. Duration of the video: 7 hr 18 m. Related to Figure 8A.
Video 17
Same embryo shown in Video 16 zoomed-in at the level of the splanchnic mesoderm (h:mm:ss).
Related to Figure 8C.
Video 18
3D rendering of an Isl1cre/+;Rosa26Rtdtomato+/-; Nkx2.5eGFP embryo at transversal HT stage.
Related to Figure 9A.
Video 19
3D rendering of an Isl1cre/+;Rosa26Rtdtomato+/-; Nkx2.5eGFP embryo at linear HT stage.
Related to Figure 9B.
Additional files
-
Transparent reporting form
- https://doi.org/10.7554/eLife.30668.055
Download links
A two-part list of links to download the article, or parts of the article, in various formats.
Downloads (link to download the article as PDF)
Open citations (links to open the citations from this article in various online reference manager services)
Cite this article (links to download the citations from this article in formats compatible with various reference manager tools)
Live imaging of heart tube development in mouse reveals alternating phases of cardiac differentiation and morphogenesis
eLife 6:e30668.
https://doi.org/10.7554/eLife.30668


