Cryo-EM structure of the bifunctional secretin complex of Thermus thermophilus
- Max Planck Institute of Biophysics, Germany
- Institute of Molecular Biosciences, Goethe University Frankfurt, Germany
- Goethe University Frankfurt, Germany
Figures
Figure 1 with 1 supplement
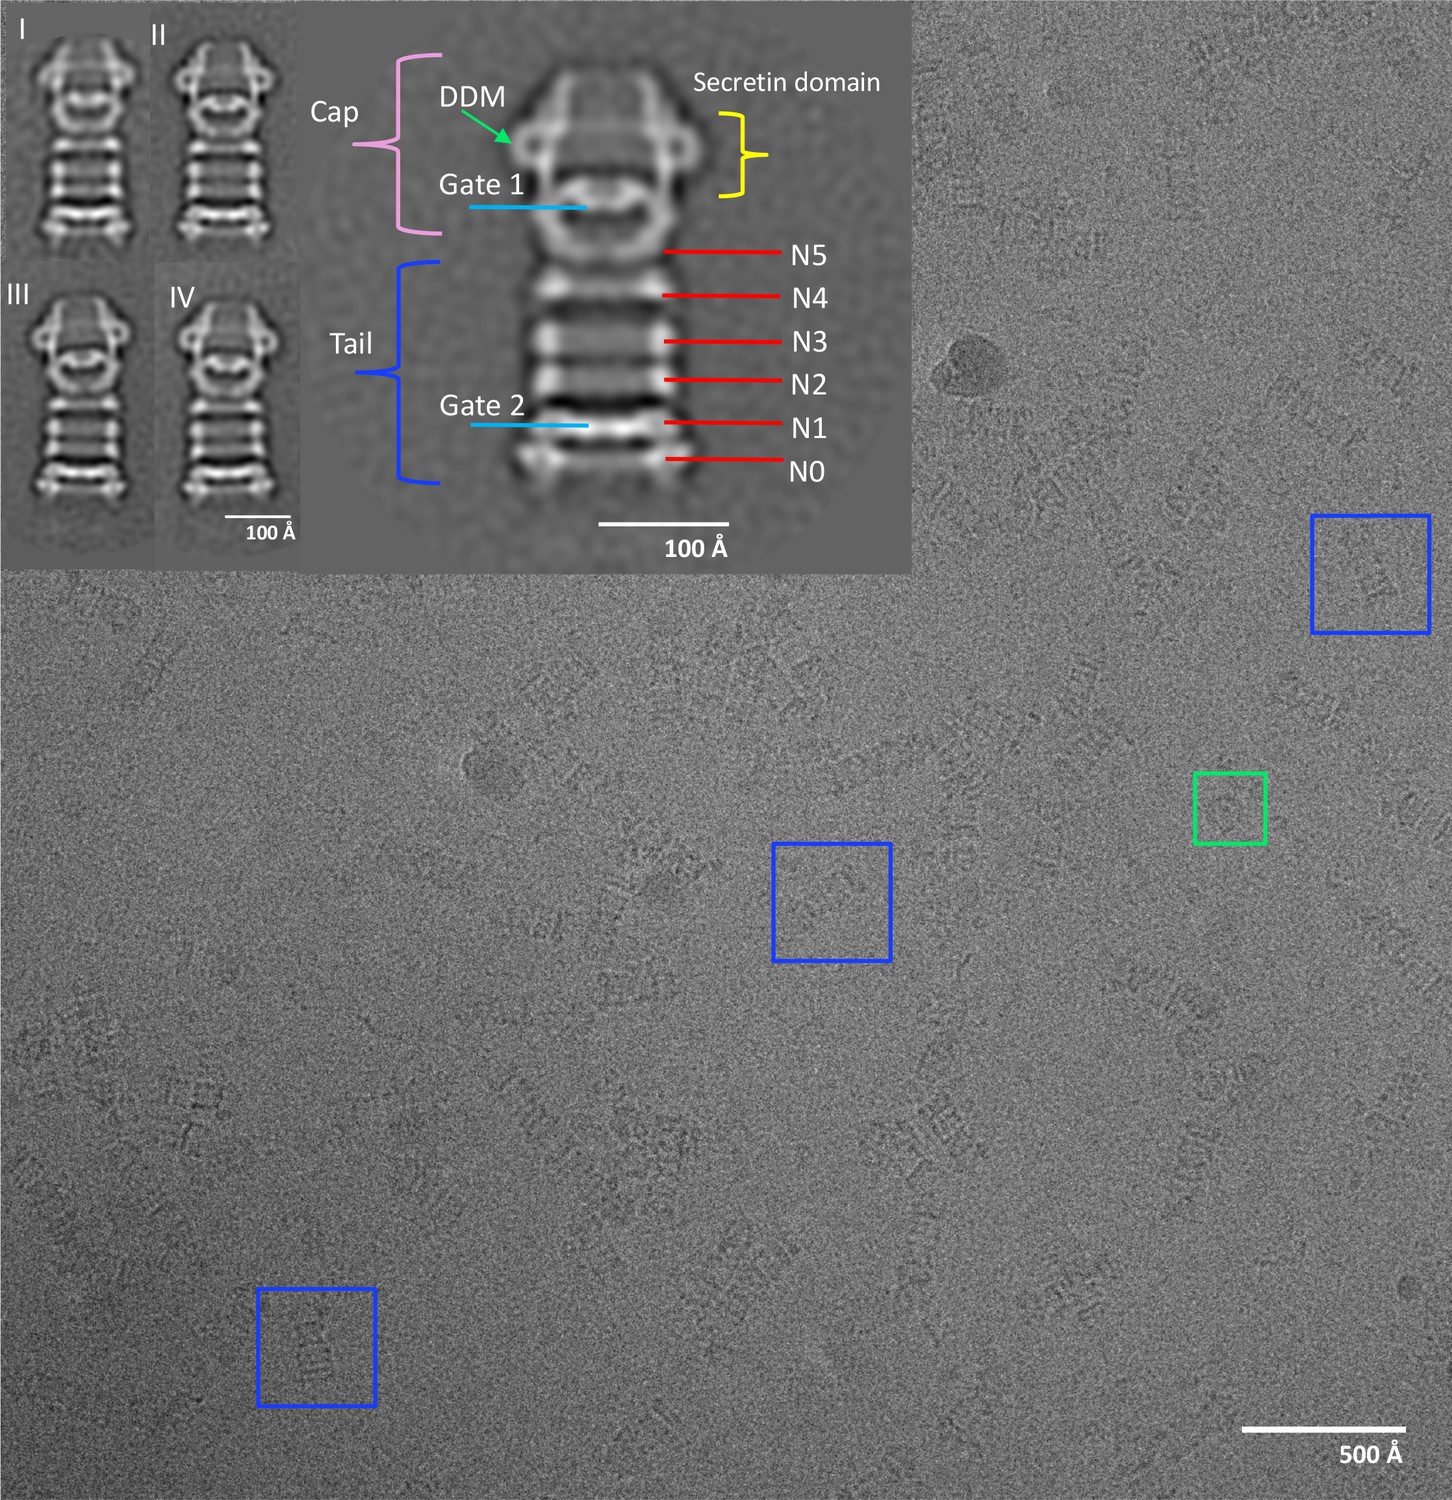
Electron micrograph of PilQ complex and selected 2D class averages.
Typical micrograph of purified WT PilQ recorded at 1.8 μm defocus. Individual PilQ particles are clearly recognizable, either as frequent side-views (blue boxes) or less frequent top-views (green boxes). Insets show a selection of 2D class averages. Class I to IV were obtained by averaging 1096, 935, 728, and 691 particles respectively. Class II (2x magnification) shows the salient features of the PilQ complex with Gate 1 and 2 (blue lines), rings N5 to N0 (red lines) forming the tail (dark blue bracket) and the cap (pink bracket) containing the secretin domain (yellow bracket). Classes III and IV indicate a rocking motion of the cap and N5 ring relative to the long axis of PilQ, with a hinge at the N4 ring. Green arrow, detergent micelle (DDM).
Figure 1—figure supplement 1
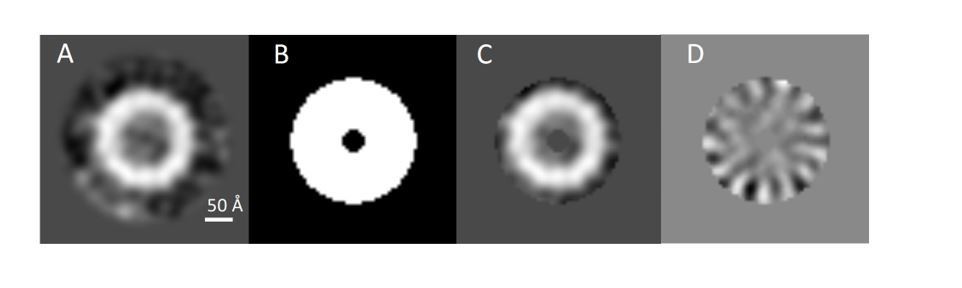
Assessment of PilQ symmetry and oligomeric state.
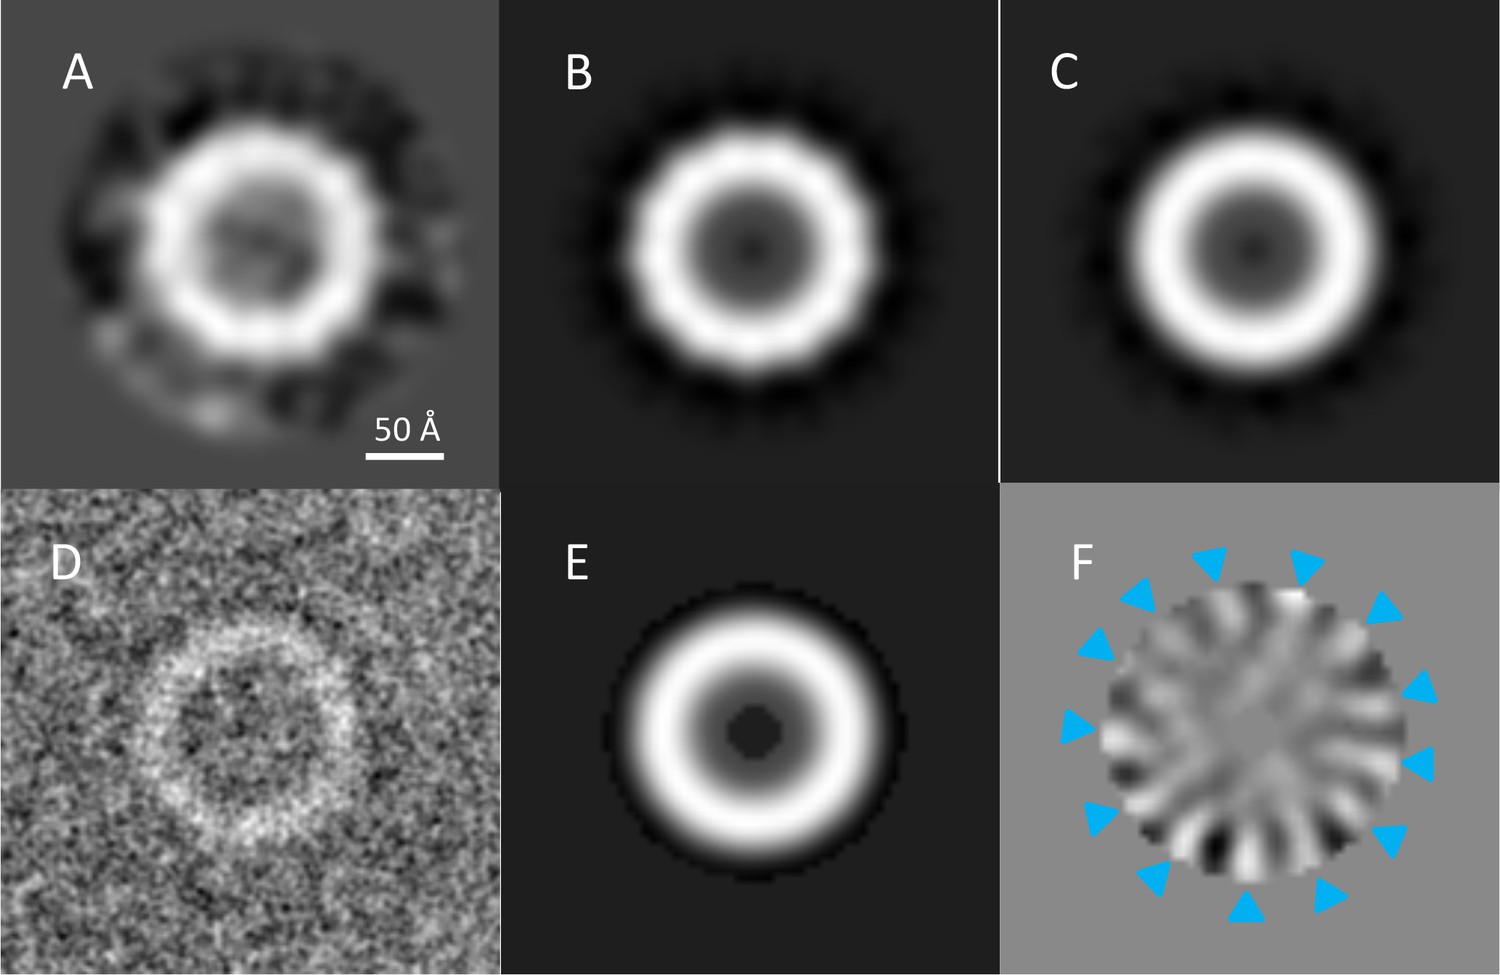
(A) 2D class average of 27 top views, which was not sufficiently clear for an unambiguous assessment of rotational symmetry. (B) The same 2D class average with 13-fold rotation symmetry applied. (C) Applying 12-fold symmetry (Collins et al., 2001) resulted in a featureless ring. (D) Low-pass filtering to 4 Å enhances the contrast of a typical top view of the complex. Randomly rotated copies (n = 50) of the top view in (D) were subjected to multivariate statistical analysis. An annular mask excluded the noise and limited the analysis to the features of the ring. (E) The first eigenimage, showing the average of all images and the annular mask. (F) The second eigenimage shows 13 distinct positive (blue arrowheads) and negative features, indicating 13-fold rotational symmetry.
Figure 2 with 1 supplement
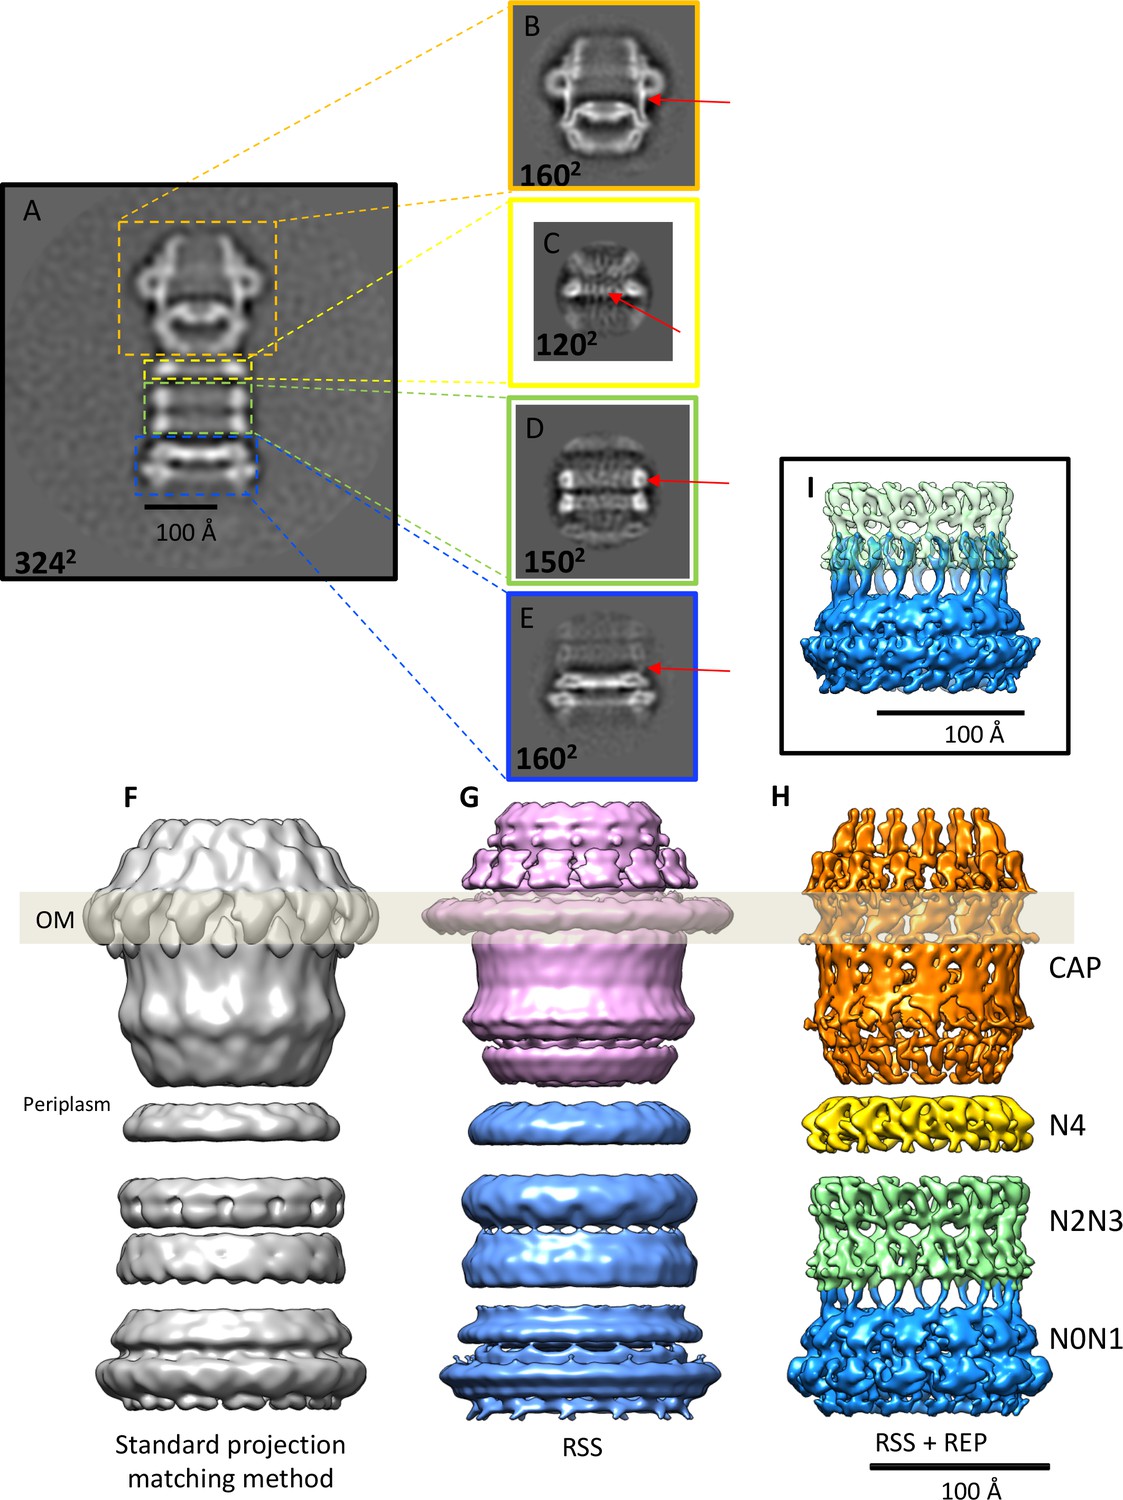
Effects of recentering in 2D and 3D reconstruction.
(A) Typical 2D class average of 600 PilQ particles. (B–E) Reference-free 2D classification of the same particle subset after residual signal subtraction (RSS) and recentering, which enhances high-resolution features (red arrows) in the cap (B), N4 ring (C), N2N3 ring pair (D), and the N0N1 ring pair (E). (F–H) The improvement upon applying a combination of RSS and recentering is evident after 3D refinement. (F) Standard reconstruction yields a map of ~20 Å resolution. (G) Reconstructing the cap module (pink) and tail module (blue) separately using the RSS procedure improves the resolution to 15 Å. (H) Combination of RSS and recentering after dividing the PilQ complex into four modules doubled the resolution to 7 Å. Images were realigned, classified and refined independently for the cap and N5 ring (1763 particles, orange), N4 ring (3888 particles, yellow), N2N3 ring pair (1585 particles, light green) and N0N1 ring pair (2685 particles, blue). Secondary structure features were resolved in all component maps, revealing the single-polypeptide chain connections between the N0N1 and N2N3 ring pairs. (I) The recentering procedure does not introduce overfitting, as independently aligned and refined modules (N0N1 and N2N3) display consistent features. Features of the N2 ring along with N1-N2 linker region from both modules (blue and green) show maximal overlap. The position of the outer membrane (OM) is indicated by a transparent grey bar.
Figure 2—figure supplement 1
FSC curves and refinement statistics.
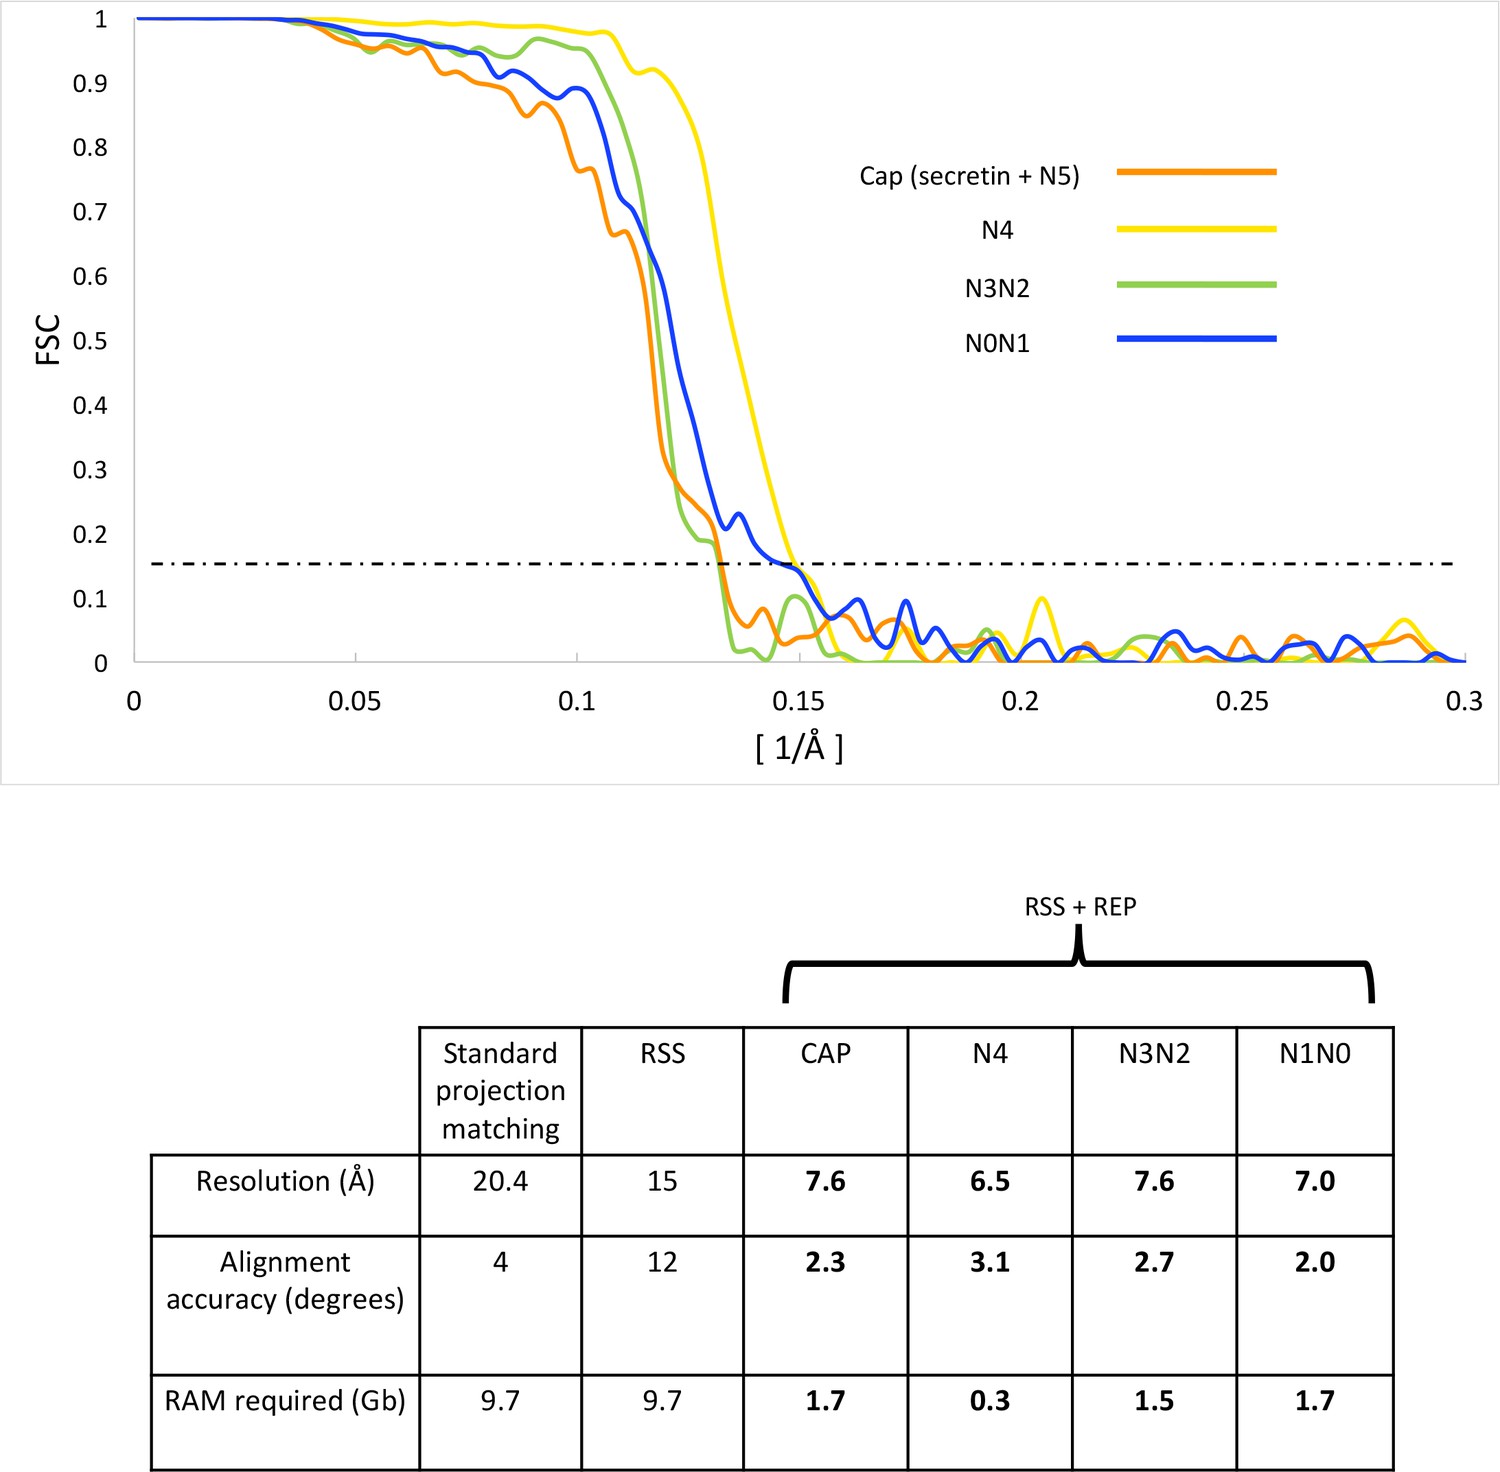
FSC curves (top panel) of independently aligned and refined secretin-N5 rings (orange), N4 rings (yellow), the N2N3 (green) and N0N1 ring pairs (blue) after applying a combination of RSS and recentering. The dashed line marks the 0.143 FSC threshold. The lower panel shows 3D reconstruction statistics.
Figure 3 with 5 supplements
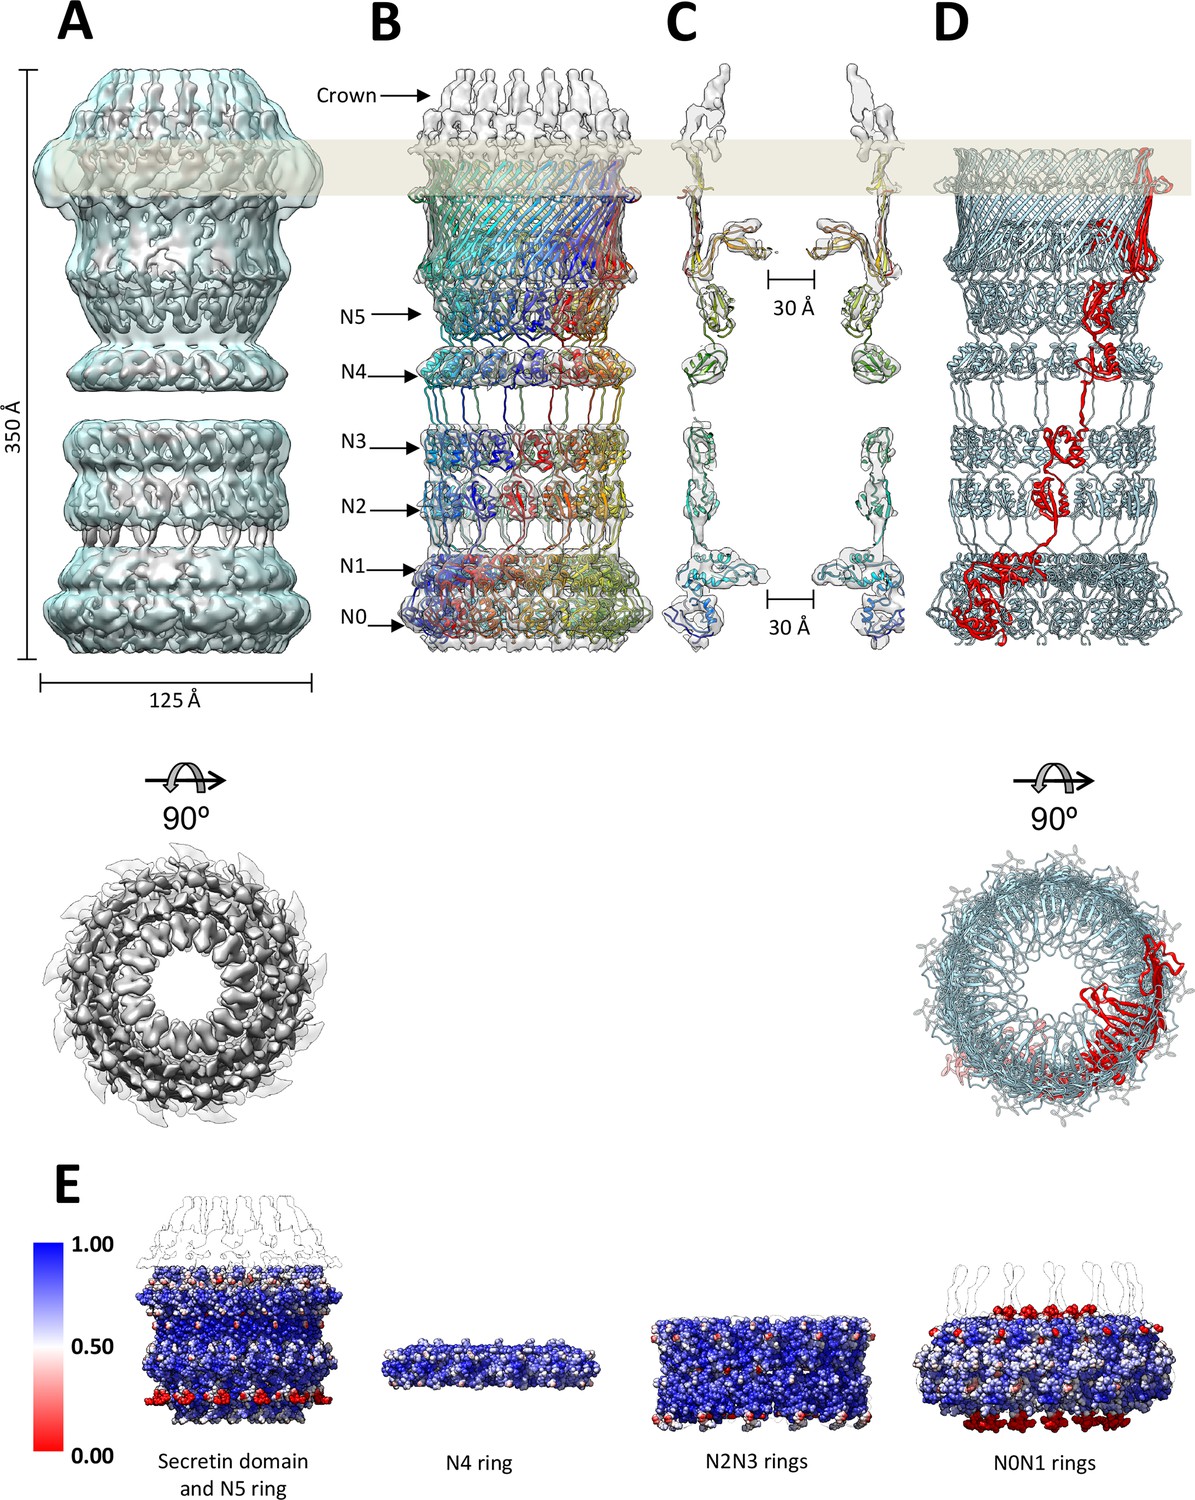
Fit of the PilQ model.
(A) Independent reconstructions of the four modules after recentering combined into a single high-resolution map (grey), as indicated by the low-resolution envelope of the entire complex (transparent light blue). (B) Atomic model of C13 symmetric PilQ complex (rainbow colored by chain) fitted into maps of individual modules after MDFF refinement (Trabuco et al., 2008). (C) Cross section of (B), showing the position of gates 1 and 2 relative to the outer membrane (grey bar) and the overall fit of individual domains into each ring. The density of the crown region outside the outer membrane is not accounted for by the PilQ sequence. (D) Top and side views indicating the helical arrangement of PilQ protomers (one protomer red) around the central symmetry axis. (E) Per voxel local cross-correlation values (CC) of C13 symmetric model-derived maps and REP-reconstructed EM maps (outlines) were computed and used to color (red-white-blue) the atomic models (shown as spheres) before MDFF to highlight model/map correspondence.
Figure 3—figure supplement 1
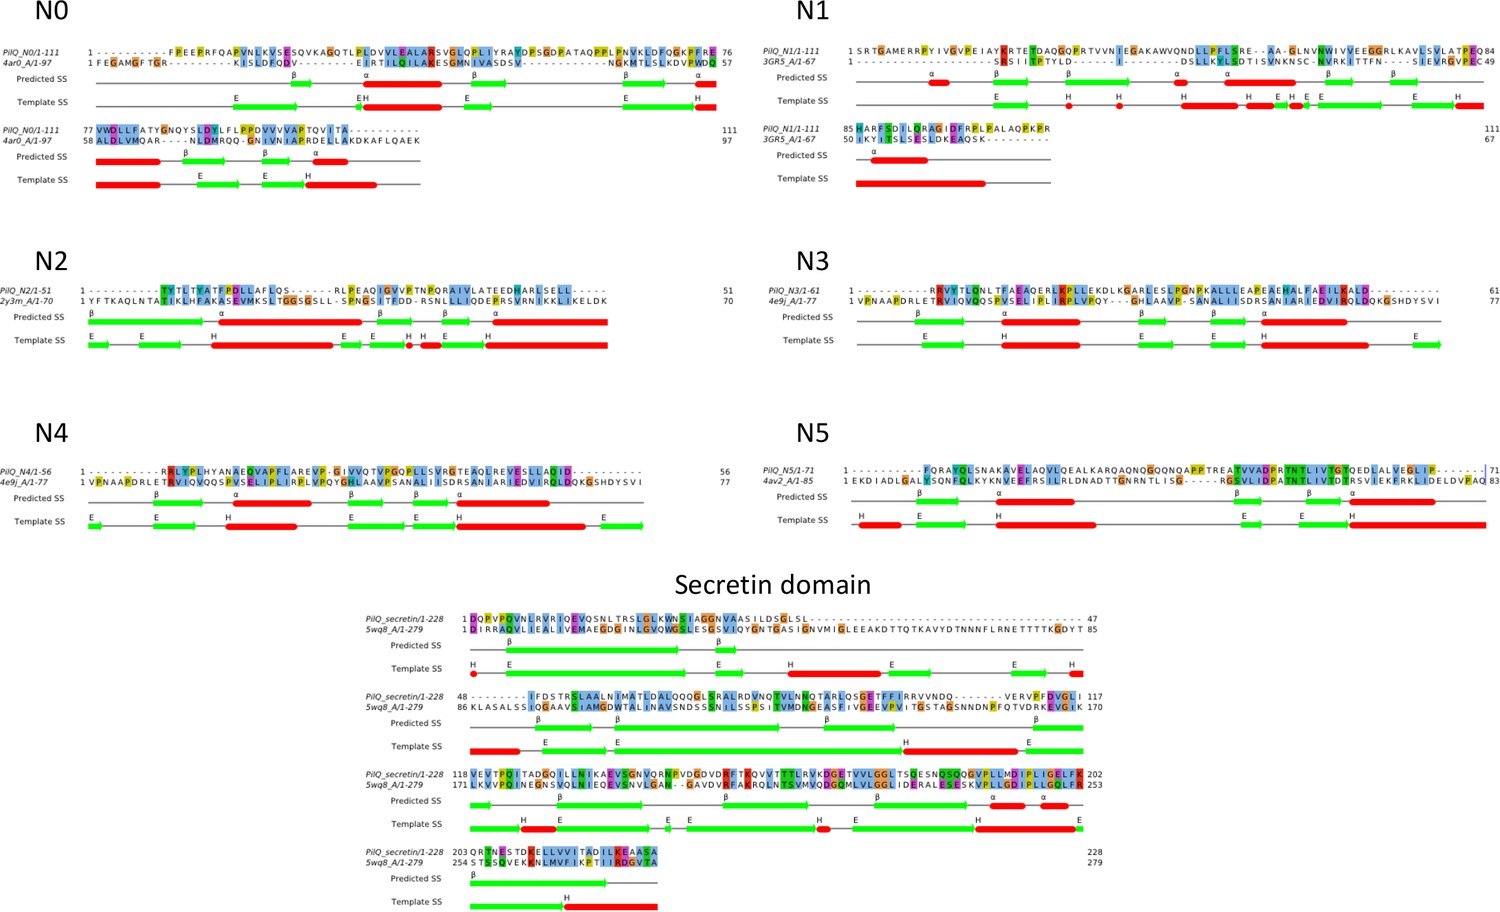
Sequence alignments of PilQ domains.
Homology models were based on sequence alignment of individual PilQ domains with their respective best hit PDB structure templates (Table 1). The predicted secondary structure and DSSP-assigned secondary structure for the templates are indicated by coloured bars (alpha helices: red, beta strands: green).
Figure 3—figure supplement 2
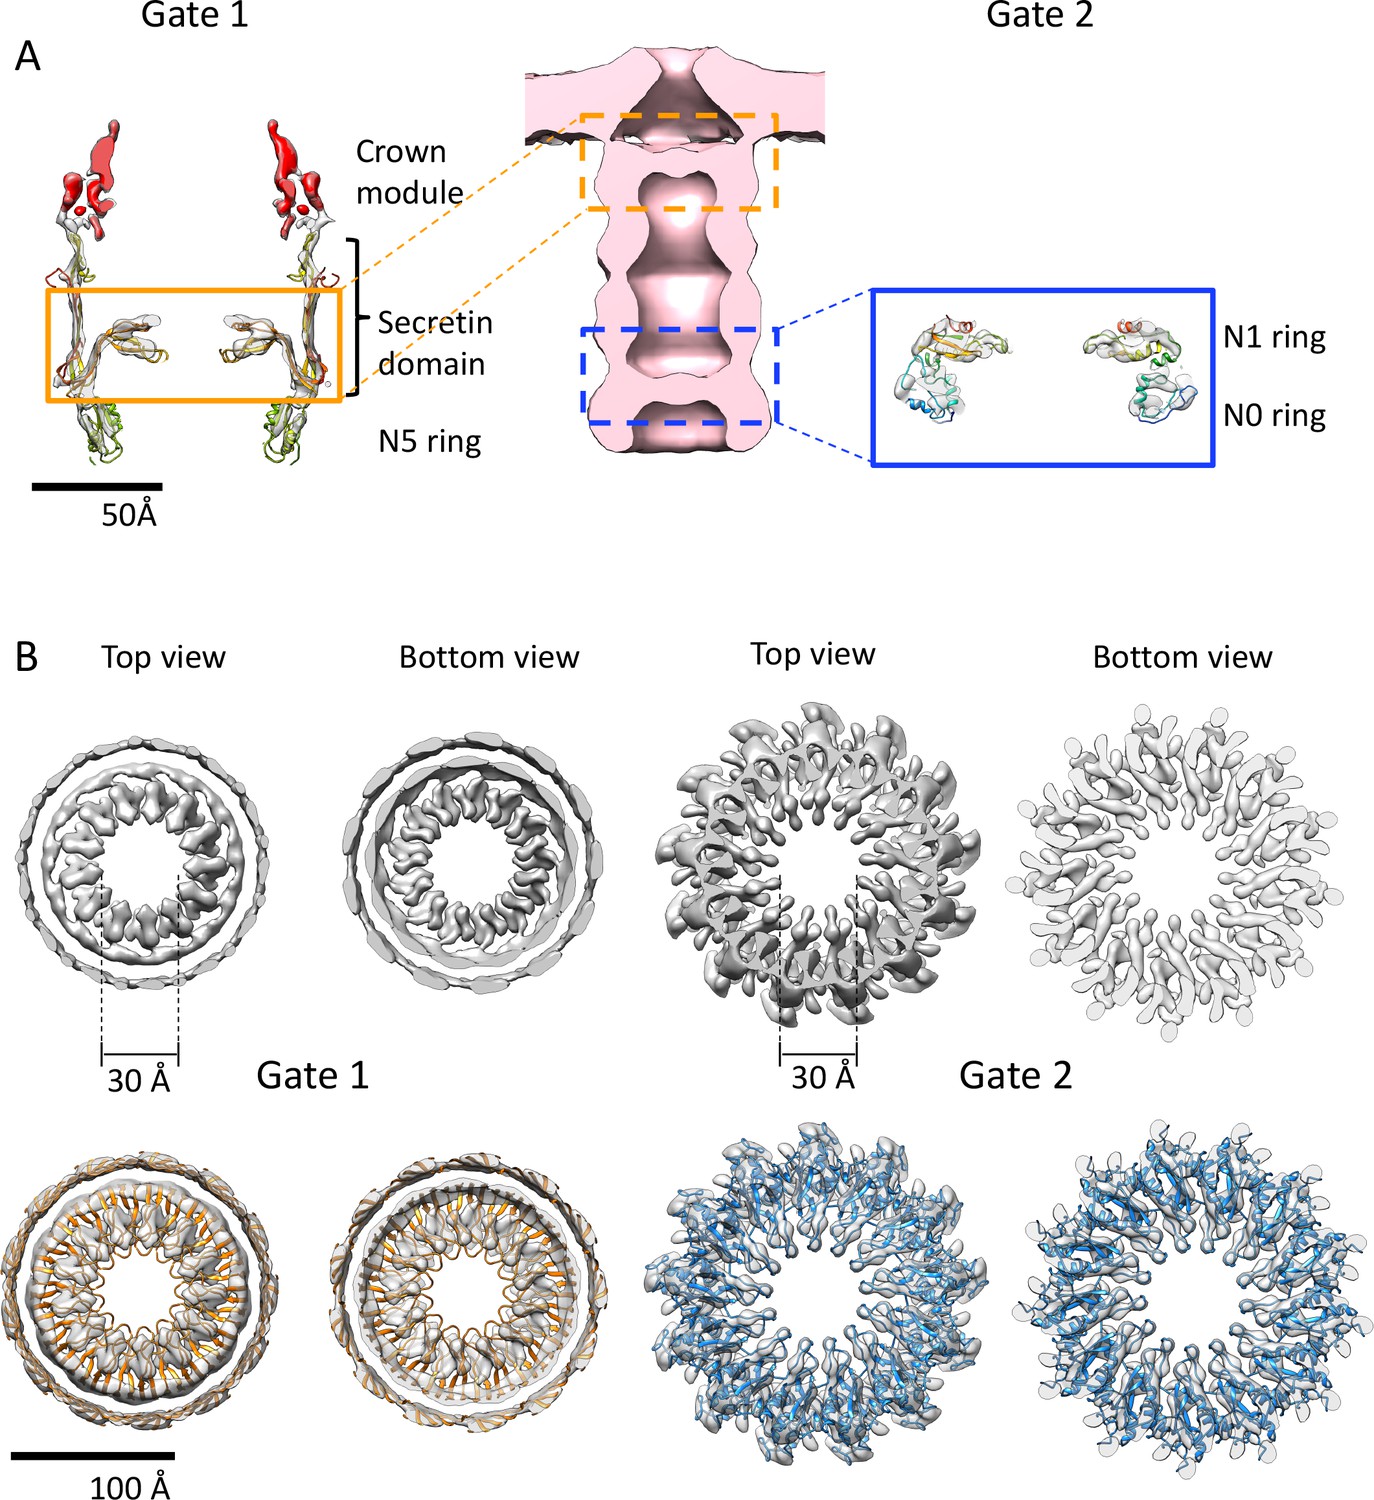
Gates of PilQ complex.
(A) Cross section along the central axis of the PilQ map (transparent grey). The position of Gates 1 and 2 in the PilQ complex in the sub-tomogram average of the non-piliated, closed state (EMD-3021; Gold et al., 2015) (center) is indicated. The crown module (red) and Gate 1 (orange box) are shown on the left. Gate two is formed by the N1N0 ring pair in the blue box (right). The fitted homology model is rainbow-colored by residue. (B) Top and bottom views of clipped density maps of Gate 1 (left) and Gate 2 (right). The lower panels show the map density with fitted PilQ domains. The Gate one aperture consists of bifurcated density segments that are visible in the cross sections of side views (Figure 3C). This feature is conserved in the gates of other secretins (see Figure 4—figure supplement 1). Note that the apertures of both gates consist of loop segments in the secretin domain (Gate 1) and N1 domain (Gate 2).
Figure 3—figure supplement 3
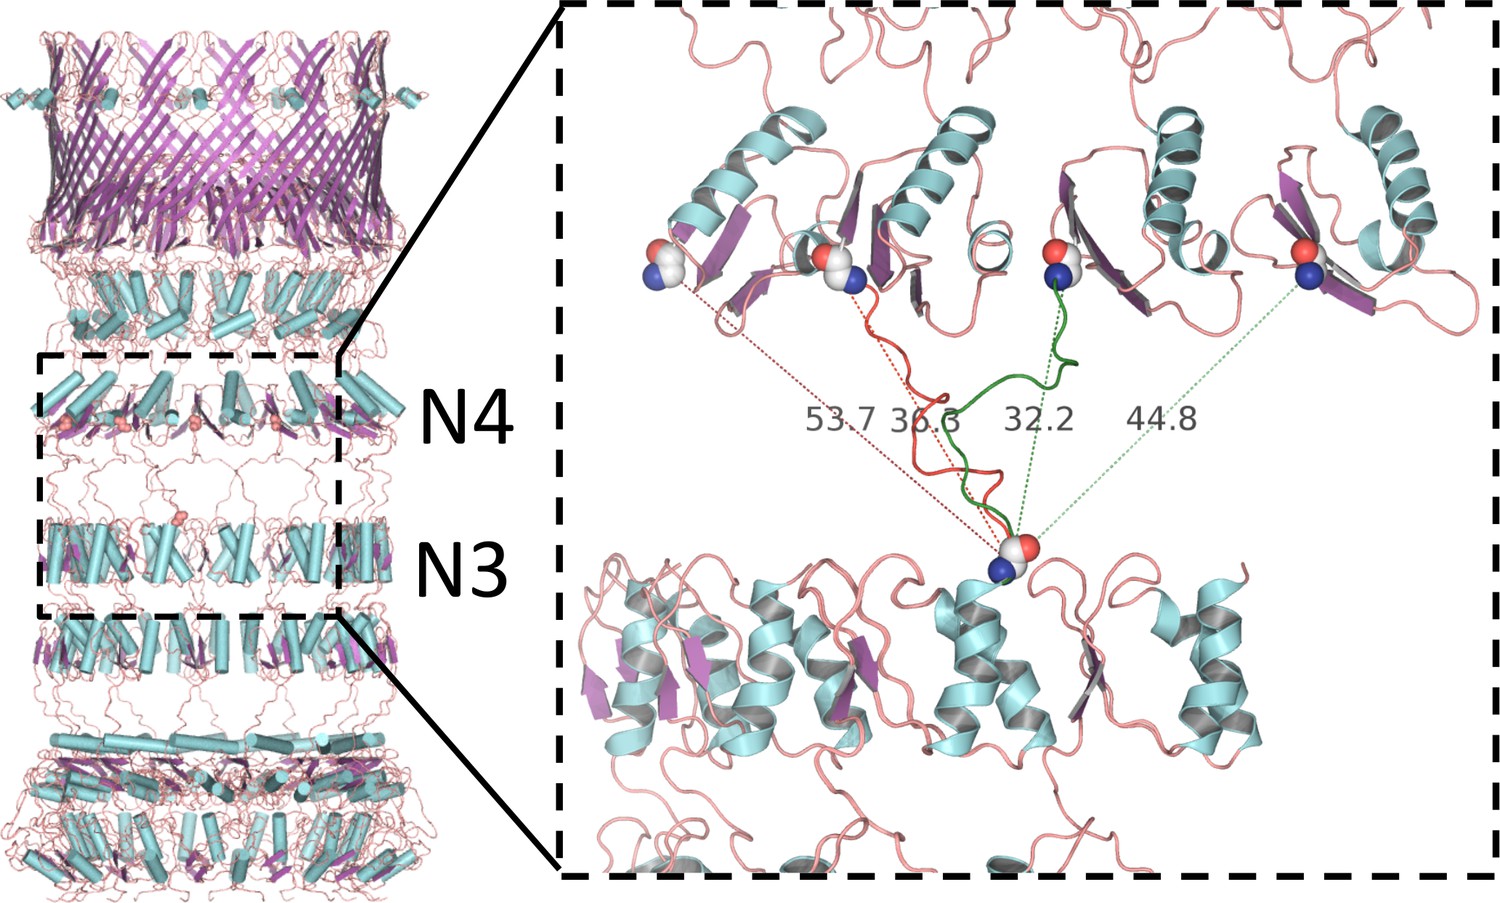
Alternative linker models connecting N3 and N4 rings.
PilQ domains N3 and N4 are connected by a 17-residue linker. There is no clear map density between N3 and N4, but the inter-ring distance constrains the possible connectivity between the C-terminus of N3 and the N-terminus of N4. Domains are most likely offset by one or two along the ring, resulting in alternative models with either right-handed (green dashed lines) or left-handed helicity (red dashed lines). The connection is closest in the model with a domain offset of one and right-handed helicity (green linker segment).
Figure 3—figure supplement 4
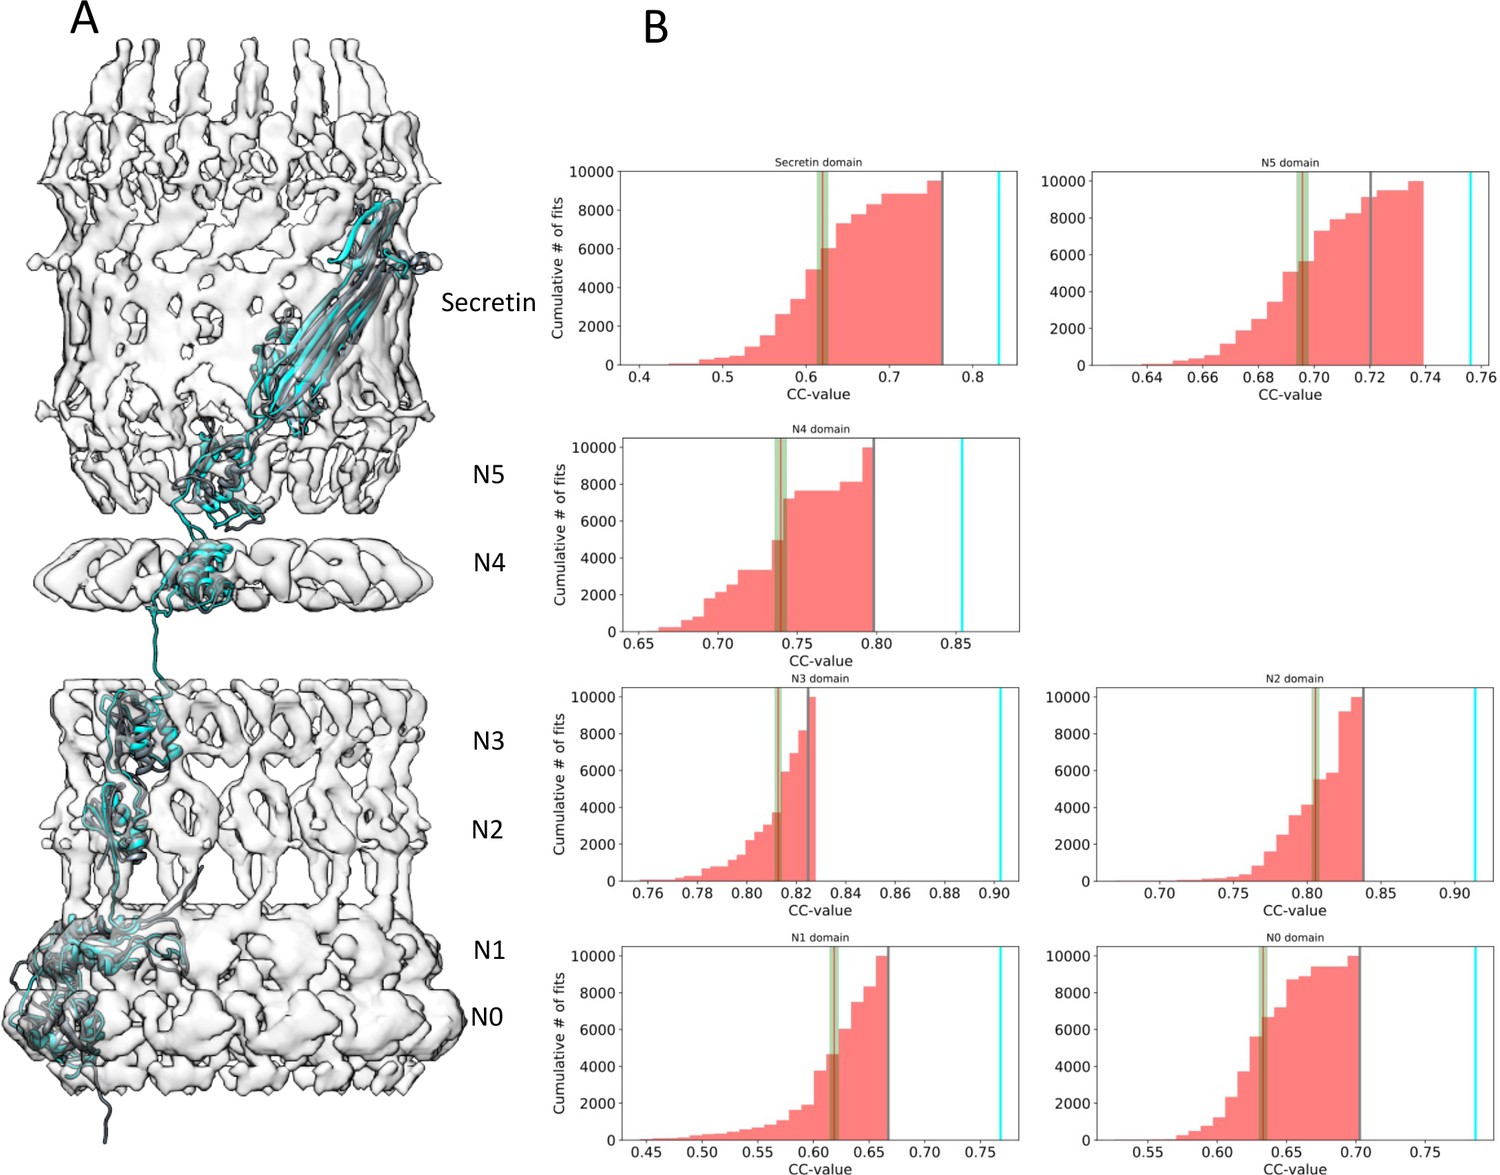
Assessment of the PilQ domain fits.
(A) Location of individual PilQ domains along a single protomer showing the best fit models before (grey) and after MDFF refinement (cyan). (B) Individual PilQ protomer domain models were used in exhaustive Euler angle sampling to obtain multiple fits (red, n = 10000) ranked by their cross-correlation (CC) values. The red lines indicate the mean CC value along with the standard error of the mean (green). The best initial fits (grey lines) span the protomer domain density and have the highest CC values. Upon MDFF refinement of the initial fits CC values increase (cyan lines).
Figure 3—figure supplement 5
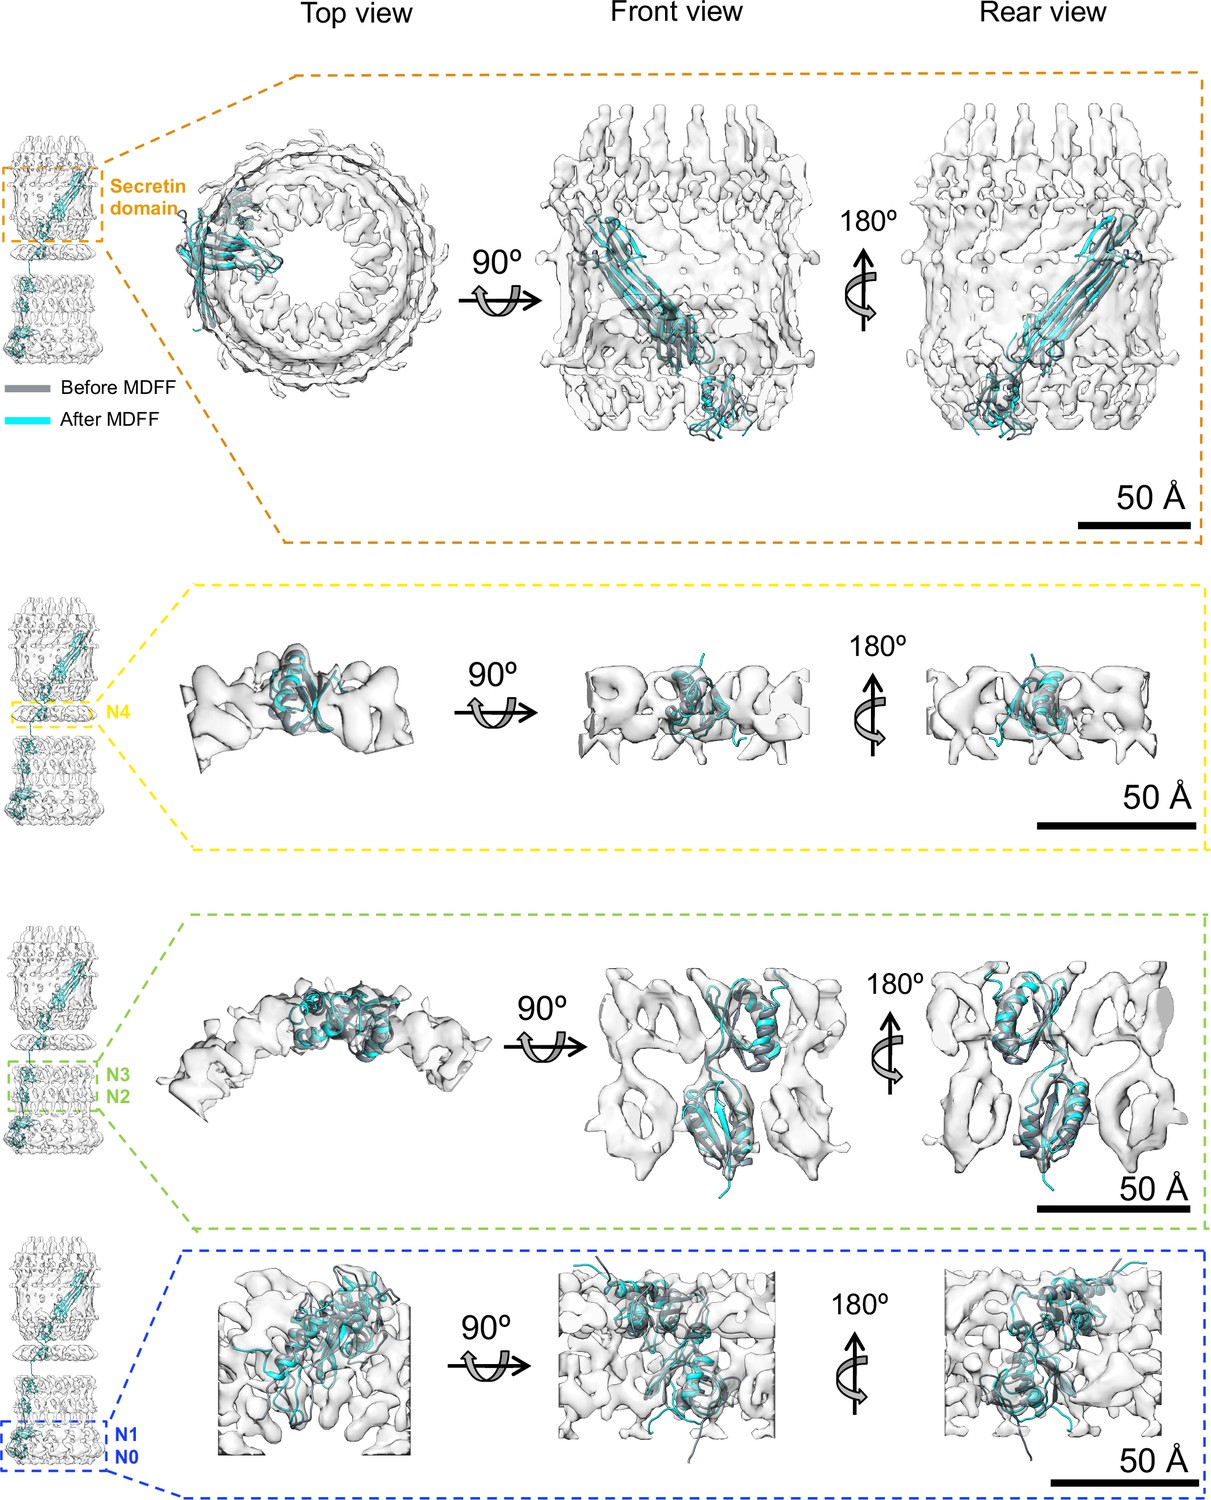
Model refinement.
Initial best fits (grey) of PilQ domains into corresponding ring-modules density maps after 6D search. The localization information of the individual domains within the ring modules was obtained from domain deletion mutations described previously (Salzer et al., 2016). The initial fits were used to build C13 symmetric atomic models of the individual rings followed by refinement using a Molecular Dynamics Flexible Fitting procedure (MDFF) to obtain the final model (cyan). The refinement procedure improved the overall fit into the individual maps with minor or no changes to the central domain scaffolds, thereby confirming that the folds derived from template structures are preserved in PilQ. The N- and C-termini of the individual domains of the N0N1 fragment undergo local rearrangement to fit better into the density map during the MDFF runs, despite using a weak coupling of MD forces to the map derived density gradient (g = 0.3).
Figure 4 with 1 supplement
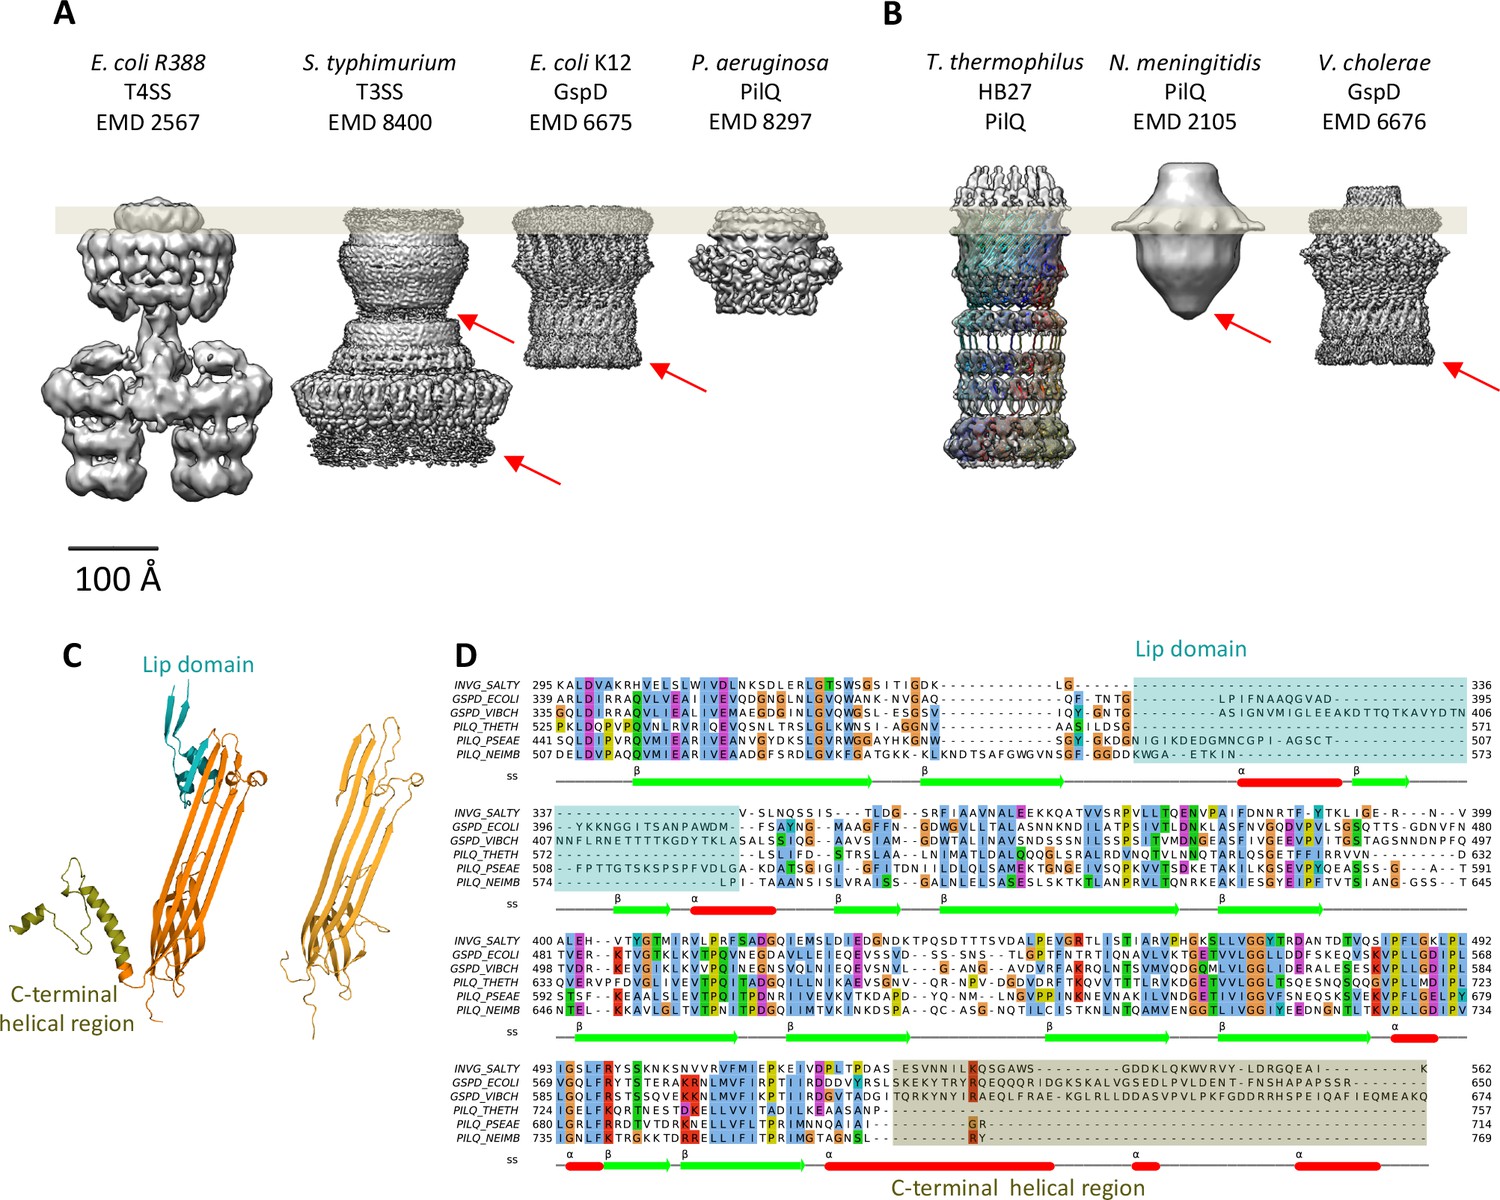
Comparison of different secretion systems with T. thermophilus PilQ.
Cryo-EM maps of seven different secretion systems aligned against the OM (grey bar) indicate two major classes. (A) E. coli R388 T4SS, S. enterica serovar typhimurium T3SS (consisting of proteins InvG, PrgK and PrgH), E. coli K12 T2SS and P. aeruginosa PilQ do not have any density outside the OM (grey bar). (B) T. thermophilus PilQ, N. meningitidis PilQ and V. cholerae GspD display a conical density outside the OM. Red arrows indicate poorly resolved regions of the N-terminal domains. (C) The structure of the lip domain (-αβ-βα-; cyan) is resolved in V. cholerae GspD (left) and forms the feature outside the OM in (B), but it is absent in PilQ from T. thermophilus (right). (D) Multiple sequence alignment of secretin domains from well-characterized complexes indicates that the lip region (cyan) and the C-terminal helical segments (olive) are absent in all PilQ homologues. We conclude that the features outside the OM (B) are not formed by the PilQ protomer.
Figure 4—figure supplement 1
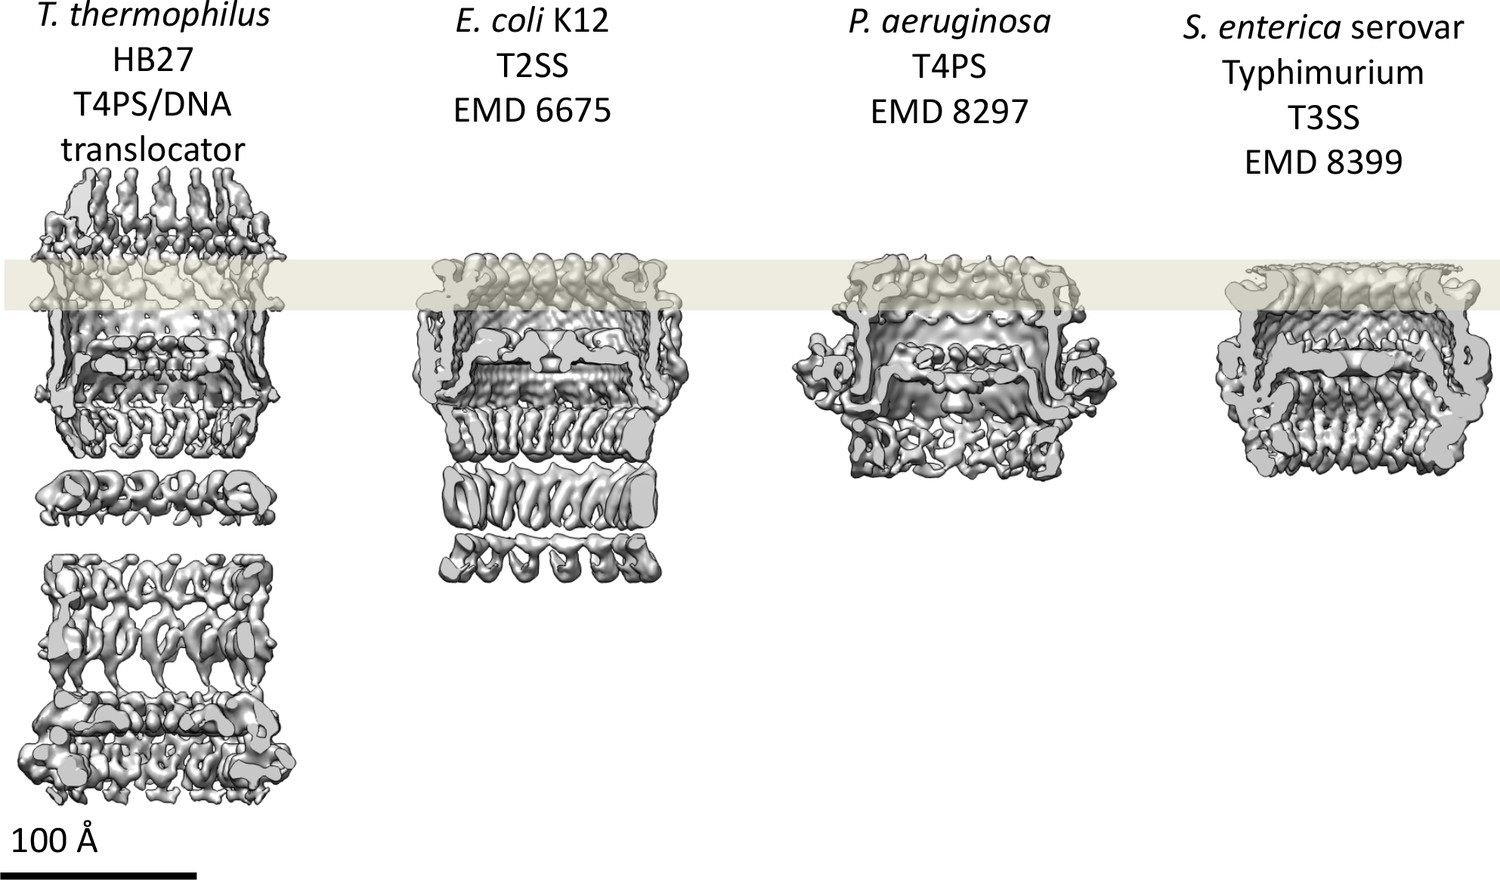
Comparison of secretin domains of different secretion systems.
Cross sections through the cryo-EM maps indicate structurally conserved features in the secretin domain. All maps are low-pass filtered to the same nominal resolution (7 Å).
Figure 5
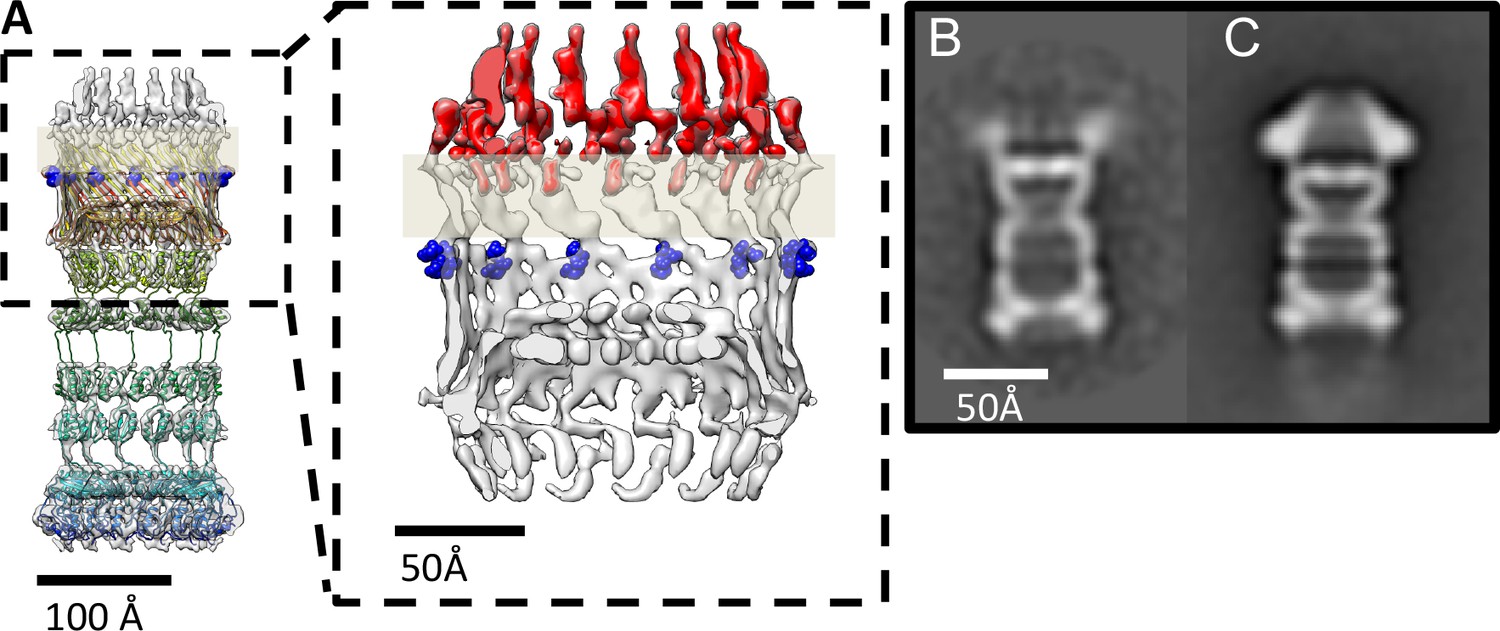
PilQ mutants K728A and R730A destabilize the crown module.
(A) EM map of PilQ complex with fitted model (rainbow-colored from N to C terminus). Residues R730 and K728 (dark blue) are located just below the detergent belt (grey bar), close to the TM region of PilQ in the modeled homo-oligomer. Cross section through the cap region showing the crown module (red) above the OM surface. (B and C) Class averages of negatively stained PilQ-K728A/R730A (B) and wt-PilQ (C) obtained by averaging 374 and 3730 particles, respectively. The crown is absent in PilQ-KR, which shows weak, fuzzy densities instead, indicating that the crown is disordered.
Figure 6
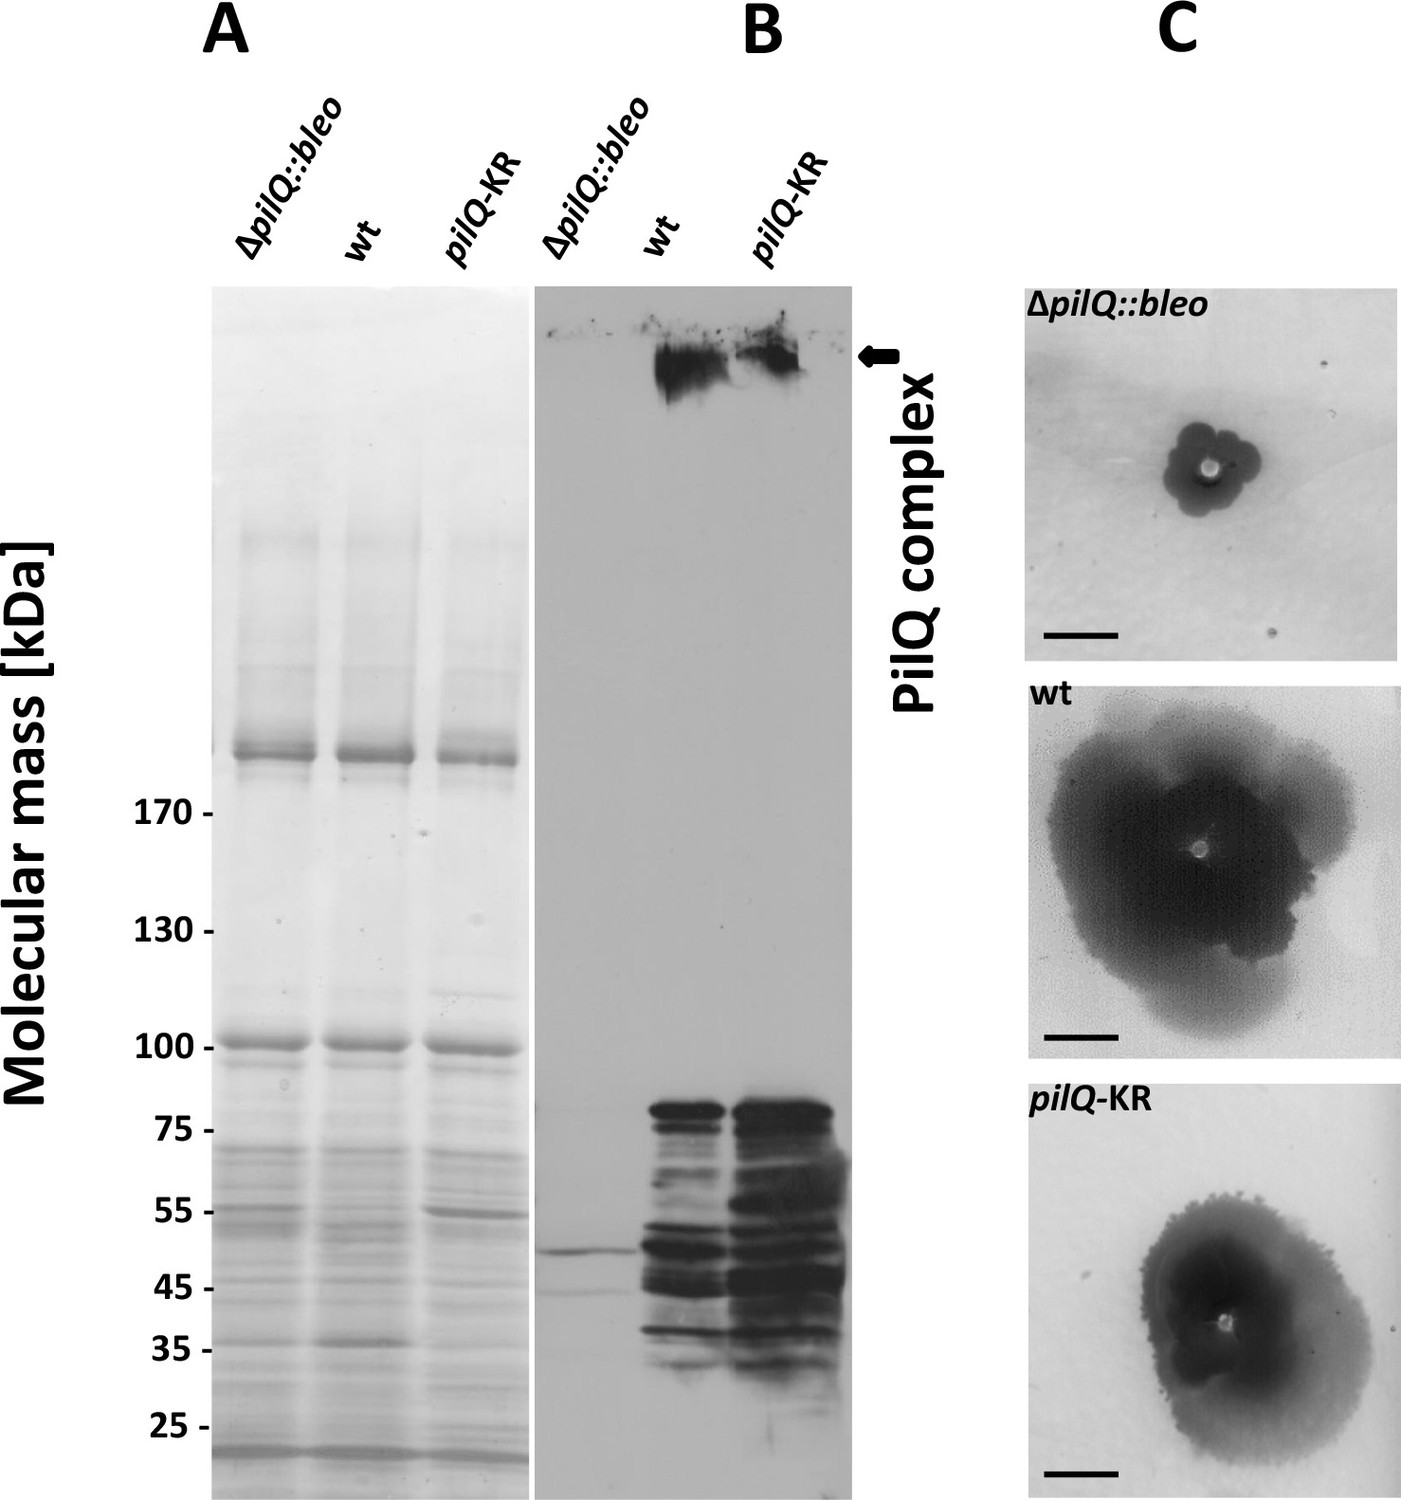
Stability of the PilQ-KR variants and twitching motility assay.
(A, B) Stability of purified PilQ wildtype and PilQ-KR as indicated by SDS-PAGE (A) and Western blot analysis using PilQ antibodies (1:13000) (B) of membrane extracts boiled for 30 min in SDS sample buffer. (C) Contrast-inverted images of culture plates to quantify the twitching motility of the T. thermophilus strains (Scale bar = 5 mm).
Figure 7
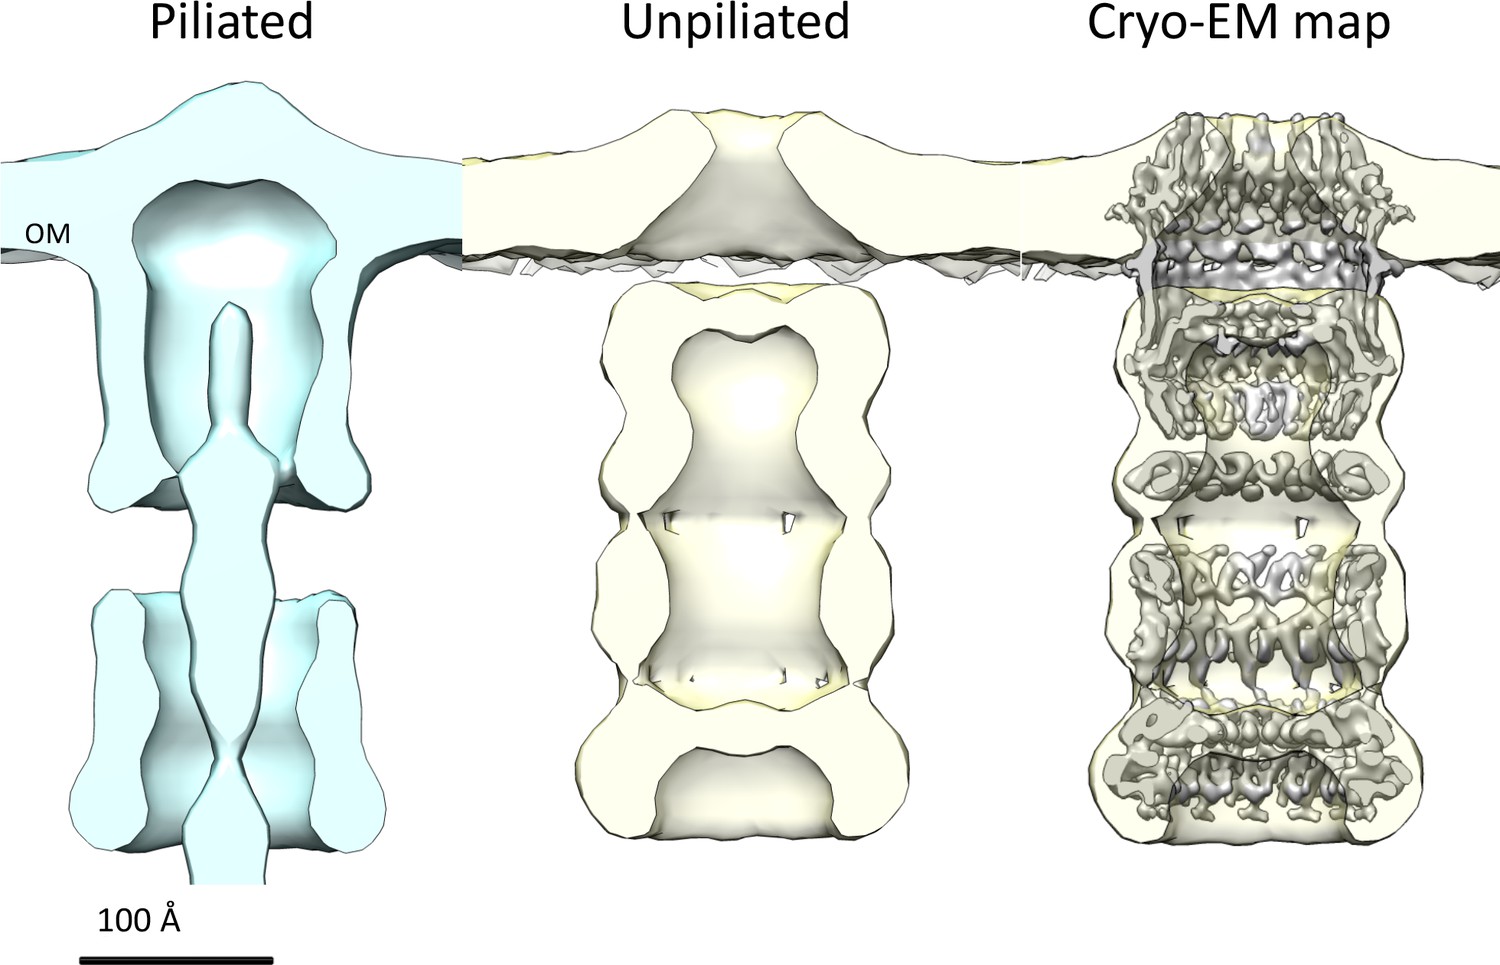
Comparison of T. thermophilus T4PS complex in situ to detergent-solubilized PilQ.
Cross section of sub-tomogram averages of piliated (light blue) and unpiliated T4PS (light yellow) (Gold et al., 2015) with superposed 7 Å cryo-EM structure of PilQ complex.
Author response image 1
Author response image 2
Assessment of PilQ symmetry and oligomeric state.
(A) 2D class average derived from 27 top views was not sufficient to assess the symmetry unambiguously. (B) Binary annular mask applied for multivariate statistical analysis. (C) Multiplication of (A) by (B) shows that the applied mask is not too lose and it just includes signal from the ring densities. (D) Second eigenimage after multivariate statistical analysis.
Videos
Video 1
Cryo-EM structure of the PilQ complex.
Overall architecture of the PilQ complex. Sagittal sections along the central symmetry axis show the gates; top views of clipped planes indicate the detailed arrangement of all domains and both gates in PilQ from top to bottom.
Video 2
Atomic model of PilQ protomer.
Sagittal and longitudinal sections through the single PilQ domains show the quality of the fit of the homology models of the PilQ protomers. The overall arrangement of one PilQ protomer (chain B, cyan) after flexible fitting and linkers built and the adjacent protomers corresponding to chains A and C (blue and green respectively) show how the they are positioned relative to each other.
Tables
Table 1
Modelling and fitting of PilQ domains.
Sequences of PilQ domains aligned to their respective templates were used to create atomic models of each domain. Models with the best scores (lower DOPE scores [Sali and Blundell, 1993]) were fitted into the corresponding density maps and screened for best fit orientations (highest cross correlation coefficient).
| PilQ Domain | Size (aa) | Consensus Secondary structural motif | Template protein (PDB code) | Sequence identity/similarity | Resolution (Å)/Method | DOPE score (z-score) |
|---|---|---|---|---|---|---|
| N0 | 116 | βαββαββα | N0 domain of PilQ from N. meningitidis 4ARO_A | 11.45/ 20.61 | NA/NMR structure | −9457.03 (0.230) |
| N1 | 107 | αββββα | Periplasmic domain of secretin EscC from enteropathogenic E. coli 3GR5_A N1 domain model from PilQ from N. meningitidis 4AV2_A | 8.77/ 14.91 | 3gr5: 2.05/X-ray 4av2: NA/NMR, Model and cryo-EM | −7861.37 (0.351) |
| N2 | 57 | βαββα | Extra membrane domain of secritin HOFQ from A. actinomycetemcomitans 2Y3M_A | 9.72/ 20.83 | 2.3/X-ray | −5616.16 (−1.684) |
| N3 | 61 | βαββα | N domain of secretin XcpQ from P. aeruginosa 4E9J_A | 17.28/ 33.33 | 2.03/X-ray | −5858.94 (−1.331) |
| N4 | 56 | βαββα | N domain of secretin XcpQ from P. aeruginosa 4E9J_A | 14.28/ 29.87 | 2.03/X-ray | −5261.98 (−1.392) |
| N5 | 82 | βαββα | N1 domain model from PilQ from N. meningitidis 4AV2_A | 18.88/ 27.77 | NA/NMR, Model and cryo-EM | −6353.61 (−1.415) |
| Secretin | 230 | βββββββββααβ | Secretin domain of T2SS GspD from V. cholerae 5WQ8_A | 8.89/ 14.18 | 3.26/cryo-EM | −17222.63 (0.777) |
Table 2
Statistics of PilQ domain fits.
Homology models of the different PilQ domains were fitted into the respective ring module maps. Each domain was initially placed within the density maps in multiple orientations (n = 10,000), spanning the entire Euler angular space, and subjected to steepest descent local optimization. The resulting fits were clustered and ranked by their CC-scores with the corresponding density maps fits. The table lists the top-5 fits for each domain in the Euler-angle search, along with their CC-scores and the number of independent optimization runs ending in this cluster. The top-ranked fits were assessed for compatibility of the N-to-C-terminal domain orientations (bottom-to-top). The compatible orientations with the highest CC-value was selected as initial fit. Subsequent refinement using MDFF flexible fitting (Trabuco et al., 2008) further improved the fits with minimal structural change.
| PilQ domain fits | Total no. of fits | No. of unique fits | Top 5 solutions | Initial chosen protomer fit. CC (Cluster #) | Fit after MDFF. CC (RMSD, Å) | CC for C13 oligomeric ring model | CC after MDFF run with masked density map | ||
|---|---|---|---|---|---|---|---|---|---|
| Rank # | CC with map | Runs | |||||||
| N0 | 10000 | 152 | Rank 1 Rank 2 Rank 3 Rank 4 Rank 5 | 0.7028 0.6715 0.6696 0.6681 0.6670 | 576 327 167 33 174 | 0.7028 (Rank 1) | 0.7863 (3.210) | 0.70 | 0.85 |
| N1 | 10000 | 115 | Rank 1 Rank 2 Rank 3 Rank 4 Rank 5 | 0.6673 0.6639 0.6583 0.6570 0.6551 | 530 682 336 110 211 | 0.6673 (Rank 1) | 0.7682 (4.044) | 0.70 | 0.85 |
| N2 | 10000 | 48 | Rank 1 Rank 2 Rank 3 Rank 4 Rank 5 | 0.8381 0.8270 0.8270 0.8256 0.8248 | 784 815 364 475 953 | 0.8381 (Rank 1) | 0.9139 (1.883) | 0.84 | 0.91 |
| N3 | 10000 | 32 | Rank 1 Rank 2 Rank 3 Rank 4 Rank 5 | 0.8279 0.8253 0.8249 0.8237 0.8222 | 473 457 889 829 408 | 0.8249 (Rank 3) | 0.9026 (3.376) | 0.84 | 0.91 |
| N4 | 10000 | 32 | Rank 1 Rank 2 Rank 3 Rank 4 Rank 5 | 0.7982 0.7931 0.7793 0.7521 0.7479 | 1106 757 483 434 511 | 0.7982 (Rank 1) | 0.8539 (2.166) | 0.77 | 0.93 |
| N5 | 10000 | 65 | Rank 1 Rank 2 Rank 3 Rank 4 Rank 5 | 0.7394 0.7371 0.7274 0.7218 0.7203 | 206 292 364 559 329 | 0.7203 (Rank 5) | 0.7562 (2.378) | 0.77 | 0.82 |
| Secretin | 9527 | 86 | Rank 1 Rank 2 Rank 3 Rank 4 Rank 5 | 0.7634 0.7063 0.7013 0.6958 0.6899 | 672 156 285 104 370 | 0.7634 (Rank 1) | 0.8314 (1.872) | 0.77 | 0.82 |
Additional files
-
Transparent reporting form
- https://doi.org/10.7554/eLife.30483.021
Download links
A two-part list of links to download the article, or parts of the article, in various formats.
Downloads (link to download the article as PDF)
Open citations (links to open the citations from this article in various online reference manager services)
Cite this article (links to download the citations from this article in formats compatible with various reference manager tools)
Cryo-EM structure of the bifunctional secretin complex of Thermus thermophilus
eLife 6:e30483.
https://doi.org/10.7554/eLife.30483


