Osteocalcin expressing cells from tendon sheaths in mice contribute to tendon repair by activating Hedgehog signaling
- The Chinese University of Hong Kong, Hong Kong
- The Chinese University of Hong Kong, Prince of Wales Hospital, Hong Kong
Figures
Figure 1 with 1 supplement

Bglap as a tendon sheath specific marker.
(A) Fluorescent immunohistochemistry of mouse sheath tissues of the adult Tibialis anterior tendon at 2 months old (n = 5 mice per group). Scale bar, 40 μm. (B) QRT-PCR analysis of sheath-specific markers using adult mouse sheath and tendon tissues as shown. Relative expression levels were normalized to β-tubulin and the sheath tissues. Data are means ± s.e.m and were analyzed using Student’s t-tests. *p≤0.013; **p≤0.0014. n = 3 mice per group. (C) Images of peroneus longus and brevis tendon (upper panel) and Tibialis anterior tendon (lower panel) of the BGLAP-Cre;Rosa26mT/mG mice at 2 months old. Dotted lines depict the boundaries of the tendon fibers. GFP signals are observed in the tendon sheath tissues (n = 5 mice per group). Scale bar, 250 μm. (D) Cross-sections of fluorescent microscopic analysis of the extensor tendons and flexor tendons of Rosa26mT/mG and BGLAP-Cre;Rosa26mT/mG mice. Scale bar, 50 μm (n = 5). (E) QRT-PCR analysis of sheath-specific markers using sheath and tendon cells isolated from the BGLAP-Cre;Rosa26mT/mG mice after cell-sorting for green fluorescence (GFP). Relative expression levels were normalized to Gapdh and the sheath cells. Data are means ± s.e.m and were analyzed using a Student’s t-tests. **p≤0.0062. n = 3 biological replicates per group. Additional data for this figure are provided in Figure 1—figure supplement 1.
-
Figure 1—source data 1
Source data relating to Figure 1B.
- https://doi.org/10.7554/eLife.30474.005
-
Figure 1—source data 2
Source data relating to Figure 1E.
- https://doi.org/10.7554/eLife.30474.006
Figure 1—figure supplement 1
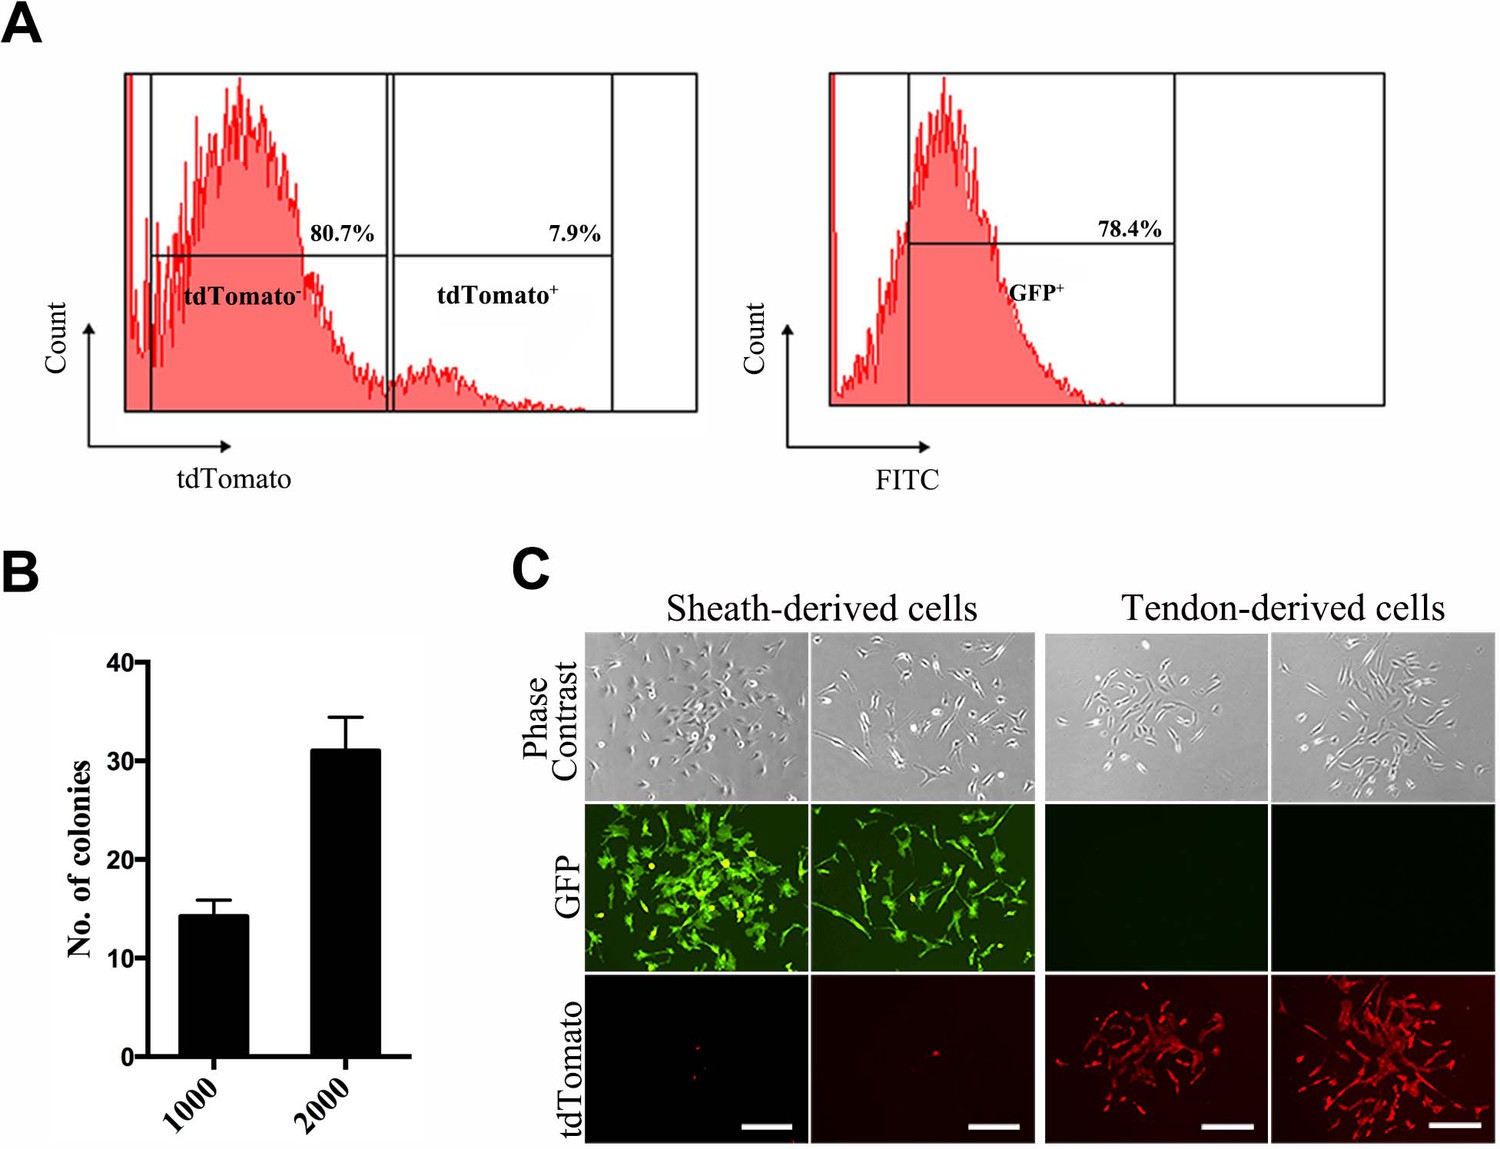
Fluorescence-assisted cell-sorting (FACS) analysis of sheath-derived cells.
(A) Cells dissociated from the Tibialis anterior sheath tissues of the BGLAP-Cre;Rosa26mT/mG mice after cell-sorting for GFP and tdTomato signals. (B) The number of colonies was counted in a colony-formation assay using sheath-derived cells (GFP+) isolated from the BGLAP-Cre;Rosa26mT/mG mice with two different initial cell-seeding densities of 1000 or 2000 cells. (C) Cell morphology of sorted cells in vitro. Scale bar, 20 μm.
-
Figure 1—figure supplement 1—source data 1
Source data relating to Figure 1—figure supplement 1B.
- https://doi.org/10.7554/eLife.30474.004
Figure 2 with 1 supplement
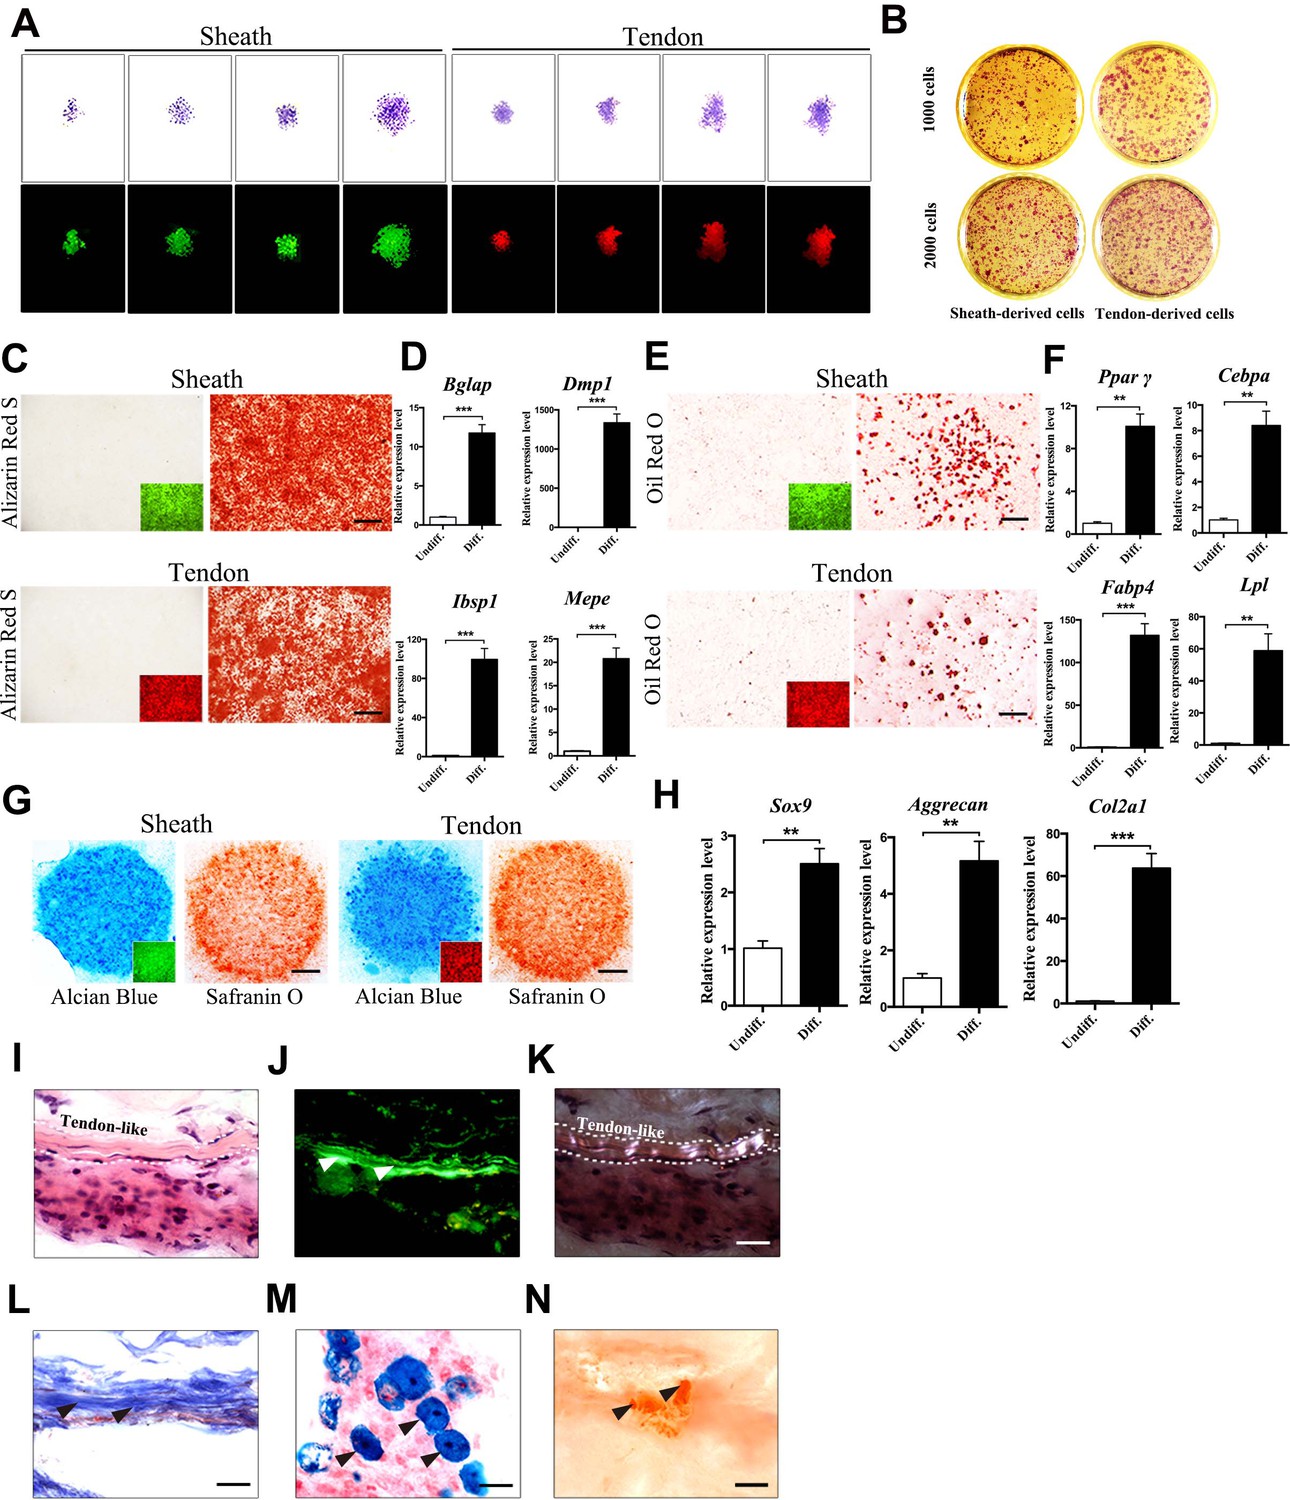
Multipotent differentiation potential of sheath-derived cells.
(A) Colony formation assay using sheath-derived cells (GFP+) or tendon-derived cells (tdTomato+) isolated from the adult tendon tissues of BGLAP-Cre;Rosa26mT/mG mice. Colonies were stained with crystal violet (upper panel) or by fluorescence (lower panel) after 14 days of culture (n = 5). (B) Primary cells were seeded with two different initial cell densities of 1000 or 2000 for 14 days as shown. (C, E, G) Lineage differentiation assay under (C) osteogenic (scale bar, 1000 μm), (E) adipogenic (scale bar, 200 μm), and (G) chondrogenic conditions (scale bar, 1000 μm) using primary cells isolated from the tendon tissues of BGLAP-Cre;Rosa26mT/mG mice after cell-sorting. Insets represent the fluorescence signals of the respective primary cells before differentiation. GFP+ cells represent cells from sheath tissues; tdTomato+ cells represent cells from tendon fibers (n = 3). (D, F, H) QRT-PCR analysis of gene markers for (D) osteogenesis, (F) adipogenesis and (H) chondrogenesis. Relative expression levels were normalized to Gapdh and the undifferentiated condition. Data are means ± s.e.m and were analyzed using Student’s t-tests. **p≤0.0074; ***p≤0.001. n = 3 biological replicates per group. (I–N) Histologic analysis of tendon-like structures using GFP+ sheath cell sheets transplanted into the dorsal surface of immunocompromised mice after 8 weeks. Tendon-like tissues were identified under (I) H&E staining, (J) Green fluorescence, (K) polarized light, and (L) Masson’s trichrome staining. Arrowheads point to regions of (J) tendon-like structure, (M) chondrocytes as shown by Alcian blue staining or (N) mineralized bone as shown by Alizarin Red S staining. Dashed lines indicate the boundaries of tendon-like tissues (n = 5 mice). Scale bar, 20 μm. Additional data for this figure are provided in Figure 2—figure supplement 1.
-
Figure 2—source data 1
Source data relating to Figure 2D.
- https://doi.org/10.7554/eLife.30474.012
-
Figure 2—source data 2
Source data relating to Figure 2F.
- https://doi.org/10.7554/eLife.30474.013
-
Figure 2—source data 3
Source data relating to Figure 2H.
- https://doi.org/10.7554/eLife.30474.014
Figure 2—figure supplement 1
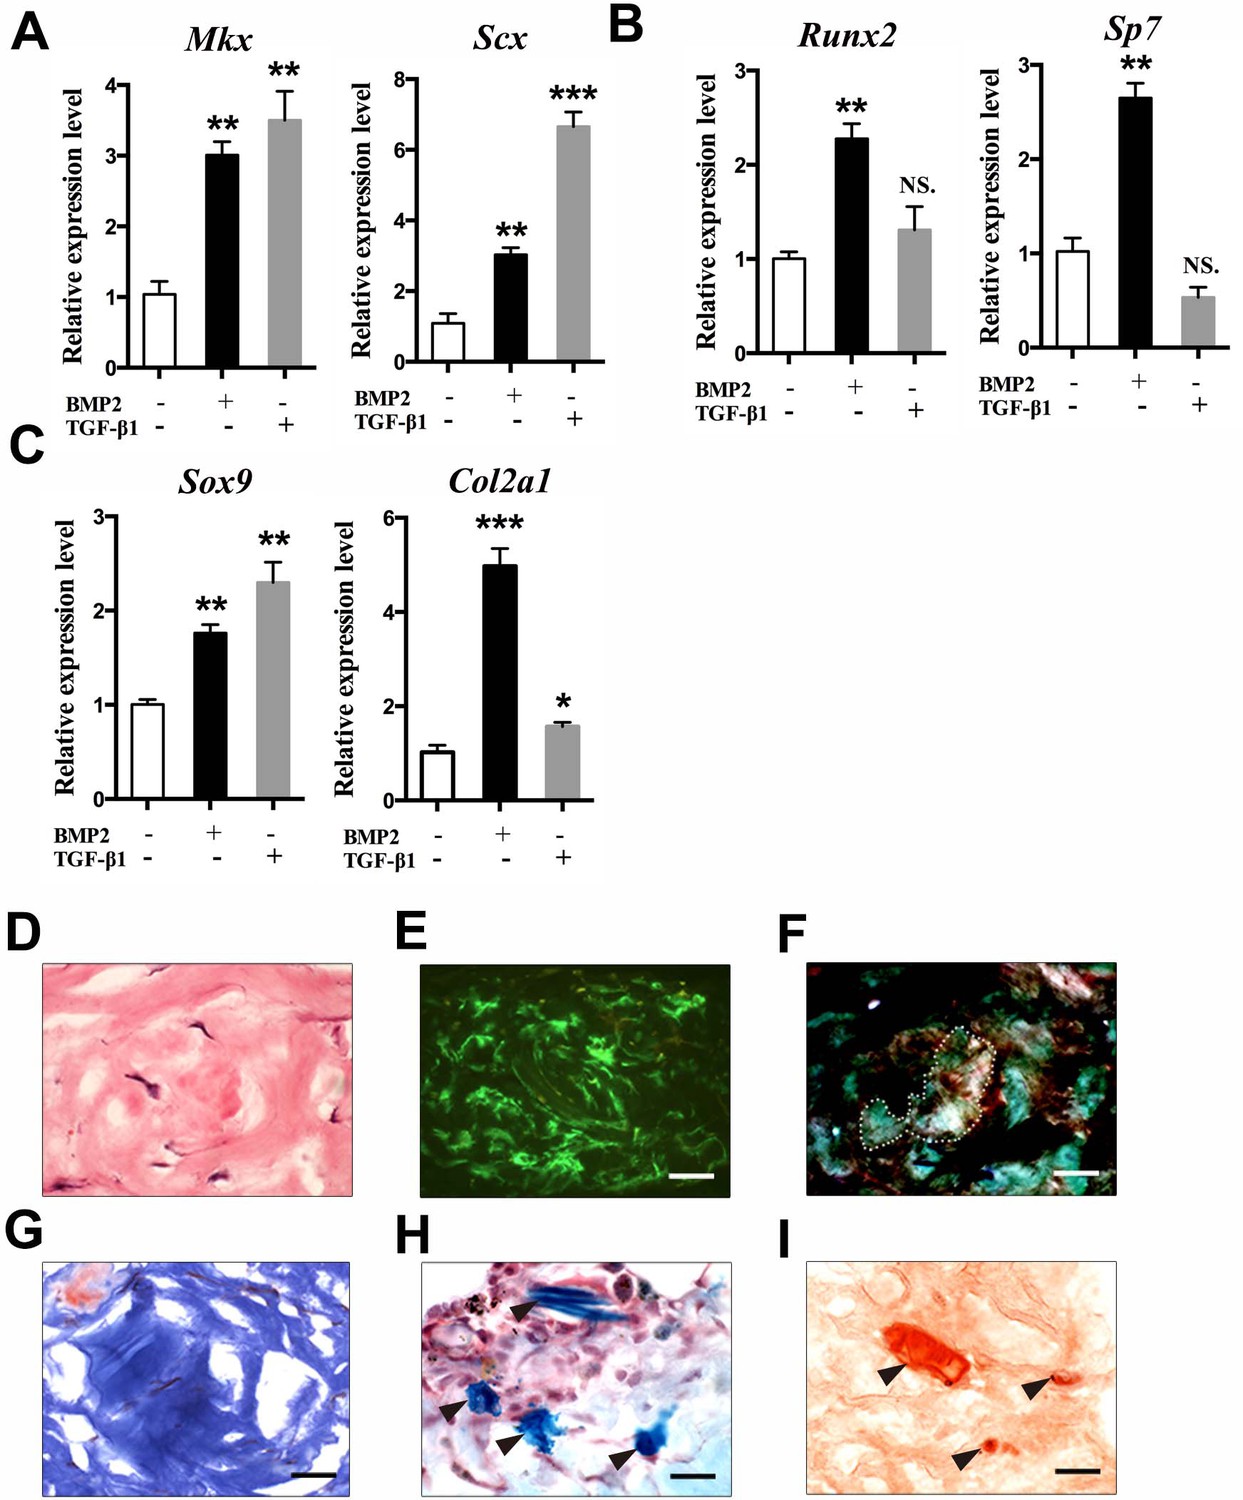
Multipotent differentiation potential of sheath-derived cells in vitro and in vivo.
(A–C) Gene expression profiles of lineage markers using primary cells isolated from the BGLAP-Cre;Rosa26mT/mG Tibialis anterior tendon sheath tissues treated with 100 ng/ml BMP2 (CST, USA) or 2 ng/ml TGF-β1 (PeproTech, USA). Relative expression levels were normalized to those of β-tubulin and the control group. Data are means ± s.e.m and were analyzed using Student’s t-tests. *p≤0.0369; **p≤0.0055; ***p≤0.0006; NS, not significant. n = 3 biological replicates per group. (D–I) In vivo differentiation of GFP+ sheath cells mixed with matrix gel and transplanted subcutaneously into the calvaria of immunocompromised mice after 8 weeks. Collagen-rich tissues were identified under (D) H&E staining, (E) Green fluorescence, (F) polarized light, and (G) Masson’s trichrome staining. Arrowheads point to regions of (H) chondrocytes as shown by Alcian blue staining or (I) mineralized bone as shown by Alizarin Red S staining (n = 3 mice). Dotted lines indicate the boundaries of Collagen-rich tissues. Scale bar, 20 μm.
-
Figure 2—figure supplement 1—source data 1
Source data relating to Figure 2—figure supplement 1A.
- https://doi.org/10.7554/eLife.30474.009
-
Figure 2—figure supplement 1—source data 2
Source data relating to Figure 2—figure supplement 1B.
- https://doi.org/10.7554/eLife.30474.010
-
Figure 2—figure supplement 1—source data 3
Source data relating to Figure 2—figure supplement 1C.
- https://doi.org/10.7554/eLife.30474.011
Figure 3 with 2 supplements
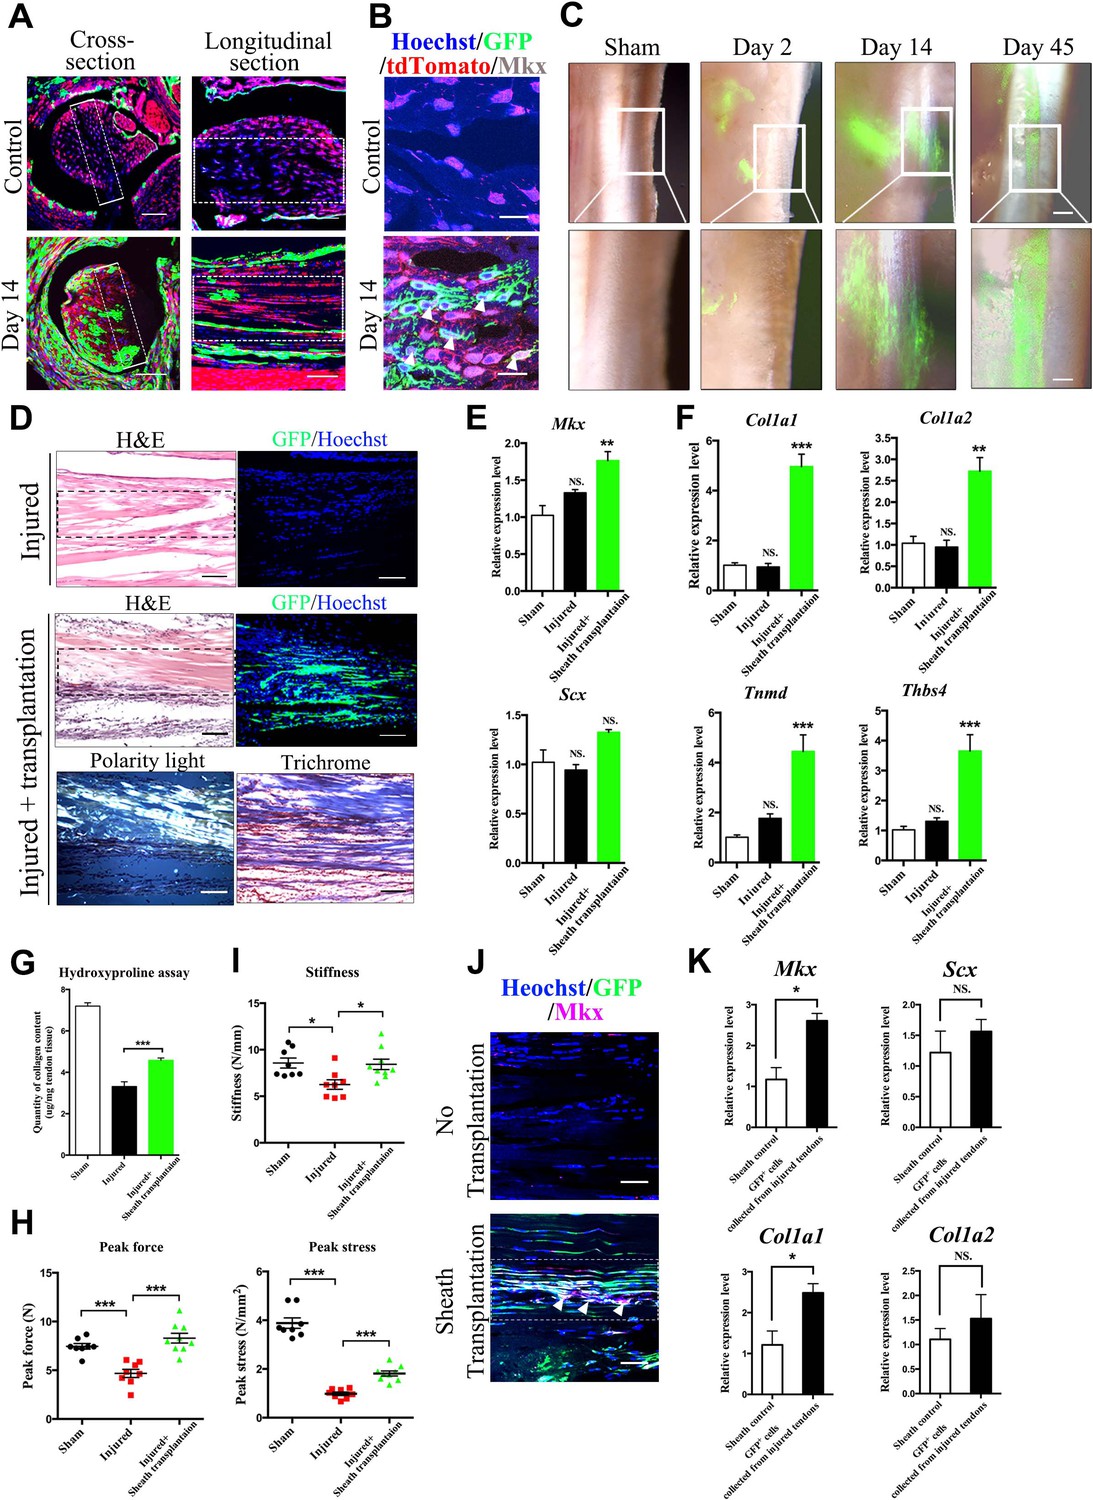
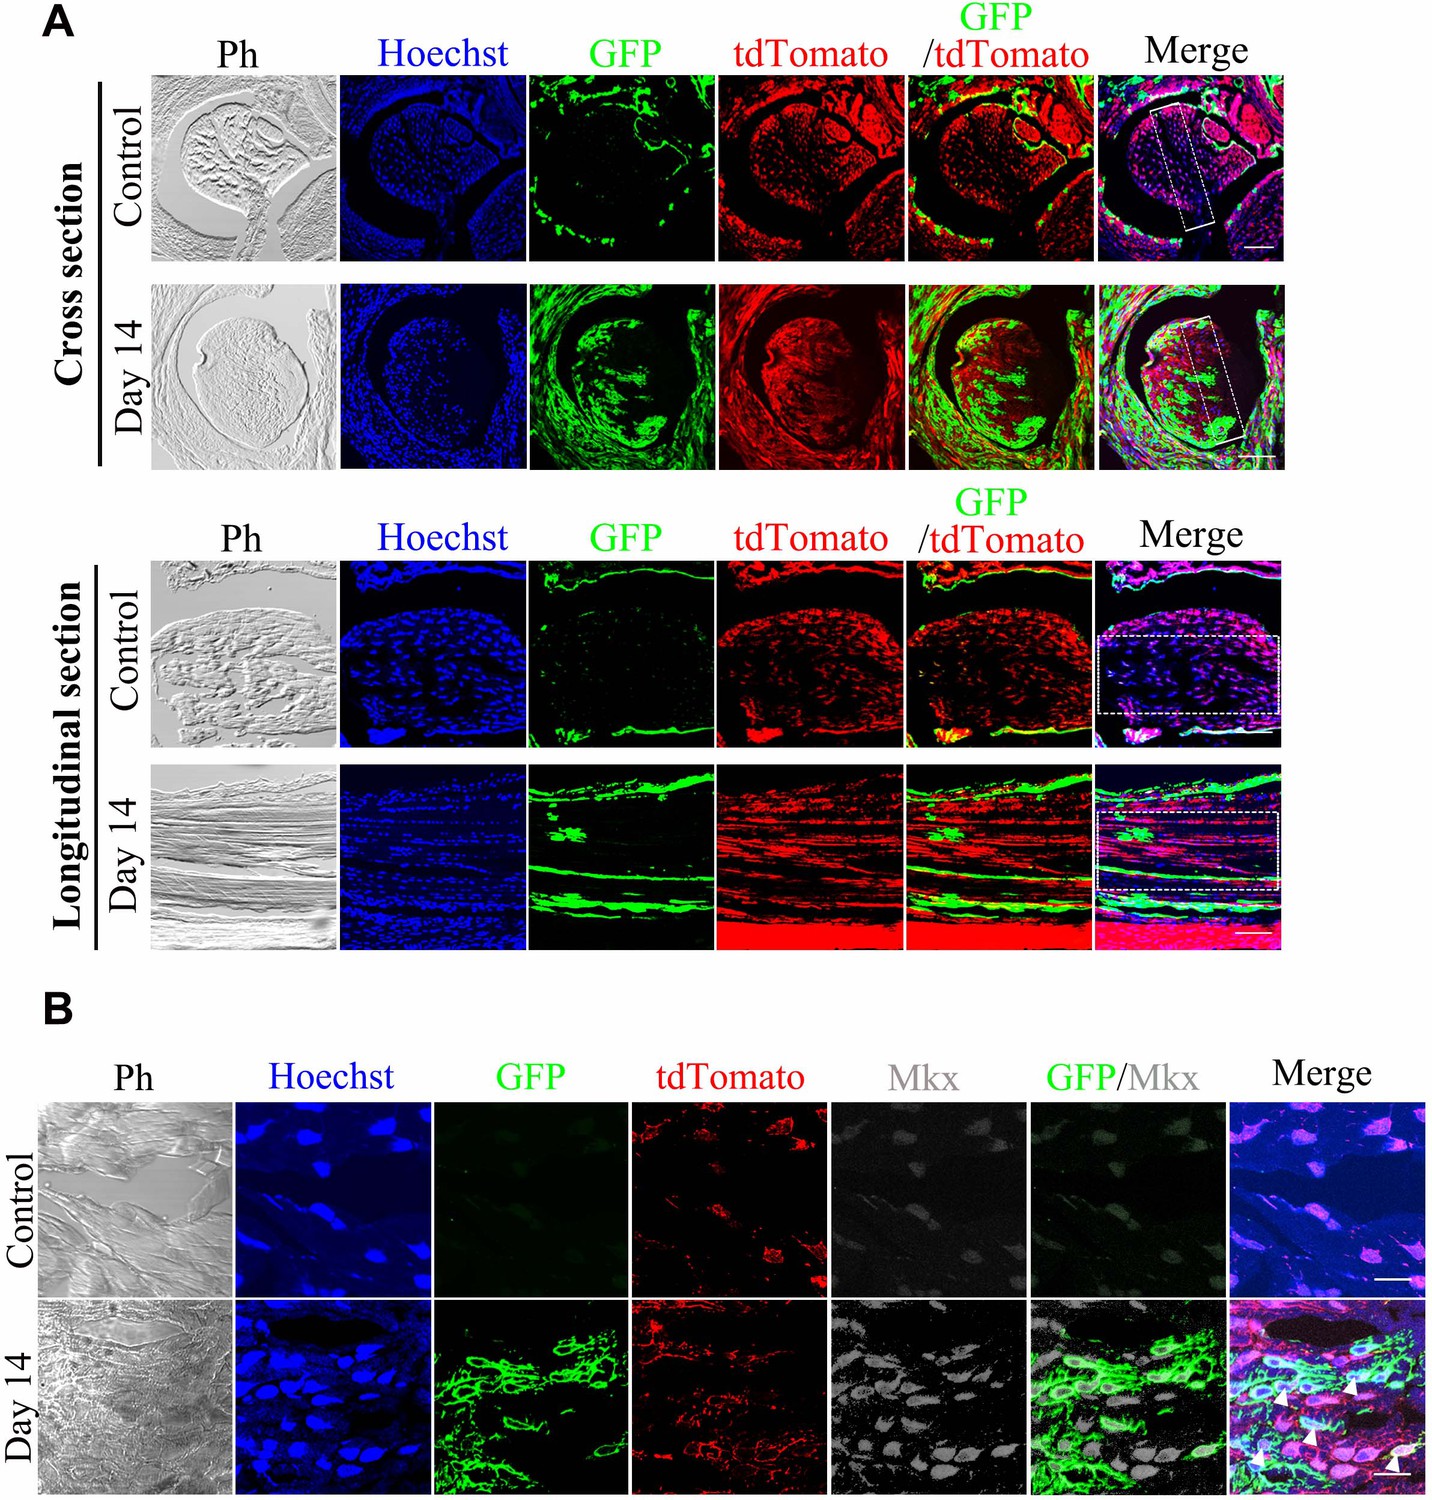
Tendon sheath tissues contribute to tendon repair.
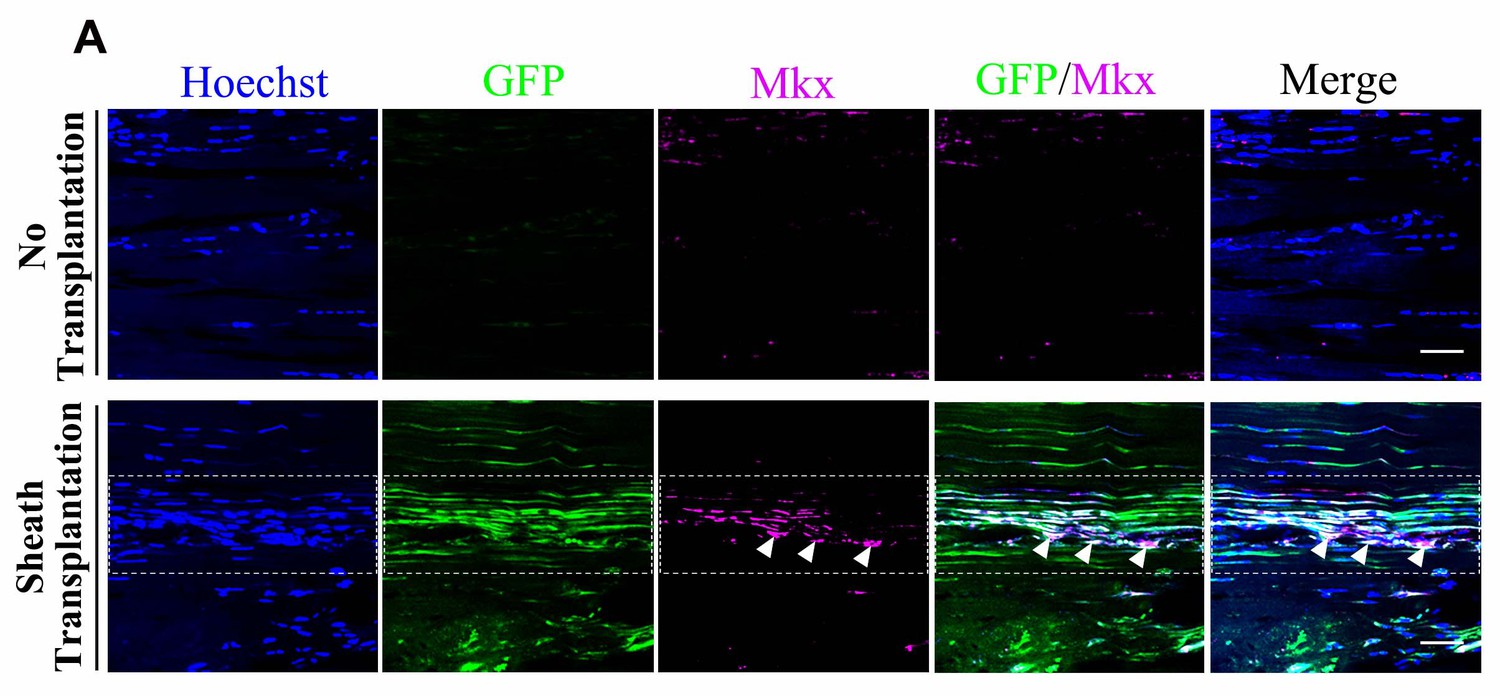
(A) Fluorescence analysis in cross- and longitudinal sections of the Tibialis anterior tendon of BGLAP-Cre;Rosa26mT/mG mice at Day 0 (Control) and Day 14 after injury(without grafting) (n = 3 mice per group). Boxed areas indicate the regions of the injury sites (dashed line). Scale bar, 100 μm. (B) Fluorescence analysis of Mkx in the BGLAP-Cre;Rosa26mT/mG mice Tibialis anterior tendon tissues at Day 0 (Control) and Day 14 after injury (n = 3 mice per group). White arrowheads point to GFP+/Mkx+ cells at the injured site of the BGLAP-Cre;Rosa26mT/mG mouse tendon tissues. Scale bar, 20 μm. (C) GFP+ Tibialis anterior tendon sheath tissues isolated from the BGLAP-Cre;Rosa26mT/mG mice formed tendon-like fibers at the injured Achilles tendon of immunocompromised mice after transplantation. Scale bar, 250 μm. Boxed regions of higher magnification are shown in the lower panel. Scale bar, 100 μm (n = 5 mice per group). (D) Histologic analysis of consecutive sections at the injured sites of the sheath transplantation group (bottom) and the no transplantation group (top) at Day 14 after injury (n = 5 mice). Boxed areas indicate the regions of the injury sites (dashed line). (E, F) Gene expression profiles of (E) tendon progenitor markers and (F) tendon extracellular matrix (ECM) components of the injured tendon at Day 14. Relative expression levels were normalized to Gapdh and the sham group. Data are means ± s.e.m and were analyzed using one-way analysis of variance (ANOVA) followed by Tukey’s multiple comparison test. **p≤0.0021; ***p≤0.0008; NS, not significant. n = 4 mice per group. (G) Hydroxyproline assay of Achilles tendon tissues 4 weeks after injury. Data are means ± s.e.m and were analyzed using one-way analysis of variance (ANOVA) followed by Tukey’s multiple comparison test. ***p≤0.0007. n = 5 mice per group. (H, I) Parameters of mechanical testing of tendon tissues in the sham, tendon-injured and tendon=injured with BGLAP-Cre;Rosa26mT/mG sheath transplantation groups at 4 weeks after surgery. Sheath transplantation represents GFP+ sheath-derived cells sorted from the BGLAP-Cre;Rosa26mT/mG mice. Data are means ± s.e.m and were analyzed using one-way analysis of variance (ANOVA) followed by Tukey’s multiple comparison test. ***p≤0.001, *p≤0.0228. n ≥ 8 mice per group. (J) Co-localization of Mkx and BGLAP-Cre/GFP at the injured sites of the nude mice tendon tissues with or without the sheath transplantation at Day 14 after injury (n = 5 mice per group). White arrowheads point to GFP+/Mkx+ cells at the injured site of the nude mice tendon tissues with BGLAP-Cre;Rosa26mT/mG sheath transplantation. Boxed areas indicate the regions of the injury sites (dashed line). Scale bar, 20 μm. (K) Gene-expression profiles of tendon progenitor markers and ECM components of FACS-sorted GFP+ cells from the nude mice injured tendons with BGLAP-Cre;Rosa26mT/mG sheath transplantation at Day 14. Sheath controls were the FACS-sorted GFP+ cells directly from BGLAP-Cre;Rosa26mT/mG sheath tissues. Relative expression levels were normalized to β-tubulin and the sheath control group. Data are means ± s.e.m and were analyzed using Student’s t-tests. *p≤0.0383; NS, not significant. n = 3 replicates per group.
-
Figure 3—source data 1
Source data relating to Figure 3E.
- https://doi.org/10.7554/eLife.30474.018
-
Figure 3—source data 2
Source data relating to Figure 3F.
- https://doi.org/10.7554/eLife.30474.019
-
Figure 3—source data 3
Source data relating to Figure 3G.
- https://doi.org/10.7554/eLife.30474.020
-
Figure 3—source data 4
Source data relating to Figures 3H and 3I.
- https://doi.org/10.7554/eLife.30474.021
-
Figure 3—source data 5
Source data relating to Figure 3K.
- https://doi.org/10.7554/eLife.30474.022
Figure 3—figure supplement 1
BGLAP-Cre/GFP+cells contribute to tendon repair in BGLAP-Cre; Rosa26mT/mG mice.
(A) Fluorescence analysis of all channels in cross- and longitudinal sections of the Tibialis anterior tendon of the BGLAP-Cre;Rosa26mT/mG mice at Day 0 (Control) and Day 14 after injury (without grafting) (n = 3 mice per group). Boxed areas indicate the regions of the injury sites (dashed line). Scale bar, 100 μm. (B) Fluorescence analysis of all channels of Mkx in the BGLAP-Cre;Rosa26mT/mG mice Tibialis anterior tendon tissues at Day 0 (Control) and Day 14 after injury (n = 3 mice per group). White arrowheads point to GFP+/Mkx+ cells at the injured site of the BGLAP-Cre;Rosa26mT/mG mouse tendon tissues. Scale bar, 20 μm.
Figure 3—figure supplement 2
GFP+sheath cells differentiate into Mkx-expressing cells and contribute to tendon repair.
(A) Co-localization of Mkx and BGLAP-Cre/GFP at the injured sites of the nude mouse tendon tissues with or without the sheath transplantation at Day 14 after injury for all channels (n = 5 mice per group). White arrowheads point to GFP+/Mkx+ cells at the injured site of the nude mice tendon tissues with BGLAP-Cre;Rosa26mT/mG sheath transplantation. Boxed areas indicate the regions of the injury sites (dashed line). Scale bar, 20 μm.
Figure 4
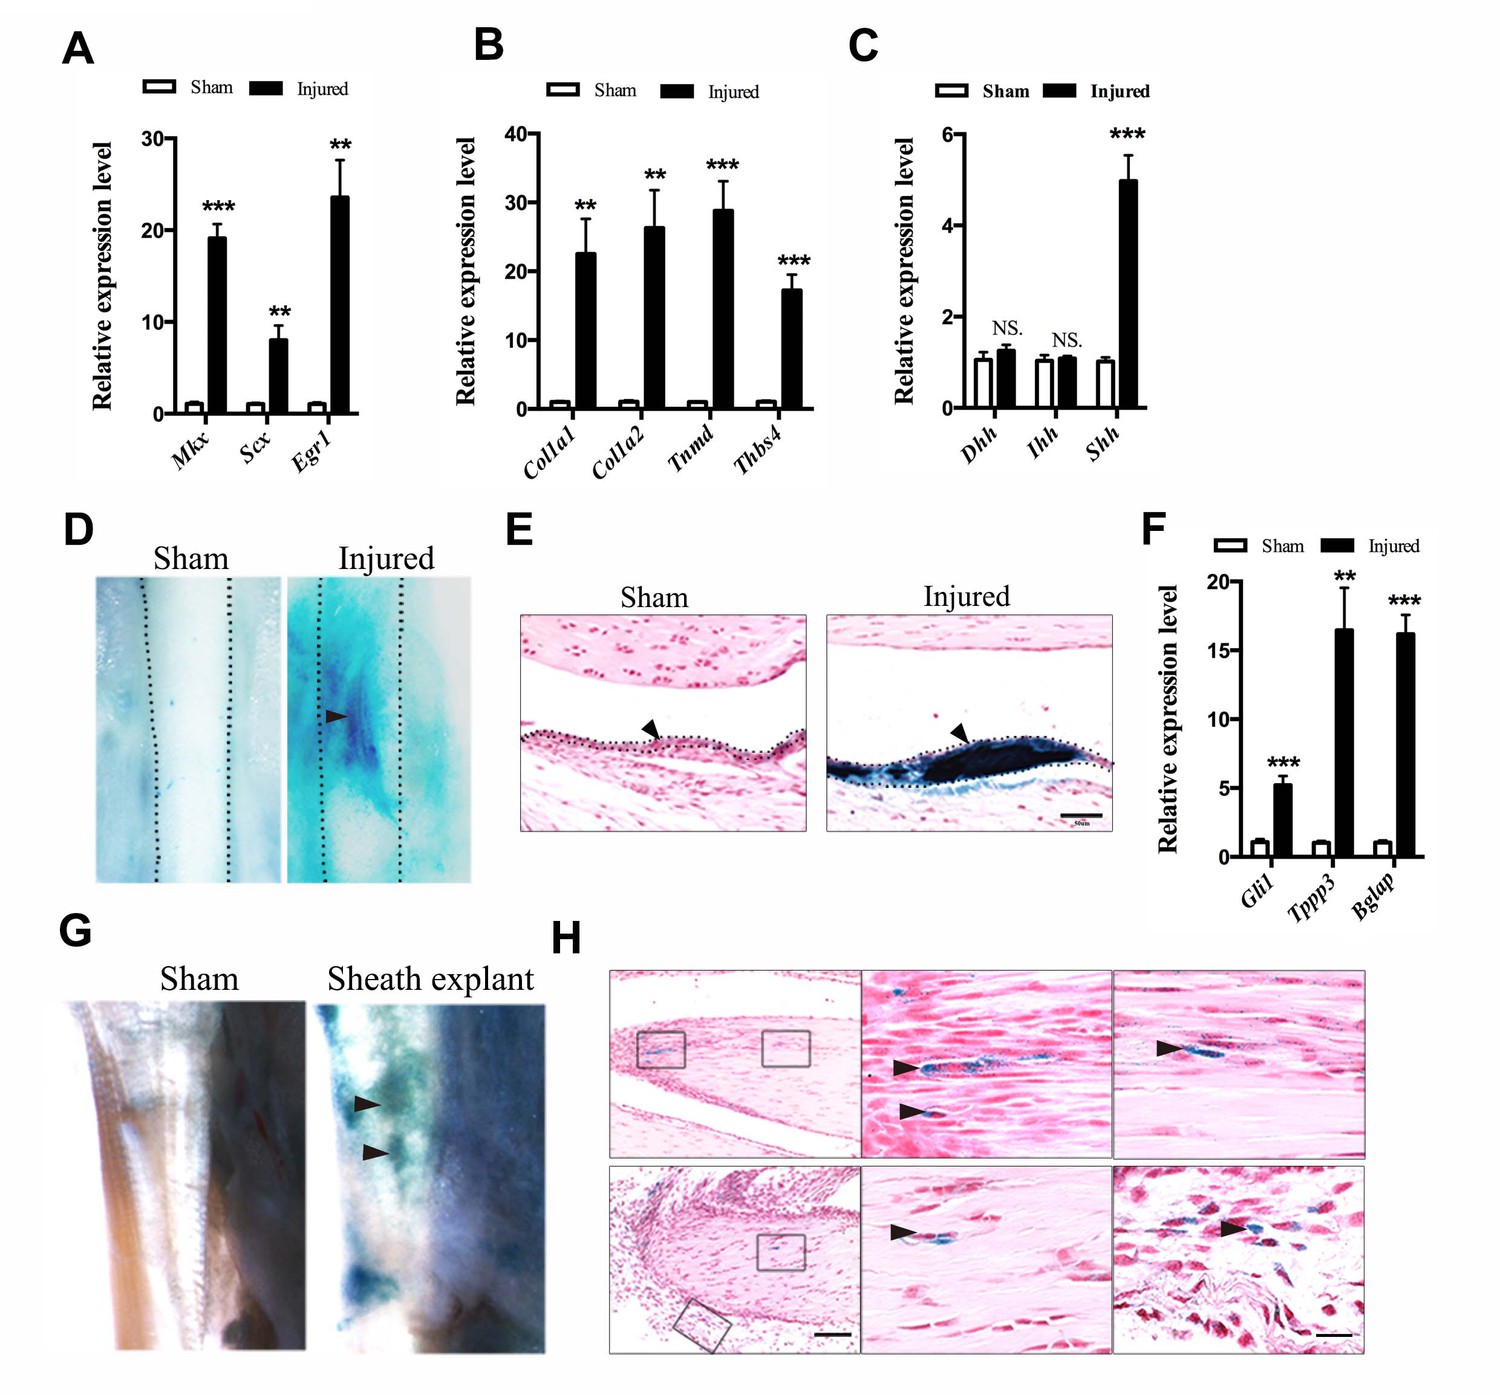
Activation of Hh signaling in sheath tissues upon injury.
(A, B) Gene expression profiles of (A) tendon progenitor markers and (B) ECM components in the tendon sheath tissues of wild-type mice two weeks after injury. Relative expression levels were normalized to β-tubulin and the sham group. Data are means ± s.e.m and were analyzed using Student’s t-tests. **p≤0.0055; ***p≤0.0006. n = 4 mice per group. (C) Gene expression profiles of Hh ligands in the sheath tissues one week after injury. Relative expression levels were normalized to Gapdh and the sham group. Data are means ± s.e.m and were analyzed using Student’s t-tests. ***p≤0.0001; NS, not significant. n = 6 mice per group. (D) X-gal (USB Corporation, USA) staining of the Tibialis anterior tendon of Ptch1LacZ/+ mice two weeks after injury. Strong signals were observed in the sheath tissues of the injured site (arrowhead). Dotted lines depict the boundaries of tendon tissues (n = 5 mice per group). (E) Cross-section of the injured sheath tissues as shown in (D) (n = 5 mice per group). Dotted lines depict the boundaries of the sheath tissues. Scale bar, 50 μm. (F) Gene expression profiles in the tendon sheath tissues of wild-type mice two weeks after injury. Relative expression levels were normalized to β-tubulin and the sham group. Data are means ± s.e.m and were analyzed using Student’s t-tests. **p≤0.0025; ***p≤0.001. n = 4 mice per group. (G) Ptch1LacZ/+ sheath tissues transplanted to the injured Achilles tendon of immunocompromised mice after two weeks (n = 5 mice per group). (H) Histologic analysis of the injured tendon fibers as shown in (G). Scale bar, 100 μm. Boxed areas are shown in high magnification on the right. The lower right panel depicts the boxed area from the surrounding tissues. Arrowheads point to LacZ+ cells within the tendon fibers (n = 5 mice per group). Scale bar, 20 μm.
-
Figure 4—source data 1
Source data relating to Figure 4A.
- https://doi.org/10.7554/eLife.30474.024
-
Figure 4—source data 2
Source data relating to Figure 4B.
- https://doi.org/10.7554/eLife.30474.025
-
Figure 4—source data 3
Source data relating to Figure 4C.
- https://doi.org/10.7554/eLife.30474.026
-
Figure 4—source data 4
Source data relating to Figure 4F.
- https://doi.org/10.7554/eLife.30474.027
Figure 5 with 1 supplement
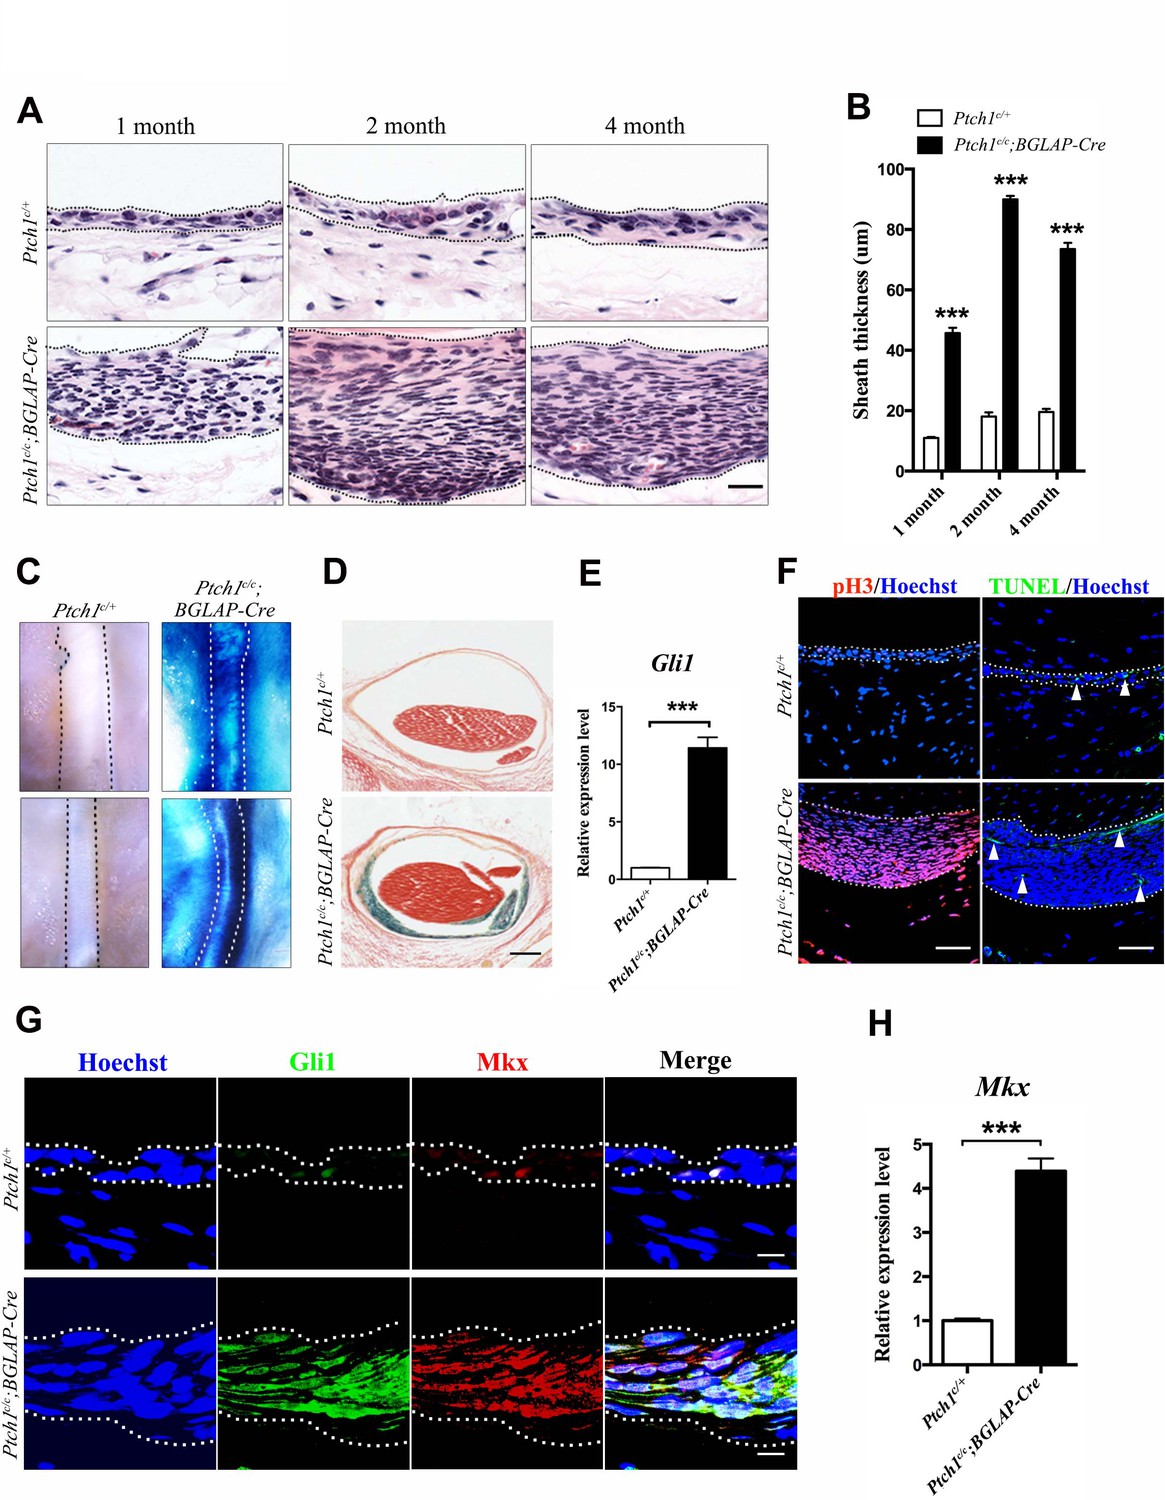
Activated Hh signaling increases cell proliferation in sheath tissues.
(A) Histologic analysis of the sheath tissues of the Tibialis anterior tendon of different mice genotypes at multiple time points. Scale bar, 20 μm. (B) Statistical analyses of the sheath thickness data illustrated in (A). Data are means ± s.e.m and were analyzed using Student’s t-tests. ***p<0.0001. n = 10 biological replicates per group. (C) X-gal staining of the sheath tissues of the Tibialis anterior tendon (upper panel) and the Peroneus longus tendon (lower panel) of mice of different genotypes at 3 months old (n = 6 mice per group). (D) Cross-sections of the Tibialis anterior tendon sheath tissues at Day 21 with X-gal staining (n = 6 mice per group). Scale bar, 100 μm. (E) QRT-PCR analysis of Hh activity in the sheath tissues. Relative expression levels were normalized to Gapdh and the Ptch1c/+ group. Data are means ± s.e.m and were analyzed using a Student’s t-test. ***p≤0.0004. n = 3 mice per group. (F) Fluorescent immunohistochemistry of cell proliferation (pH3) and apoptosis (TUNEL) of the sheath tissues at 2 months old of mice with genotypes as shown (n = 3 mice per group). White arrowheads point to apoptotic cells in the sheath tissues. Scale bar, 40 μm. (G) Co-localization of Gli1 and Mkx expression in the sheath tissues of mice with genotypes as shown (n = 3 mice per group). Scale bar, 10 μm. (H) Gene expression analysis of Mkx in the sheath tissues illustrated in (G). Relative expression levels were normalized to Gapdh and the Ptch1c/+ group. Data are means ± s.e.m and were analyzed using a Student’s t-test. ***p≤0.0007. n = 3 mice per group. Dotted lines depict the boundaries of sheath tissues. Additional data for this figure are provided in Figure 5—figure supplement 1.
-
Figure 5—source data 1
Source data relating to Figure 5B.
- https://doi.org/10.7554/eLife.30474.031
-
Figure 5—source data 2
Source data relating to Figure 5E.
- https://doi.org/10.7554/eLife.30474.032
-
Figure 5—source data 3
Source data relating to Figure 5H.
- https://doi.org/10.7554/eLife.30474.033
Figure 5—figure supplement 1
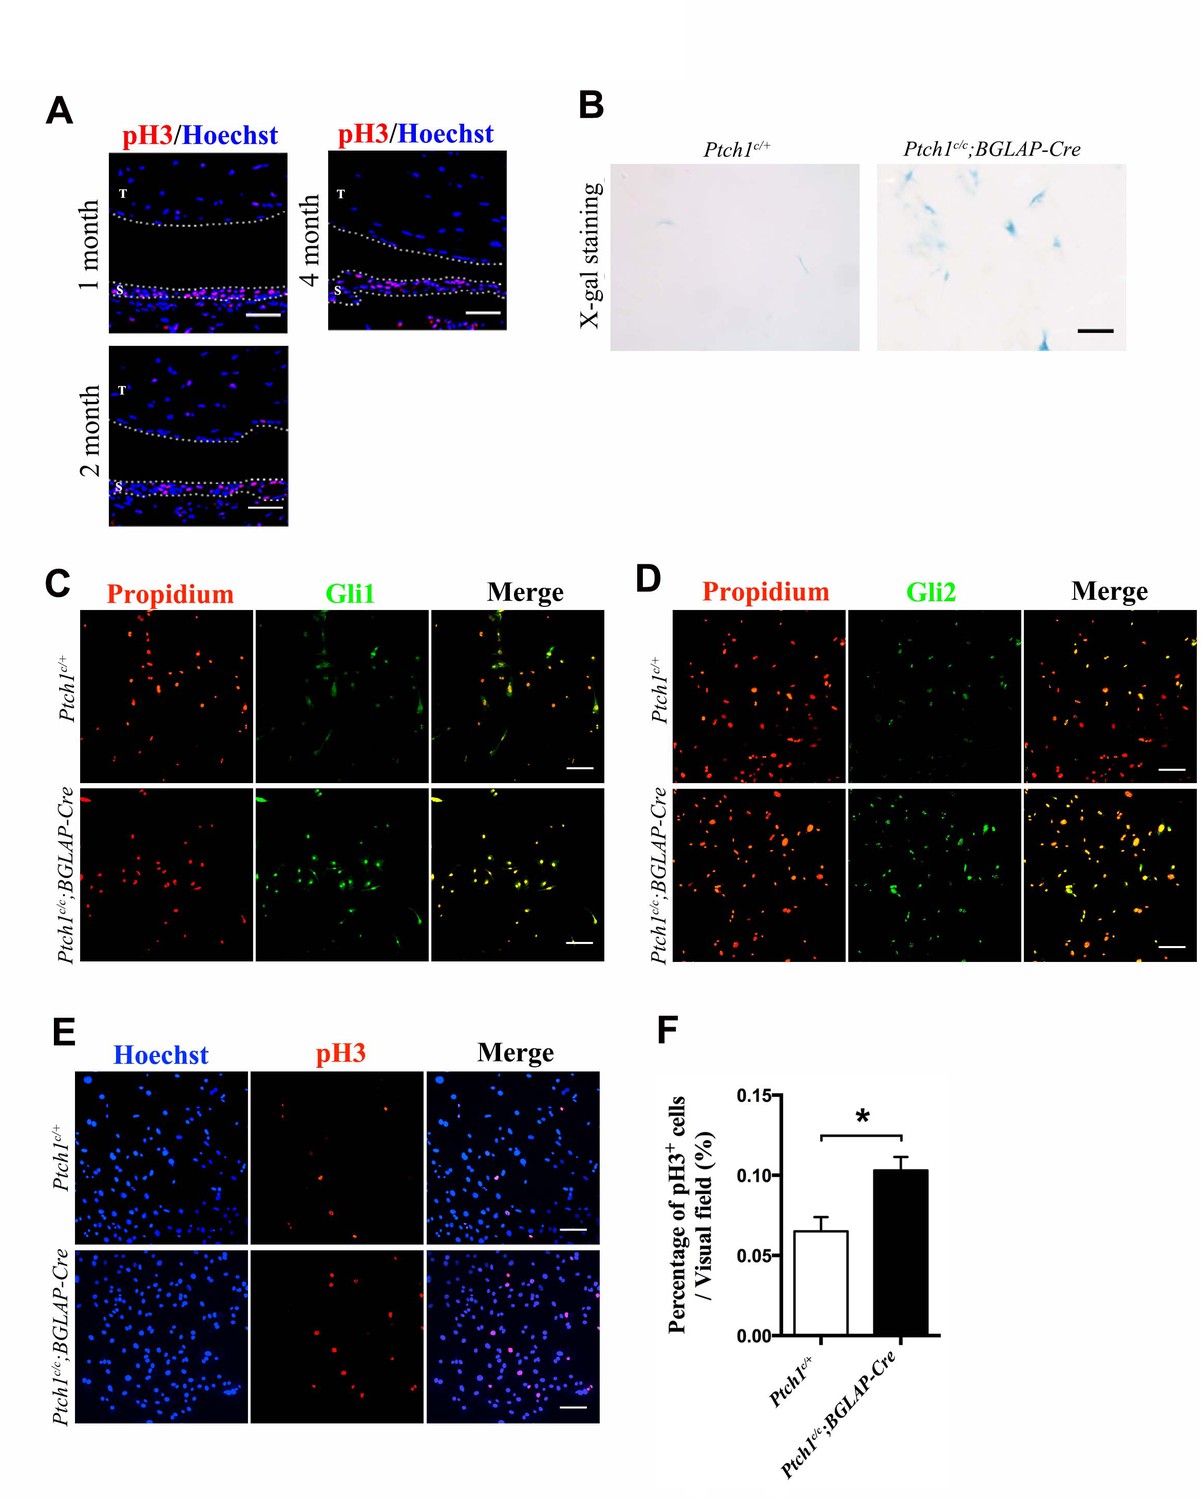
Hh signaling increases sheath cell proliferation.
(A) Fluorescent immunohistochemistry of pH3 in wild-type adult tendons. Sheath-derived cells displayed a higher cell proliferation rate than tendon fibers. T: tendon fibers; S: sheath tissues. Dotted lines depict the boundary of the tissues (n = 3 mice per group). Scale bar, 40 μm. (B) X-gal staining of primary cells isolated from the sheath tissues of the Ptch1c/c;BGLAP-Cre mutant mice (n = 3 per group). Scale bar, 10 μm. (C) Fluorescent immunocytochemistry of Gli1 in primary sheath cells isolated from mice with genotypes as shown. Scale bar, 100 μm. (D) Fluorescent immunocytochemistry of Gli2 in primary sheath cells isolated from mice with genotypes as shown. Scale bar, 100 μm. (E) Fluorescent immunocytochemistry of pH3 in primary sheath cells isolated from mice with genotypes as shown. Primary tendon sheath cells isolated from the Ptch1c/c;BGLAP-Cre mutant mice displayed increased cell proliferation. Scale bar, 100 μm. (F) Statistical analysis of cell proliferation as shown in (E). Data are means ± s.e.m and were analyzed using a Student’s t-test. *p≤0.0111. n = 6 biological replicates per group.
-
Figure 5—figure supplement 1—source data 1
Source data relating to Figure 5—figure supplement 1F.
- https://doi.org/10.7554/eLife.30474.030
Figure 6
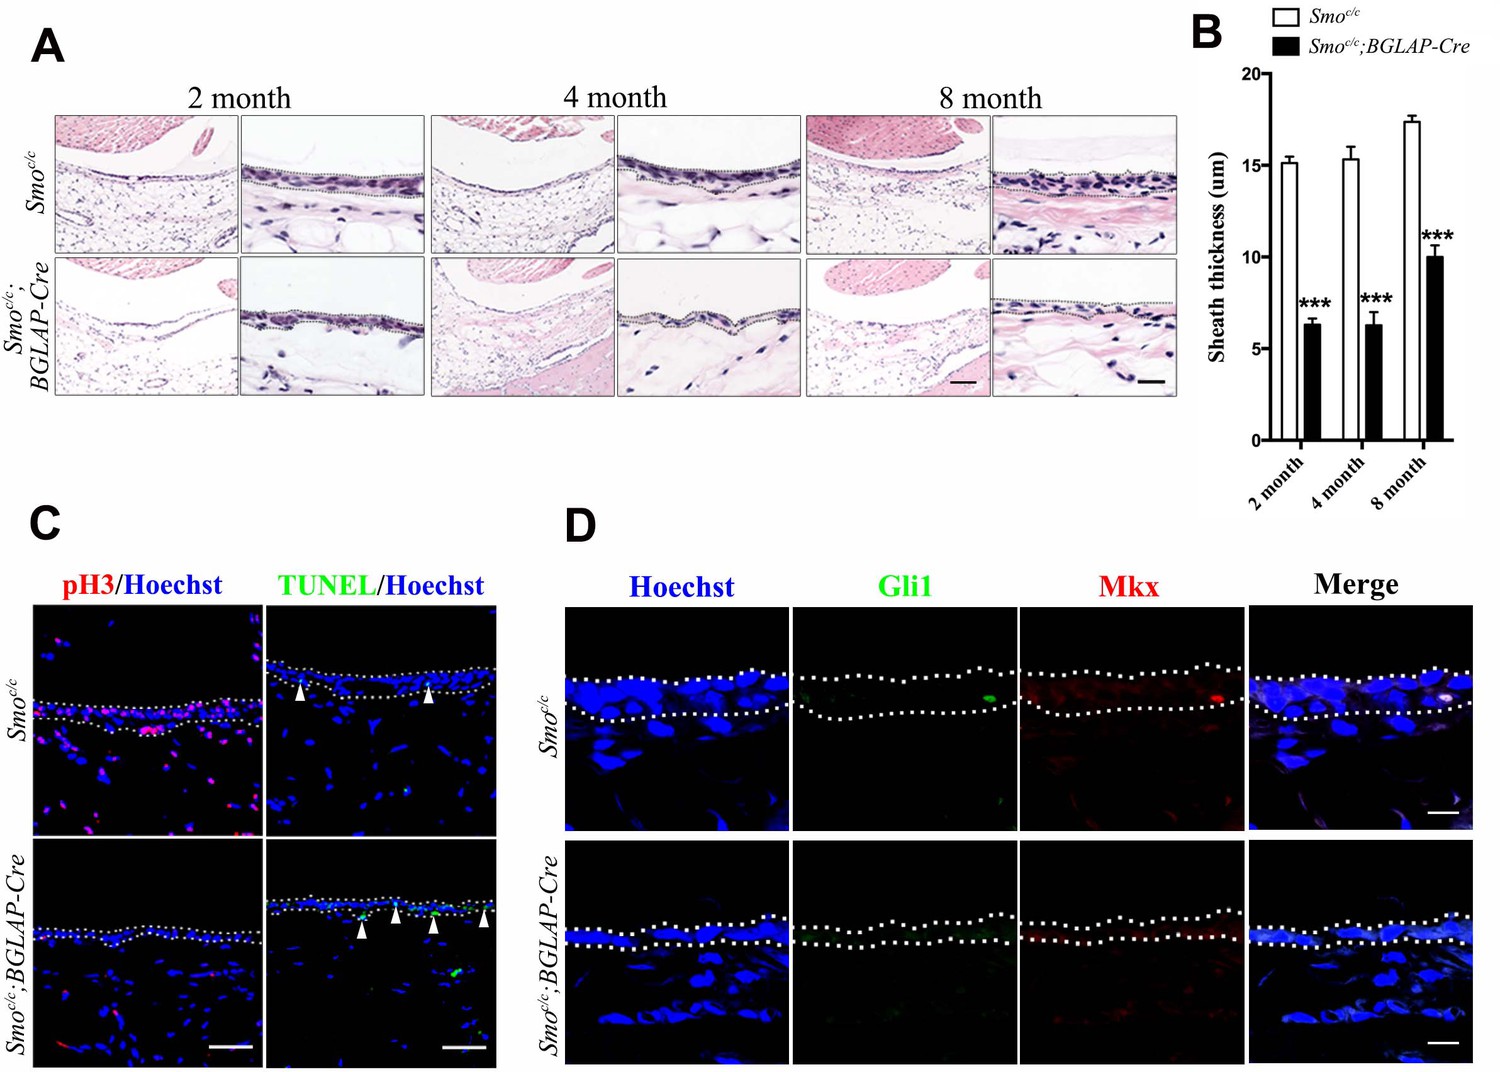
Hh signaling is necessary for sheath cell proliferation.
(A) Histologic analysis of the sheath tissues of the Tibialis anterior tendon of mice with genotypes as shown. Scale bar, 100 μm. Higher magnification is shown on the right. Scale bar, 20 μm. (B) Statistical analysis of sheath thickness as shown in (A). Data are means ± s.e.m and were analyzed using Student’s t-tests. ***p<0.0001. n = 10 biological replicates per group. (C) Fluorescent immunohistochemistry of sheath tissues showing the cell proliferation (pH3) and apoptosis (TUNEL) of mice with genotypes as shown. White arrowheads point to apoptotic cells in sheath tissues (n = 3 mice per group). Scale bar, 40 μm. (D) Immunohistochemistry of Gli1 and Mkx expression in the sheath tissues of mice with genotypes as shown (n = 3 mice per group). Scale bar, 10 μm. Dotted lines depict the boundaries of sheath tissues.
-
Figure 6—source data 1
Source data relating to Figure 6B.
- https://doi.org/10.7554/eLife.30474.035
Figure 7 with 1 supplement

Hh signaling is required for sheath-mediated tendon repair.
(A) Histologic analysis of the Tibialis anterior tendon of mice with genotypes as shown 4 weeks after injury (n = 4 mice per group). Scale bar, 400 μm. Higher magnifications of the boxed regions are shown on the right. Scale bar, 50 μm. Arrowheads point to the sheath tissues. (B) Fluorescent immunohistochemistry of Gli1 and Mkx expression in the sheath tissues as shown in (A) (n = 4 mice per group). Scale bar, 20 μm. (C) Histologic analysis of Tibialis anterior tendon fibers of mice with genotypes as shown 4 weeks after injury. Scale bar, 50 μm. Higher magnification is shown on the right (n = 4 mice per group). Scale bar, 20 μm. (D) Fluorescent immunohistochemistry of cell proliferation (pH3) of the tendons of mice with genotypes as shown in (C) (n = 4 mice per group). Scale bar, 40 μm. (E) Hydroxyproline assay using Tibialis anterior tendon tissues 4 weeks after injury. Data are means ± s.e.m and were analyzed using one-way analysis of variance (ANOVA) followed by Tukey’s multiple comparison test. ***p≤0.0001. n = 4 mice per group. (F) Fluorescent immunohistochemistry of Gli1 and Mkx of the Tibialis anterior tendon fibers of mice with genotypes as shown 4 weeks after injury (n = 4 mice per group). *, non-specific signals. Scale bar, 20 μm. Additional data for this figure are provided in Figure 7—figure supplement 1.
-
Figure 7—source data 1
Source data relating to Figure 7E.
- https://doi.org/10.7554/eLife.30474.040
Figure 7—figure supplement 1
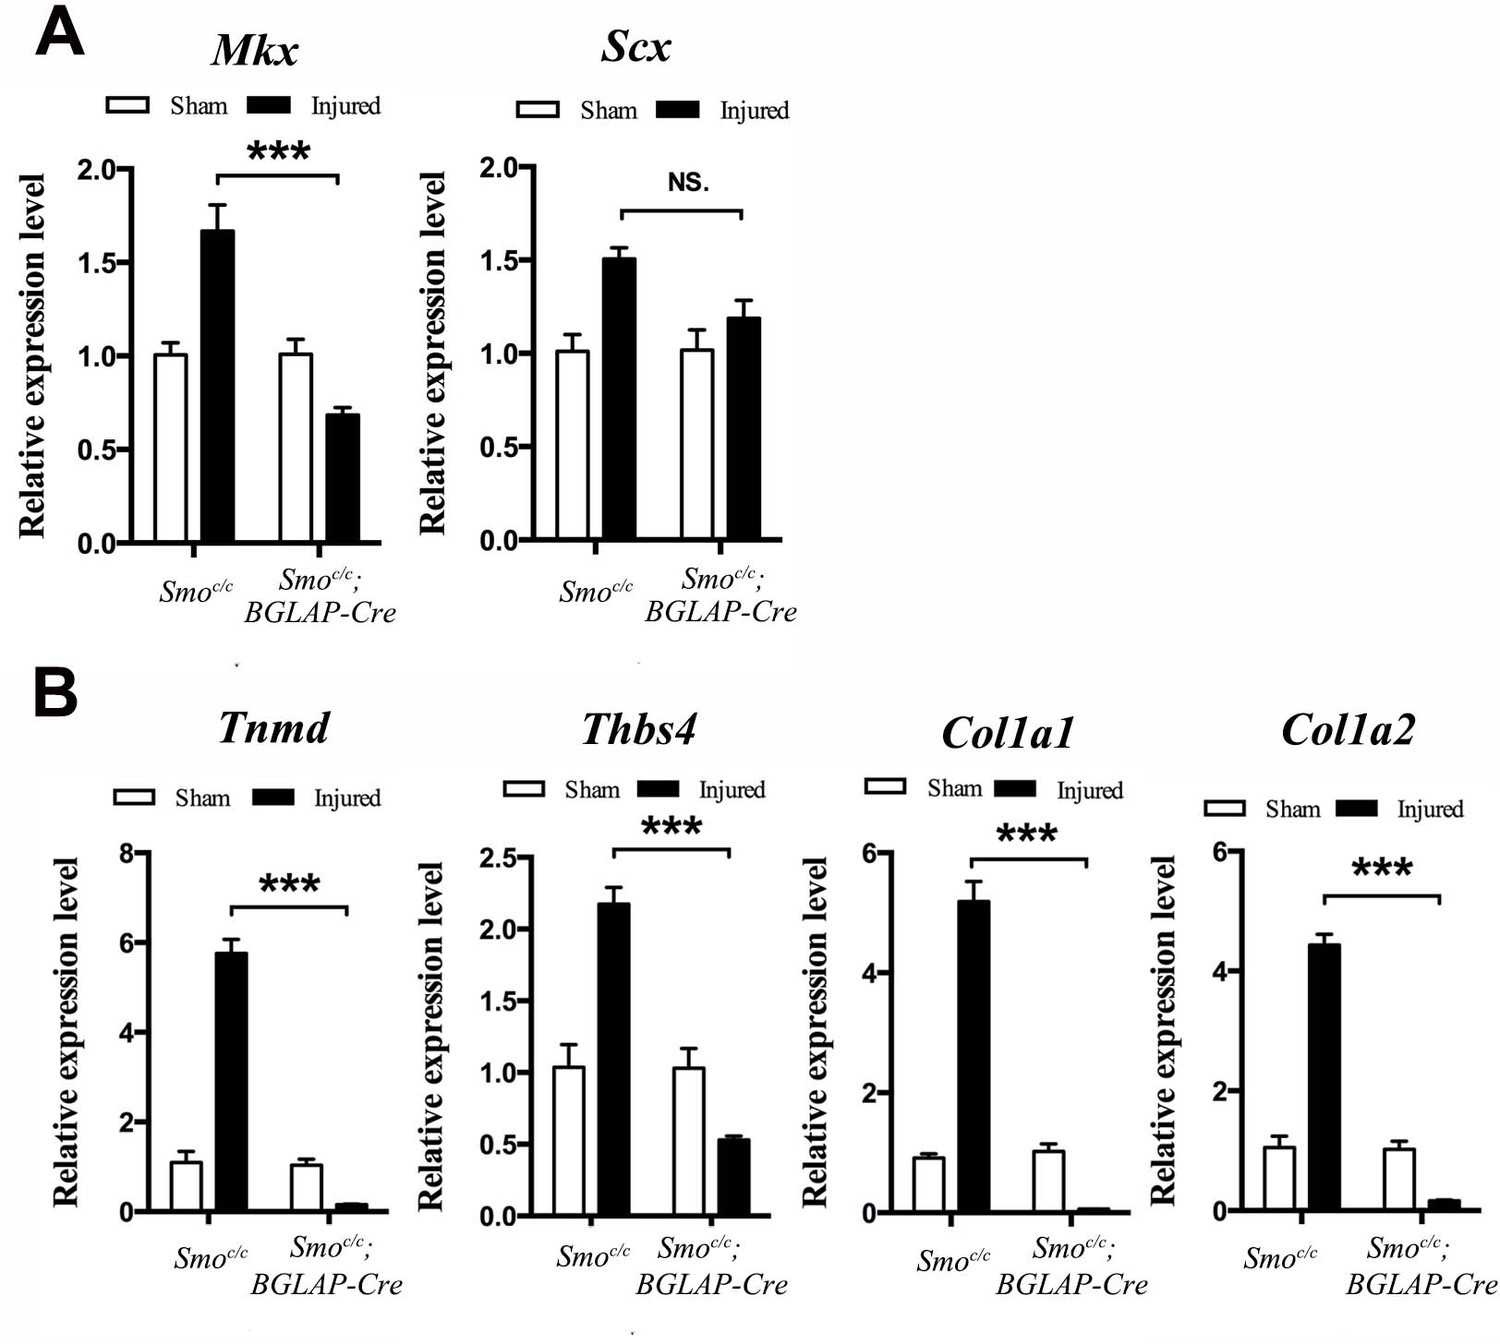
Tendon repair is significantly impaired in the Smoc/c;BGLAP-Cre mutant mice after injury.
(A, B) Gene expression profiles of the injured Tibialis anterior tendon fibers of (A) tendon progenitor markers and (B) tendon ECM components of mice (n = 4 mice per group) with genotypes as shown. Relative expression levels were normalized to Gapdh and the Smoc/c sham group. Data are means ± s.e.m and were analyzed using one-way analysis of variance (ANOVA) followed by Tukey’s multiple comparison test. ***p≤0.0001; NS, not significant. n = 4 mice per group.
-
Figure 7—figure supplement 1—source data 1
Source data relating to Figure 7—figure supplement 1A.
- https://doi.org/10.7554/eLife.30474.038
-
Figure 7—figure supplement 1—source data 2
Source data relating to Figure 7—figure supplement 1B.
- https://doi.org/10.7554/eLife.30474.039
Figure 8

Hh activation upregulates Mkx and Collagen I via TGFβ/Smad3 signaling.
(A, C) Gene expression profiling using primary Ptch1c/c sheath cells infected with Cre-adenovirus for 48 hr. Relative expression levels were normalized to β-tubulin and the Ad-GFP group. Data are means ± s.e.m and were analyzed using Student’s t-tests. *p≤0.0394; **p≤0.0028; ***p≤0.0009. n = 3 biological replicates per group. (B, D) Gene expression profiling using BGLAP-Cre;Rosa26mT/mG sorted GFP+ primary sheath cells treated with the Hh agonist purmorphamine (1000 nM, Millipore, USA) for 48 hr. Relative expression levels were normalized to β-tubulin and the control group. Data are means ± s.e.m and were analyzed using Student’s t-tests. *p≤0.0213; **p≤0.0085; ***p≤0.0007. n = 3 biological replicates per group. (E) Western blot analysis of protein expression in primary sheath cells of Ptch1c/c and Ptch1c/c;BGLAP-Cre mice (n = 3 per group).
-
Figure 8—source data 1
Source data relating to Figure 8A.
- https://doi.org/10.7554/eLife.30474.042
-
Figure 8—source data 2
Source data relating to Figure 8B.
- https://doi.org/10.7554/eLife.30474.043
-
Figure 8—source data 3
Source data relating to Figure 8C.
- https://doi.org/10.7554/eLife.30474.044
-
Figure 8—source data 4
Source data relating to Figure 8D.
- https://doi.org/10.7554/eLife.30474.045
Figure 9
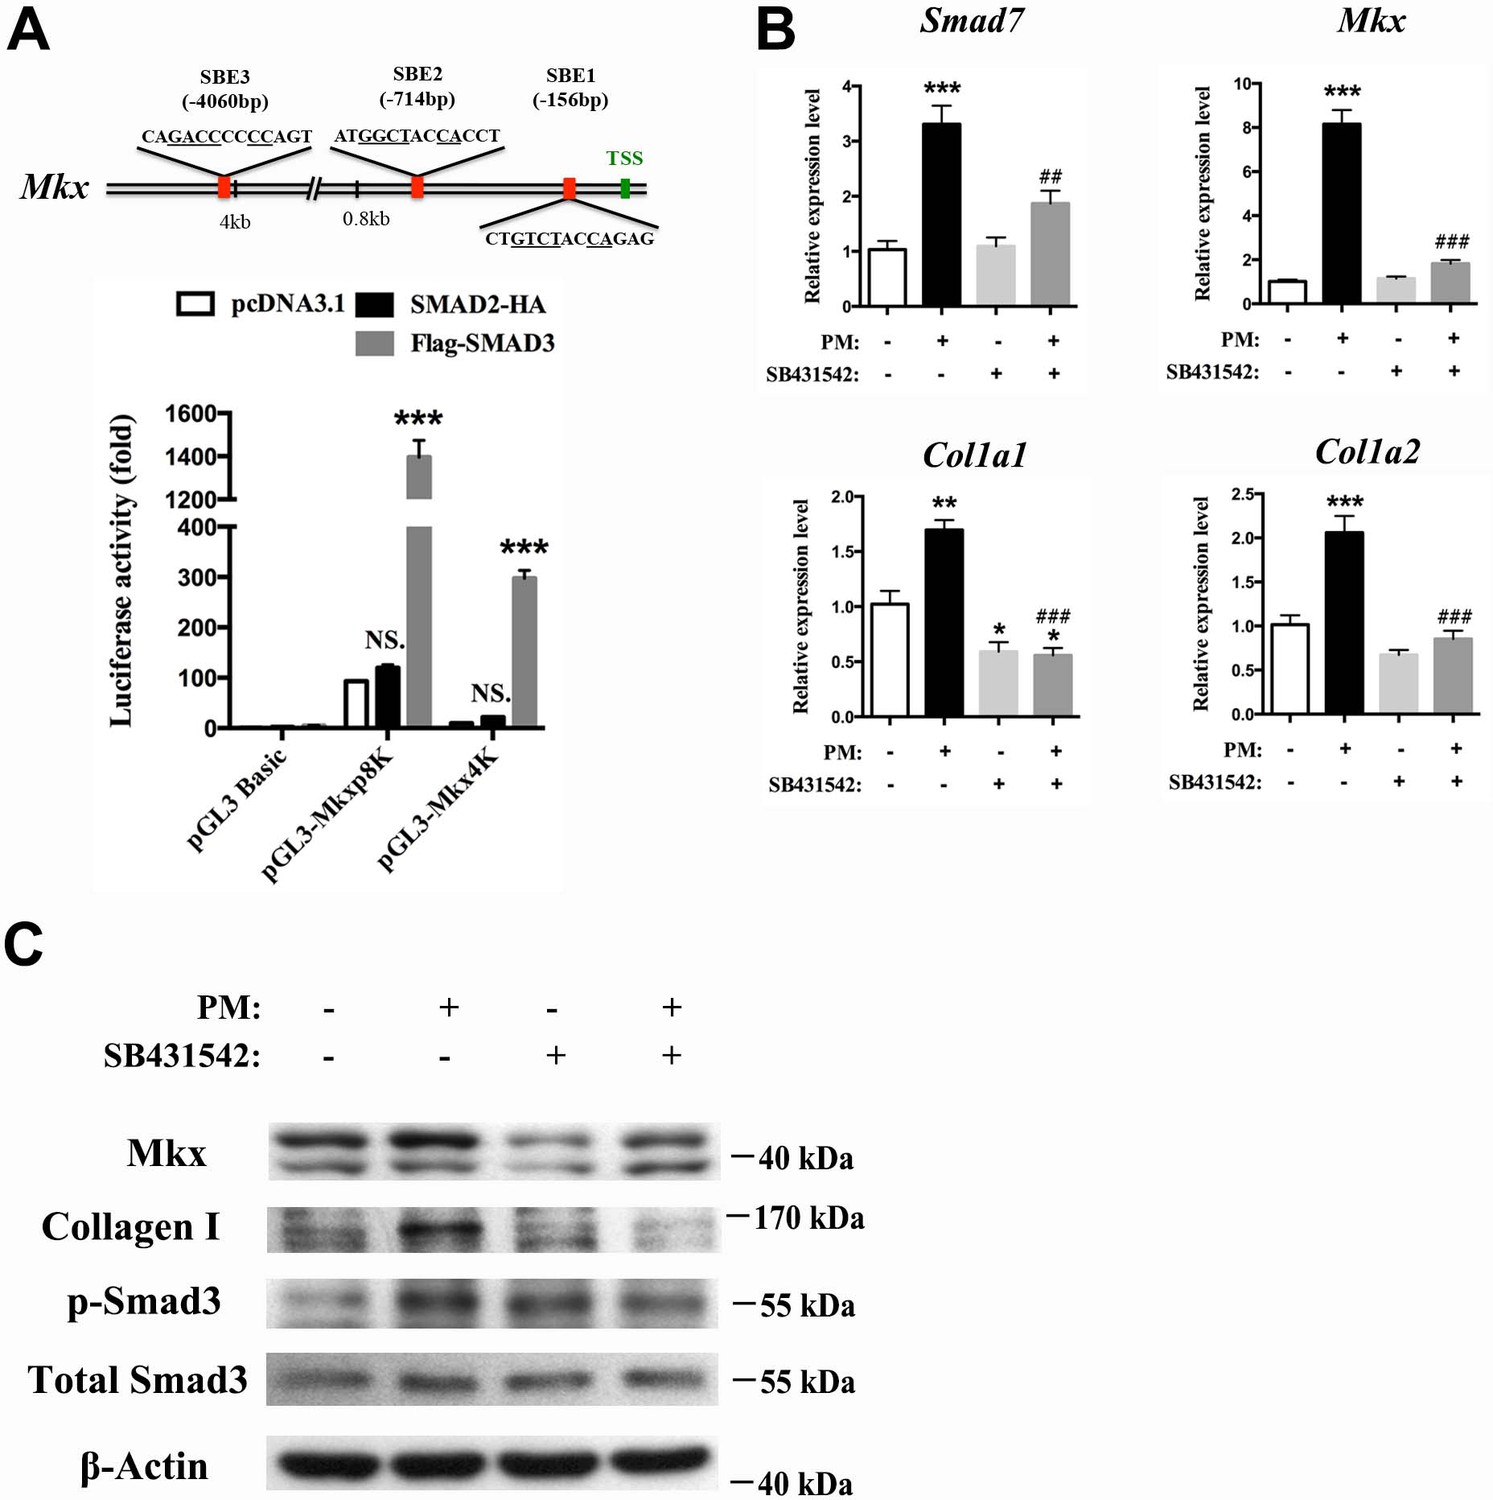
Hh activation upregulates Mkx and Collagen I via TGFβ/Smad3 signaling.
(A) (Upper panel) Schematic diagram of putative Smad-binding element (SBE) motifs in the promoter region of Mkx. (TSS, transcription start site; the canonical Smad-binding conserved sequence GT/GCTNNCA is underlined). (Lower panel) Dual-luciferase assay of Mkx activities using reporter plasmids with 0.8 kb (pGL3-Mkxp8K with two Smad binding sites) or 4060 bp (pGL3-Mkx4K with three Smad binding sites) of Mkx promoter regions with SMAD2 or SMAD3 overexpression, respectively, in HEK293T cells. Data are means ± s.e.m and were analyzed using two-way analysis of variance (ANOVA) followed by Tukey’s multiple comparison test. ***p≤0.0001; NS, not significant. n = 3 biological replicates per group. (B) QRT-PCR analysis of the TGFβ/Smad3 signaling target gene Smad7, the tendon progenitor Mkx and the main ECM components Col1a1 and Col1a2 in primary sheath cells treated with purmorphamine (PM) (1000 nM), with or without specific type I TGFβ receptor inhibitor SB431542 pre-treatment (10 μM, 1 hr). Relative expression levels were normalized to β-tubulin and the control group. Data are means ± s.e.m and were analyzed using one-way analysis of variance (ANOVA) followed by Tukey’s multiple comparison test. *p≤0.0293; **p≤0.0012; ***p≤0.0003; ## p≤0.0045; ### p≤0.0001. (*, comparison with control group; #, comparison with PM treatment). n = 3 biological replicates per group. (C) Western blot analysis of protein expression in sheath primary cells (n = 3 per group).
-
Figure 9—source data 1
Source data relating to Figure 9A.
- https://doi.org/10.7554/eLife.30474.047
-
Figure 9—source data 2
Source data relating to Figure 9B.
- https://doi.org/10.7554/eLife.30474.048
Figure 10
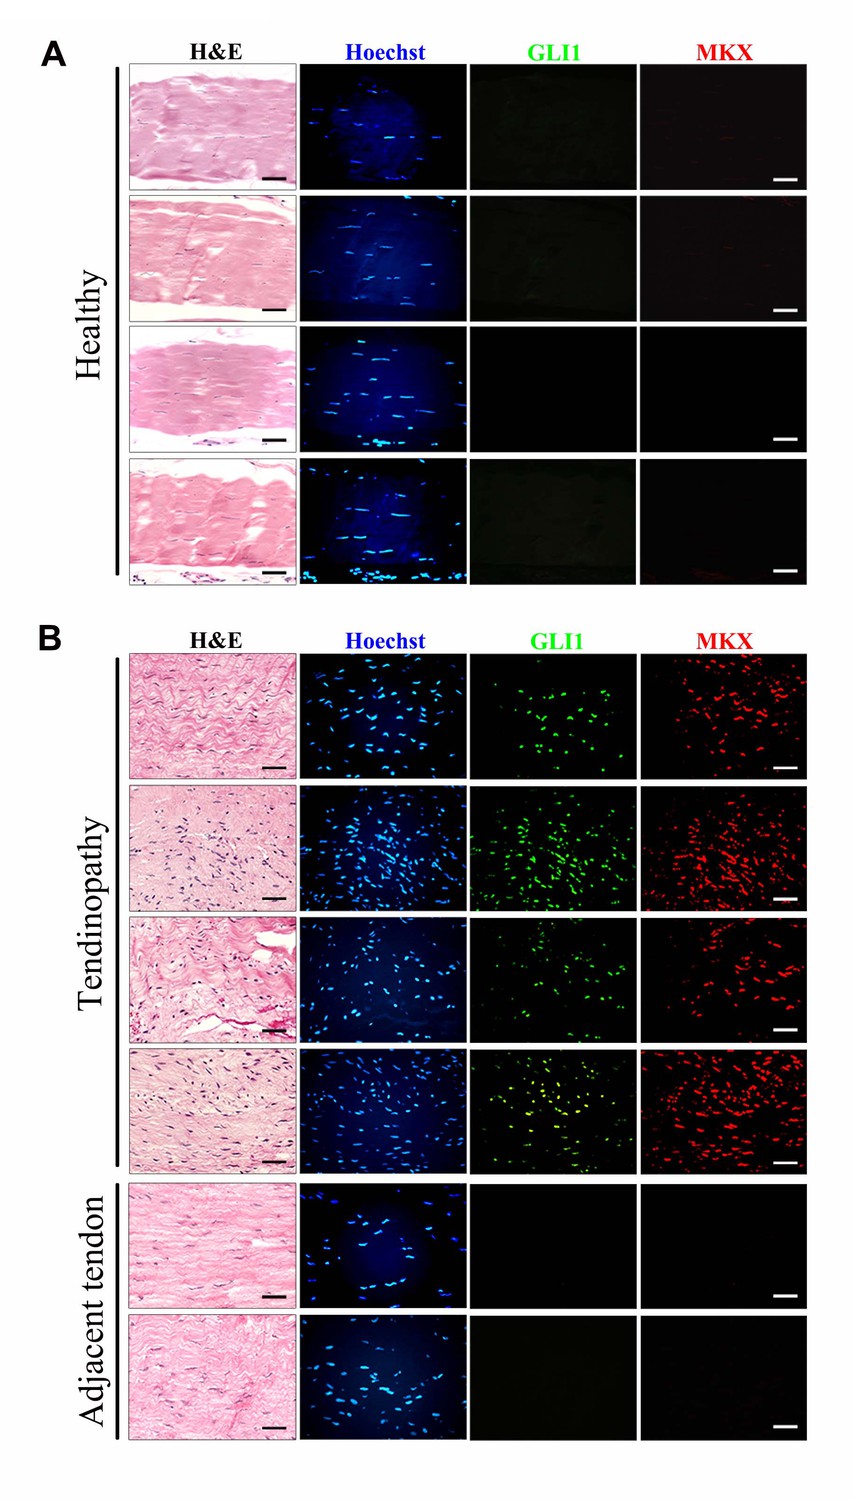
Upregulation of GLI1 and MKX expression in human tendinopathy specimens.
(A, B) Fluorescent immunohistochemistry of GLI1 and MKX in (A) healthy patellar tendon tissues or (B) patellar tendinopathy tissues. The bottom images show two regions adjacent to the injured tissues and are representative of the tendon tissues of ‘tendinopathy’ patients. Different rows indicate samples from different healthy subjects or patients. (n = 7 healthy subjects or patients per group.)
Tables
Key resources table
| Reagent type (species) or resource | Designation | Source or reference | Identifiers |
|---|---|---|---|
| Genetic reagent (Mus musculus) | BGLAP-Cre;Rosa26mT/mG | This paper | NA |
| Genetic reagent (M. musculus) | Ptch1c/c;BGLAP-Cre | Mak et al. (2006) | PMID: 16936073; DOI: 10.1242/dev.02546 RRID:MGI:3687744 |
| Genetic reagent (M. musculus) | Smoc/c;BGLAP-Cre | Mak et al. (2008a) | PMID: 18434416; DOI: 10.1242/dev.018044 RRID:MGI:5311416 |
| Genetic reagent (M. musculus) | Ptch1LacZ/+ | This paper | NA |
| Recombinant DNA reagent | pGL3-Mkxp8K | This paper | NA |
| Recombinant DNA reagent | pGL3-Mkx4K | This paper | NA |
| Recombinant DNA reagent | pCMV5 SMAD2-HA | Addgene, USA | plasmid # 14930 |
| Recombinant DNA reagent | pCMV5B-Flag-SMAD3 | Addgene, USA | plasmid # 11742 |
| Antibody | Osteolcalcin/Bglap | Abcam, USA | ab93876, 5 ug/ml RRID: AB_10675660 |
| Antibody | Tppp3 | Abcam, USA | ab150998, 1:50 RRID: AB_2716739 |
| Antibody | Mkx | Lifespan Biosciences Inc., USA | LS-B8063, 1 ug/ml RRID: AB_2716740 |
| Antibody | Mkx | Abcam, USA | ab179597, 1 ug/ml RRID: AB_2716741 |
| Antibody | Gli1 | R&D, USA | MAB3324, 10 ug/ml RRID:AB_2111775 |
| Antibody | Gli2 | R&D, USA | AF3635, 5 ug/ml RRID:AB_2111902 |
| Antibody | pH3 | SantaCruz, USA | sc-8656-R, 1:200 RRID:AB_653256 |
| Antibody | Collagen I | Abcam, USA | ab292, 1:1000 RRID:AB_303415 |
| Antibody | TGF-b1 | Abcam, USA | ab64715, 1:500 RRID:AB_1144265 |
| Antibody | Smad3 | CST, USA | #9523, 1:1000 RRID:AB_2193182 |
| Antibody | p-Smad3 | CST, USA | #9520, 1:1000 RRID:AB_2193207 |
| Antibody | β-Actin | CST, USA | #8457, 1:10000 RRID:AB_10950489 |
| Commercial assay or kit | Apoptosis Fluorescein Detection Kit | Millipore, USA | s7111 |
| Commercial assay or kit | Hydroxyproline Assay Kit | Sigma-Aldrich, USA | MAK008 |
| Commercial assay or kit | Dual-luciferase reporter assay system | Promega, USA | E1980 |
| Chemical compound, drug | BMP2 | CST, USA | #4697 |
| Chemical compound, drug | TGF-β1 | Peprotech, USA | 100–21 |
| Chemical compound, drug | Purmorphamine | Millipore, USA | 540220 |
| Chemical compound, drug | SB431542 | Sigma-Aldrich, USA | S4317 |
Additional files
-
Supplementary file 1
Primer sequences for QRT-PCR.
- https://doi.org/10.7554/eLife.30474.050
Download links
A two-part list of links to download the article, or parts of the article, in various formats.
Downloads (link to download the article as PDF)
Open citations (links to open the citations from this article in various online reference manager services)
Cite this article (links to download the citations from this article in formats compatible with various reference manager tools)
Osteocalcin expressing cells from tendon sheaths in mice contribute to tendon repair by activating Hedgehog signaling
eLife 6:e30474.
https://doi.org/10.7554/eLife.30474


