Pedunculopontine glutamatergic neurons control spike patterning in substantia nigra dopaminergic neurons
- Feinberg School of Medicine, Northwestern University, United States
- Emory University, United States
Figures
Figure 1 with 2 supplements
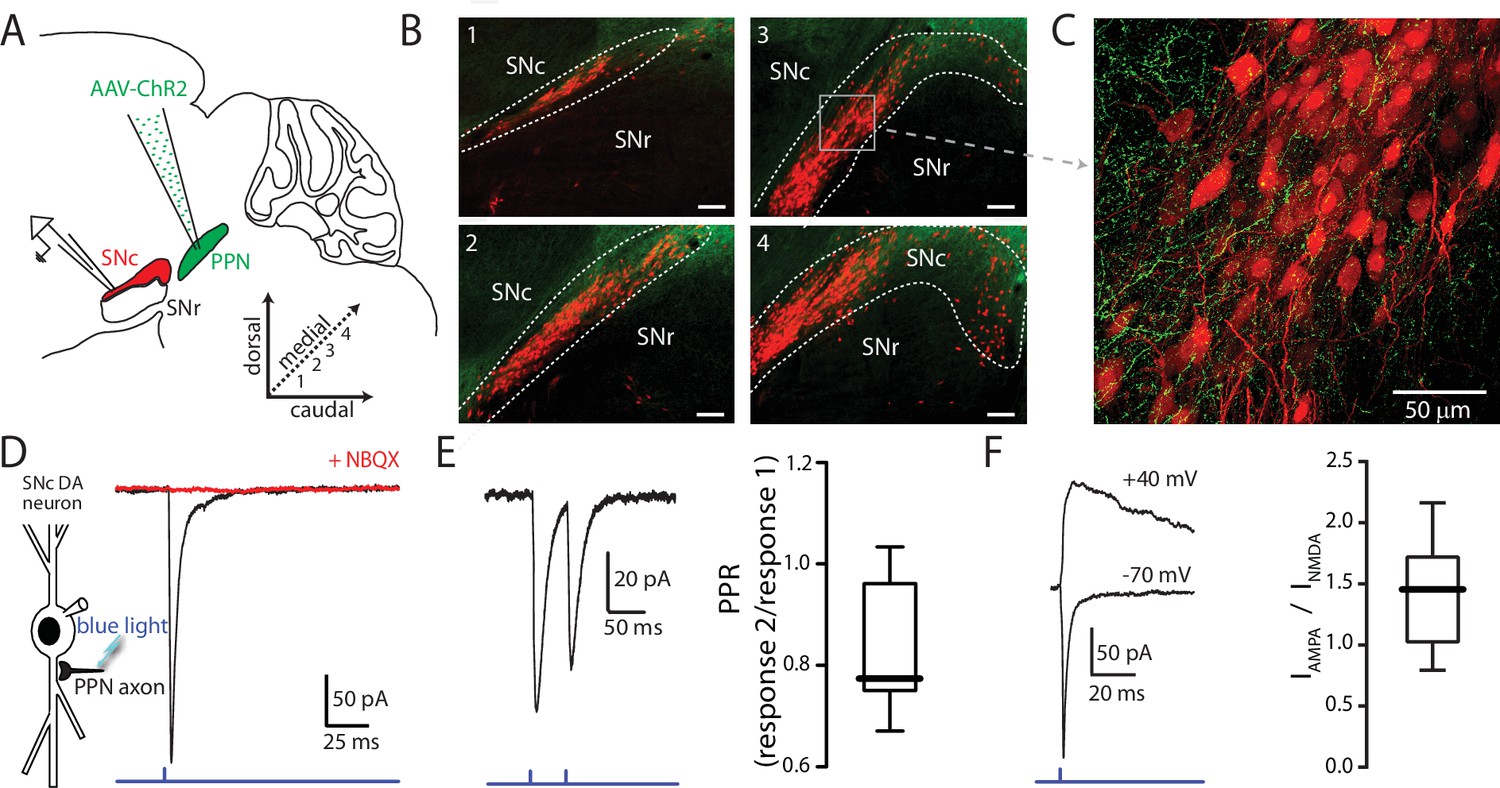
Optogenetic stimulation of PPN afferents evokes glutamatergic responses in SNc DA neurons.
(A) Stereotaxic injections of AAV9.hSyn.hChR2 were made in to the PPN of DAT-Cre/Ai14-tdTomato or wild-type mice. (B) Representative images taken from four sagittal sections from one DAT-Cre/Ai14-tdTomato mouse 10 days following injection of hSyn-ChR2-eYFP in to PPN. Scale bars represent 100 μm. (C) Expanded view of section (gray box) from (B3) showing ChR2-expressing PPN fibers (green) intermingled with SNc DA neurons (red). (D) Blue light LED stimulation produced an inward current in SNc DA neurons held at −70 mV that was abolished by the AMPAR antagonist NBQX (10 μM). (E) A 20 Hz paired-pulse stimulation protocol produced a depressing synaptic response in SNc DA neurons. (Right) Summary of PPR responses (0.83 ± 0.13, n = 10). (F) To determine AMPA:NMDA ratio cells were initially held at −70 mV to determine the timing of the AMPA peak (bottom trace), after which cells were depolarized to + 40 mV to relieve Mg2+ block of the NMDA receptor. The NMDA peak was calculated 40 ms after the AMPA peak. (Right) Summary of AMPA peak current vs. NMDA peak current (1.43 ± 0.42, n = 13).
-
Figure 1—source data 1
Raw data points for panels E and F.
- https://doi.org/10.7554/eLife.30352.006
Figure 1—figure supplement 1
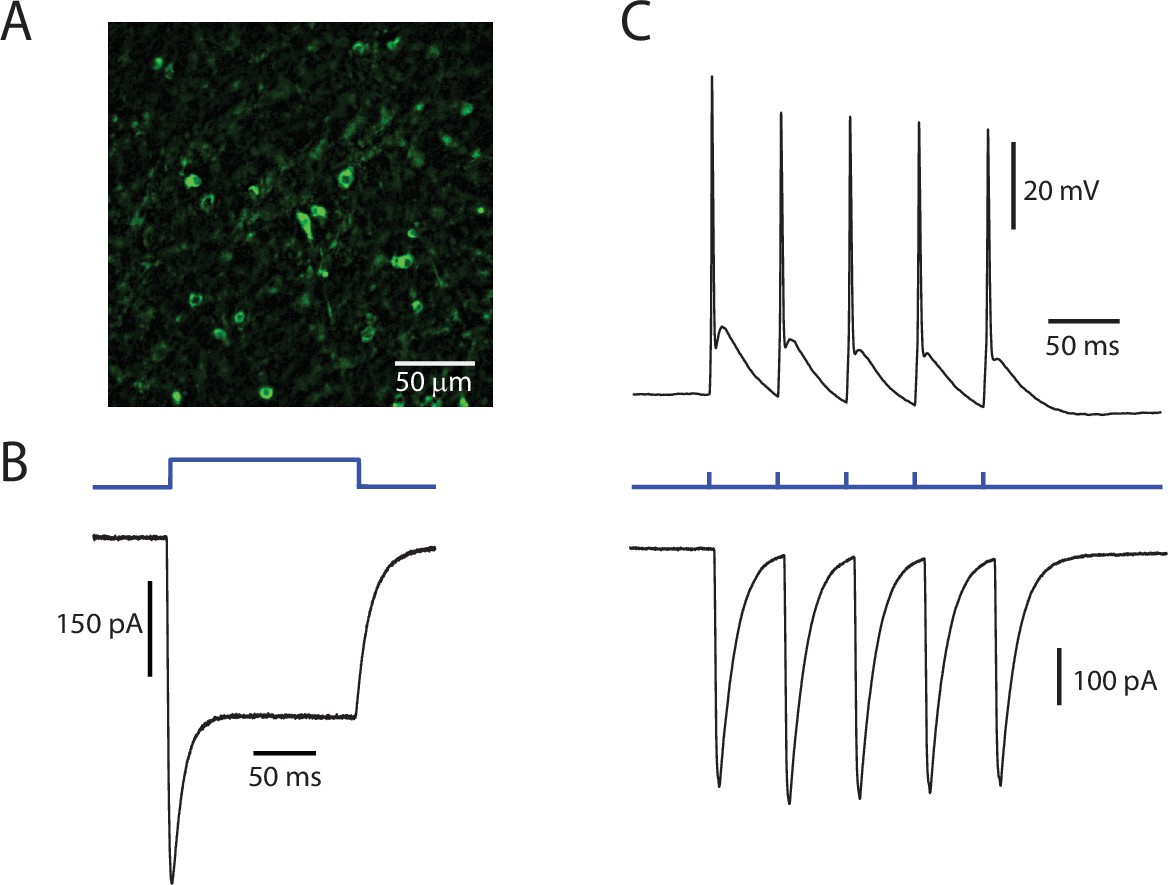
ChR2 is functionally expressed in PPN neurons.
(A) Representative image of PPN cells expressing ChR2-eYFP. (B) Example of a prototypical photocurrent, produced by a 150 ms continuous pulse of blue LED light. (C) Evoked action potentials (Top) and associated currents (Bottom) from a train of 5 stimuli at 20 Hz. The cell reliably follows the stimulation pattern.
Figure 1—figure supplement 2

Electrical stimulation of PPN glutamatergic afferents to SNc.
Example traces of (Top) electrical stimulation with SNc DA neuron held at + 40 mV to alleviate Mg2+ block and (Bottom) 20 Hz PPR stimulation of SNc DA neuron held at −70 mV. The AMPA component of the current measured at + 40 mV is determined based on the peak of the first current in the pair measured at −70 mV (left-most red dashed line). The NMDA component is then measured 40 ms after the AMPA component. Both PPR (0.70 ± 0.16, n = 19) and AMPA:NMDA ratio (2.13 ± 0.78, n = 10) determined with electrical stimulation are similar to those established with optogenetic stimulation of PPN afferents.
-
Figure 1—figure supplement 2—source data 1
Raw data points for summary plots.
- https://doi.org/10.7554/eLife.30352.005
Figure 2

Glutamatergic receptors at the PPN-SNc synapse are composed of GluA2-containing AMPARs and GluN2B/D-containing NMDARs.
(A) Example traces of isolated AMPA currents evoked with the cell held at different membrane potentials. (Right) Summary current-voltage (IV) relationship, where the currents at the different membrane potentials for each cell have been normalized to the current measured at −80 mV for that cell. A linear fit was applied to the data points (represented as mean ± standard deviation). No obvious rectification is observed at positive membrane potentials. (B) Example traces of AMPA currents recorded from a DA neuron held at −70 mV before and after pharmacological manipulation. Application of philanthotoxin-74 (5 µM; red) did not attenuate the measured current as compared to control (black). NBQX (10 µM; blue) was applied to confirm the identity of the current. (Right) Summary of the effect of philanthotoxin-74 application (−13.17% ± 14.67%, n = 6). Summary data represented as mean ± standard deviation. No significant effect was observed (p=0.1563). (C) Example traces of isolated NMDA currents measured from DA neurons held at −60 mV in aCSF containing 0 Mg2+ before and after application of receptor-subunit specific pharmacological agents. (Left) The Glu2NB-selective antagonist ifenprodil attenuated the observed NMDA current, while (Middle) the Glu2NC/D-selective potentiator CIQ increased the peak of the measured current. (Right) The GluN2A-selective antagonist TCN 201 failed to attenuate the measured current. In all examples the nonspecific NMDAR antagonist CPP (5 µM) abolished the current, confirming its identity. (D) Summary of the effect, relative to control, on isolated NMDA currents of the GluN2B-selective antagonist ifenprodil (−43.31 ± 16.89%, n = 6), the GluN2C/D-selective potentiator CIQ (86.22 ± 56.54%, n = 6), and the GluN2A selective antagonist TCN201 (7.76 ± 18.40%, n = 6). Summarized data shown as mean ± standard deviation. Statistical tests were two-tailed Wilcoxon signed rank tests. *p<0.05. (E) 2PLSM calcium imaging of a PPN-evoked NMDA current and the associated calcium transient produced by that current. (Top) Example trace of a somatically recorded NMDA current produced by blue laser stimulation of a region of dendrite, visualized after filling the cell with a red indicator dye. (Right) Reconstructed cell generated, with a blue dot indicating both the point of stimulation and the general region where imaging data was acquired. (Bottom) Normalized (Δf/f0) calcium transient associated with somatic NMDA current. Shaded blue area represents region where green PMT was shuttered. Application of CPP (5 μM; red) abolished both the somatically recorded NMDA current (top) and the associated calcium transient (bottom). (F) Similar to (E), with the primary difference being that the evoked response is produced by the uncaging of focally applied RuBi-glutamate (2 mM) by blue laser light. (G) Summary of calcium transient areas from PPN-evoked (139.26 ± 56.40Δf/f0 * sec, n = 5) and uncaged RuBi-glutamate mediated (165.94 ± 40.27Δf/f0 * sec, n = 5) NMDA currents. No significance difference was found between the two data sets (p=0.4206). Summary data presented as mean ± standard deviation. Statistical test used was a two-tailed Mann-Whitney test.
-
Figure 2—source data 1
Raw data points for panels A, B, D, and G.
- https://doi.org/10.7554/eLife.30352.008
Figure 3 with 1 supplement
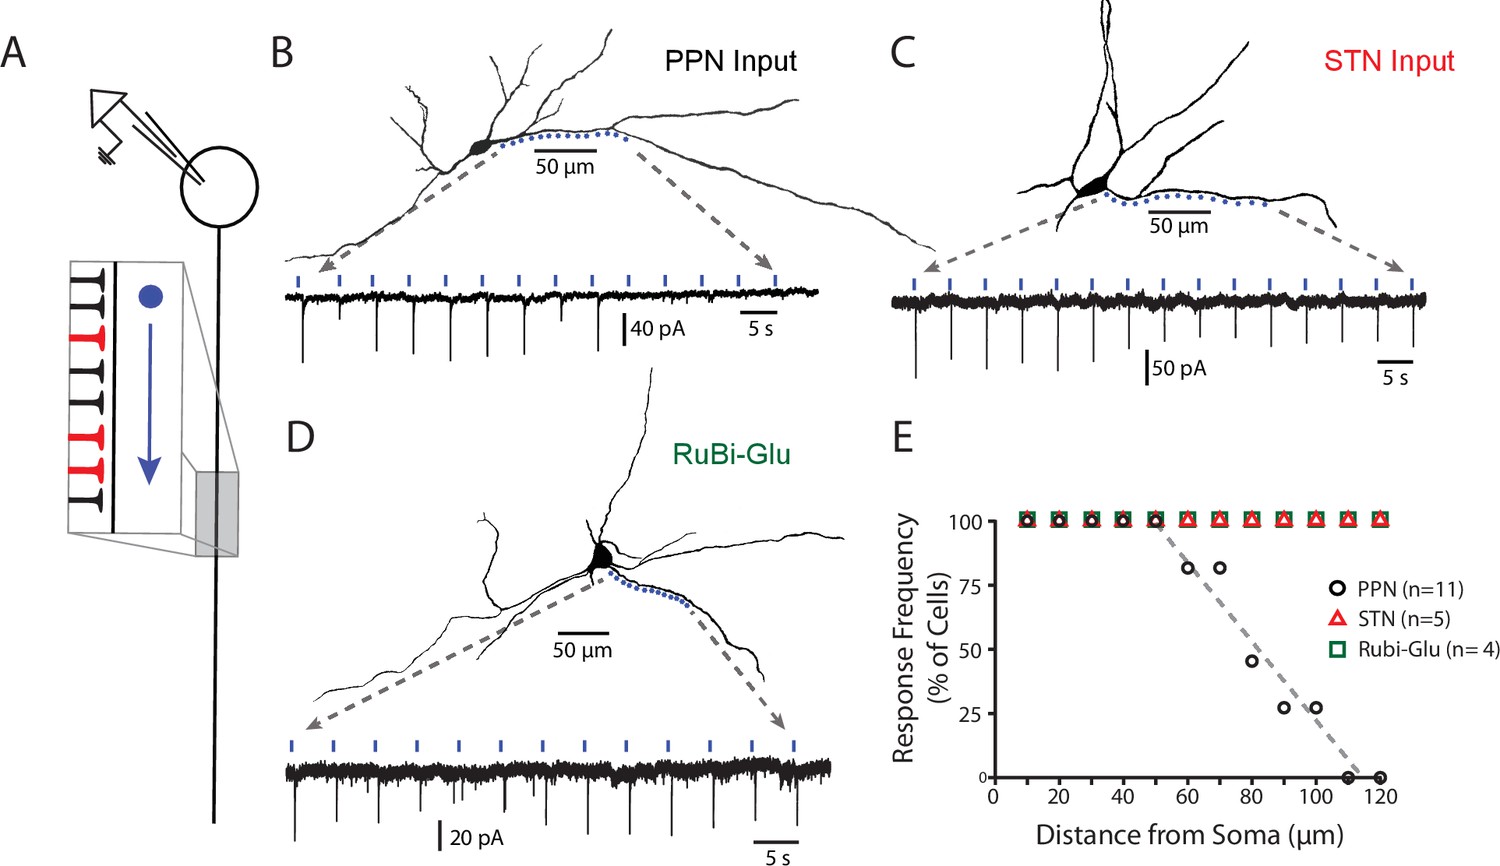
PPN glutamatergic synapses preferentially target proximal portions of the SNc dendritic tree.
(A) Schematic of the experimental procedure. Spots along a section of dendrite, visualized with 2PLSM imaging of dye-filled cells, were assessed for responses to focal spot-laser stimulation using the sCRACM technique. (B) Example reconstructed SNc DA neuron (top) with stimulation spots placed in approximately 10 μm along a section of dendrite that was wholly visualized in the same focal plane. (Bottom) Somatically recorded currents produced by focal stimulation of PPN synapses at the spots displayed above. Responses were elicited in the first 9 spots (~0 to 80 μm from soma), while more distal spots (>100 μm) failed to elicit responses. (C) Similar to (B), with the primary being that the afferents expressing ChR2 in this example originated from the STN, rather than the PPN. In contrast to (B) responses were reliably elicited at both proximal and distal locations. (D) Similar to (B) and (C), with the primary difference being that evoked responses were produced by uncaging of focally applied RuBi-glutamate (2 mM). Similar to (C), and in contrast to (B), response were elicited at in both proximal and distal dendritic regions. (E) Summary response frequency at points along the dendrite, measured as the fraction of cells that showed a synaptic response at a particular distance from the soma. Responses recorded from DA neurons in slices expressing ChR2 in PPN afferents (n = 11) showed a location-dependent decrement in response frequency that was not observed in STN-ChR2 evoked responses (n = 5) or RuBi-glutamate mediated responses (n = 4).
-
Figure 3—source data 1
Raw data points for summary plot.
- https://doi.org/10.7554/eLife.30352.012
Figure 3—figure supplement 1
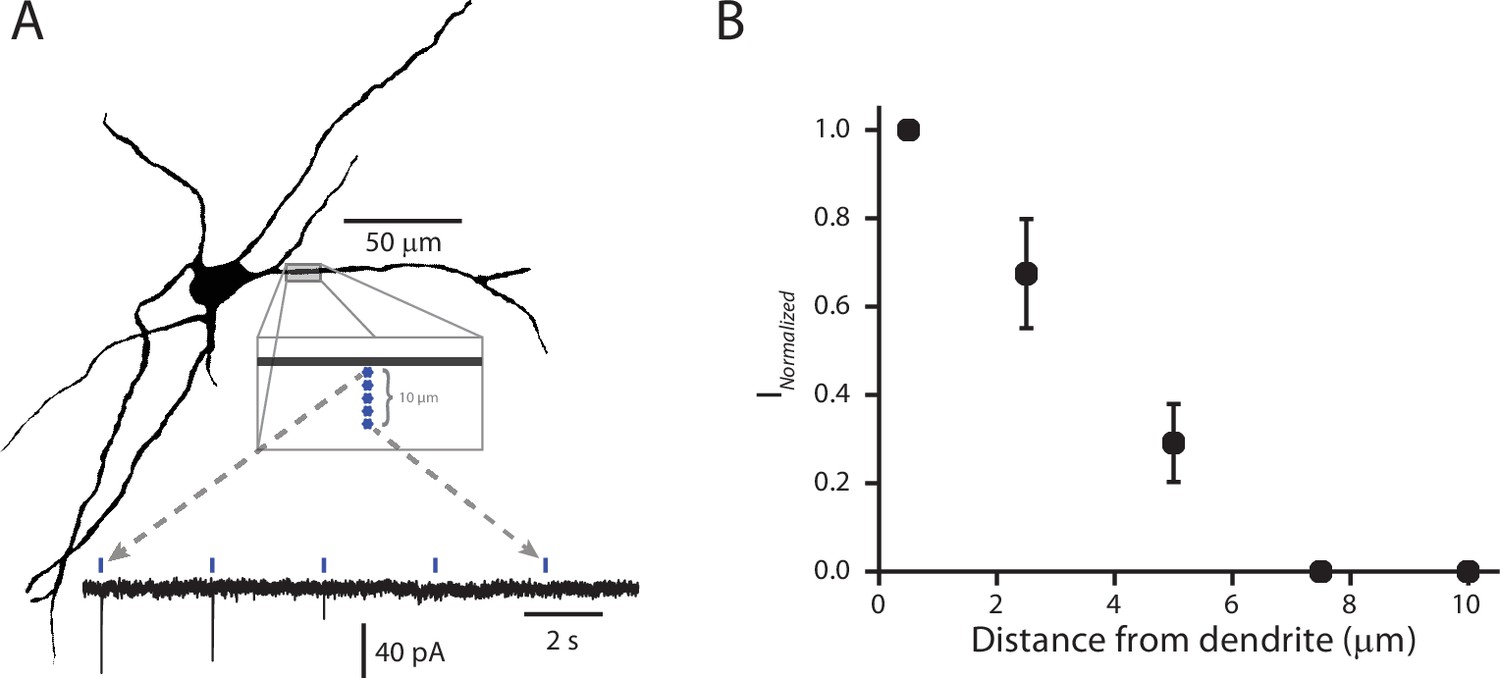
Validation of the spatial resolution for sCRACM functional mapping.
(A) Example reconstructed cell (Top). Five stimulation points were placed approximately 2 µm apart, starting next to and then moving away from (perpendicular to) the dendrite. Example recording (Bottom) of somatically recorded currents associated with each stimulation point. As the site of stimulation moved away from the dendrite, the amplitude of the response diminished. (B) Summary of normalized current amplitudes (normalized to amplitude of the current produced by the stimulus point closest to the dendrite) as a function of distance from the dendrite. As the point of stimulation moves away from the dendrite, response amplitude decays to zero. Data points are represented as mean ± standard deviation (n = 4).
-
Figure 3—figure supplement 1—source data 1
Raw data points for summary plot.
- https://doi.org/10.7554/eLife.30352.011
Figure 4 with 1 supplement
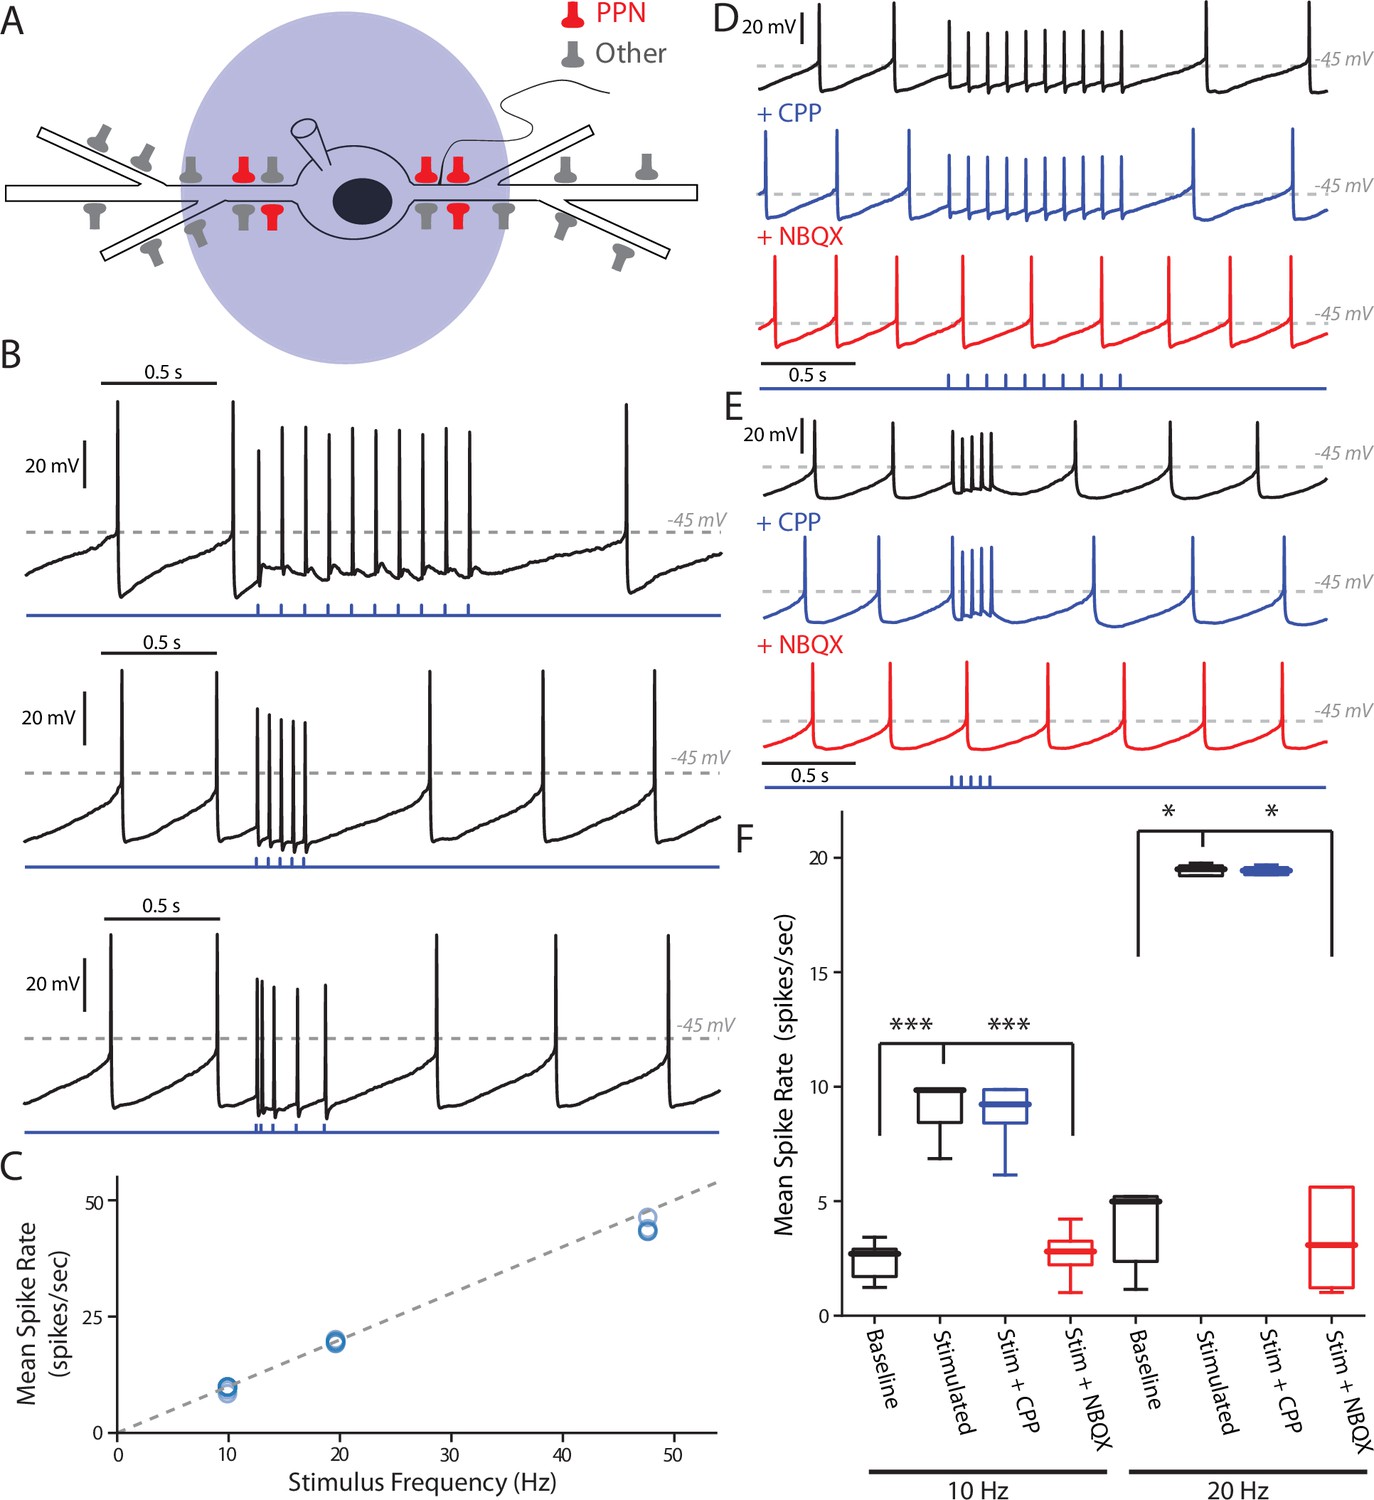
PPN glutamatergic input is capable of patterning SNc DA neuron firing.
(A) Full field blue-LED stimulation of ChR2-expressing PPN afferents was performed while recording spiking activity in SNc DA neurons using the perforated-patch configuration. (B) Example traces of different stimulation patterns: (Top) 10, 1 ms stimuli with an inter-stimulus interval of 100 ms, (Middle) 5, 1 ms stimuli with an inter-stimulus interval of 50 ms, and (Bottom) 5, 1 ms stimuli with inter-stimulus intervals of 20 ms, 50 ms, 100 ms, and 12 0 ms. In all cases spikes were reliably generated by the stimulation protocols. (C) Summary of the mean intra-stimulus spike frequency (spikes/s) as a function of the frequency of stimulation. The measured spike frequency was linearly related to the stimulation frequency in a near 1:1 relationship. (D) Example traces from a SNc DA neuron responding to the 10 stimuli, 10 Hz PPN ChR2 stimulation protocol before and after pharmacological manipulation. Application of the NMDAR antagonist, CPP (5 μM), did not significantly attenuate the response to PPN stimulation, while application of the AMPA receptor antagonist, NBQX (10 μM) completely abolished the evoked response. (E) Similar to (D), with the primary difference being the usage of the 5 stimuli, 20 Hz PPN stimulation protocol. As with (D), application of CPP failed to attenuate the response, while NBQX completely abolished the response. (F) Summary of pharmacological manipulation of SNc DA neuron firing pattern response to PPN stimulation. Both 10 Hz (9.03 ± 1.19 spikes/s, n = 9) and 20 Hz (19.53 ± 0.25 spikes/s, n = 5) stimulation significantly increased firing rate in comparison to control (10 Hz stim: 2.40 ± 0.82 spikes/s, n = 9, p=0.0001; 20 Hz stim: 3.43 ± 1.90 spikes/s, n = 5, p=0.0117). CPP application failed to significantly decrease the response to stimulation (10 Hz stim: 8.81 ± 1.55 spikes/s, n = 5, p=0.8413; 20 Hz stim: 19.49 ± 0.19 spikes/s, n = 5, p=1.0). In contrast, NBQX application significantly attenuated the PPN evoked response (10 Hz stim: 2.71 ± 1.10 spikes/s, n = 6, p=0.0008; 20 Hz stim: 2.73 ± 2.25 spikes/s, n = 5, p=0.0234). Summaries are presented as mean ± standard deviation. Statistical tests used were two-tailed Mann-Whitney tests with Holm-Bonferroni corrections for multiple comparisons. ***p<0.001, *p<0.05.
-
Figure 4—source data 1
Raw data points for panels C and F.
- https://doi.org/10.7554/eLife.30352.016
Figure 4—figure supplement 1

Evoked-spike probability is related to stimulus intensity.
(A) Example traces from two cells. (Left) Showed no response to 2% LED stimulation, but higher stimulation intensities produced full spikes. (Right) In contrast, 2% and 4% LED stimulation produced graded excitatory post-synaptic potentials (EPSPS), while higher intensities produced full spikes. (B) Summary showing the probability of evoking a spike as a function of stimulus intensity, quantified as the fraction of cells (n = 5) that responded with a full spike at a particular intensity. At intensities >= 6% all cells reliably responded with a full spike upon stimulation.
-
Figure 4—figure supplement 1—source data 1
Raw data points for panel B.
- https://doi.org/10.7554/eLife.30352.015
Figure 5 with 1 supplement
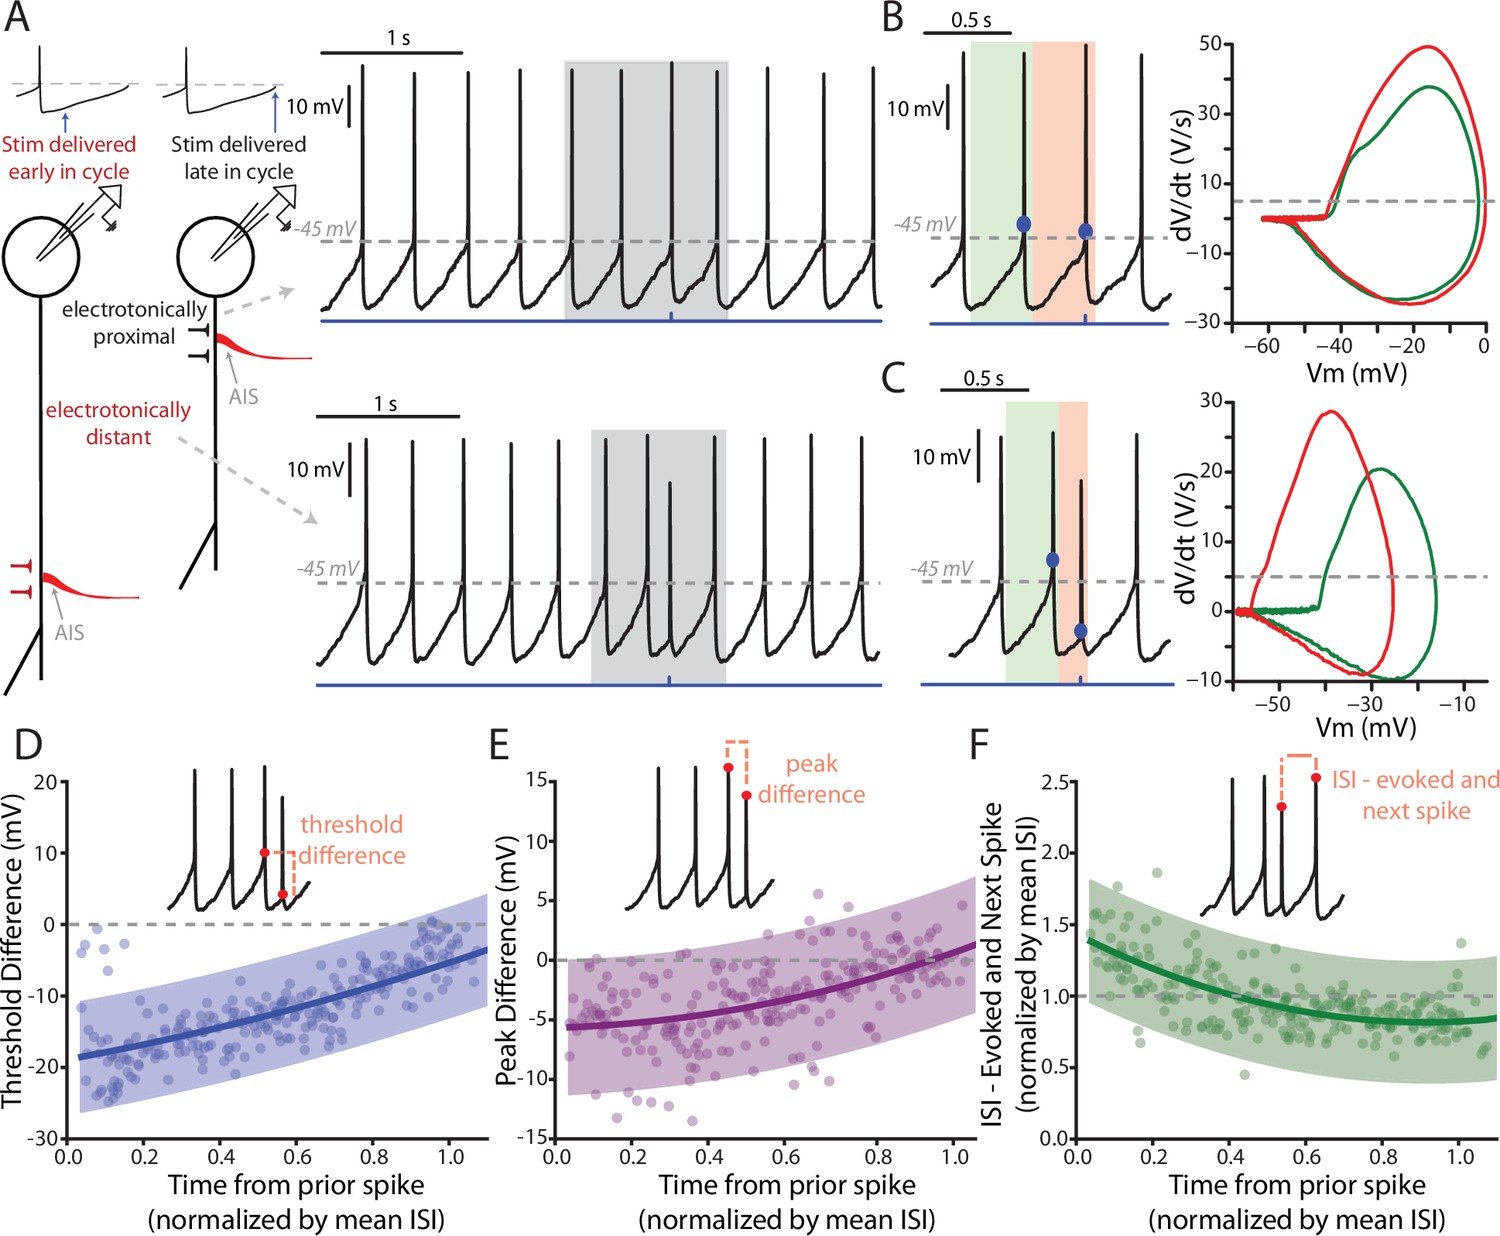
Features of PPN-evoked spikes depend on the phase of SNc DA neuron pacemaking cycle.
(A) Schematic representation of two points in the pacemaking cycle. As the cell nears threshold towards the end of pacemaking cycle it ‘tightens up’ in preparation of spiking. This manifests as an apparent shortening of the distance between the source of AP generation, the AIS, and the somatic recording electrode due to a longer length constant. Consequently, the evoked spike (Top) appears qualitatively similar to the spontaneously generated APs. In contrast, early in the oscillation cycle the cell is particularly ‘leaky’, resulting in a small length constant and consequently a spike that appears qualitatively different when recorded at the soma (Bottom). (B) Comparison of the PPN evoked spike (red) to the spike preceding the evoked spike (green). Representative spikes are expanded from the shaded region in A. Phase plots (Right), generated from respective green and red shaded regions (left), for the two spikes appear similar, with nearly identical thresholds (determined at the point when the dV/dt exceeds 5 V/S – that is the gray dashed line in the phase plot). (C) Similar to (B), with the primary difference being the point in the pacemaking cycle where the stimulus occurred. There is a significant shift in the threshold of the evoked spike, as observed by a leftward shift in its associated phase plot (Right, red). (D–F) Summaries of three properties of the evoked spike: threshold difference (in comparison to the preceding spike), peak difference (in comparison to the preceding spike), and inter-spike interval between evoked spike and the next spontaneously generated AP. Oscillation phase is represented as time to the stimulus from the preceding spike, normalized by the mean ISI for all the spikes preceding the stimulus (averaging window = 4 s). In (D) and (E) during the early phase of the oscillation (near t = 0) there is a large deviation in measured spike threshold and spike peak in comparison to the preceding spike. This difference diminishes at t approach 1. In (F), except for at the earliest time points the normalized ISI values largely cluster around 1, indicating a resetting of the pacemaking cycle. Fit lines are second-order polynomials, with shaded areas representing 95% confidence intervals.
-
Figure 5—source data 1
Raw data points for panels D, E, and F.
- https://doi.org/10.7554/eLife.30352.020
Figure 5—figure supplement 1
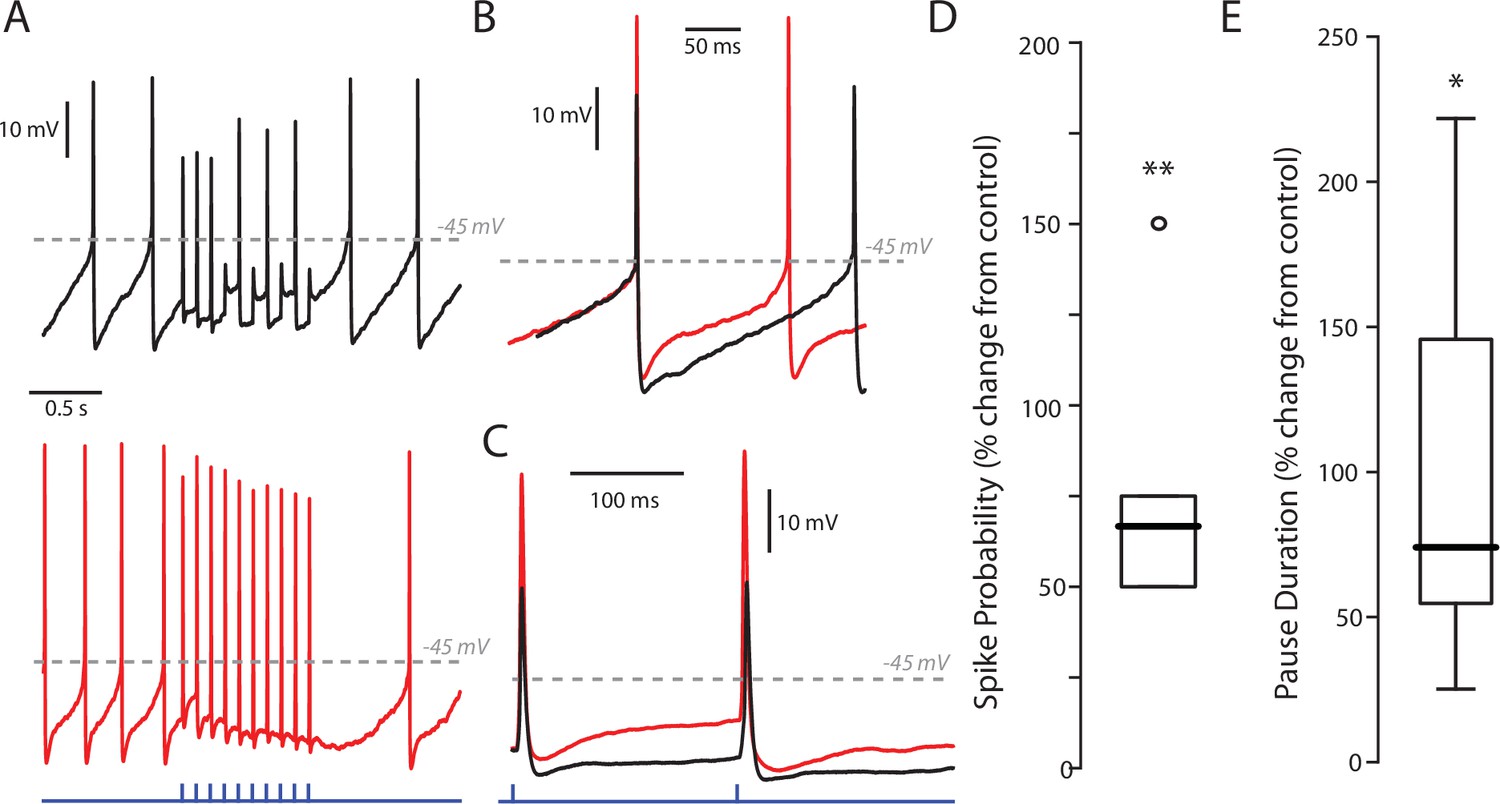
Effect of SK inhibition on PPN stimulation of SNc DA neurons.
(A) Example traces of a stimulus train of 10 stimuli at 10 Hz with a low (5%) LED intensity before (black) and after (red) treatment with apamin (200 nM). Apamin treatment increased both the firing rate of the cell as well as the response to PPN stimulation. Apamin treatment also increase the pause between the last stimulus in the stimulus train and the next spontaneously occurring spike. (B) Enhanced example of a spontaneous spike before (black) and after (red) apamin treatment. As expected, apamin treatment increased spike, and decreased in medium afterhyperpolarization (mAPH). (C) Enhanced example of an evoked spike before and after apamin treatment, again showing a decreased mAHP. (D) Summary after percent-change in spike probability as a result of apamin treatment at a 5% LED intensity. Spike probability was quantified as the number of full spikes divided by the total number of stimuli (10). Apamin significant increased the probability of evoking a spike (78.34 ± 41.50%; n = 5; p=0.0079). Summary presented as mean ± standard deviation. Statistical test used was a two-tailed Mann-Whitney test. **p<0.01. (E) Summary of percent-change in the duration of the pause in spiking between the last stimulus in the stimulus train and the next spontaneously occurring spike before and after apamin treatment. Apamin significant increased the duration of the pause (104.29 ± 79.29%; n = 5; p=0.0317). Summary presented as mean ± standard deviation. Statistical test used was a two-tailed Mann-Whitney test. *p<0.05.
-
Figure 5—figure supplement 1—source data 1
Raw data points for panels D and E.
- https://doi.org/10.7554/eLife.30352.019
Figure 6
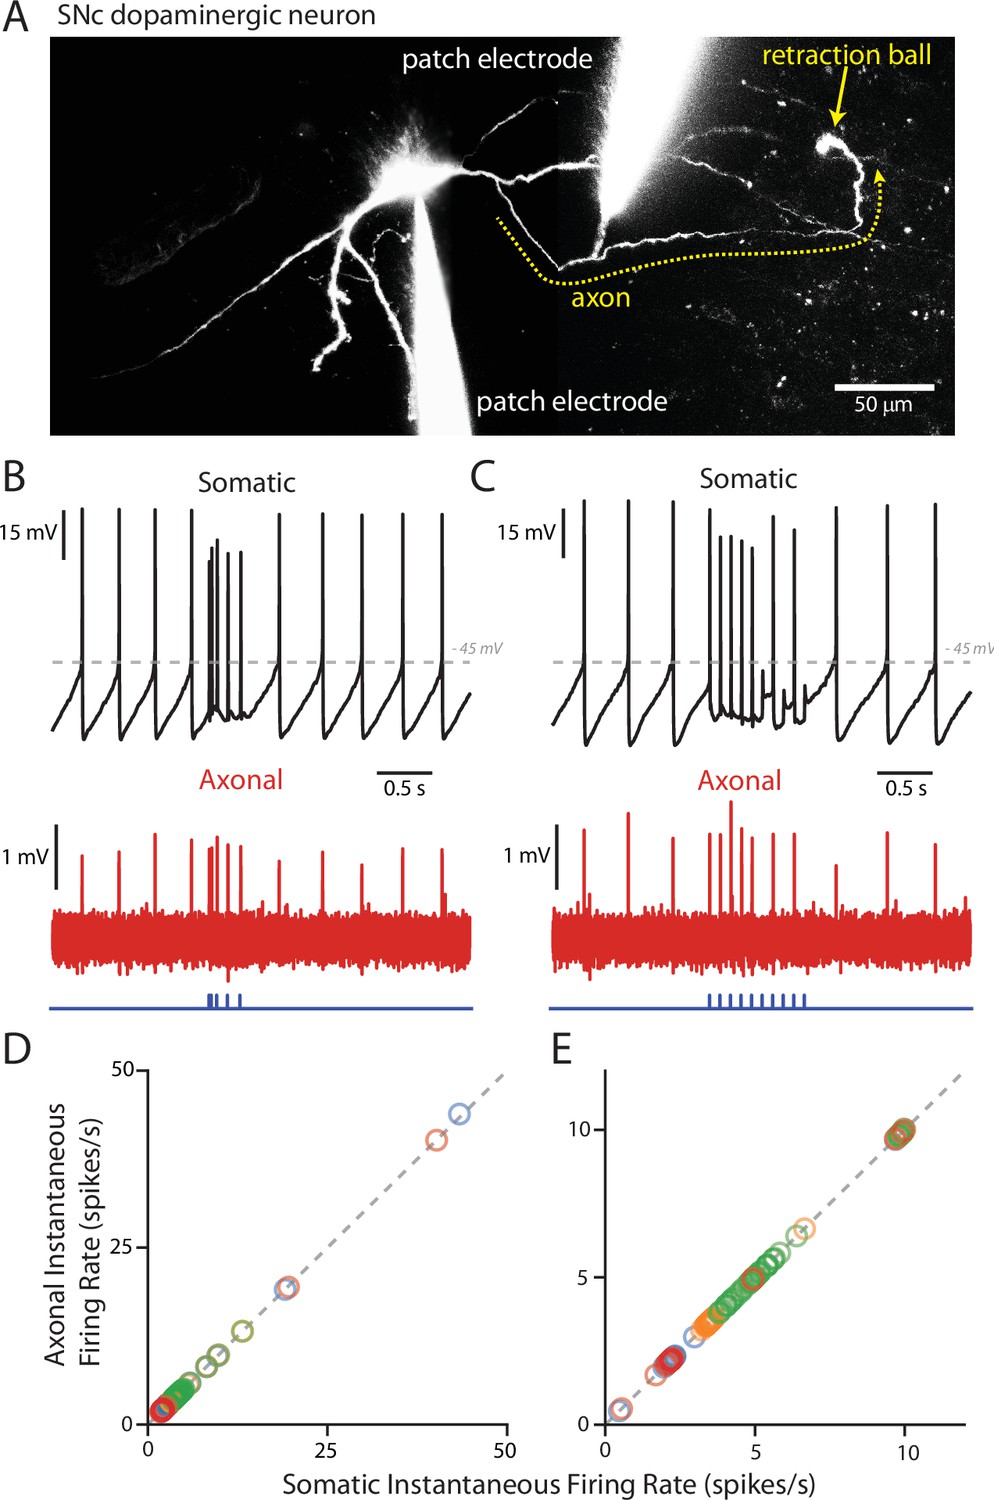
PPN-evoked spikes reliably invade the axon.
(A) Reconstruction of an example cell where two recording electrodes are clearly visible. Paired recording were made in order to simultaneously measure evoked spikes at the soma and at the axon. Axons (yellow dashed line) were identified based upon the presence of a retraction ball (yellow arrow) following the filling of the cell with dye via the somatic electrode. After identification, loose-seal recordings were made of spike activity in the axon. (B) Example recording of somatic whole-cell (Top) and axonal loose-seal (Bottom) recordings of spontaneous and stimulated (5, 1 ms stimuli with variable inter-stimulus interval protocol) action potentials. Spikes recorded at the soma are mirrored by events in the axon. (C) Similar to (B), except for the application of a different stimulation protocol (10, 1 ms stimuli with an inter-stimulus interval of 100 ms). (D–E) Plot of the instantaneous spike rate (spikes/s) of APs recorded in the axon as a function of the instantaneous spike rate (spikes/s) of APs recorded in the soma. Points fall along a linear, 1:1 relationship (gray dashed lines), indicating reliable representation in the axonal recordings of spike events also recorded in the soma. (D) are data points from the variable inter-stimulus interval protocol; (E) are data points from the 10 Hz stimulation protocol. Different colors represent different cells (n = 4).
-
Figure 6—source data 1
Raw data points for panels D and E.
- https://doi.org/10.7554/eLife.30352.022
Additional files
-
Transparent reporting form
- https://doi.org/10.7554/eLife.30352.023
Download links
A two-part list of links to download the article, or parts of the article, in various formats.
Downloads (link to download the article as PDF)
Open citations (links to open the citations from this article in various online reference manager services)
Cite this article (links to download the citations from this article in formats compatible with various reference manager tools)
Pedunculopontine glutamatergic neurons control spike patterning in substantia nigra dopaminergic neurons
eLife 6:e30352.
https://doi.org/10.7554/eLife.30352


