Molecular basis of fatty acid taste in Drosophila
- Texas A&M University, United States
Figures
Figure 1 with 2 supplements
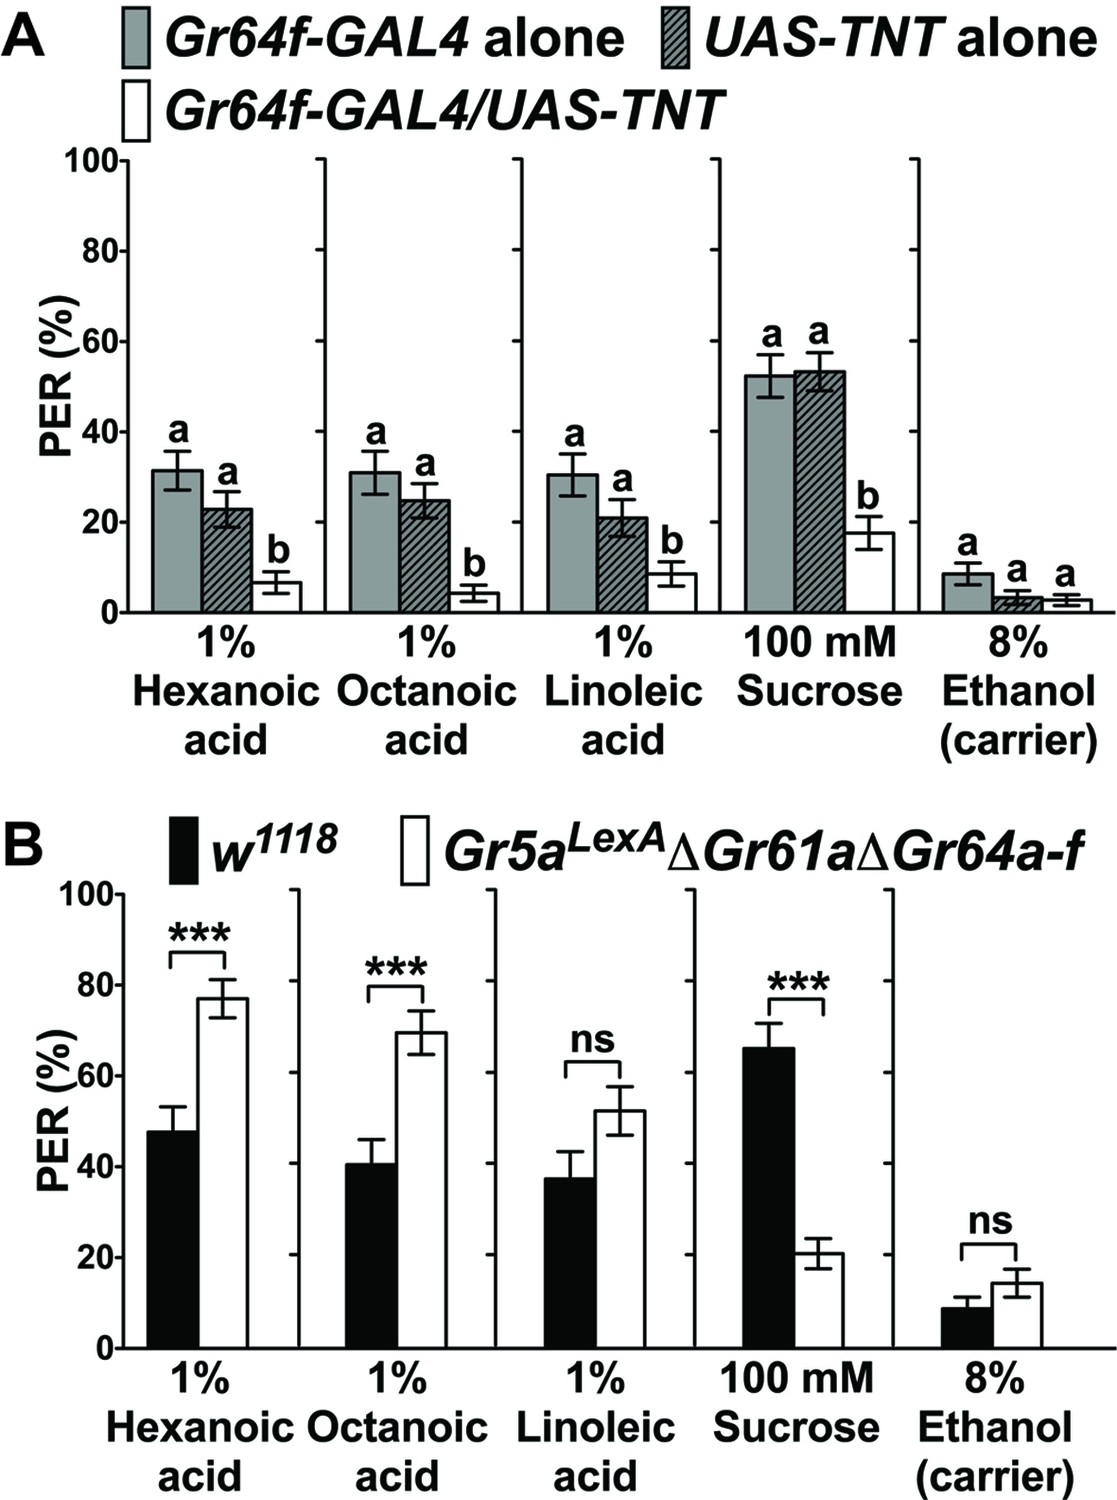
Sweet GRNs, but not sugar Gr genes, are necessary for fatty acid taste.
(A) Sweet GRNs are necessary for fatty acid sensing. Inactivation of sweet GRNs (Gr64f-GAL4/UAS-TNT) leads to loss of PER responses to both sucrose and fatty acids. Control flies (Gr64f-GAL4/+ and UAS-TNT/+) show robust PER responses to fatty acids and sucrose. Each bar represents the mean ± SEM of PER responses (n = 60–70 flies). Bars with different letters are significantly different (Kruskal-Wallis test by ranks with Dunn’s multiple comparison tests, p<0.05). Each y-axis delineates groups for Kruskal-Wallis test. (B) Sugar Gr genes are dispensable for fatty acid sensing. Octuple mutant flies lacking all sugar Gr genes (Gr5aLexA;ΔGr61aΔGr64a-f) exhibit PER responses to fatty acids similar to flies with functional sugar Gr genes (w1118), but they have severely reduced PER response to sucrose. The residual PER responses to sucrose of octuple mutant flies is mediated by Gr43a (Miyamoto et al., 2012). Each bar represents the mean ± SEM of PER responses (n = 42–83 flies). Asterisks indicate a significant difference between the mutant and control flies (Two-tailed, Mann-Whitney U test, ***p<0.001, ns: not significant). Each y-axis delineates groups for Mann-Whitney U test. The genotype of octuple mutant flies is R1 Gr5aLexA; +; ΔGr61a ΔGr64a-f (Yavuz et al., 2014). Source data for summary graphs are provided in Figure 1—source data 1.
-
Figure 1—source data 1
PER responses to fatty acids of flies with impaired neurons and genes.
(A) PER responses of sweet GRNs to fatty acids when inactivated by expression of UAS-TNT. (B) PER responses of octuple mutant flies lacking all sugar Gr genes (Gr5aLexAΔGr61aΔGr64a-f) to fatty acids.
- https://doi.org/10.7554/eLife.30115.007
Figure 1—figure supplement 1

Flies show robust PER responses when the leg is stimulated, but is weaker when the labial palps are stimulated.
No difference in PER responses to sugar is observed between the leg and the labial palp stimulation. Each bar represents the mean ± SEM of PER responses (n = 42–118 flies). Asterisks indicate a significant difference between the leg and the labellum of wild-type flies (w1118) (Two-tailed, Mann-Whitney U test, ***p<0.001, *p<0.05, ns: not significant). Each y-axis delineates groups for Mann-Whitney U test. Source data for summary graphs are provided in Figure 1—figure supplement 1—source data 1.
-
Figure 1—figure supplement 1—source data 1
PER responses to fatty acids upon stimulation of legs and labellum of wild-type flies (w1118) .
- https://doi.org/10.7554/eLife.30115.004
Figure 1—figure supplement 2
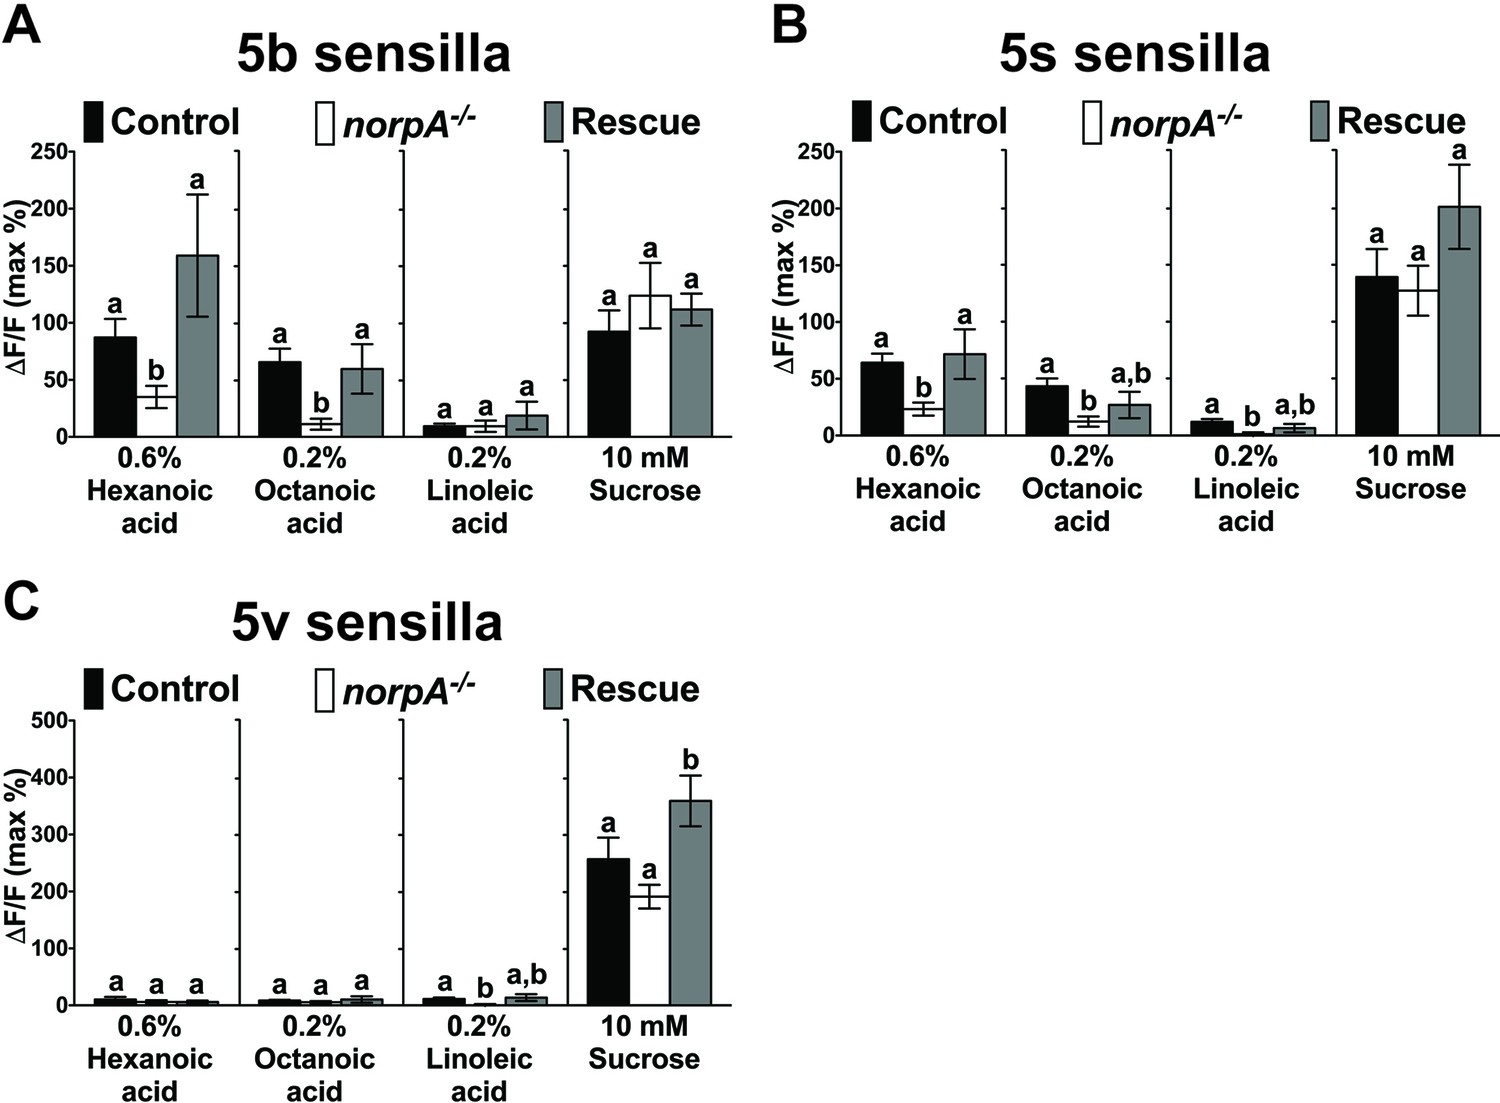
PLC signaling is required for sweet GRN responses to fatty acids.
Ca2+ responses of the 5b-, 5s-, or 5v-associated sweet GRNs of norpA mutant flies to indicated ligands. Ca2+ responses to hexanoic and octanoic acids are significantly reduced in the 5b (A)- and the 5s (B)-associated sweet GRNs of norpA mutant flies, and they are fully or partially rescued when UAS-norpA is expressed in sweet GRNs. Ca2+ responses to linoleic acid are significantly reduced only in the sweet GRN associated with 5s (B) and 5v (C) sensilla from norpA mutant flies. Each bar represents the mean ± SEM of Ca2+ imaging with 3–35 female prothoracic legs. Bars with different letters are significantly different (Kruskal-Wallis test by ranks with Dunn’s multiple comparison tests, p<0.05). Each y-axis delineates groups for Kruskal-Wallis test. Fly genotypes: Gr64f-GAL4 UAS-GCaMP6m/+ (Control, black bar), norpAP24; Gr64f-GAL4 UAS-GCaMP6m/+ (norpA-/-, white) and norpAP24; Gr64f-GAL4 UAS-GCaMP6m/UAS-norpA (Rescue, grey). Source data for summary graphs are provided in Figure 1—figure supplement 2—source data 1.
-
Figure 1—figure supplement 2—source data 1
Ca2+ responses of sweet GRNs associated with 5b (A), 5s (B) or 5v (C) sensilla of norpA mutant flies to fatty acids.
- https://doi.org/10.7554/eLife.30115.006
Figure 2 with 1 supplement

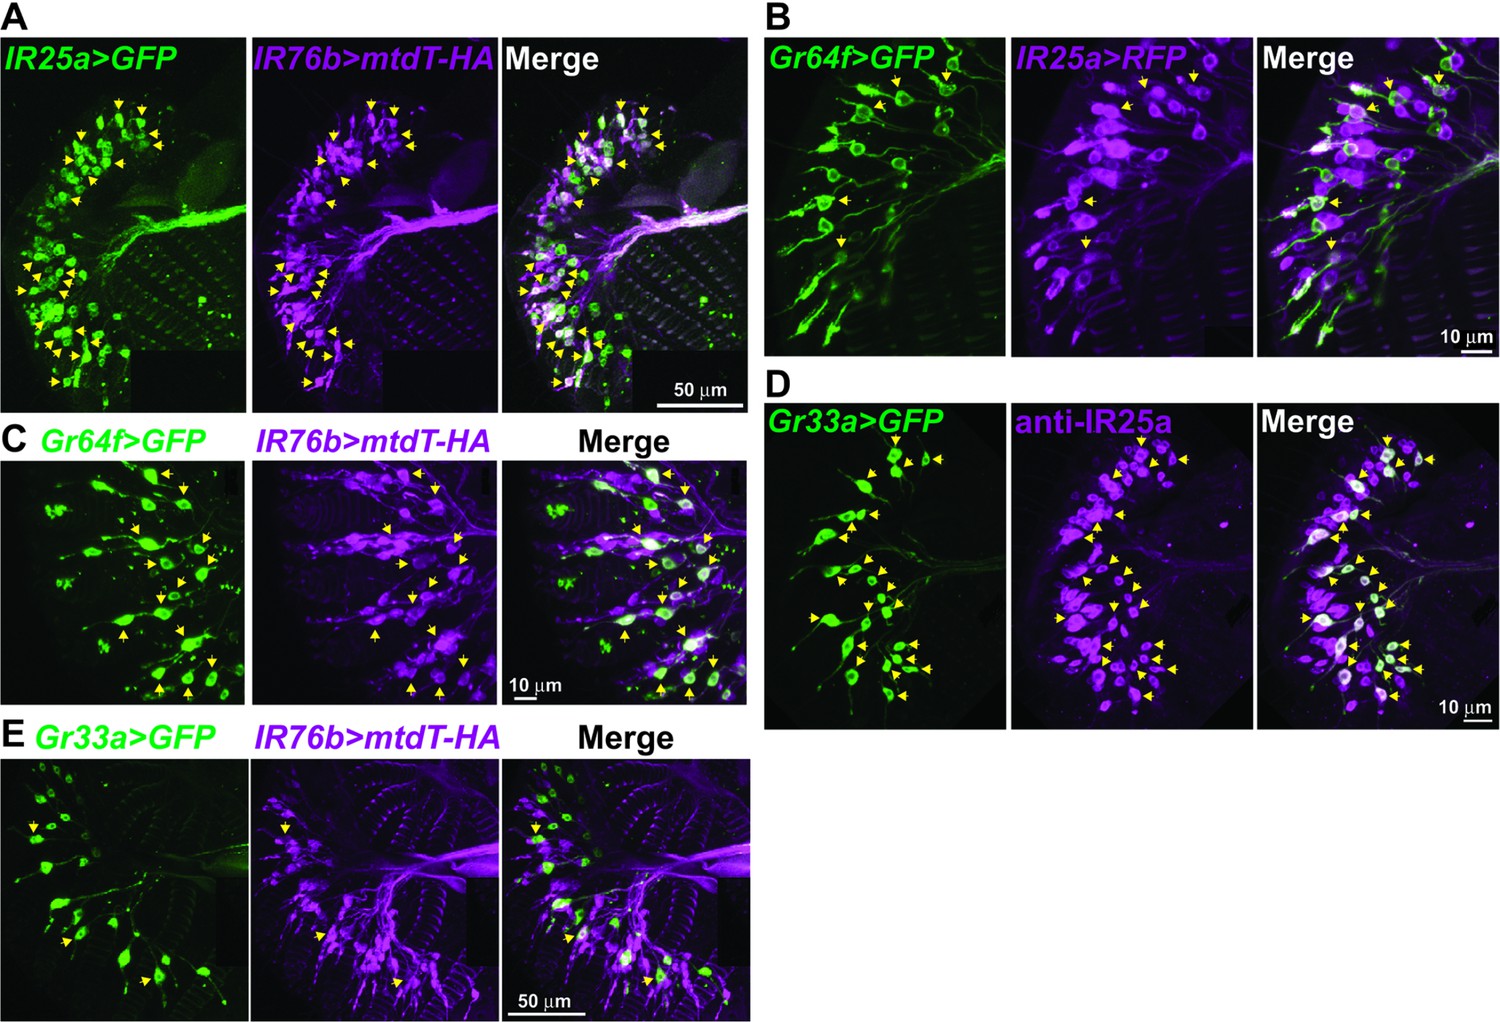
IR25a and IR76b are expressed in numerous taste neurons, including sweet and bitter GRNs.
(A) Drawing of the fifth tarsal segment of the prothoracic leg that is used for immunofluorescence experiments (B–F). Tarsal taste sensilla are indicated. (B and C) IR25a and IR76b are expressed in sweet GRNs. Immunostaining with anti-GFP (green) and anti-mCD8 (B; magenta) or anti-HA (C; magenta) antibodies on whole-mount preparations of the fifth tarsal segment of the prothoracic leg from flies of the genotypes: IR25a-GAL4/UAS-mCD8:RFP; Gr64fLexA lexAop-rCD2:GFP (B) or IR76b-QF UAS-mCD8:GFP/Gr64f-GAL4;QUAS-mtd-Tomato-3xHA/+ (C). Arrows refer to a GRN of a sensillum expressing both Gr64f and the indicated IR genes. (D and E) IR25a and IR76b are expressed in bitter GRNs. Immunostaining with anti-GFP (green) and anti-IR25a (D; magenta) or anti-HA (E; magenta) antibodies on whole-mount preparations of the fifth tarsal segment of the prothoracic leg from flies of the genotypes: Gr33aGAL4/UAS-mCD8:GFP (D) or IR76b-QF UAS-mCD8:GFP/Gr33aGAL4;QUAS-mtd-Tomato-3xHA/+ (E). Arrows refer to a GRN of a sensillum expressing both Gr33a and the indicated IR genes. (F) IR25a and IR76b are largely co-expressed in tarsal GRNs. Immunostaining with anti-GFP (green) and anti-HA (magenta) antibodies on whole-mount preparations of the fifth tarsal segment of the prothoracic leg from flies of the genotypes: IR76b-QF UAS-mCD8:GFP/IR25a-GAL4;QUAS-mtd-Tomato-3xHA/+. Arrows refer to GRNs expressing both IR25a and IR76b genes. Numbers indicate the average count of IR or Gr expressing GRNs/sensillum. Due to close proximity, neurons could not always be associated with either the 5s and 5v sensillum, and the cell count was therefore pooled.
Figure 2—figure supplement 1
Co-expression of IR25a and IR76b with Gr64f and Gr33a in labellar GRNs.
Immunostaining with anti-GFP (green) and anti-mCD8 (B; magenta) or anti-IR25a (D; magenta) or anti-HA (A, C, and E; magenta) antibodies on whole-mount preparations of the labial palp from flies expressing IR25a-GAL4/IR76b-QF UAS-mCD8:GFP;QUAS-mtd-Tomato-3xHA/+ (A), IR25a-GAL4/UAS-mCD8:RFP; Gr64fLexA lexAop-rCD2:GFP (B), IR76b-QF UAS-mCD8:GFP/Gr64f-GAL4;QUAS-mtd-Tomato-3xHA/+ (C), Gr33aGAL4/UAS-mCD8:GFP (D) or IR76b-QF UAS-mCD8:GFP/Gr33aGAL4;QUAS-mtd-Tomato-3xHA/+ (E) transgenes. IR25a and IR76b are co-expressed in many GRNs (A). However, only small subsets of IR25a or IR76b expressing cells are co-labeled with markers for sweet GRNs (B and C) or makers for bitter GRNs (D and E).
Figure 3
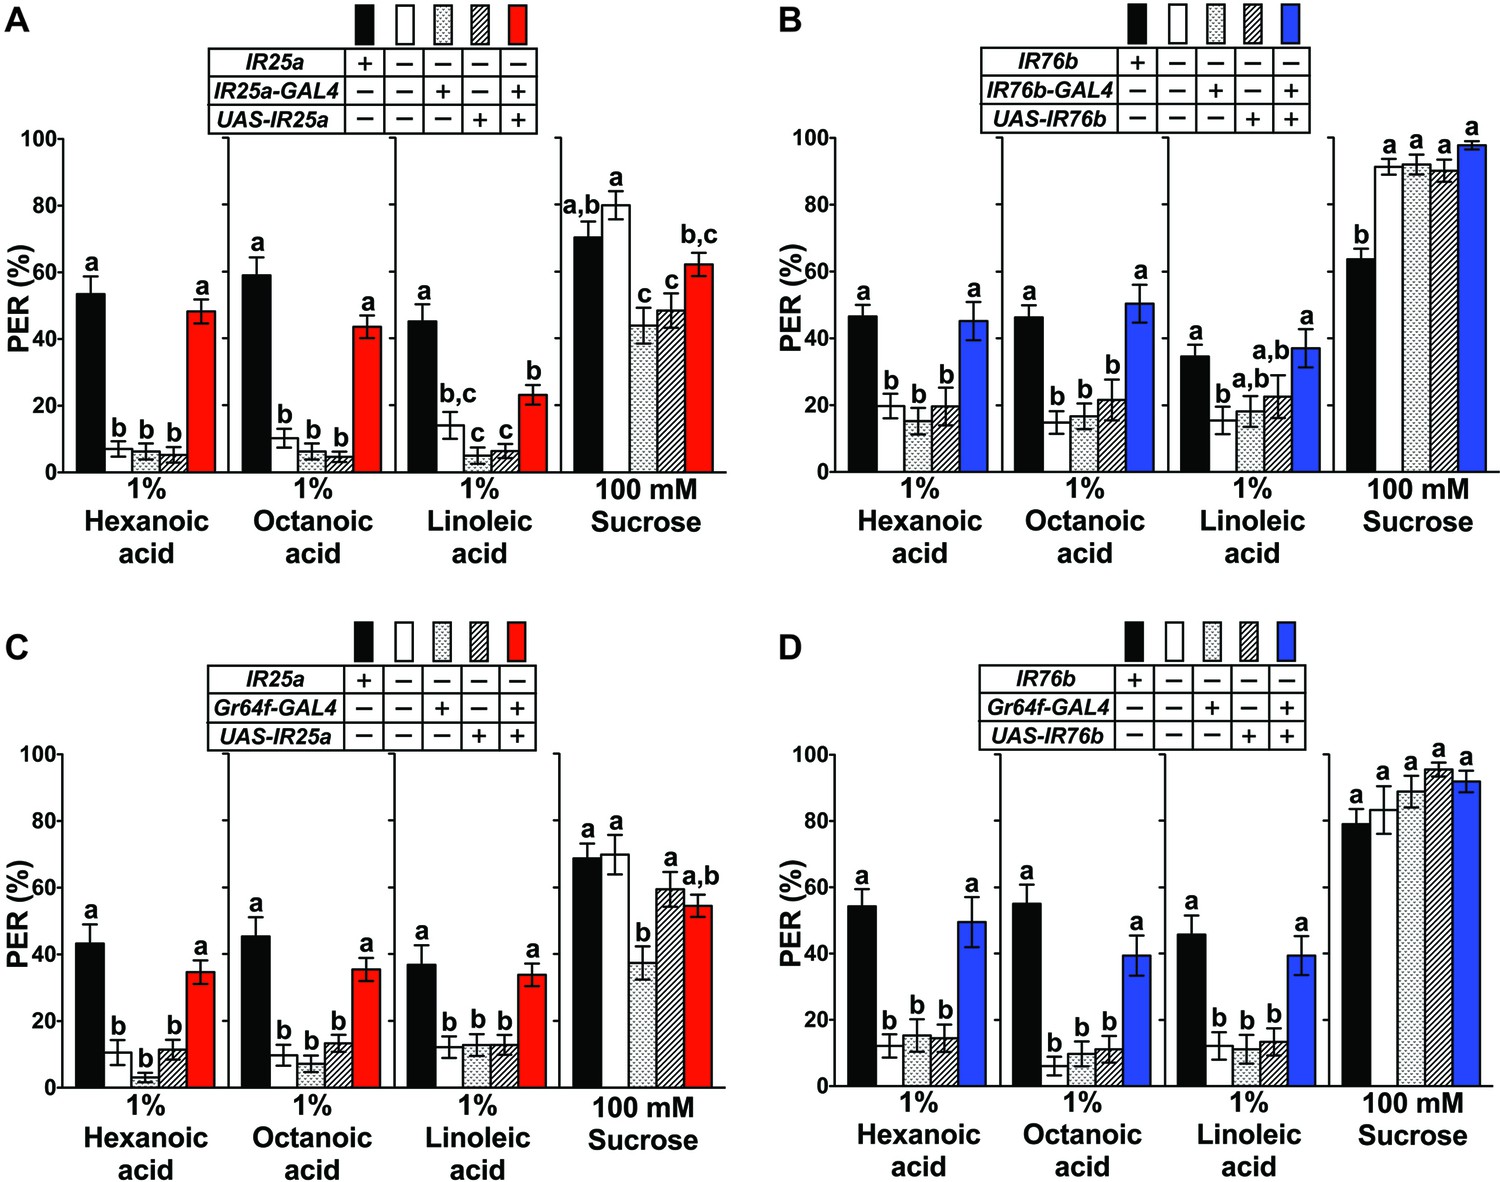
IR25a and IR76b are necessary for behavioral responses to fatty acids.
(A and B) Mutations in IR25a or IR76b abolish PER responses to fatty acids. IR25a (A) and IR76b (B) mutant flies show significantly reduced PER responses to fatty acids, which are rescued by expression of UAS-IR25a and UAS-IR76b respectively, under control of their respective GAL4 drivers. Expression of UAS-IR25a transgenes only partially rescues PER responses to linoleic acid (A). Each bar represents the mean ± SEM of PER responses (n = 34–116 flies). Bars with different letters are significantly different (Kruskal-Wallis test by ranks with Dunn’s multiple comparison tests, p<0.05). Each y-axis delineates groups for Kruskal-Wallis test. Fly genotypes: wild-type: w1118 (black), mutants: IR25a1/IR25a1 and IR76b1/IR76b1 (white), IR25a1 IR25a-GAL4/IR25a1 and IR76b-GAL4/+; IR76b1/IR76b1 (dotted), IR25a1 UAS-IR25a/IR25a1 and UAS-IR76b/+; IR76b1 (lines), and rescue: IR25a1 IR25a-GAL4/IR25a1 UAS-IR25a (red), IR76b-GAL4/UAS-IR76b; IR76b1/IR76b1 (blue). (C and D) Functions of IR25a and IR76b in sweet GRNs are required and sufficient for fatty acid taste. IR25a (C) or IR76b (D) mutant flies show significantly reduced PER responses to fatty acids but not to sucrose. Restoring expression by UAS-IR25a (C) or UAS-IR76b (D) in sweet GRNs of IR25a or IR76b mutant flies is sufficient to rescue the loss of PER responses to fatty acids. Each bar represents the mean ± SEM of PER responses (n = 22–124 flies). Bars with different letters are significantly different (Kruskal-Wallis test by ranks with Dunn’s multiple comparison tests, p<0.05). Each y-axis delineates groups for Kruskal-Wallis test. Fly genotypes: control flies: wild-type: w1118 (black), mutants: IR25a1/IR25a1 and IR76b2/IR76b2 (white), IR25a1 Gr64f-GAL4/IR25a1 and Gr64f-GAL4/+; IR76b2/IR76b2 (dotted), IR25a1 UAS-IR25a/IR25a1 and UAS-IR76b/+; IR76b2/IR76b2 (lines), and rescue: IR25a1 Gr64f-GAL4/IR25a1 UAS-IR25a (red), Gr64f-GAL4/UAS-IR76b; IR76b2/IR76b2 (blue). Source data for summary graphs are provided in Figure 3—source data 1.
-
Figure 3—source data 1
PER responses of IR25a and IR76b mutant flies to fatty acids.
(A) PER responses of IR25a mutant flies to fatty acids. (B) PER responses of IR76b mutant flies to fatty acids. (C and D) PER responses to fatty acids of IR25a (C) or IR76b (D) mutant flies with UAS-IR25a or UAS-IR76b transgenes, respectively, under the control of Gr64f-GAL4.
- https://doi.org/10.7554/eLife.30115.011
Figure 4 with 1 supplement
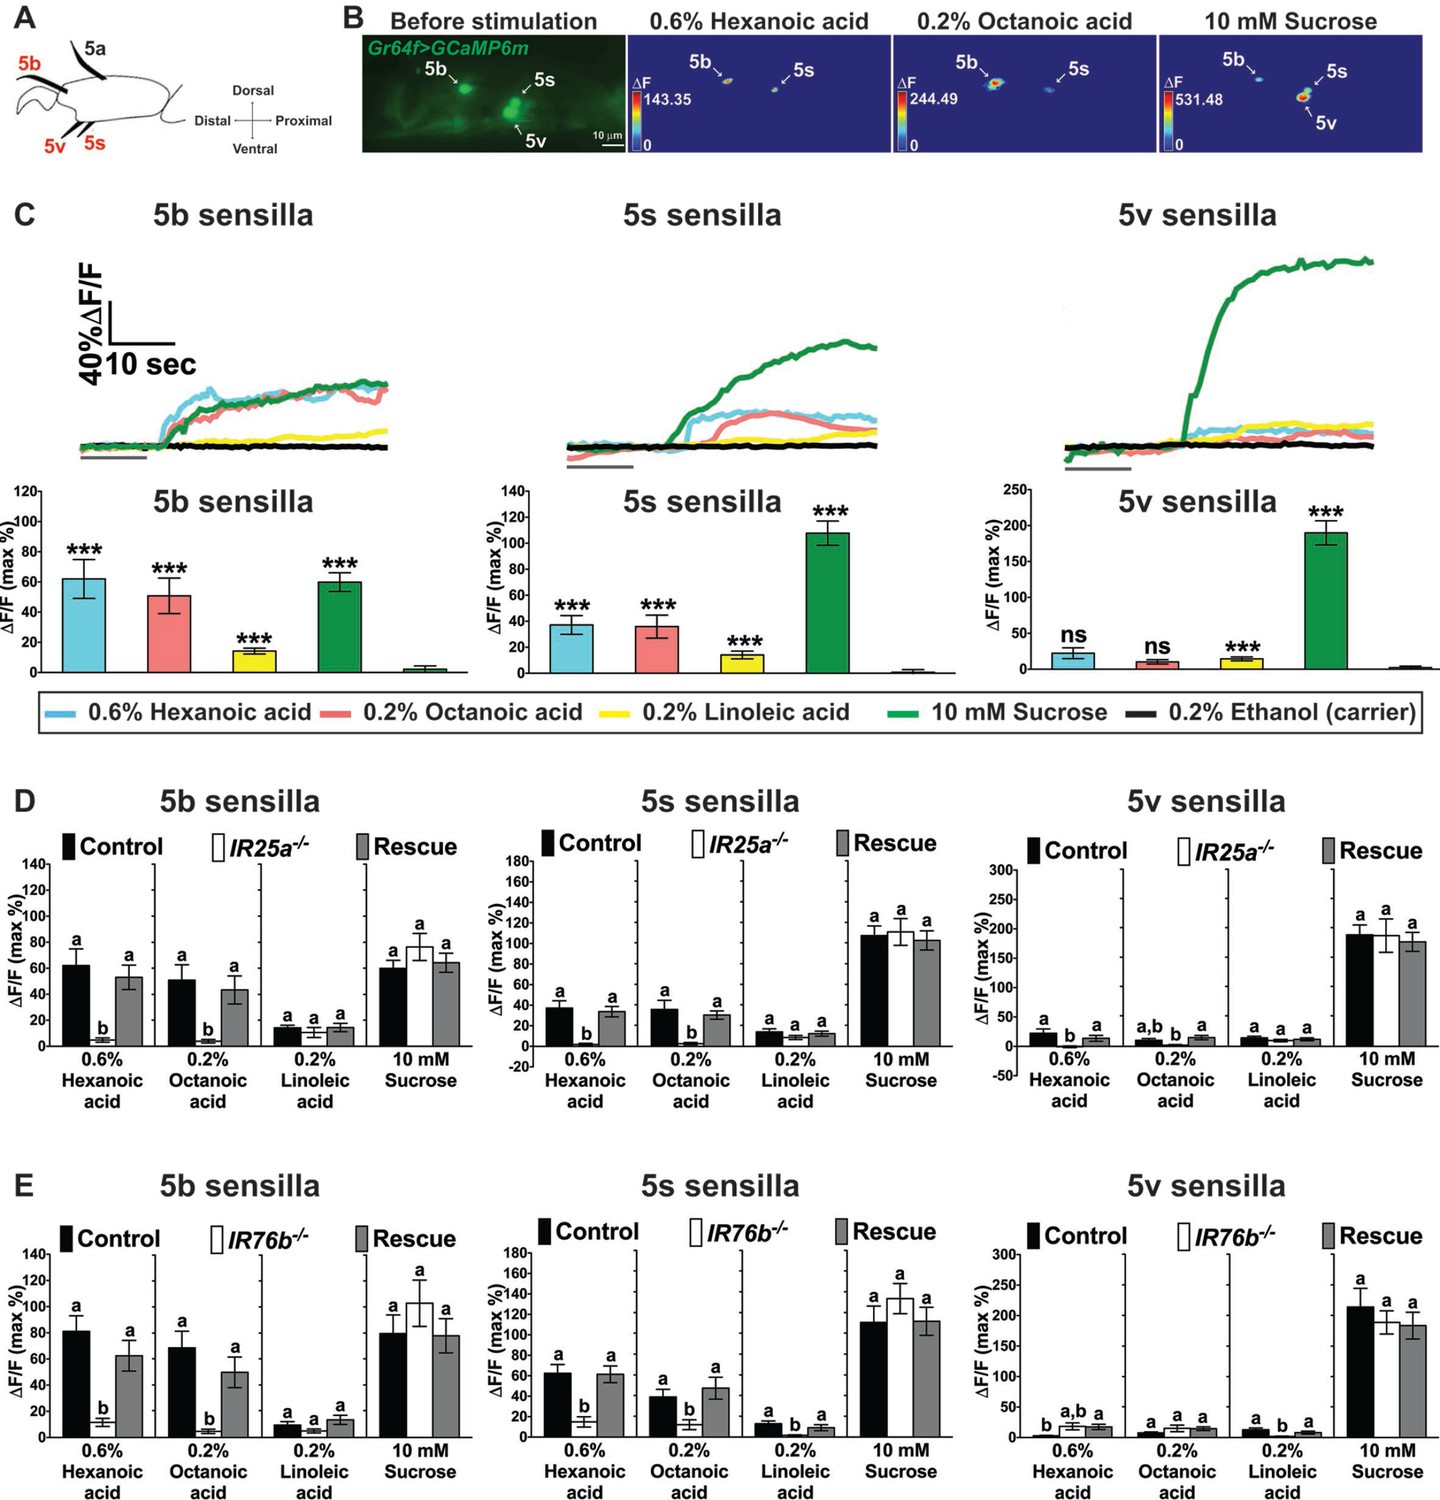
Cellular responses to fatty acids in sweet GRNs require IR25a and IR76b functions.
(A) Diagram of the fifth tarsal segment of the prothoracic leg. Ca2+ imaging was carried out for the sweet GRN of the 5b, 5s and 5v sensilla (the Gr64f-GAL4 expressing GRN in the 5a sensillum does not respond to sugar and was not included in our analysis). (B) Representative still images of the fifth tarsal segment of the prothoracic leg show maximum Ca2+ responses of the sweet GRNs upon stimulation by indicated ligands. ΔF indicates the changes in fluorescence light intensity of the cell body before/after ligand stimulation. (C) Representative fluorescence traces (top) and corresponding Ca2+ responses (bottom) of the sweet GRN associated with the 5b, 5s and 5v sensilla after stimulation with indicated ligands. The gray line underneath the fluorescence traces indicates time of ligand application. Hexanoic and octanoic acids elicit strong Ca2+ responses in the sweet GRN associated with 5b and 5s sensilla, but not the 5v sensillum. The 5v-associated sweet GRN shows weak, but significant Ca2+ responses to linoleic acid when compared to carrier. 10 mM sucrose was used as a positive control. Each bar represents the mean ± SEM of Ca2+ imaging with 13–57 female prothoracic legs. Two-tailed, Mann-Whitney U test versus 0.2% ethanol (carrier), ***p<0.001, ns: not significant. Fly genotype is Gr64f-GAL4/+; UAS-GCaMP6m/+. Note that traces and graphs for a second UAS-GCaMP6m reporter (located on the second chromosome and used to analyze IR76b mutant flies) are shown in Figure 4—figure supplement 1A and B. (D and E) IR25a and IR76b are necessary in sweet GRNs for fatty acid responses. Ca2+ responses of 5b-, 5s- and 5v-associated sweet GRNs of IR25a (D) or IR76b (E) mutant flies to indicated ligands. Ca2+ responses to hexanoic and octanoic acids are abolished in 5b- and 5s-associated sweet GRNs of both IR25a and IR76b mutant flies, and they are fully rescued when UAS-IR25a or UAS-IR76b expression is provided in sweet GRNs. Ca2+ responses to linoleic acid are significantly reduced only in the sweet GRN associated with 5s and 5v sensilla from IR76b mutant flies (E). Each bar represents the mean ± SEM of Ca2+ imaging with 16–50 female prothoracic legs. Bars with different letters are significantly different (Kruskal-Wallis test by ranks with Dunn’s multiple comparison tests, p<0.05). Each y-axis delineates groups for Kruskal-Wallis test. Fly genotypes D: Gr64f-GAL4/+; UAS-GCaMP6m/+ (Control, black bar), IR25a2 Gr64f-GAL4/IR25a2; UAS-GCaMP6m/+ (IR25a-/-, white) and IR25a2 Gr64f-GAL4/IR25a2 UAS-IR25a; UAS-GCaMP6m/+ (Rescue, grey); Fly Genotypes E: Gr64f-GAL4 UAS-GCaMP6m/+ (Control, black), Gr64f-GAL4 UAS-GCaMP6m/+; IR76b2/IR76b2 (IR76b-/-, white) and Gr64f-GAL4 UAS-GCaMP6m/UAS-IR76b; IR76b2/IR76b2 (Rescue, grey). For representative traces of these genotypes, see Figure 4—figure supplement 1C and D. Source data for summary graphs are provided in Figure 4—source data 1.
-
Figure 4—source data 1
Ca2+ imaging results of sweet GRNs of w1118, IR25a and IR76b mutant flies to fatty acids.
(C) Ca2+ responses of sweet GRNs associated with 5b, 5s or 5v sensilla to fatty acids. (D) Ca2+ responses of sweet GRNs associated with 5b, 5s or 5v sensilla of IR25a mutant flies to fatty acids. (E) Ca2+ responses of sweet GRNs associated with 5b, 5s or 5v sensilla of IR76b mutant flies to fatty acids.
- https://doi.org/10.7554/eLife.30115.015
Figure 4—figure supplement 1
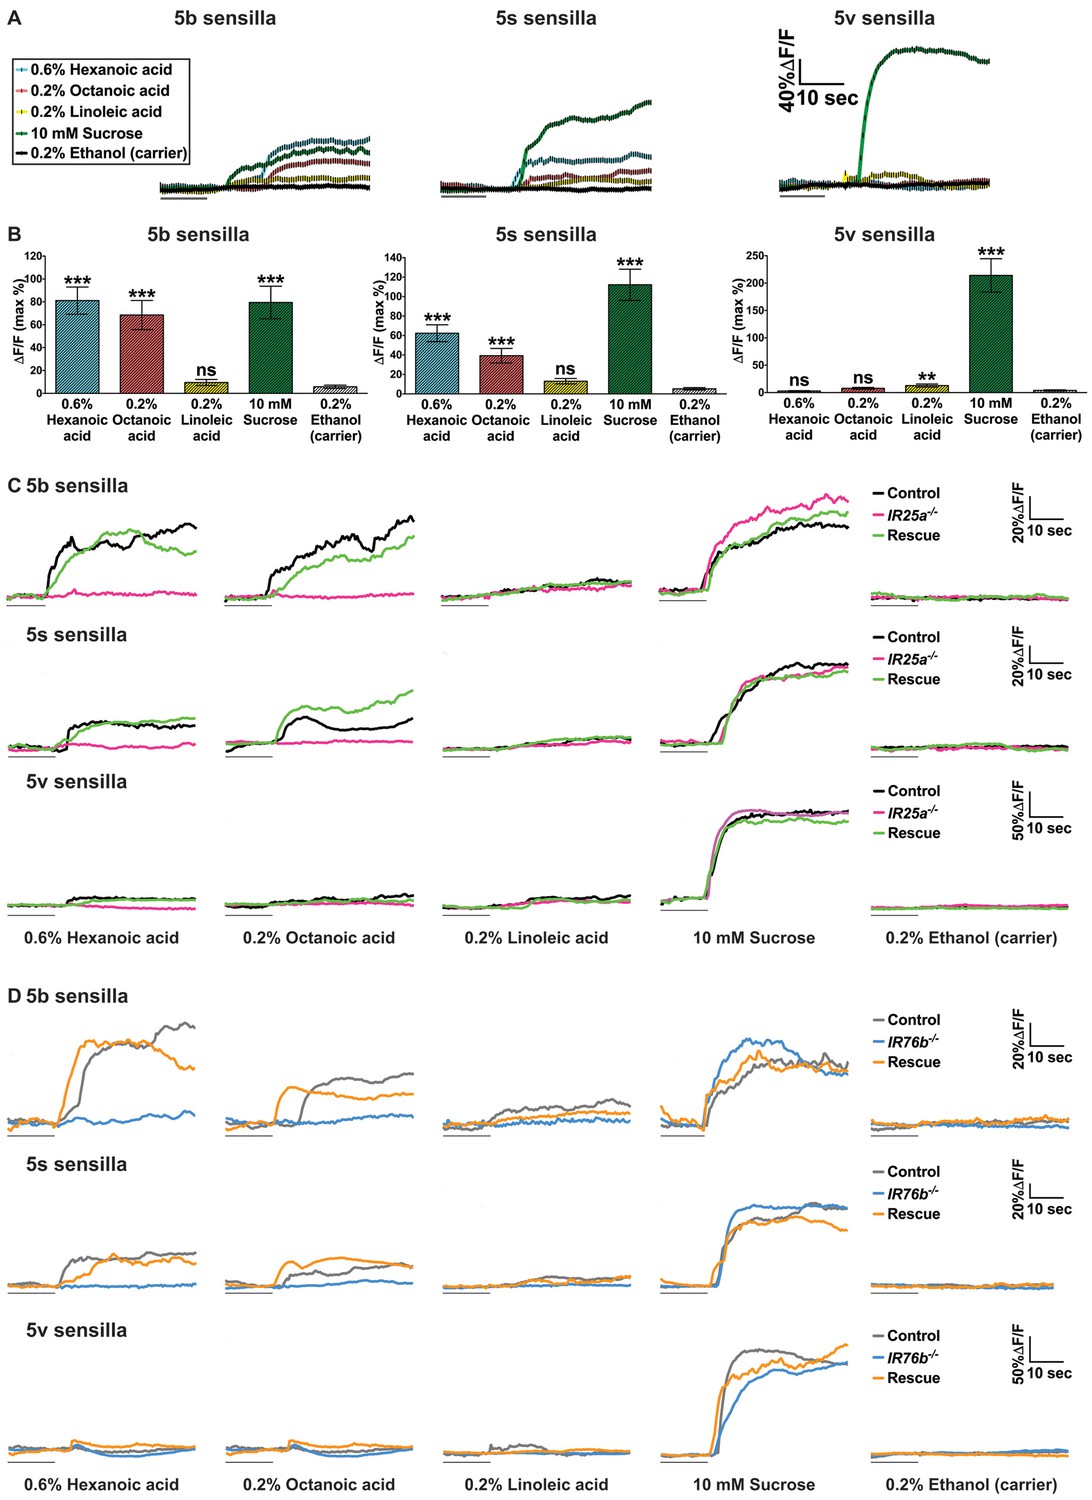
Ca2+ responses of sweet GRNs to fatty acids.
(A and B) Representative fluorescence traces (A) and corresponding Ca2+ responses (B) of control flies (Gr64f-GAL4 UAS-GCaMP6m/+) of the 5b-, 5s- and 5v- associated sweet GRNs upon stimulation with indicated ligands. The gray line underneath the fluorescence traces indicates time of ligand application. Error bar represents the mean ± SEM of Ca2+ imaging from 13 to 26 recordings of female prothoracic legs (B). Two-tailed, Mann-Whitney U test versus 0.2% ethanol (carrier), ***p<0.001, ns: not significant. (C and D) Representative fluorescence traces of the 5b-, 5s- and 5v- associated sweet GRNs of IR25a (C) or IR76b (D) mutant flies to indicated ligands. The gray line underneath the fluorescence traces indicates time of ligand application. Fly genotypes C: Gr64f-GAL4/+; UAS-GCaMP6m/+ (control, black line), IR25a2 Gr64f-GAL4/IR25a2; UAS-GCaMP6m/+ (IR25a-/-, magenta line) and IR25a2 Gr64f-GAL4/IR25a2 UAS-IR25a; UAS-GCaMP6m/+ (rescue, green line). Fly genotypes (D) Gr64f-GAL4 UAS-GCaMP6m/+ (control, light grey line), Gr64f-GAL4 UAS-GCaMP6m/+; IR76b2/IR76b2 (IR76b-/-, blue line) and Gr64f-GAL4 UAS-GCaMP6m/UAS-IR76b; IR76b2/IR76b2 (rescue, orange line). Source data for summary graphs are provided in Figure 4—figure supplement 1—source data 1.
-
Figure 4—figure supplement 1—source data 1
Ca2+ imaging results of sweet GRNs.
(B) Ca2+ responses of sweet GRNs associated with 5b, 5 s or 5b sensilla to fatty acids.
- https://doi.org/10.7554/eLife.30115.014
Figure 5 with 1 supplement

IR56d is necessary for fatty acid taste.
(A) PER responses are reduced to all three fatty acids, but not to sucrose, in flies expressing an UAS-RNAiIR56d construct in sweet GRNs. Targeted knockdown of IR56d is conducted by expression of UAS-IR56dRNAi under control of Gr64f-GAL4. Each bar represents the mean ± SEM of PER responses (n = 49–59 flies). Bars with different letters are significantly different (Kruskal-Wallis test by ranks with Dunn’s multiple comparison tests, p<0.05). Each y-axis delineates groups for Kruskal-Wallis test. Fly genotypes: control flies: Gr64f-GAL4/+ (grey), UAS-IR56dRNAi/+ (lines) and IR56d knock-down fly: Gr64f-GAL4/+; UAS-IR56dRNAi/+ (white). (B and C) Ca2+ responses in 5b- (B) and 5s- (C) associated sweet GRNs of flies expressing UAS-GCaMP6m and UAS-RNAiIR56d in sweet GRNs show loss of fatty acid induced neural activation, compared to neurons of control flies. Targeted knockdown of IR56d in sweet GRNs has no effect on Ca2+ responses to linoleic acid. 10 mM sucrose was used as a positive control. Each bar represents the mean ± SEM of Ca2+ imaging with 3–21 female prothoracic legs. Asterisks indicate a significant difference between the IR56dRNAi and control flies (Two-tailed, Mann-Whitney U test, **p<0.01, ns: not significant). Each y-axis delineates groups for Mann-Whitney U test. Fly genotypes: Gr64f-GAL4 UAS-GCaMP6m/+ (control, black) and Gr64f-GAL4 UAS-GCaMP6m/+; UAS-IR56dRNAi/+ (IR56dRNAi, white). (D) Drawing of the fifth tarsal segment of the prothoracic leg that is used for immunofluorescence experiments (E and F). Tarsal taste sensilla are indicated. (E and F) Expression of IR56d-GAL4 is restricted to a single GRN in all sensilla examined and co-localizes with Gr64f-LexA (E). No expression of IR56d-GAL4 is observed in Gr66a-LexA expressing bitter GRNs associated with 5s sensilla (F). Immunostaining with anti-GFP (green) and anti-mCD8 (magenta) antibodies on whole-mount preparations of tarsal segments of the prothoracic leg from flies of the genotypes: UAS-mCD8:RFP lexAop-rCD2:GFP;IR56d-GAL4/+;Gr64fLexA/TM6c (E) and UAS-mCD8:RFP lexAop-rCD2:GFP;Gr66a-LexA/IR56d-GAL4;+/TM6c (F). Arrows refer to a GRN of a sensillum expressing both Gr64f and IR56d genes. Source data for summary graphs are provided in Figure 5—source data 1.
-
Figure 5—source data 1
PER and Ca2+ responses of IR56d knock-down flies to fatty acids.
(A) PER responses of flies with knockdown of IR56d in sweet GRNs to fatty acids. (B and C) Ca2+ responses of the sweet GRNs associated with 5b (B) or 5s (C) sensilla to fatty acids after knockdown of IR56d in sweet GRNs.
- https://doi.org/10.7554/eLife.30115.019
Figure 5—figure supplement 1
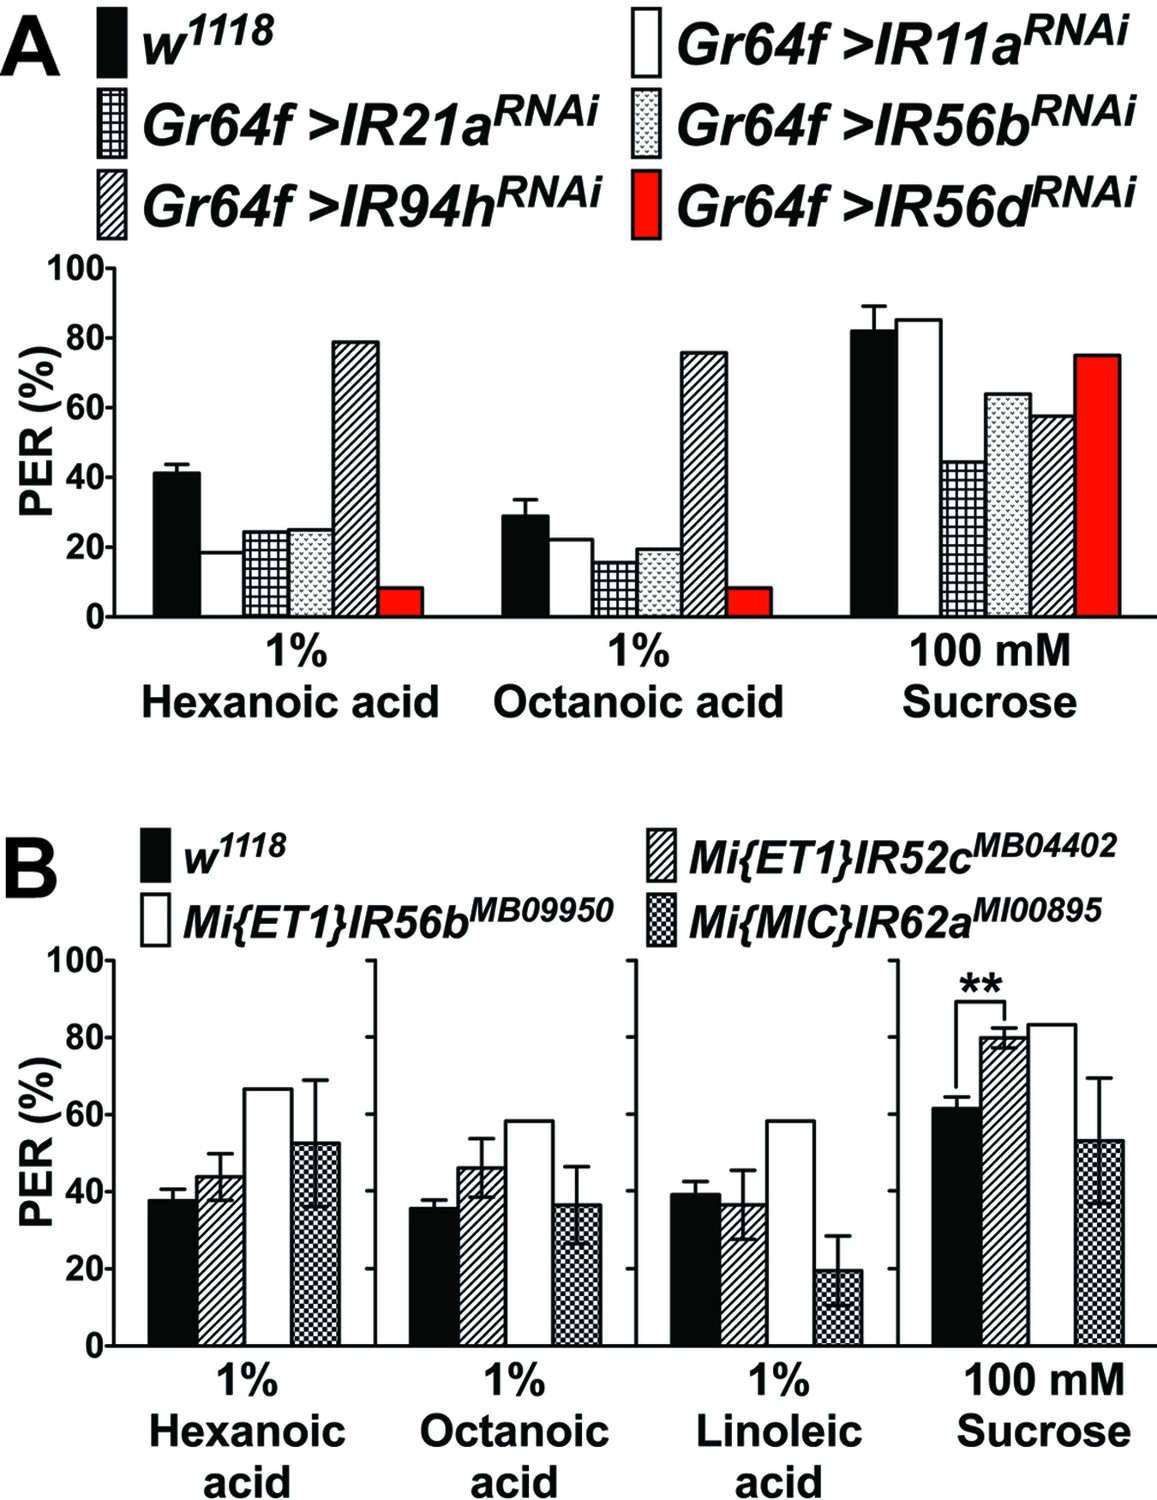
PER responses in IR knockdown flies (A) or IR mutant flies (B) to fatty acids.
(A) PER responses to fatty acids in flies in which IR gene knockdown by RNA interference was done under the control of Gr64f-GAL4. For each genotype, 4 to 12 flies were used and average PER response was calculated, based on three times stimulations with each ligand; with the exception of IR56dRNAi, no obvious reduction of PER was apparent in any of the tested flies. For IR56dRNAi, an extensive PER analysis was carried out (see Figure 5). Note that the UAS-IR94hRNAi line was from another genetic background (Bloomington Drosophila Stock Center), which might explain the higher fatty acid response. Fly genotypes: control: w1118 (black); Gr64f-GAL4/UAS-IR11aRNAi (Gr64f > IR11aRNAi, white), Gr64f-GAL4/+;UAS-IR21aRNAi/+ (Gr64f > IR21aRNAi, grids), Gr64f-GAL4/+;UAS-IR56bRNAi/+ (Gr64f > IR56bRNAi/+, dots), Gr64f-GAL4/UAS-IR94hRNAi (Gr64f > IR94hRNAi, lines) and Gr64f-GAL4/+;UAS-IR56dRNAi/+ (Gr64f > IR56dRNAi, red). (B) PER responses to fatty acids in flies homozygous for the indicated mutation. Each bar represents the mean ± SEM of three to six PER assays (6–12 flies per assay, 44–77 flies in total). For IR56b mutants, only 4 to 12 flies were tested and no SEM could be determined. No statistical significant differences in PER responses to fatty acids were observed for IR52c or IR62a mutants, when compared to controls; PER responses to sugar (asterisk) is higher in IR52c mutant flies compared to controls (w1118; two-tailed, Mann-Whitney U test, **p<0.01). Source data for summary graphs are provided in Figure 5—figure supplement 1—source data 1.
-
Figure 5—figure supplement 1—source data 1
PER responses of flies with knockdown of IR genes in sweet GRNs (A) or IR mutants (B) to fatty acids.
- https://doi.org/10.7554/eLife.30115.018
Figure 6 with 1 supplement

A subset of bitter GRNs responds to hexanoic acids in an IR25a/IR76b independent manner.
(A) Representative still images of the fifth tarsal segment of the prothoracic leg show maximum Ca2+ responses in the bitter GRNs associated with 5b and 5 s sensilla upon stimulation by indicated ligands. ΔF indicates the changes in fluorescence light intensity of the cell body before/after ligand application. (B) Representative fluorescence traces (top) and corresponding Ca2+ responses (bottom) of the 5b- and 5s-associated bitter GRNs upon stimulation by indicated ligands. The gray line underneath the fluorescence traces indicates time of ligand application. Hexanoic acid elicits highly significant Ca2+ responses in the 5b- associated bitter GRNs (compared to carrier). 1 mM denatonium was used as a positive ligand control. 1% ethanol was used as a carrier to facilitate solubilization of high concentrations of hexanoic acid (2.5%). Each bar represents the mean ± SEM of Ca2+ imaging with 10–30 female prothoracic legs. Two-tailed, Mann-Whitney U test versus carrier (1% ethanol), ***p<0.001, ns: not significant. Fly genotype is Gr33aGAL4 UAS-GCaMP6m/+. (C and D) Cellular responses to fatty acid in bitter GRNs do not require IR25a and IR76b. Ca2+ responses of the 5b-assoicated bitter GRNs of IR25a (C) or IR76b (D) mutant flies to indicated ligands. Ca2+ responses of GRNs of mutants to hexanoic acid were not significantly reduced when compared to control flies. Each bar represents the mean ± SEM of Ca2+ imaging with 4–42 female prothoracic legs. Bars with different letters are significantly different (Kruskal-Wallis test by ranks with Dunn’s multiple comparison tests, p<0.05). Each y-axis delineates groups for Kruskal-Wallis test. Fly genotypes C: Gr33aGAL4/+; UAS-GCaMP6m/+ (Control, black), IR25a2 Gr33aGAL4/IR25a2; UAS-GCaMP6m/+ (IR25a-/-, white), and IR25a2 Gr33aGAL4/IR25a2 UAS-IR25a; UAS-GCaMP6m/+ (Rescue, grey); Fly Genotypes D: Gr33aGAL4 UAS-GCaMP6m/+ (Control, black), Gr33aGAL4 UAS-GCaMP6m/+; IR76b2/IR76b2 (Ir76b-/-, white) and Gr33aGAL4 UAS-GCaMP6m/UAS-IR76b; IR76b2/IR76b2 (Rescue, grey). See Figure 6—figure supplement 1—source data 1 for hexanoic acid responses of 5s-associated bitter GRNs from IR25a or IR76b mutant flies. Source data for summary graphs are provided in Figure 6—source data 1.
-
Figure 6—source data 1
Ca2+ responses of bitter GRNs of IR25a or IR76b mutant flies to fatty acids.
(B) Ca2+ responses of bitter GRNs associated with 5b or 5s sensilla to fatty acids. (C) Ca2+ responses of bitter GRNs associated with 5b sensilla of IR25a mutant flies to hexanoic acid. (D) Ca2+ responses of bitter GRNs associated with 5b sensilla of IR76b mutant flies to hexanoic acid.
- https://doi.org/10.7554/eLife.30115.023
Figure 6—figure supplement 1
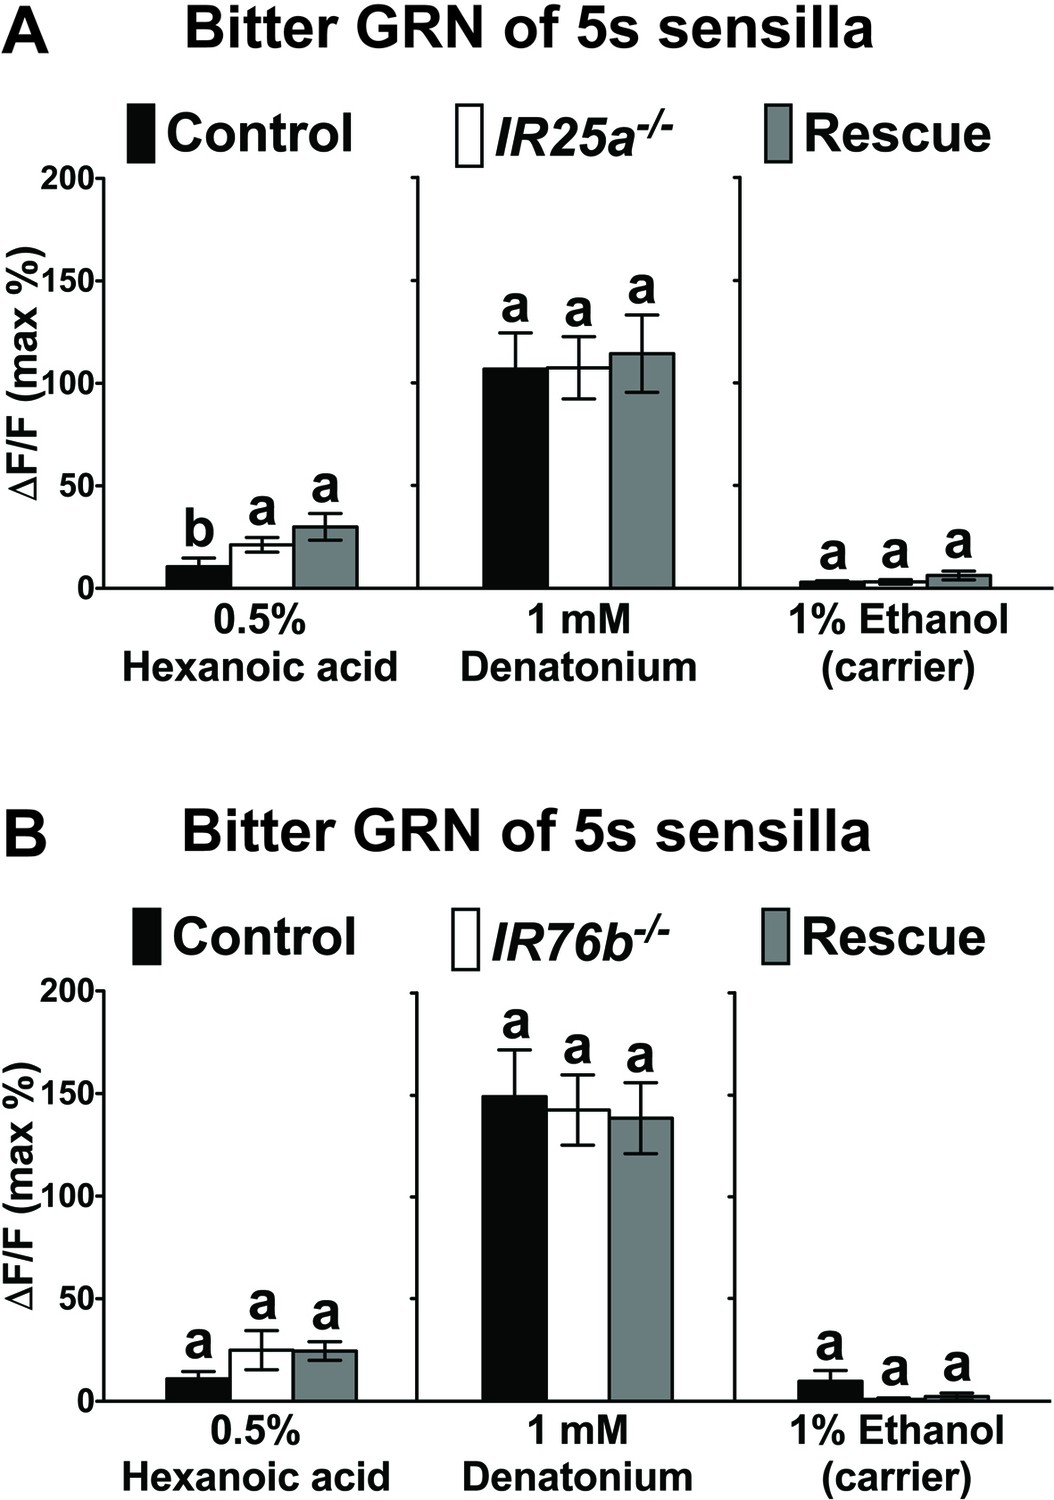
Hexanoic acid responses of 5s -associated bitter GRNs of IR25a (A) or IR76b (B) mutant flies.
Because the overall responses are so low, the relevance of differences between some genotypes in the IR25a group is unclear. Each bar represents the mean ± SEM of Ca2+ imaging with 4–39 female prothoracic legs. Bars with different letters are significantly different (Kruskal-Wallis test by ranks with Dunn’s multiple comparison tests, p<0.05). Each y-axis delineates groups for Kruskal-Wallis test. Genotypes are same as genotypes in Figure 6C and D. Source data for summary graphs are provided in Figure 6—figure supplement 1—source data 1.
-
Figure 6—figure supplement 1—source data 1
Ca2+ responses of bitter GRNs associated with 5s sensilla of IR25a (A) or IR76b (B) mutant flies to hexanoic acid.
- https://doi.org/10.7554/eLife.30115.022
Figure 7 with 2 supplements
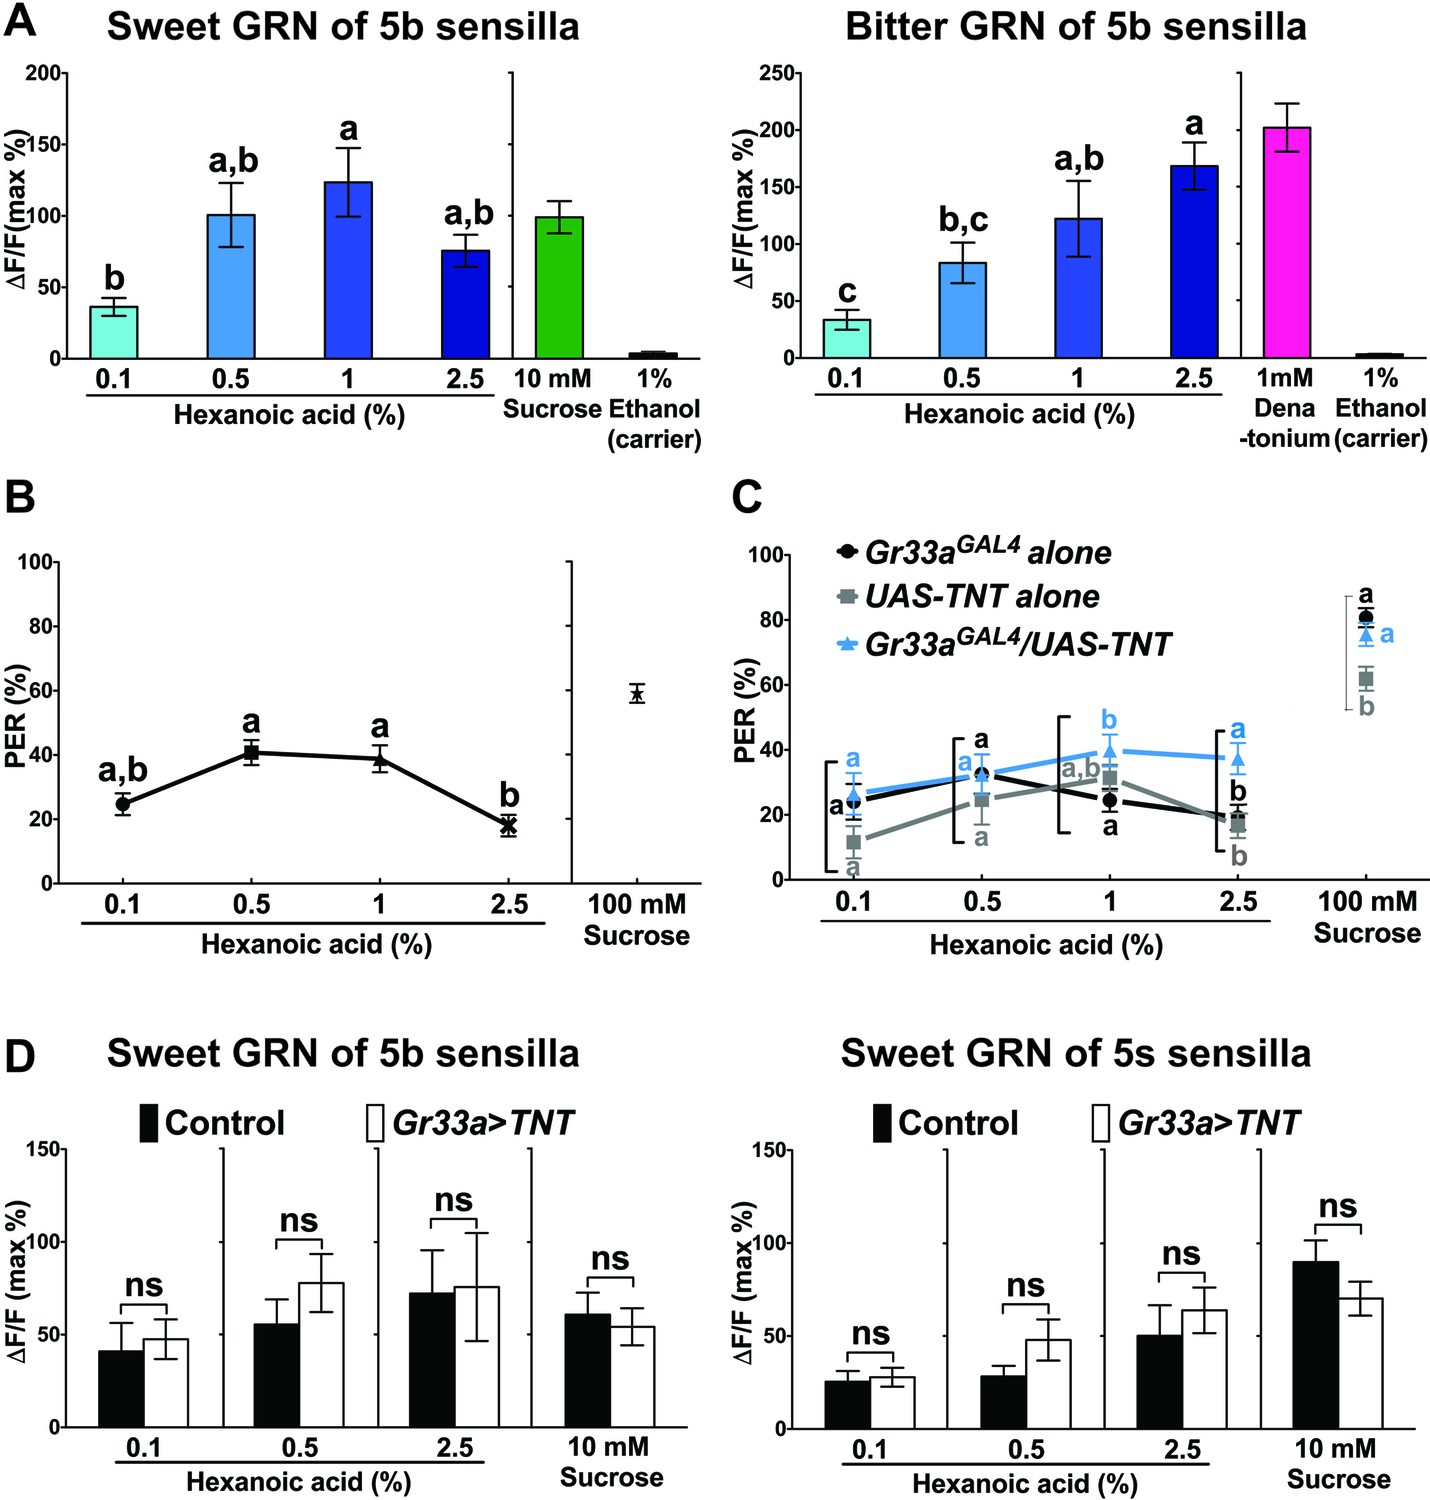
Bitter GRNs inhibit acceptance of high concentration of hexanoic acid.
(A) Hexanoic acid dose response profiles of the sweet (left) and the bitter (right) GRNs associated with the 5b sensilla. sweet GRN reaches a maximal response already at 1%, while bitter GRNs responses further increases as ligand concentration increases. Each bar represents the mean ± SEM of Ca2+ imaging with 7–30 female prothoracic legs. Bars with different letters are significantly different (Kruskal-Wallis test by ranks with Dunn’s multiple comparison tests, p<0.05). Each y-axis delineates groups for Kruskal-Wallis test. Fly genotypes: Gr64f-GAL4 UAS-GCaMP6m/+ and Gr33aGAL4/+;UAS-GCaMP6m/+. For hexanoic acid response profiles of the sweet GRNs, or the bitter GRN associated with 5 s/5v sensilla, see Figure 7—figure supplement 1. (B) PER responses of wild-type flies (w1118) to different concentrations of hexanoic acid. At high concentration (2.5%) hexanoic acids induces a much lower PER response compared to more modest concentrations (0.5%–1%). Each symbol represents the mean ± SEM of PER responses (n = 61–142 flies). Symbols with different letters are significantly different (Kruskal-Wallis test by ranks with Dunn’s multiple comparison tests, p<0.01). Each y-axis delineates groups for Kruskal-Wallis test. (C) Inactivation of bitter GRN leads to concentration dependent PER responses to hexanoic acid, while control flies show a response profile similar to w1118 flies (see B). Each symbol represents the mean ± SEM of PER responses (n = 23–121 flies). Symbols with different letters are significantly different (Kruskal-Wallis test by ranks with Dunn’s multiple comparison tests, p<0.05). Each square bracket delineates groups for Kruskal-Wallis test. Fly genotypes: Gr33aGAL4/+ (Gr33aGAL4 alone), UAS-TNT/+ (UAS-TNT alone) and Gr33aGAL4/UAS-TNT. (D) Inactivation of bitter GRNs has no effect on cellular responses of sweet GRNs to hexanoic acid. Ca2+ responses of sweet GRNs to 2.5% hexanoic acid are similar regardless of whether a functional bitter GRN is present. Bitter GRNs was inactivated by expressing UAS-TNT under the control of Gr33aGAL4. Each bar represents the mean ± SEM of 10–15 female GRNs from prothoracic legs. Two-tailed, Mann-Whitney U test between the flies lacking functional bitter GRNs and control flies, p<0.05, ns: not significant. Each y-axis delineates groups for Mann-Whitney U test. Fly genotypes: Gr64fLexA/lexAop-GCaMP6m (control) and Gr33aGAL4/UAS-TNT; Gr64fLexA/lexAop-GCaMP6m (Gr33a > TNT). Source data for summary graphs are provided in Figure 7—source data 1.
-
Figure 7—source data 1
Dosage dependent Ca2+ and PER responses of neurons and flies to hexanoic acid.
(A) Ca2+ responses of the sweet or the bitter GRNs associated with 5b sensilla to different dosages of hexanoic acid. (B) PER responses of wild-type flies (w1118) to different dosages of hexanoic acid. (C) PER responses of flies to different dosages of hexanoic acid when bitter GRNs are inactivated by expression of UAS-TNT. (D) Ca2+ responses of the sweet GRNs associated with 5b or 5s sensilla to different dosages of hexanoic acid when bitter GRNs are inactivated by expression of UAS-TNT.
- https://doi.org/10.7554/eLife.30115.029
Figure 7—figure supplement 1

Hexanoic acid responses of 5s/5v associated sweet (A and B) or bitter (C) GRNs.
Both the 5s- (A) and the 5v- (B) associated sweet GRN show a maximal Ca2+ response at the relative low concentration of 0.5% hexanoic acid. The 5s-associated bitter GRNs shows only weak Ca2+ response to hexanoic acid, but they are significantly higher than responses to carrier (C). Each bar represents the mean ± SEM of Ca2+ imaging with 13–55 female prothoracic legs. Bars with different letters are significantly different (Kruskal-Wallis test by ranks with Dunn’s multiple comparison tests, p<0.05). Each y-axis delineates groups for Kruskal-Wallis test. Genotypes are same as genotypes in Figure 7A. Source data for summary graphs are provided in Figure 7—figure supplement 1—source data 1.
-
Figure 7—figure supplement 1—source data 1
Ca2+ responses of sweetGRNs associated with 5s (A) or 5v (B) sensilla to different dosages of hexanoic acid.
(C) Ca2+ responses of bitter GRNs associated with 5s sensilla to different dosages of hexanoic acid.
- https://doi.org/10.7554/eLife.30115.026
Figure 7—figure supplement 2
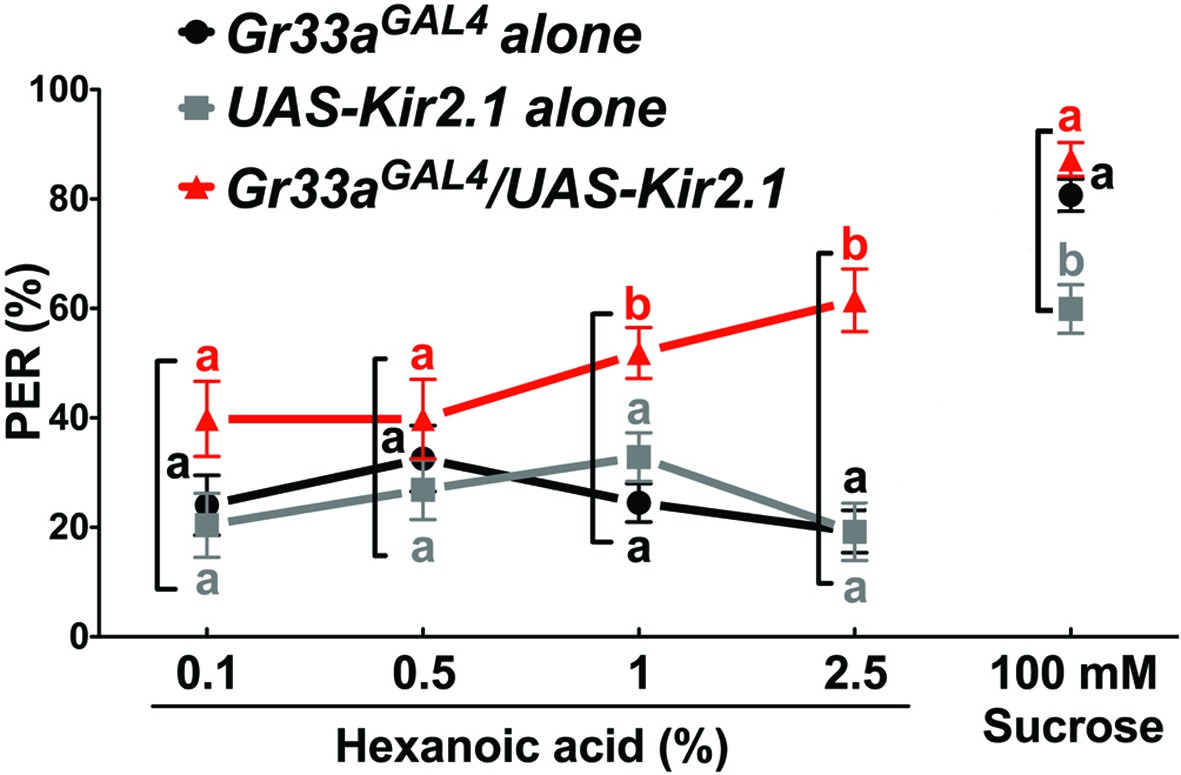
Bitter GRNs suppress PER responses to high concentration of hexanoic acid.
Flies lacking functional bitter GRNs (Gr33aGAL4/UAS-Kir2.1) show significantly higher PER responses to 2.5% hexanoic acid concentration, compared to control flies (Gr33aGAL4 or UAS-Kir2.1 alone). Each symbol represents the mean ± SEM of PER responses (n = 33–121 flies). Symbols with different letters represent significant differences (Kruskal-Wallis test by ranks with Dunn’s multiple comparison tests, p<0.05). Each square bracket delineates groups for Kruskal-Wallis test. Fly genotypes: Gr33aGAL4/+ (Gr33aGAL4 alone), UAS-Kir2.1-GFP/+ (UAS-Kir2.1 alone) and Gr33aGAL4/UAS-Kir2.1-GFP (Gr33aGAL4/UAS-Kir2.1). Source data for summary graphs are provided in Figure 7—figure supplement 2—source data 1.
-
Figure 7—figure supplement 2—source data 1
Dosage dependent PER responses of flies with inactivated bitter GRNs to hexanoic acid.
- https://doi.org/10.7554/eLife.30115.028
Author response image 1

PER responses of IR8a mutant flies (IR8a1) to fatty acids.
Each bar represents the mean ± SEM of PER responses (n = 35- 55 flies). NS indicates a no significant difference between IR8a mutant and control (w1118) flies (Two-tailed, Mann-Whitney U test, p < 0.05, ns: not significant). Each y-axis delineates groups for Mann-Whitney U test.
Tables
Key resources table
| Reagent type | Designation | Source or reference | Identifiers |
|---|---|---|---|
| Antibodies | |||
| Chicken polyclonal anti-GFP | Anti-GFP | Thermo Fisher Scientific | PA1-86341; RRID: AB_931091 |
| Rat monoclonal anti-mCD8 | Anti-mCD8 | Thermo Fisher Scientific | MCD0800; RRID: AB_10392843 |
| Rabbit polyclonal anti-IR25a | Anti-IR25a | Benton et al. (2009) | N/A |
| Mouse monoclonal anti-HA | Anti-HA | Covance Research Product Inc. | MMS-101P; RRID: AB_2314672 |
| Alexa 488 conjugated goat anti-chicken | Green | Thermo Fisher Scientific | A11039; RRID: AB_2534096 |
| Cy3-conjugated goat anti-rat | Magenta | Jackson Immunoresearch Laboratories Inc. | 112-165-072; RRID: AB_2338248 |
| Cy3-conjugated goat anti-rabbit | Magenta | Jackson Immunoresearch Laboratories Inc. | 111-166-003; RRID: AB_2338000 |
| Cy3-conjugated goat anti-mouse | Magenta | Jackson Immunoresearch Laboratories Inc. | 115-166-072; RRID: AB_2338706 |
| Chemical compounds | |||
| Hexanoic acid | Hexanoic acid | Sigma-Aldrich | H12137 |
| Octanoic acid | Octanoic acid | Sigma-Aldrich | O3907 |
| Linoleic acid | Linoleic acid | Sigma-Aldrich | L1376 |
| Denatonium benzoate | Denatonium | Sigma-Aldrich | D5765 |
| Sucrose | Sucrose | Amresco | M1117 |
| Experimental Models: Organisms/Strains | |||
| D. melanogaster: w1118 | Wild-type control | Bloomington Drosophila Stock Center | BDSC: 3605; FlyBase: FBst0003605 |
| D. melanogaster: w*; P{Gr64f-GAL4.9.7}5/CyO; MKRS/TM2 | Gr64f-GAL4 | Dahanukar et al. (2007) | Flybase: FBst0057669 |
| D. melanogaster: w*; TI{LexA::VP16}Gr64fLexA | Gr64fLexA | Fujii et al. (2015) | Flybase: FBti0168176 |
| D. melanogaster: w*; TI{GAL4}Gr33aGAL4 | Gr33aGAL4 | Moon et al. (2009) | Flybase: FBst0031425 |
| D. melanogaster: w*; P{UAS-TeTxLC.tnt}G2 | UAS-TNT | Sweeney et al. (1995) | Flybase: FBst0028838 |
| D. melanogaster: w*; P{lexAop-rCD2-GFP} | lexAop-rCD2:GFP | Lai and Lee (2006) | Flybase: FBst0066687 |
| D. melanogaster: w*;P{10XUAS-IVS-mCD8::RFP}attP40 | UAS-mCD8:RFP | Bloomington Drosophila Stock Center | BDSC: 32219; Flybase: FBti0131967 |
| D. melanogaster: w1118; PBac{20XUAS-IVS-GCaMP6m}VK00005 | UAS-GCaMP6m | Bloomington Drosophila Stock Center | BDSC: 42750; Flybase: FBst0042750 |
| D. melanogaster: y1 w*; P{UAS-mCD8::GFP.L}LL5,P{UAS-mCD8::GFP.L}2 | UAS-mCD8:GFP | Bloomington Drosophila Stock Center | BDSC: 5137; Flybase: FBst0005137 |
| D. melanogaster: y1 w1118; P{QUAS-mtdTomato-3xHA}26 | QUAS-mtd-Tomato-3xHA | Bloomington Drosophila Stock Center | BDSC: 30005; Flybase: FBst0030005 |
| D. melanogaster: y1 sc* v1; P{TRiP.HMC03664}attP40 | UAS-IR94h-RNAi | Bloomington Drosophila Stock Center | BDSC: 53675; Flybase: FBst0053675 |
| D. melanogaster: w1118; Mi{ET1}IR52cMB04402 | Mi{ET1}IR52cMB04402 | Bloomington Drosophila Stock Center | BDSC: 24580; Flybase: FBst0024580 |
| D. melanogaster: w1118; Mi{ET1}IR56bMB09950 | Mi{ET1}IR56bMB09950 | Bloomington Drosophila Stock Center | BDSC: 27818; Flybase: FBst0027818 |
| D. melanogaster: y1 w*;Mi{MIC}IR62aMI00895 lml1MI00895/TM3, Sb1, Ser1 | Mi{Mic}IR62aMI00895 | Bloomington Drosophila Stock Center | BDSC: 32713; Flybase: FBst0032713 |
| D. melanogaster: w1118;P{UAS-norpA.WT}2 | UAS-norpA | Bloomington Drosophila Stock Center | BDSC: 35529; Flybase: FBst0035529 |
| D. melanogaster: w*; TI{TI}IR25a1/CyO | IR25a1/CyO | Benton et al. (2009) | Flybase: FBst0041737 |
| D. melanogaster: w*; P{IR25a-GAL4.A}236.1; TM2/TM6B, Tb1 | IR25a-GAL4 | Abuin et al. (2011) | Flybase: FBst0041728 |
| D. melanogaster: w*; M{UAS-IR25a.attB} | UAS-IR25a | Abuin et al. (2011) | Flybase: FBal0249355 |
| D. melanogaster: {KK104276}VIE-260B | UAS-IR11a-RNAi | Vienna Drosophila Resource Center | VDRC ID: 100422; Flybase: FBgn0030385 |
| D. melanogaster: w1118; P{GD773}v2472 | UAS-IR21a-RNAi | Vienna Drosophila Resource Center | VDRC ID: 2472; Flybase: FBgn0031209 |
| D. melanogaster: w1118; P{GD2094}v4704 | UAS-IR56b-RNAi | Vienna Drosophila Resource Center | VDRC ID: 4704; Flybase: FBgn0034456 |
| D. melanogaster: w1118; P{GD2096}v6112 | UAS-IR56d-RNAi | Vienna Drosophila Resource Center | VDRC ID: 6112; Flybase: FBgn0034458 |
| D. melanogaster: w*; IR76b1 | IR76b1/IR76b1 | Zhang et al. (2013) | Flybase: FBst0051309 |
| D. melanogaster: w*; IR76b2 | IR76b2/IR76b2 | Zhang et al. (2013) | Flybase: FBst0051310 |
| D. melanogaster: w*; P{IR76b-GAL4.1.5}2 | IR76b-GAL4, | Zhang et al. (2013) | Flybase: FBst0051311 |
| D. melanogaster: w*; P{UAS-IR76b.Z}2/CyO; TM2/TM6B, Tb1 | UAS-IR76b | Zhang et al. (2013) | Flybase: FBst0052610 |
| D. melanogaster: w*; P{IR76b-QF.1.5} | IR76b-QF | Zhang et al. (2013) | Flybase: FBtp0085487 |
| D. melanogaster: w*; P{UAS-Hsap\KCNJ2.EGFP}1 | UAS-Kir2.1-GFP | Baines et al. (2001); Paradis et al. (2001) | Flybase: FBst0006596 |
| D. melanogaster: w*; norpA36(P24) | norpAP24 | Masek and Keene (2013) | Flybase: FBst0009048 |
| D. melanogaster: w*; P{IR56d-GAL4.K}7–2/CyO; P{UAS-mCD8::GFP.L}LL6 | IR56d-GAL4 | Koh et al. (2014) | Flybase: FBst0060708 |
| D. melanogaster: w*; Gr66a-LexA/CyO; TM2/TM6B | Gr66a-LexA | Thistle et al. (2012) | Flybase: FBal0277069 |
| Software and Algorithms | |||
| NIS-Elements | N/A | Nikon | N/A |
| Prism software | Prism software | GraphPad Software 5.0 Inc | N/A |
| Other | |||
| Nikon Eclipse Ti inverted microscope | Nikon Eclipse Ti inverted microscope | Nikon | N/A |
| Nikon A1 confocal microscope | Nikon A1R confocal microscope system | Nikon | N/A |
| 35 mM Glass bottom dish | Glass bottom culture dish | MatTek Corporation | P35G-0–10 C |
Additional files
-
Transparent reporting form
- https://doi.org/10.7554/eLife.30115.030
Download links
A two-part list of links to download the article, or parts of the article, in various formats.
Downloads (link to download the article as PDF)
Open citations (links to open the citations from this article in various online reference manager services)
Cite this article (links to download the citations from this article in formats compatible with various reference manager tools)
Molecular basis of fatty acid taste in Drosophila
eLife 6:e30115.
https://doi.org/10.7554/eLife.30115


