Convergence of topological domain boundaries, insulators, and polytene interbands revealed by high-resolution mapping of chromatin contacts in the early Drosophila melanogaster embryo
- University of California, United States
- Howard Hughes Medical Institute, United States
Figures
Figure 1
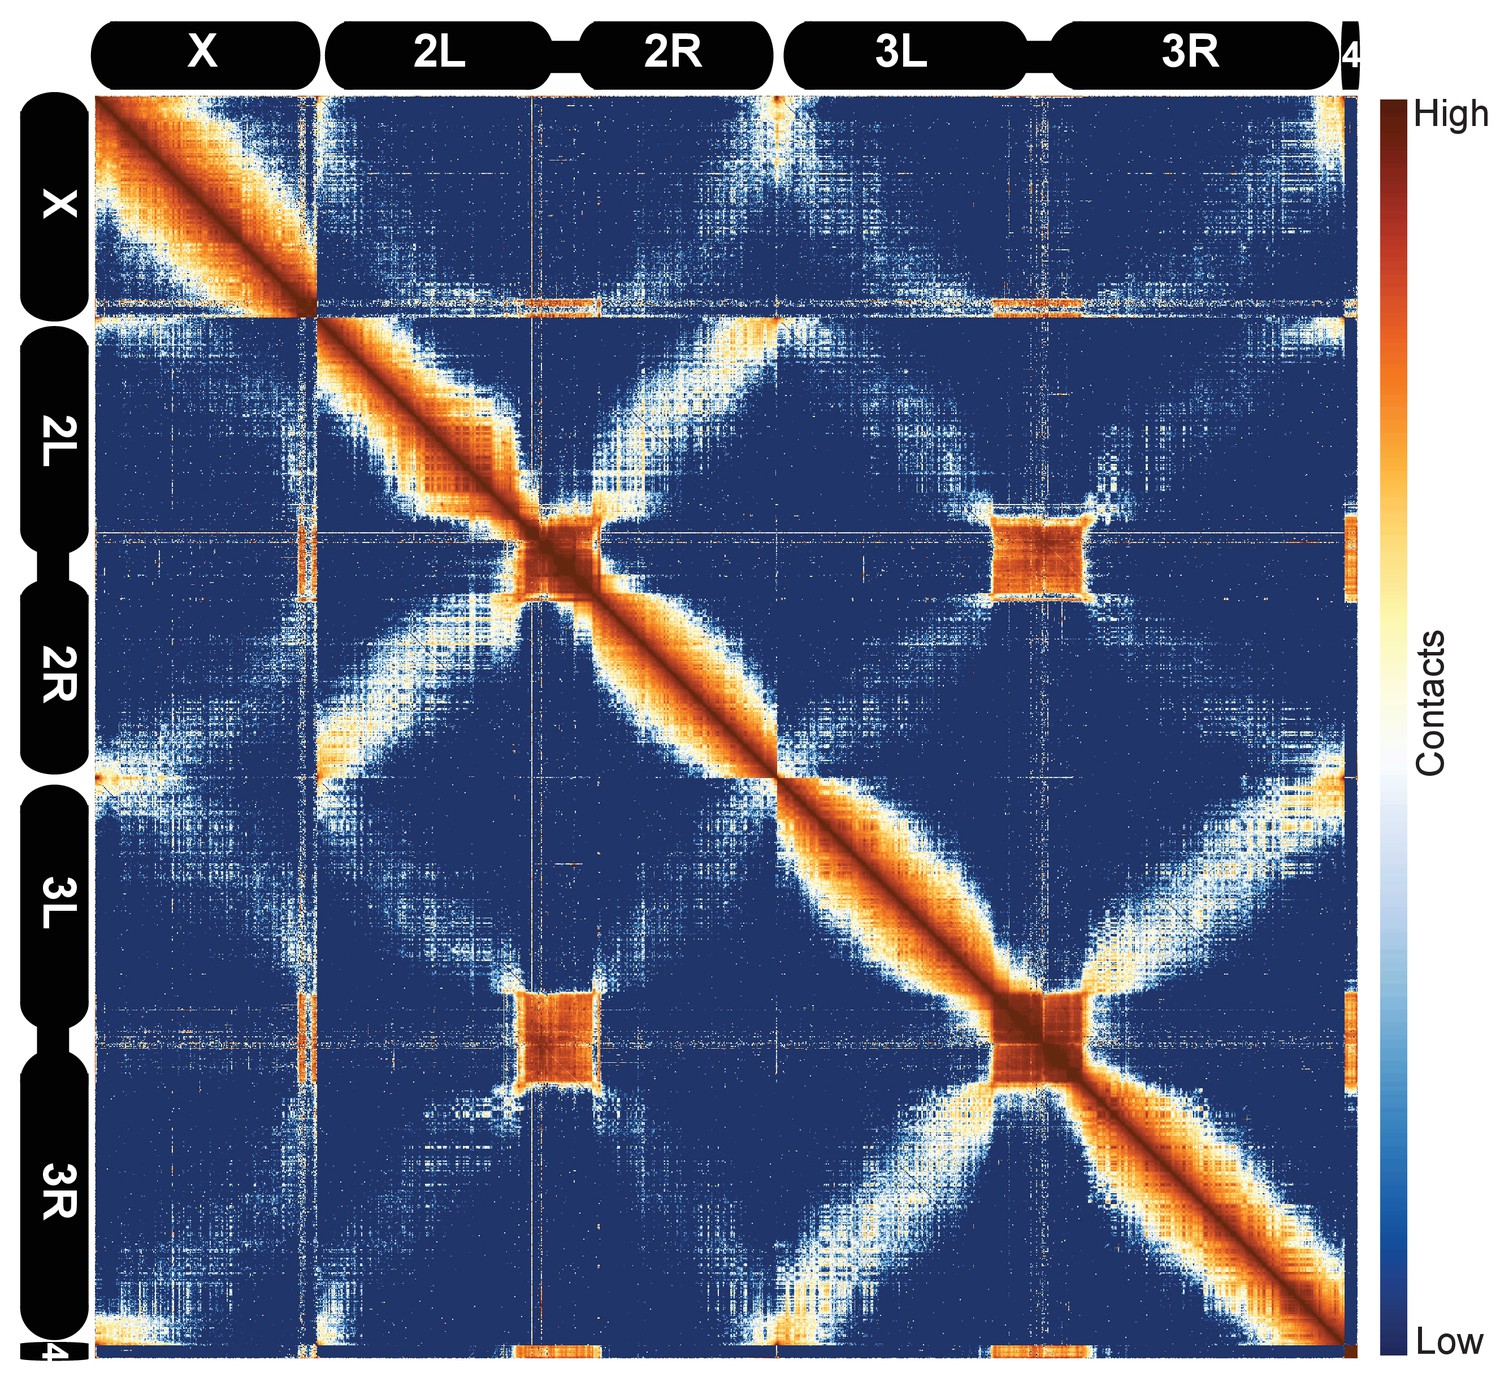
Hi-C map of the stage 5 Drosophila melanogaster genome at 100 kb resolution.
Data from all nc14 datasets was aggregated and normalized by the ‘vanilla coverage’ method. To enhance contrast, the logarithm values of the normalized counts were histogram equalized, and maximum and minimum values were adjusted for optimal display.
Figure 2 with 5 supplements
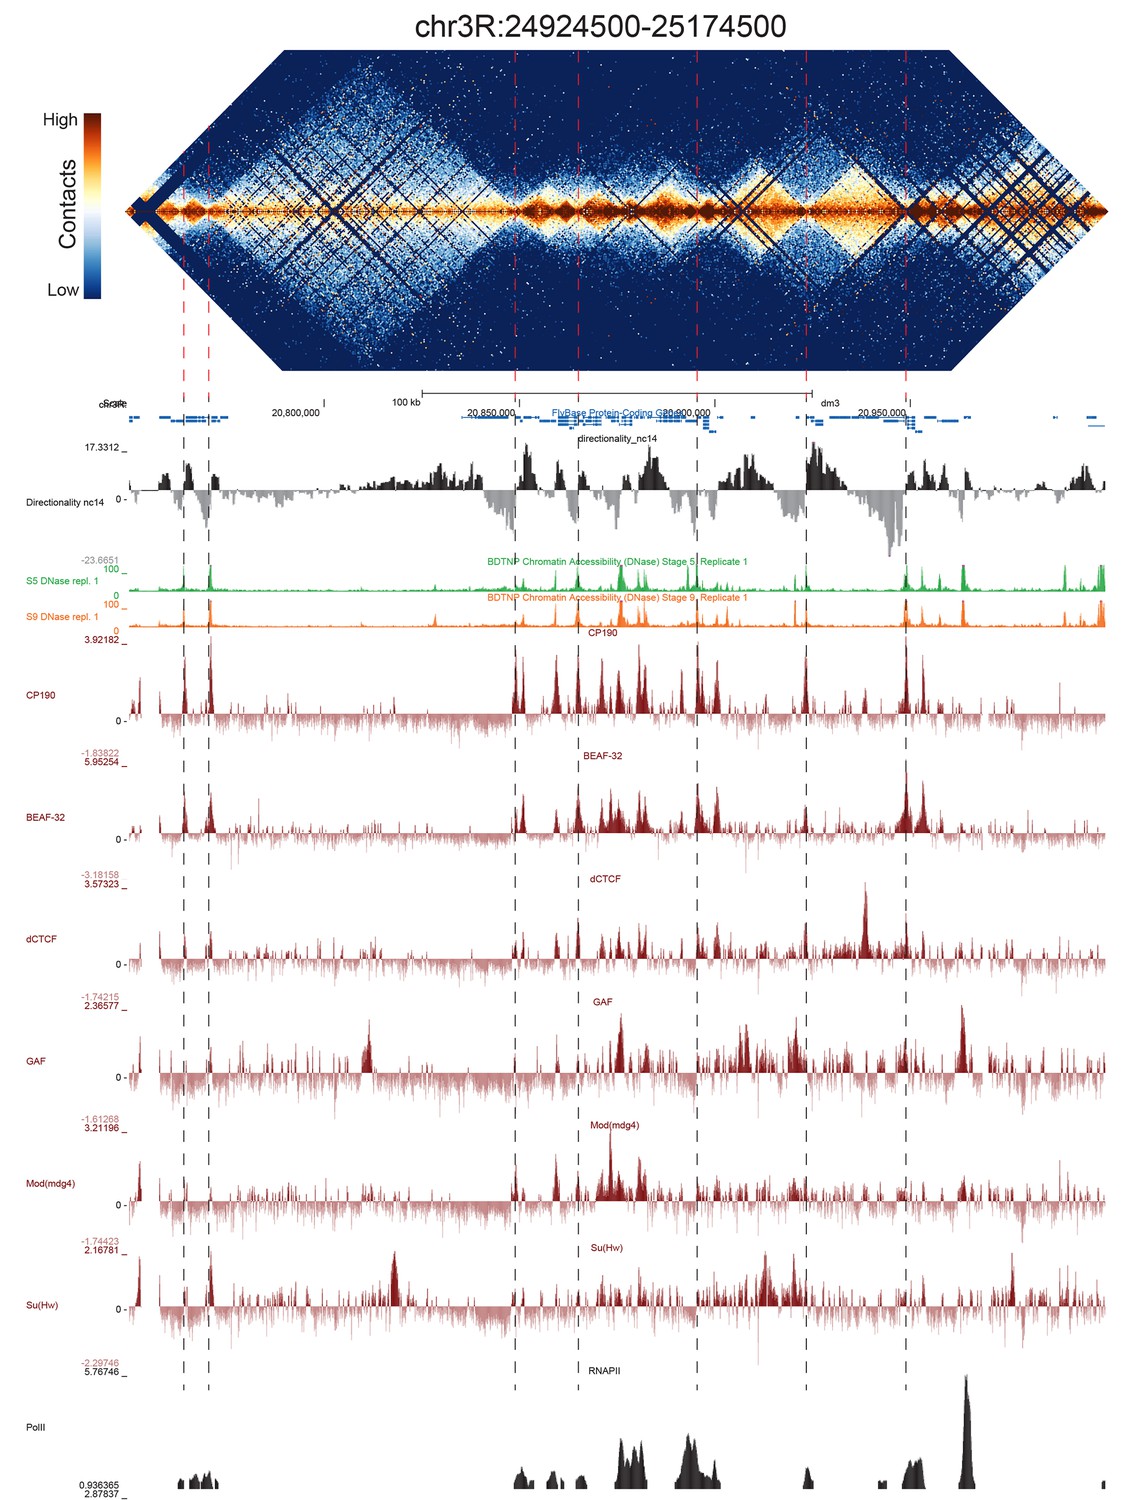
Example region of Hi-C data at 500 bp resolution.
Heat map of aggregate Hi-C data for all nc14 datasets binned at 500 bp is shown for the region located at 3R:24924500–25174500 (dm3: 3R:20750000–20999999). Raw counts were normalized by the vanilla coverage method, the logarithm was taken, and minimum and maximum values were adjusted for visual contrast. A UCSC browser (Kent et al., 2002) window for the corresponding coordinates is shown with tracks for Hi-C directionality (calculated from the Hi-C data shown in the heatmap), DNase accessibility (X.-Y. Li et al., 2011), RNA polII and TFIIB (Li et al., 2008), and the insulator proteins CP190, BEAF-32, dCTCF, GAF, mod(mdg4), and Su(Hw) from (Nègre et al., 2010). Dashed red lines are visual guides and are manually drawn at locations of apparent boundaries; they do not reflect algorithmically or unbiased hand-curated boundary calls.
Figure 2—figure supplement 1
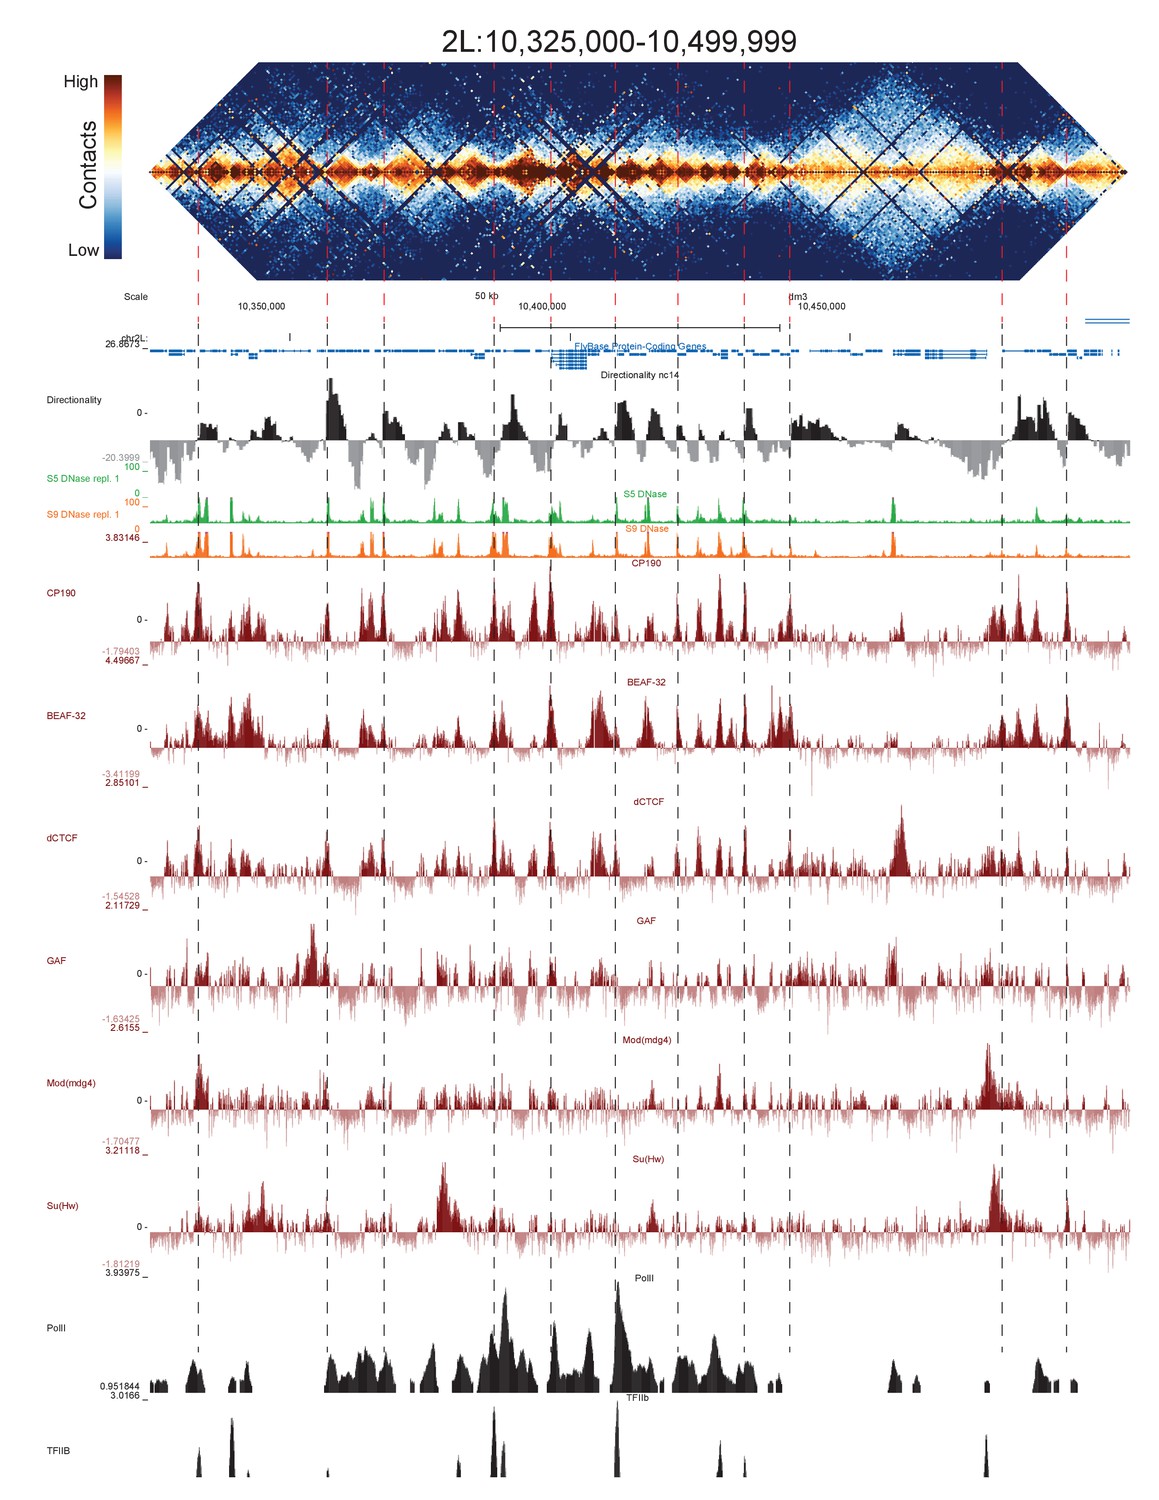
High resolution Hi-C maps of additional example genomic regions from stage 5 Drosophila melanogaster embryos.
Region 2L:10325000–10499999 (dm6 and dm3). Data were prepared identically to Figure 2, and all data is from the same sources.
Figure 2—figure supplement 2
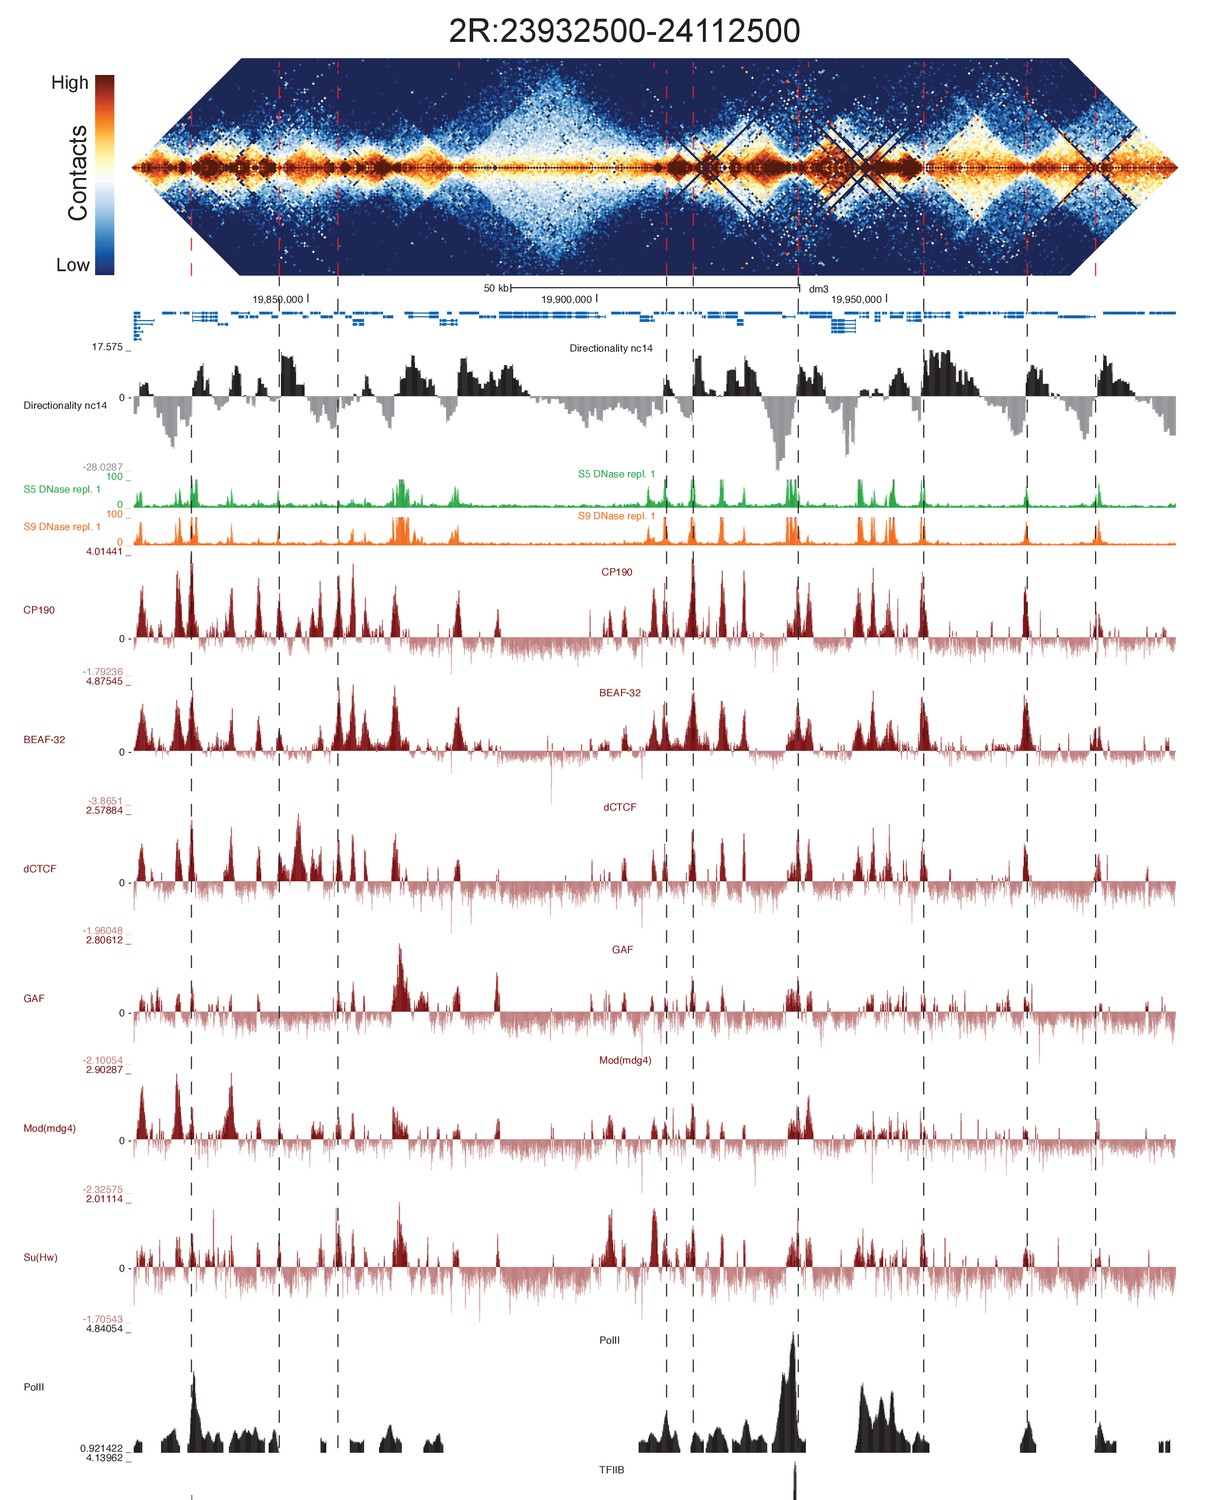
High resolution Hi-C maps of additional example genomic regions from stage 5 Drosophila melanogaster embryos.
Region 2R:23932500–24112500 (dm3: 2R:19820000–19999999). Data were prepared identically to Figure 2, and all data is from the same sources.
Figure 2—figure supplement 3
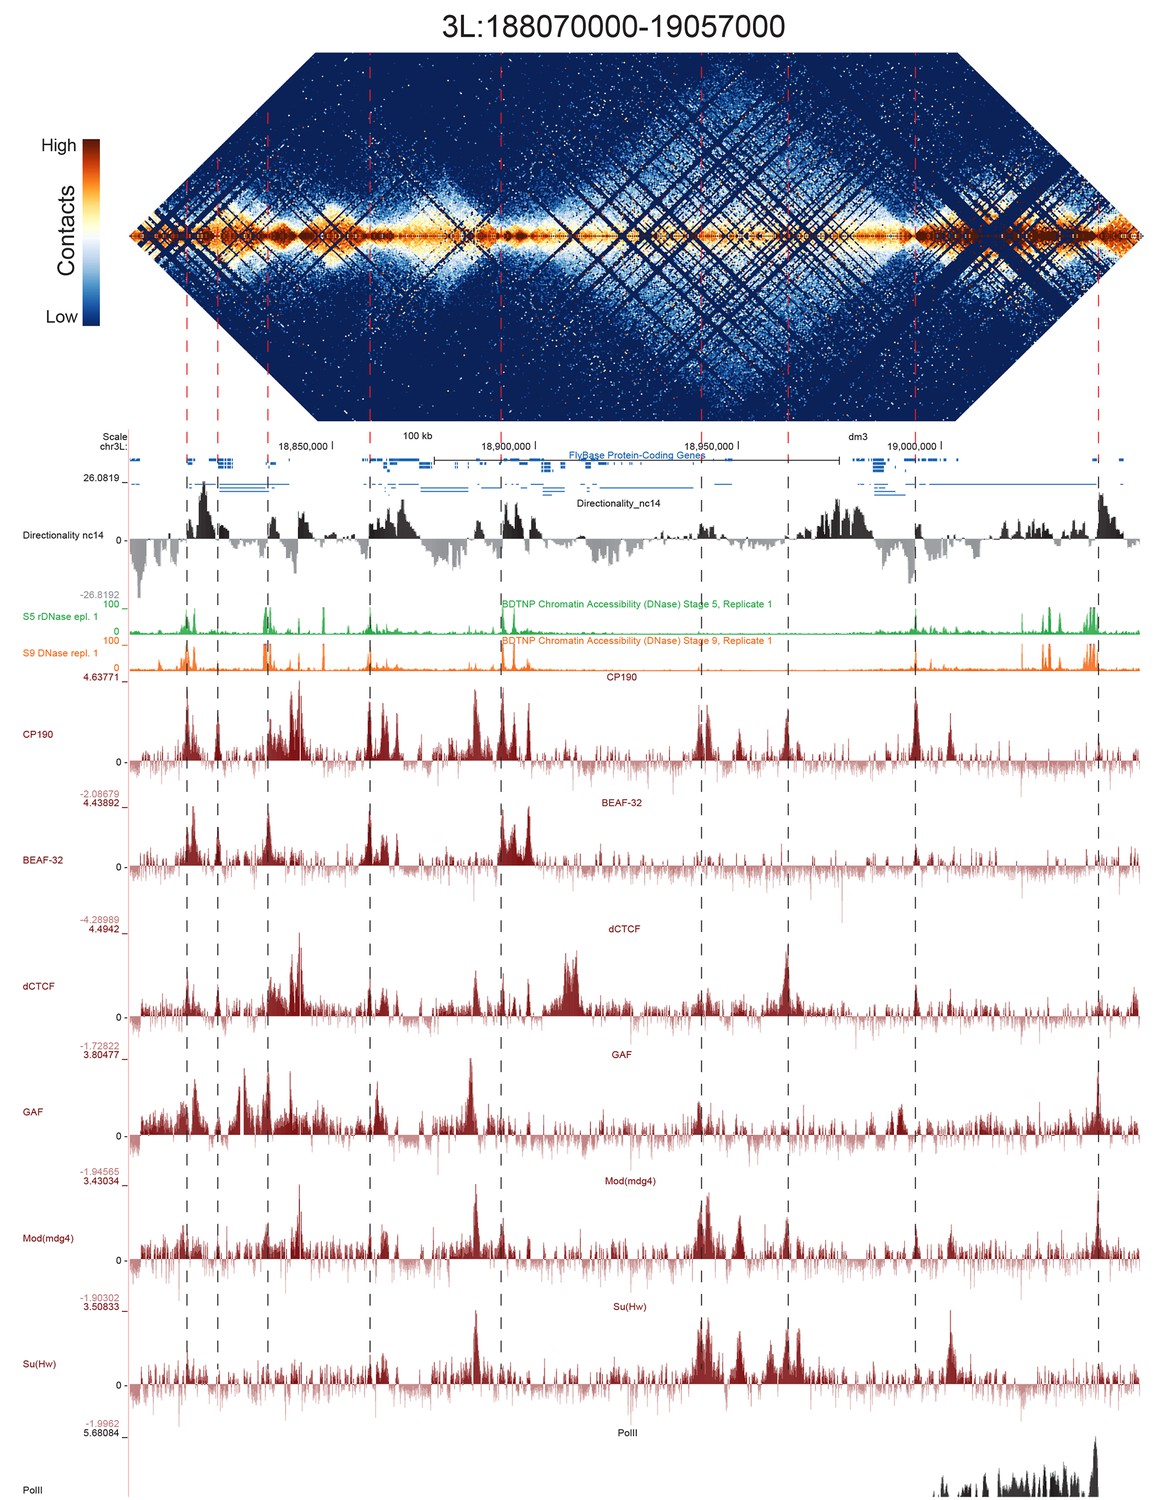
High resolution Hi-C maps of additional example genomic regions from stage 5 Drosophila melanogaster embryos.
Region 3L:18806900–190569000 (dm3: 3L:18800000–19050000). Data were prepared identically to Figure 2, and all data is from the same sources.
Figure 2—figure supplement 4
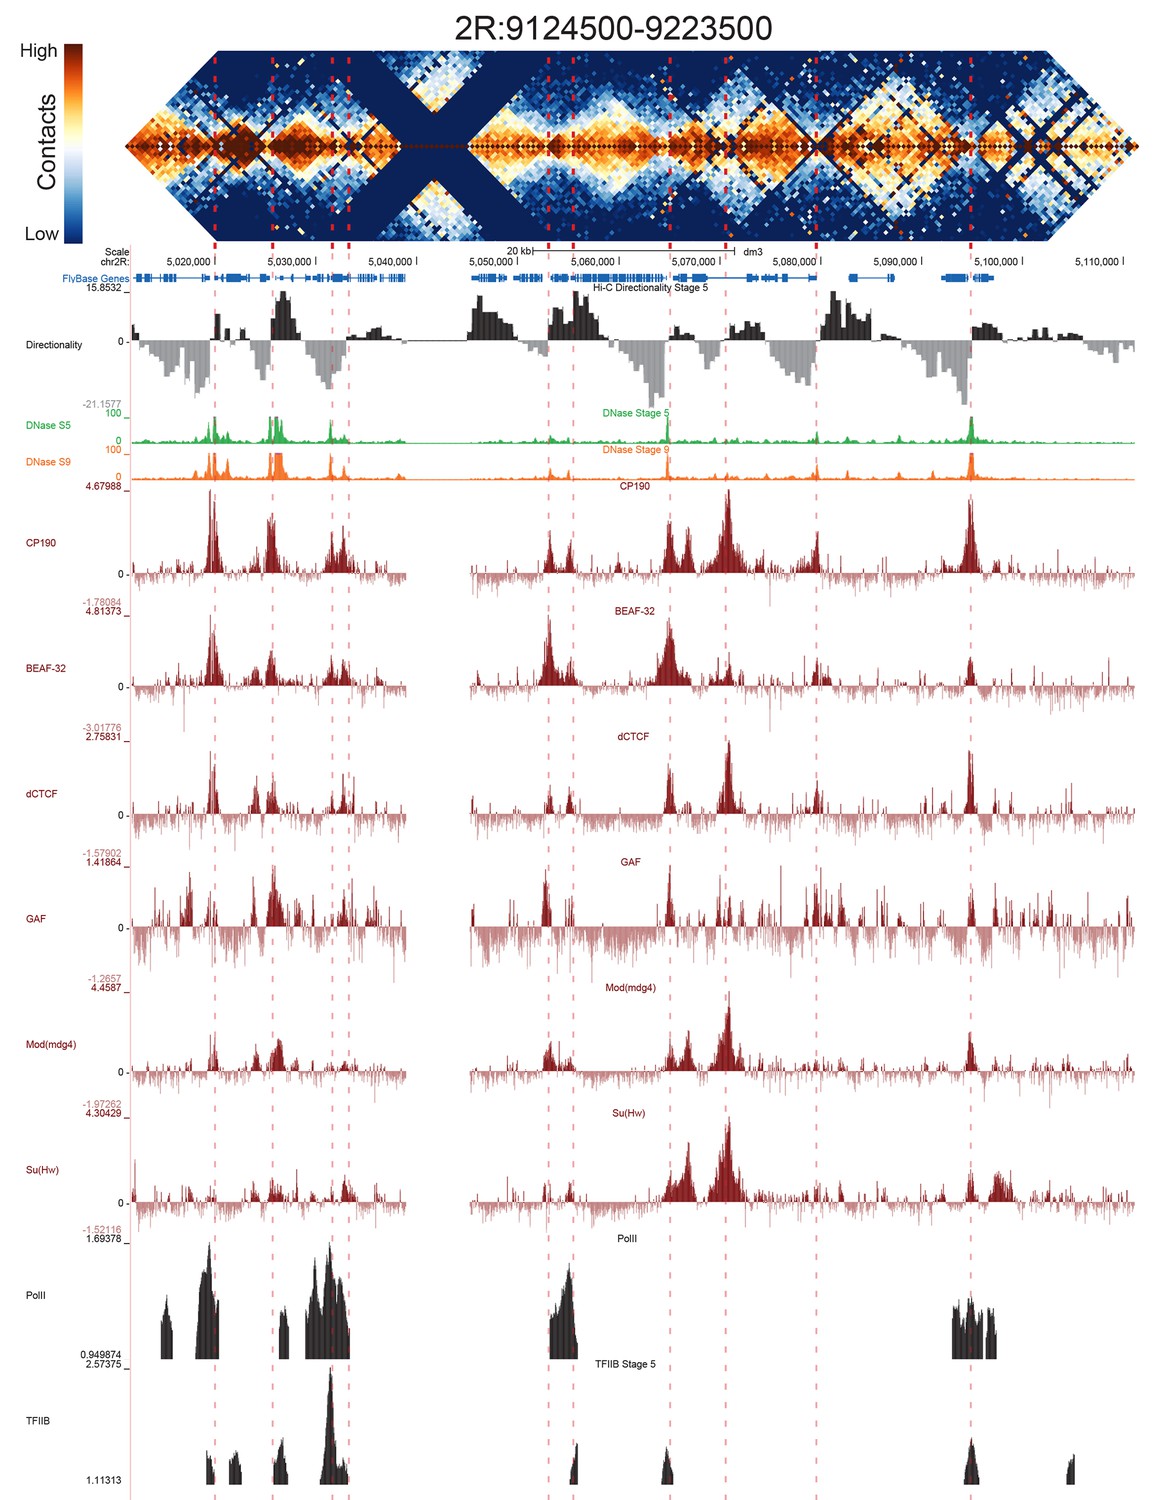
High resolution Hi-C maps of additional example genomic regions from stage 5 Drosophila melanogaster embryos.
Region 2R:9124500–9223500 (dm3: 2R:5012000–5111000). Data were prepared identically to Figure 2, and all data is from the same sources.
Figure 2—figure supplement 5
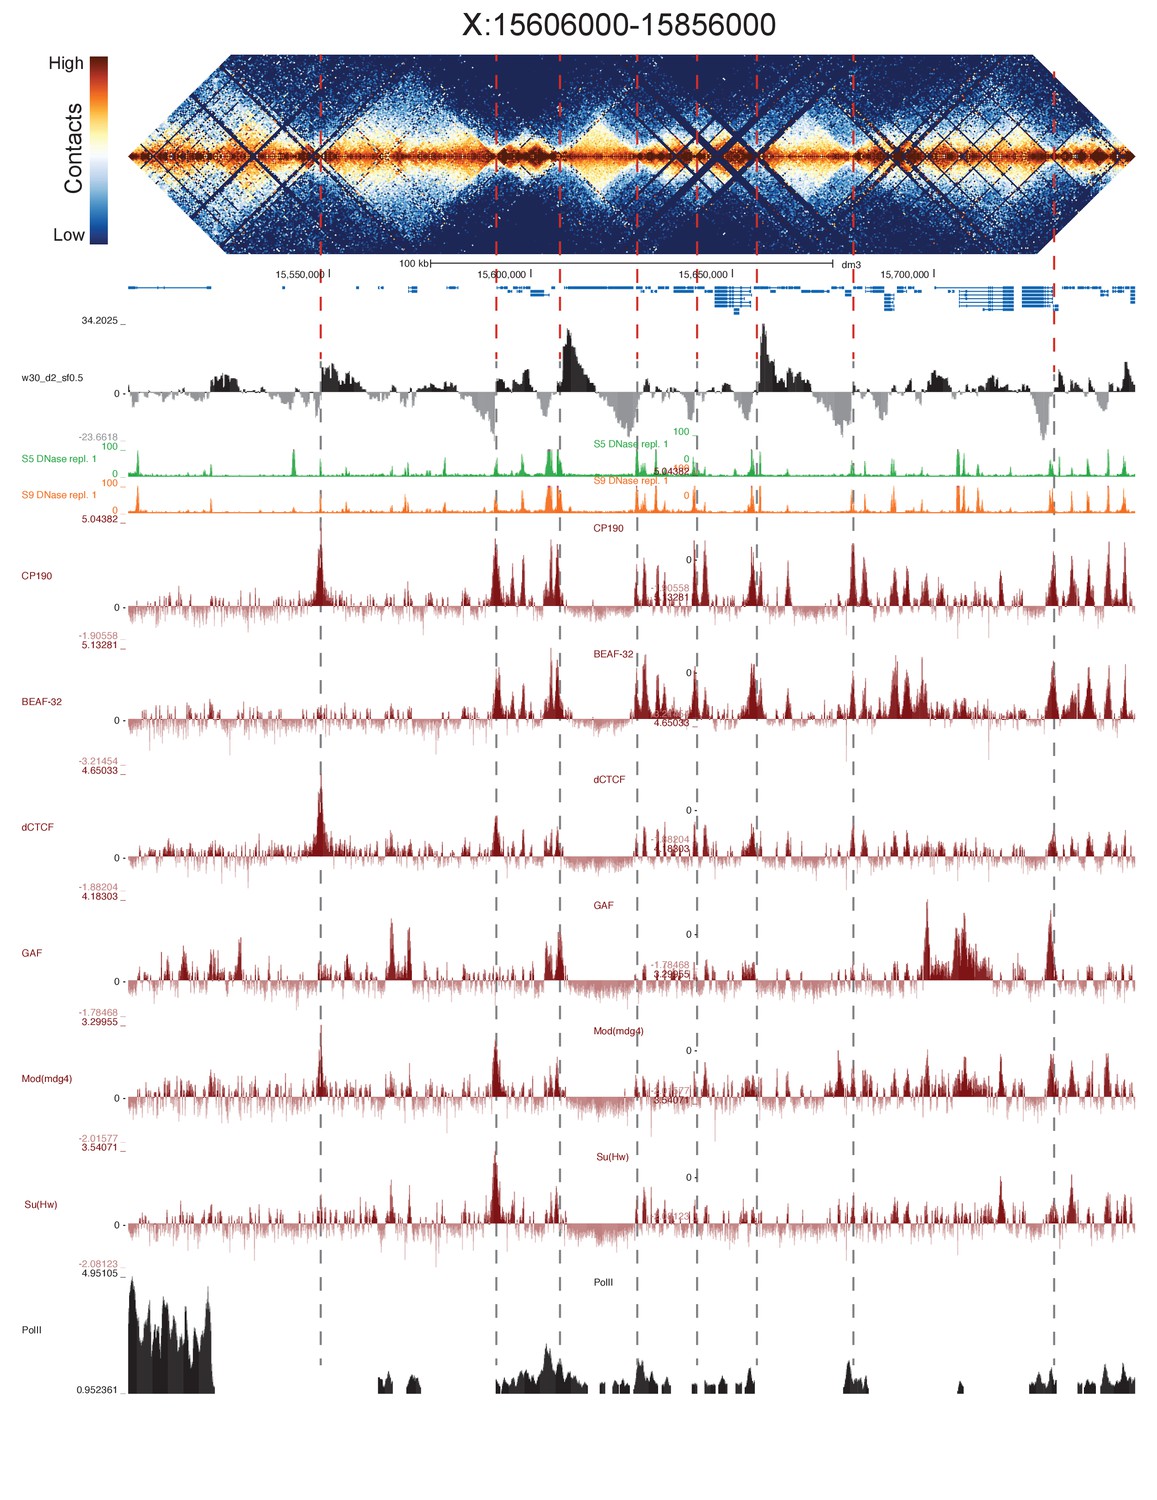
High resolution Hi-C maps of additional example genomic regions from stage 5 Drosophila melanogaster embryos.
Region X:15606000–15856000 (dm3: X:15500000–15749999). Data were prepared identically to Figure 2, and all data is from the same sources.
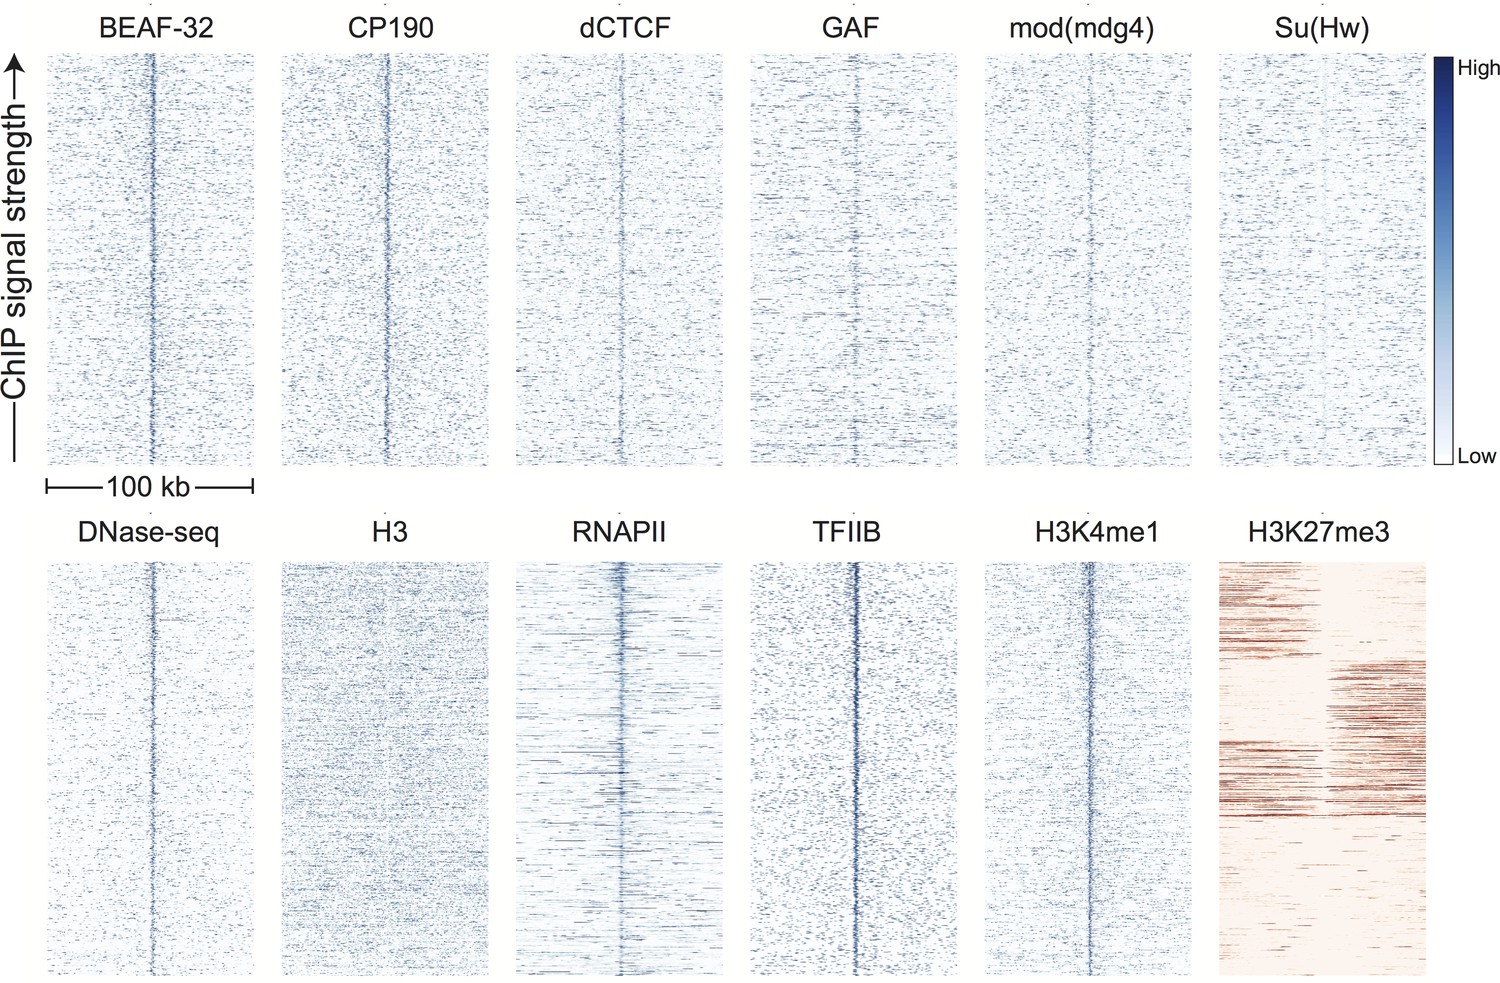
Figure 3 with 4 supplements
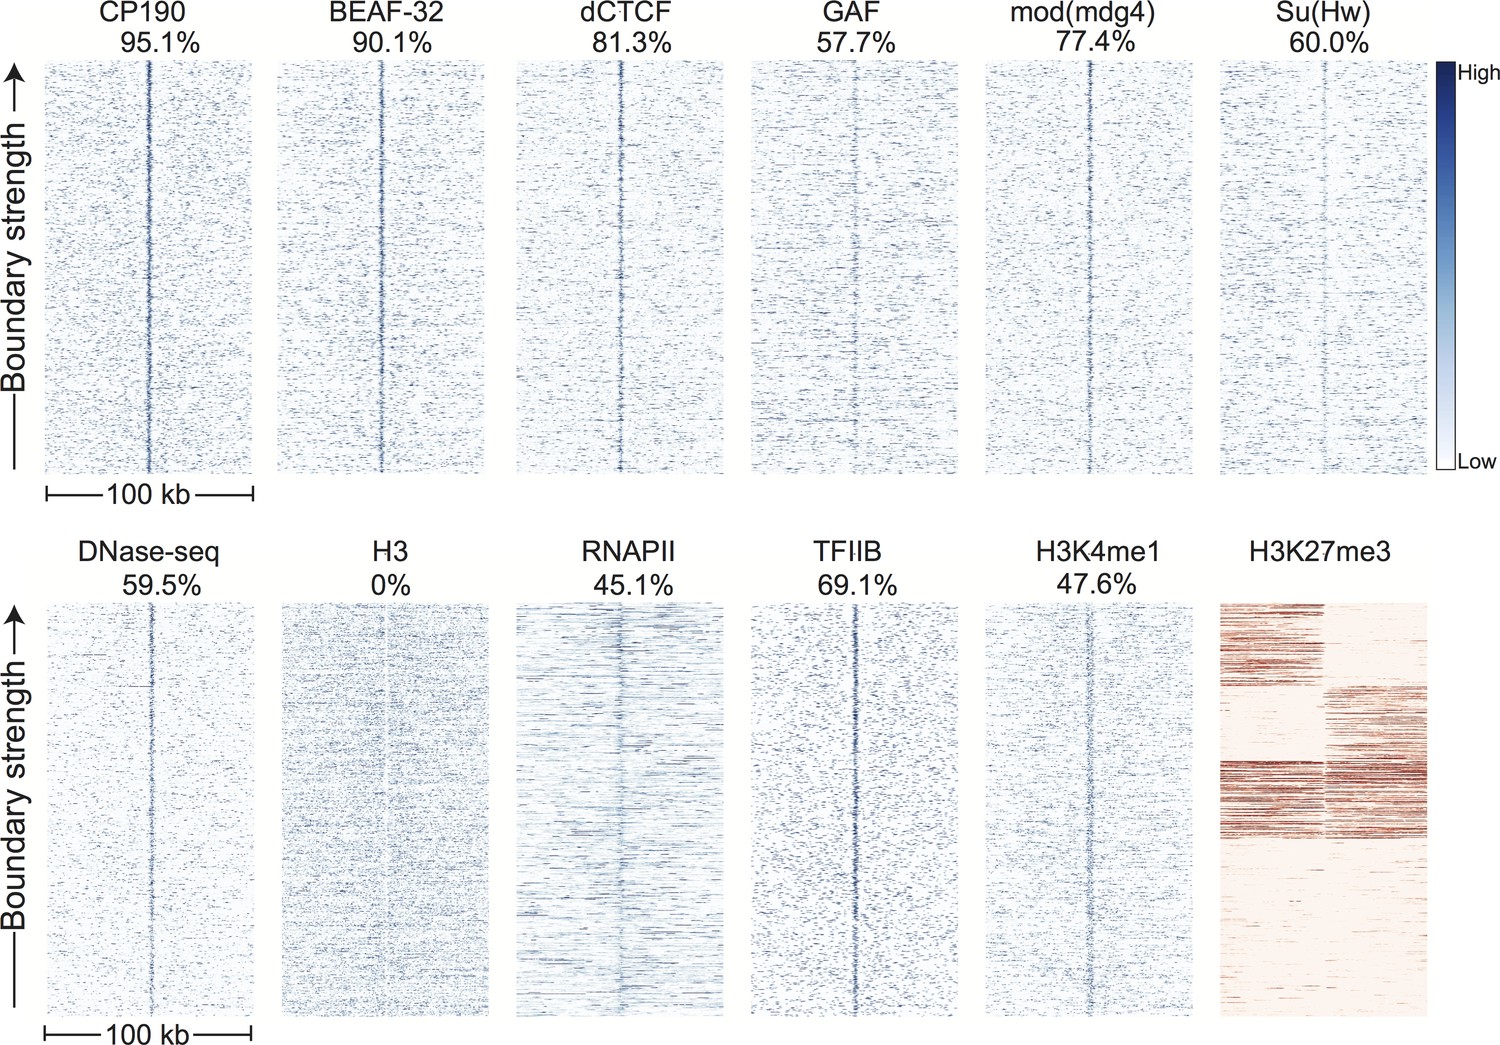
Topological domain boundaries show distinct patterns of associated proteins and genomic features.
Heatmaps showing the distribution of signals from embryonic ChIP and DNase-seq datasets around 952 topological boundaries identified jointly by computational and manual curation. All plots show 500 bp genomic bins in 100 kb windows around boundaries. All plots in blue are sorted by boundary strength, calculated from the difference in upstream and downstream Hi-C directionality scores. The plot for H3K27me3 (in red) is specially sorted to highlight the tendency for enriched domains to terminate at boundaries. Rows for this plot were sorted by calculating the total H3K27me3 signal in the 50 kb windows upstream and downstream of the boundary and then sorting, top to bottom: upstream signal above median and downstream signal below the median, upstream below and downstream above, upstream and downstream both above, upstream and downstream both below the median. For comparison, identically prepared and sorted plots around H3K4me3 peaks are shown in Figure 3—figure supplement 2. Percentages are calculated as the percentage of boundaries with a >2 fold enrichment for the given signal within a 3 kb window centered on the boundary (±1.5 kb). Data for insulator proteins, DNase accessibility, RNA polII and TFIIB are from the same sources indicated in Figure 2. ChIP for H3, H3K4me1 are taken from (Li et al., 2014), and H3K27me3 are from modEncode (Contrino et al., 2012).
Figure 3—figure supplement 1

Genomic signals around topological boundaries, self-sorted.
Data were prepared and displayed identically to Figure 3 except that each plot is sorted high-to-low by the sum of its own signal in the middle 10 bins (5 kb).
Figure 3—figure supplement 2
Genomic signals around H3K4me3 peaks.
Data were prepared and displayed identically to Figure 3 for the top 1000 peaks of H3K4me3 in stage 5 5 embryos, as identified by (Li et al., 2014). H3K4me3 is a proxy for active promoters.
Figure 3—figure supplement 3
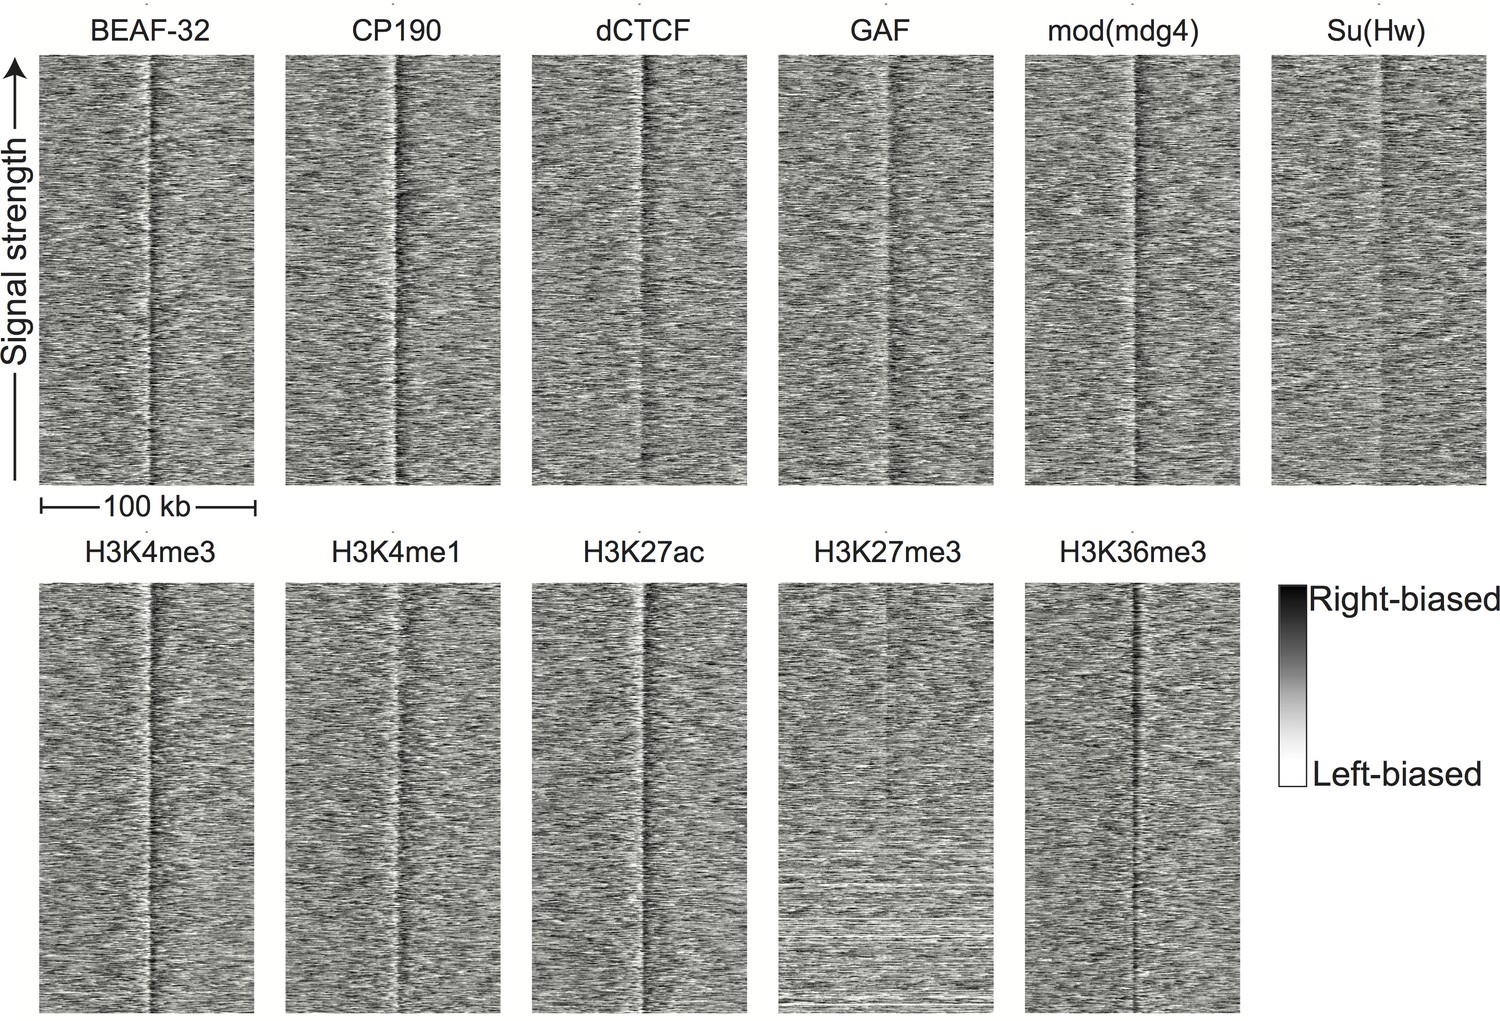
Directionality around peaks of genomic features.
Hi-C directionality scores in 500 bp bins from aggregated nc14 data were plotted around the top 1000 (where available) peaks of the genomic features shown in Figure 3. The signature of a boundary is a region of left-bias (white) transitioning sharply to a region of right-bias (black).
Figure 3—figure supplement 4

Genomic signals around H3K4me1 peaks.
Data were prepared and displayed identically to Figure 3 for the top 1000 peaks of H3K4me1 in stage 5 5 embryos, as identified by (Li et al., 2014). H3K4me1 is a proxy for active enhancers.
Figure 4
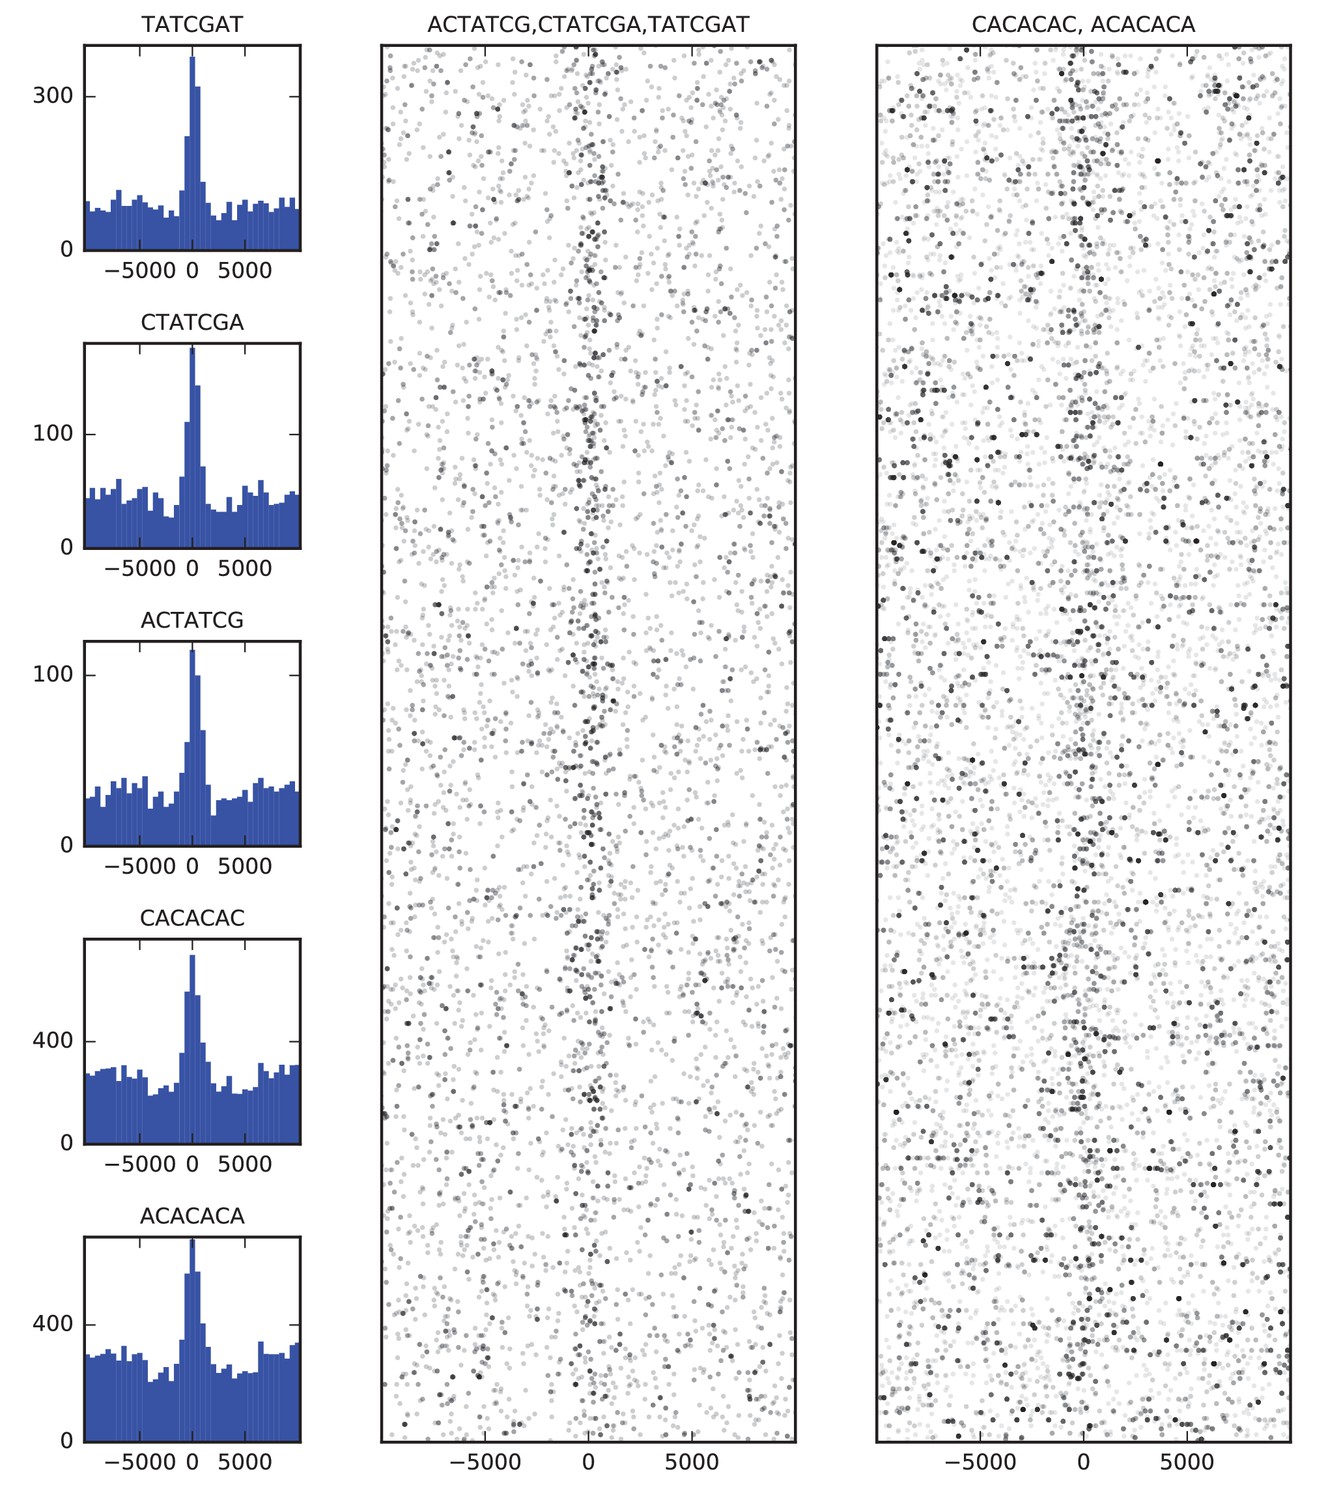
Sequence features of TAD boundary elements.
(A) Histograms showing the frequency of enriched 7-mers in 5 kb windows around 952 high-confidence TAD boundaries. (B) Scatter plots of occurrences of words matching known BEAF-32 binding motifs (left) and CACA motif (right) in 10 kb windows around high-confidence TAD boundaries. Points are plotted with low opacity, such that darker points correspond to positions where multiple words occurs close together in sequence.
Figure 5 with 2 supplements
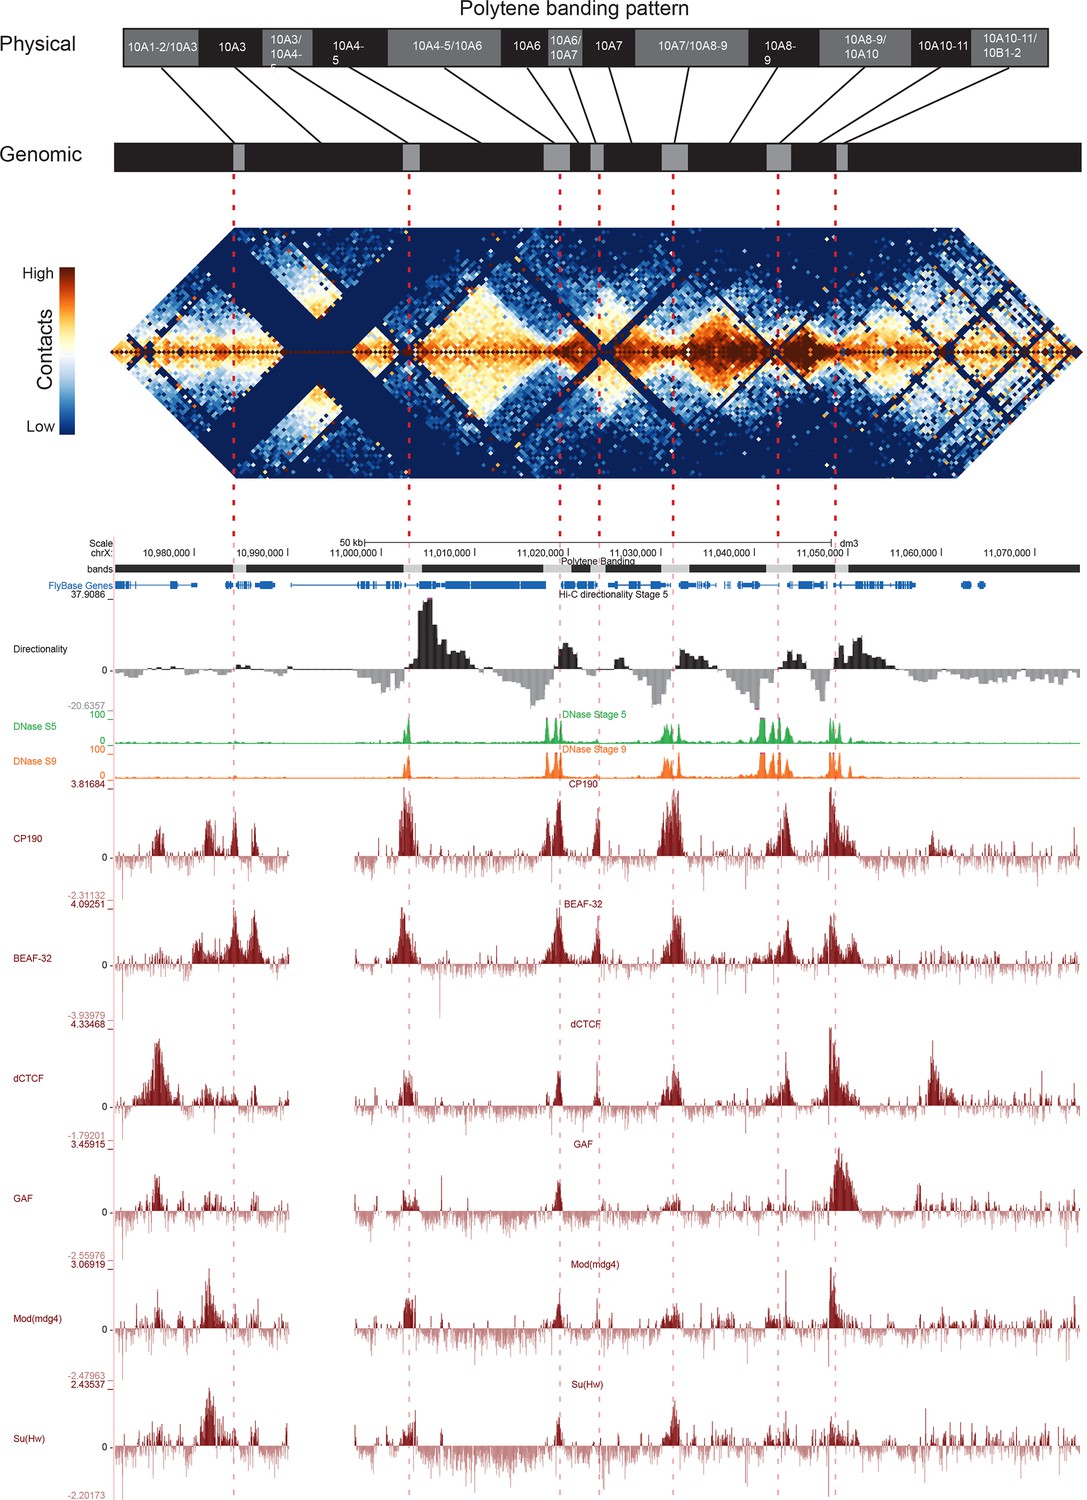
Topological boundary elements correspond to polytene interbands.
Heat map of aggregate Hi-C data for all nc14 datasets binned at 500 bp and UCSC browser data shown for the region X:11077500–11181000 (dm3: X:10971500–11075000) for which Vatolina et al. provided fine-mapping of polytene banding structure. Hi-C and browser data were prepared and sourced as indicated in Figure 2. Dashed red lines are visual guides drawn from the interband assignments of Vatolina et al. Top: accurately-scaled representations of the size of the mapped bands and interbands in base pairs (‘Genomic’) and the corresponding physical distances in polytene chromosomes derived from electron microscopic analysis of polytene chromosomes by Vatolina et al. Increased relative physical size of interband regions demonstrates their lower compaction ratios.
Figure 5—figure supplement 1
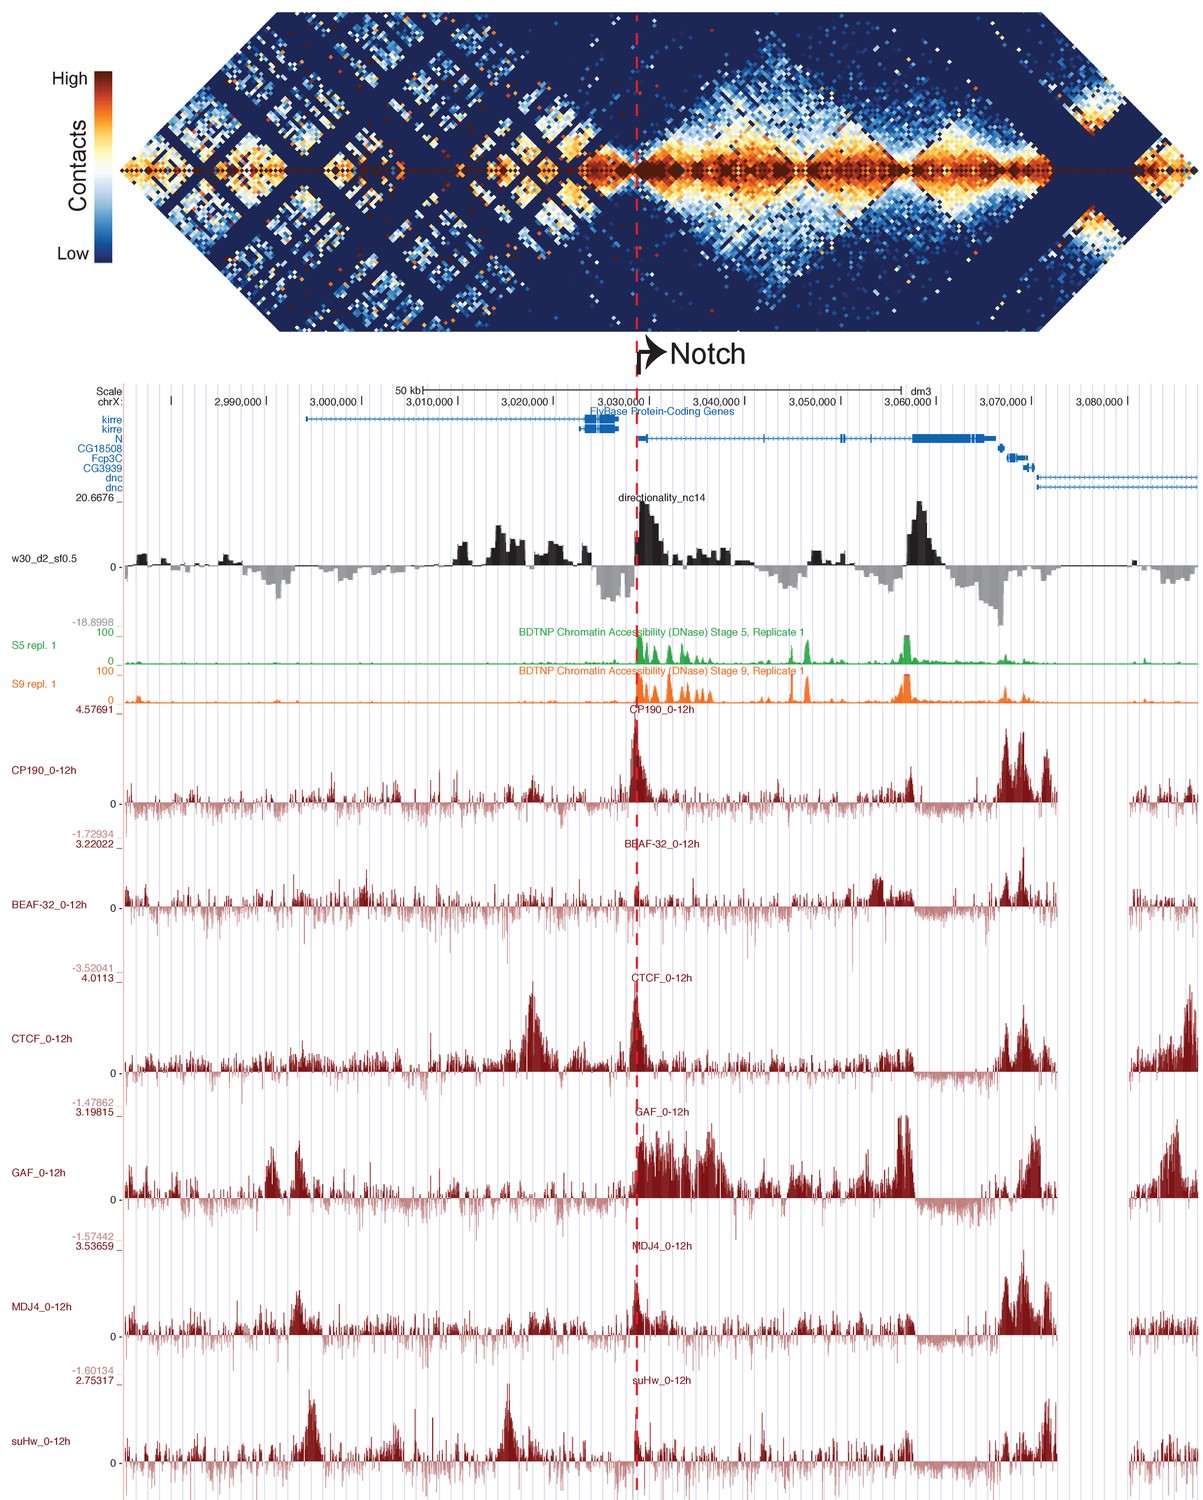
TAD structure corresponds to mapped polytene structure at the Notch locus.
Hi-C map of the Notch locus, prepared as in Figure 5.
Figure 5—figure supplement 2
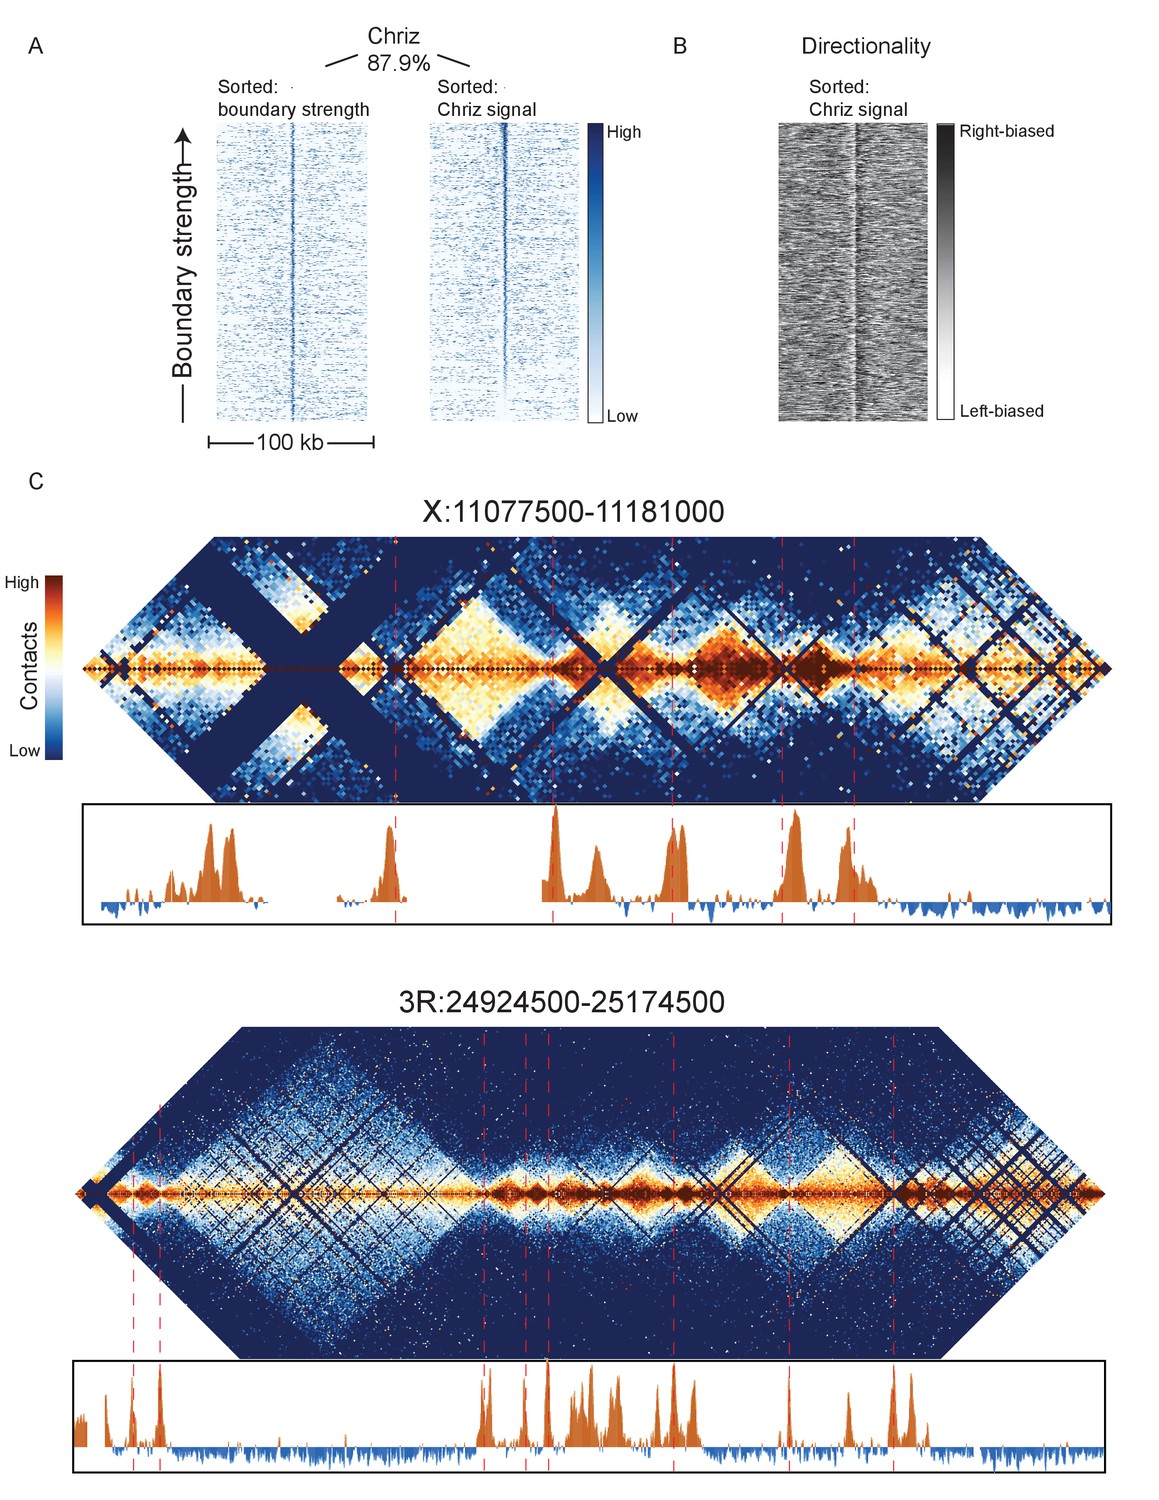
Chriz protein binding in Kc167 cells is highly enriched at sites of embryonic nc14 topological boundaries.
(A) Heatmaps were prepared as in Figure 3 using ChIP data for Chriz binding (modENCODE dataset 277) in Kc167 cells around 952 representative nc14 boundaries, sorted either by boundary strength (left) or Chriz signal. (B) Directionality of aggregate nc14 Hi-C data around top 1000 Chriz peaks. (C) Chriz binding compared to Hi-C maps for two example regions: X:11077500–11181000 (dm3: X: 10971500–11075000) and 3R:24924500–25174500 (dm3: 3R:20750000–20999999).
Figure 6
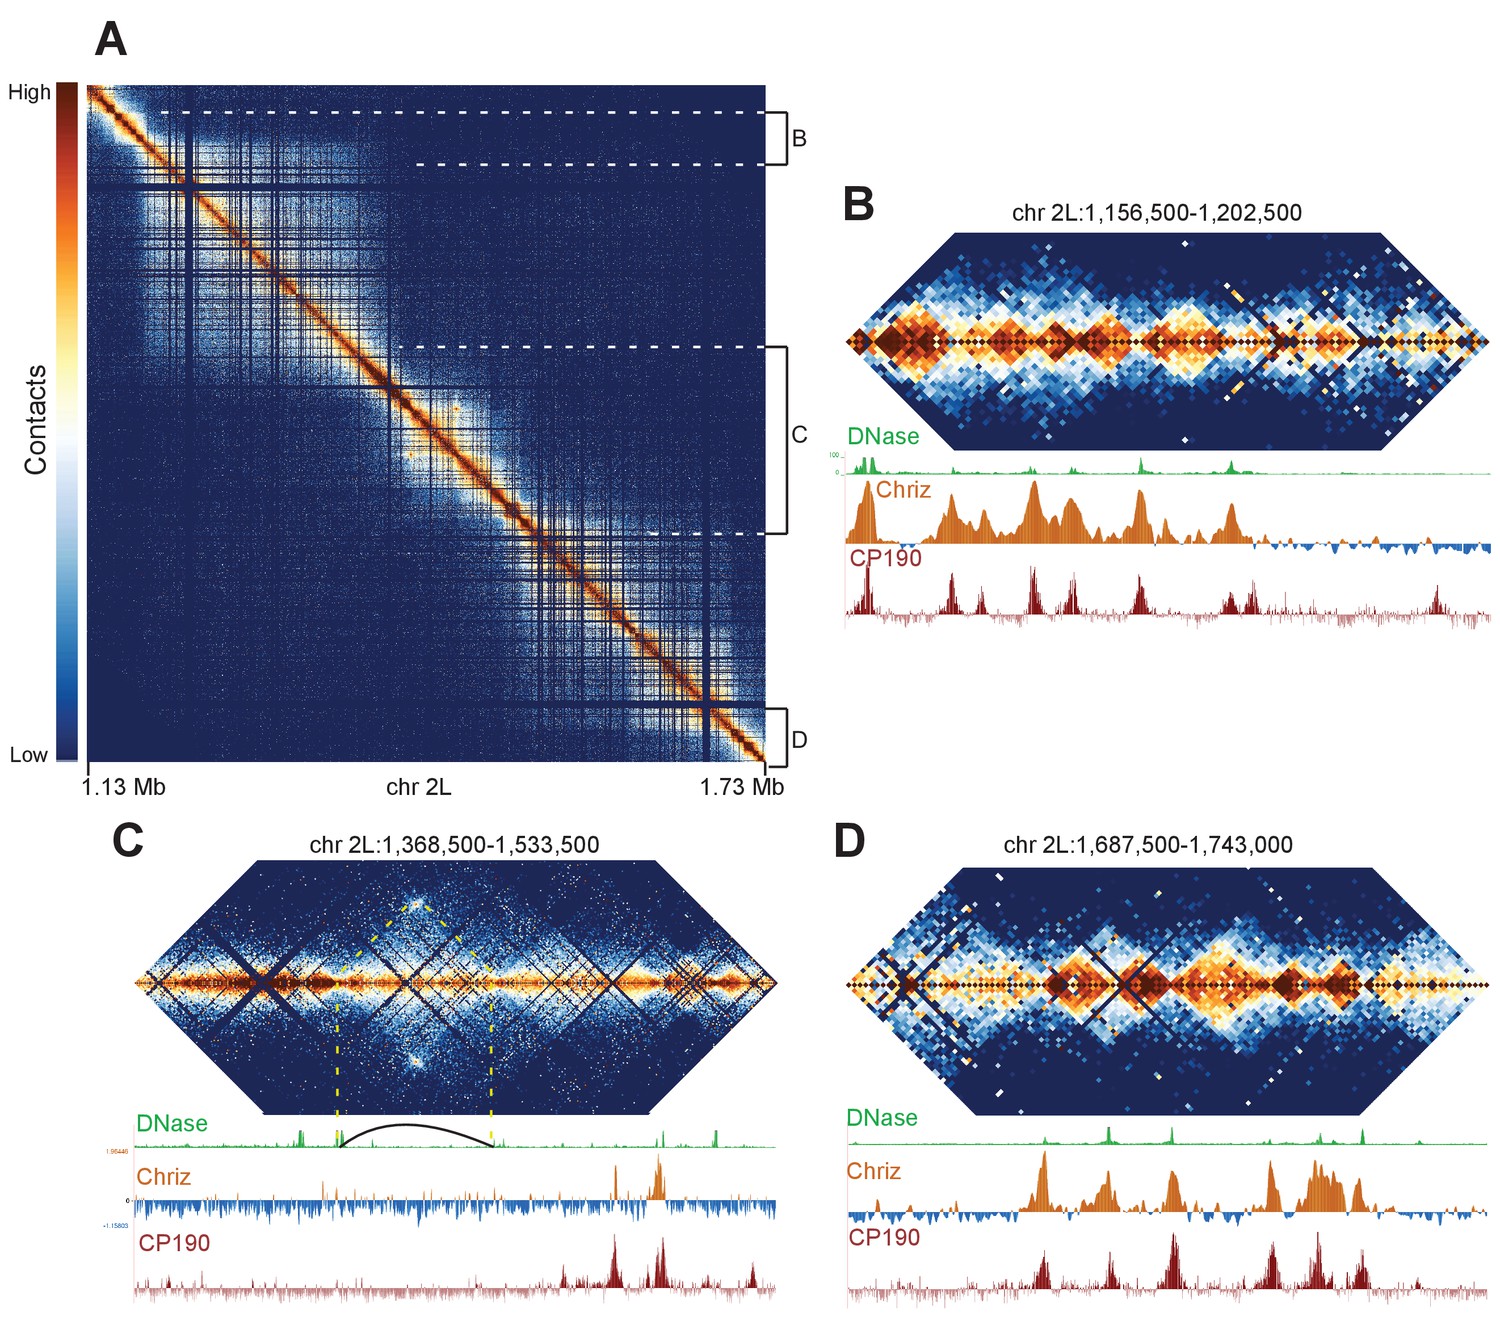
Complex topological structure of a region of chromosome 2L.
Hi-C maps using 500 bp bins of the region of chromosome 2L corresponding to polytene band 22A1-2. This regions was shown by Eagen et al. to comprise a single TAD in Hi-C data viewed at 15 kb resolution, and is occasionally observed to contain an interband in polytene spreads. (A) View of the entire region, revealing complex internal structure. (B–D) Zoomed-in views of three regions comprising the left border (B), complex middle section (C), and right border of the larger region corresponding to the band/TAD investigated by Eagen et al., with associated stage 5 DNase accessibility, CP190, and Chriz (kc167 cells) profiles. Coordinates for this region are identical in dm3 and dm6.
Figure 7 with 1 supplement

Hi-C signals from anterior and posterior halves of stage 5 embryos reveal highly similar chromatin topologies.
(A) The distribution of Hi-C directionality scores in whole embryos, anterior, and posterior halves is shown around 952 topological boundaries identified jointly by computational and manual curation. (B) Heat maps of Hi-C data at 500 bp resolution at four example regions in anterior and posterior embryo halves. Plots represent the aggregate data of two biological and technical replicates each for anterior and posterior samples, and were prepared as in Figure 2. The regions shown are the region mapped by Vatolina et al. (dm6: X:11077500–11181000, dm3: X: 10971500–11075000), the example region from Figure 2—figure supplement 4 (dm6: 2R:9124500–9223500, dm3: 2R:5012000–5111000)), and the genomic regions surrounding the eve (dm6: 2R:9903060–10056959, dm3: 2R:5790565–5944464) and ftz (dm6: 3R:6769234–6961333, dm3: 3R:2594956–2787055) loci. (C) Chromatin accessibility around topological boundaries as measured by ATAC-seq in anterior and posterior nc14 (S5) embryos and by DNase-seq on stage 11 and 14 embryos (X.-Y. Li et al., 2011).
Figure 7—figure supplement 1
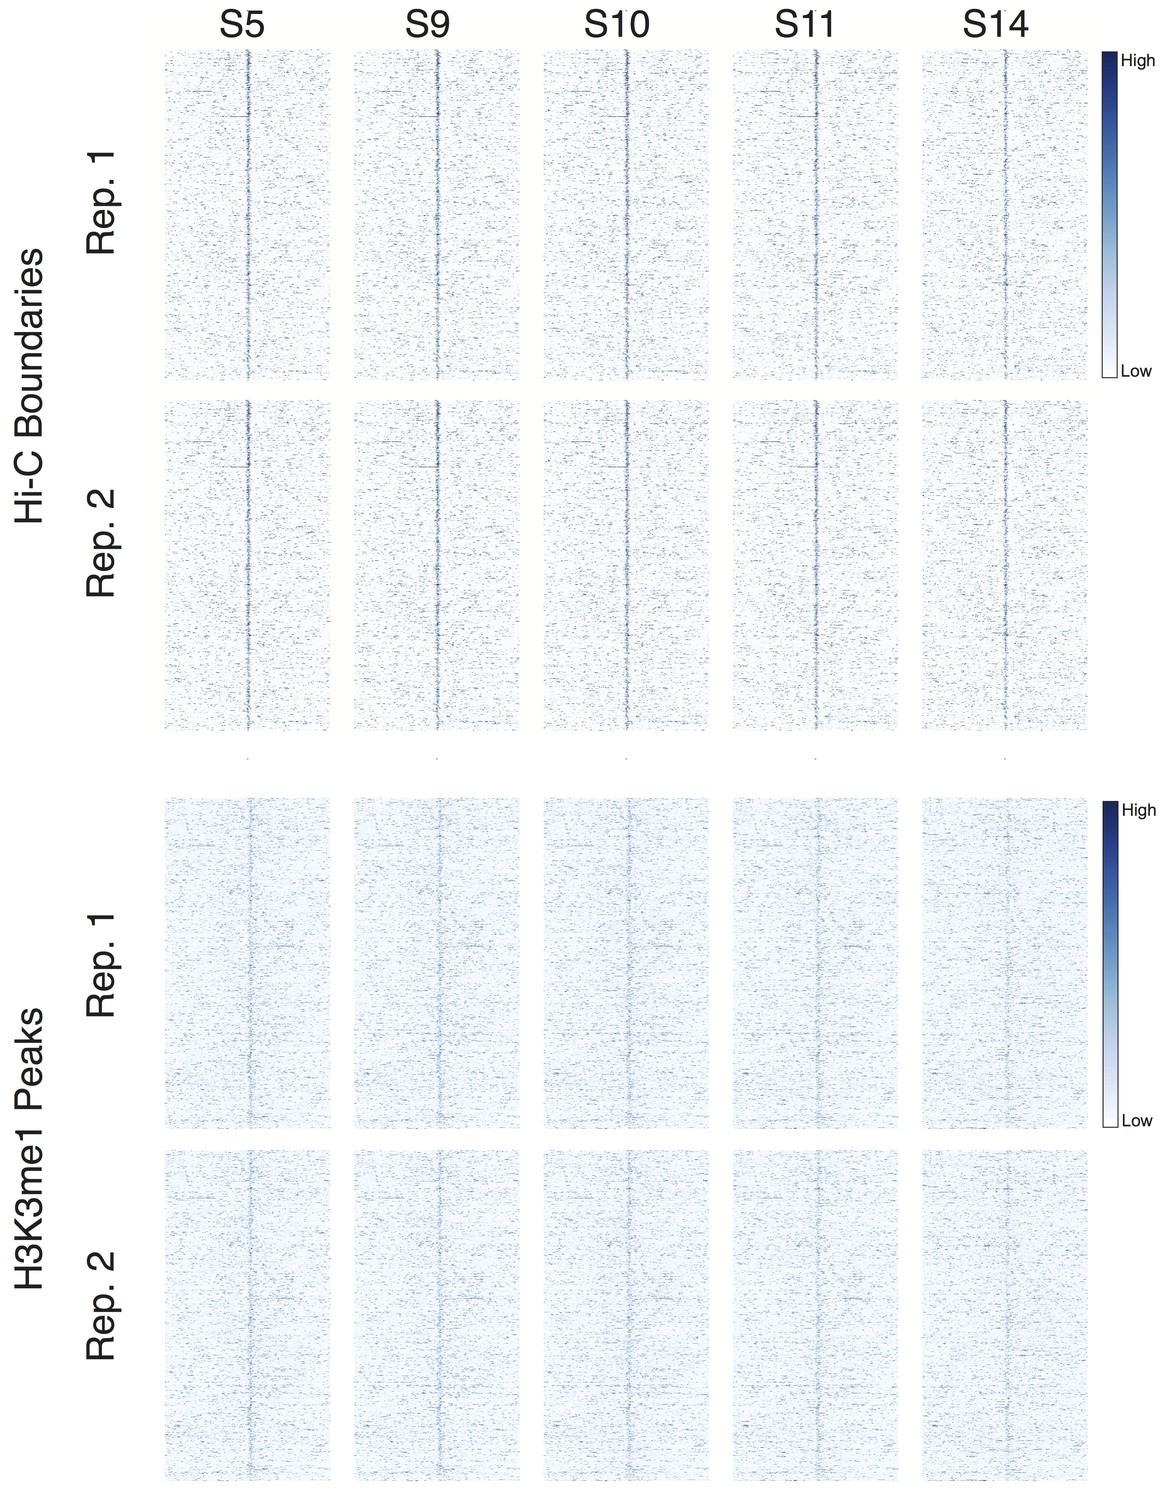
Developmental time series of DNase accessibility at TAD boundaries.
DNase accessibility data from (Li et al., 2011) was plotted around 952 high-confidence boundaries and top 952 H3K4me1 peaks. Data covers stage 5 (~2 hr) through stage 14 (~10 hr) of embryonic development.
Figure 8 with 10 supplements
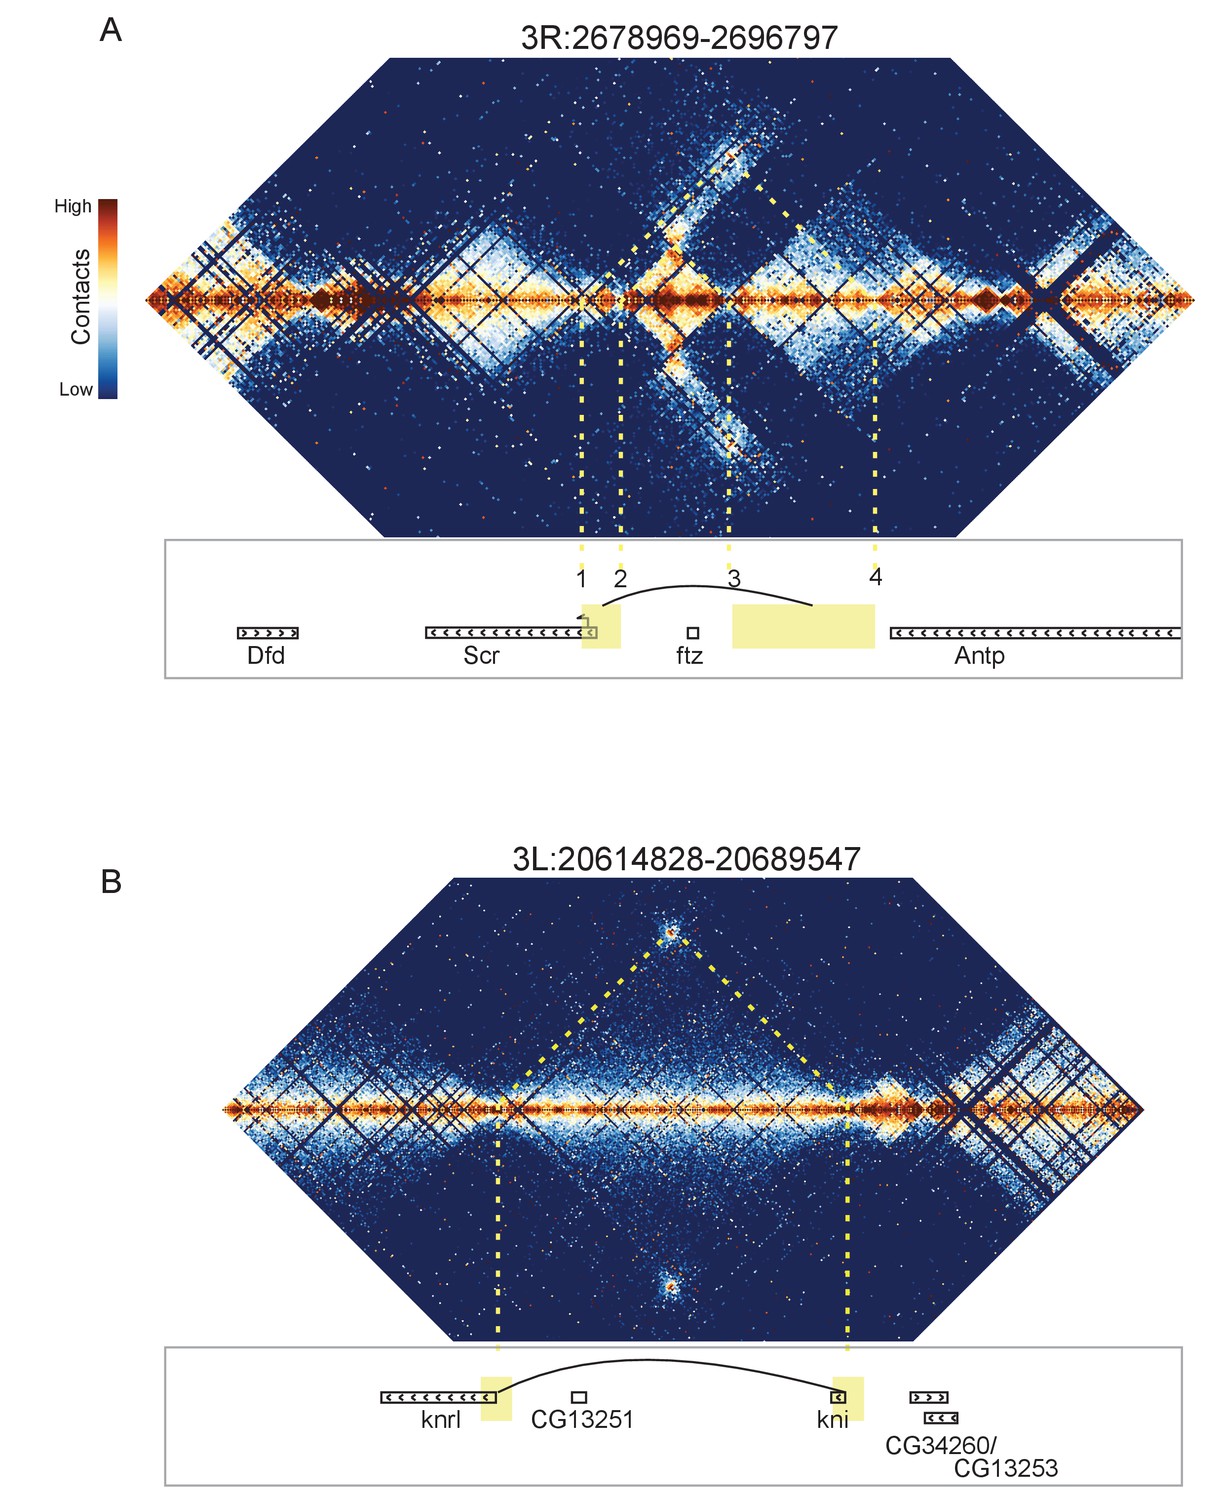
Looping and domain-skipping activity observed in nc14 chromatin.
(A) An example of domain-skipping and looping at the Scr-ftz-Antp locus. ftz is contained within a domain that shows enriched Hi-C interactions between its boundaries, indicative of the formation of a looped domain. Adjacent domains show depleted interaction with the ftz domain and enriched interaction with each other, with especially strong contacts between the region containing the Scr promoter and characterized Scr regulatory elements 3’ of the Antp locus (Calhoun et al., 2002; Calhoun and Levine, 2003). Dotted lines connect features in the Hi-C map to the genomic locations of genes in this region. (B) A strong looping interaction between the kni locus and the 5’ end of the related knrl (kni-like) gene. kni and knrl are known to have identical expression patterns and partially redundant, though distinct, domains of biochemical activity (González-Gaitán et al., 1994).
Figure 8—figure supplement 1

Distal chromatin contacts in stage 55 embryos.
Hi-C maps prepared as in Figure 8 for manually-curated distal interactions. Data shown at 500 bp resolution, all nc14 data aggregated. Gene tracks are from the UCSC genome browser and shown with dm6 coordinates. A complete list of observed distal interactions is available in Supplementary file 1, along with dm3 coordinates.
Figure 8—figure supplement 2

Hi-C map for the locus spanning 2R:9973000-9988500.
The genomic regions flanking the domain containing the eve gene appear to "skip" the eve domain and preferentially contact each other.
Figure 8—figure supplement 3
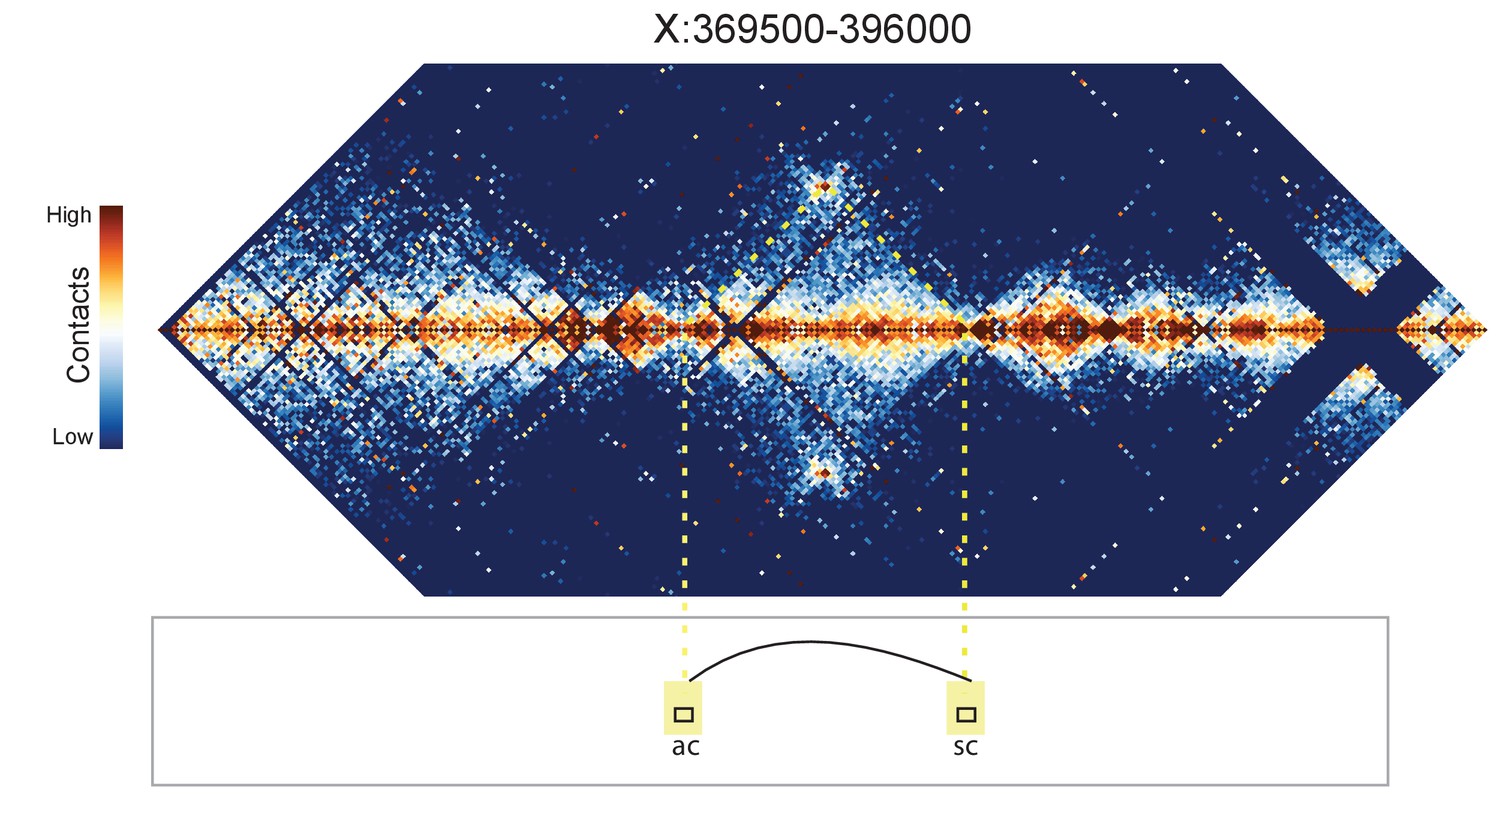
Hi-C map for the locus spanning X:369500-396000.
A loop is evident between the ac and sc genes.
Figure 8—figure supplement 4
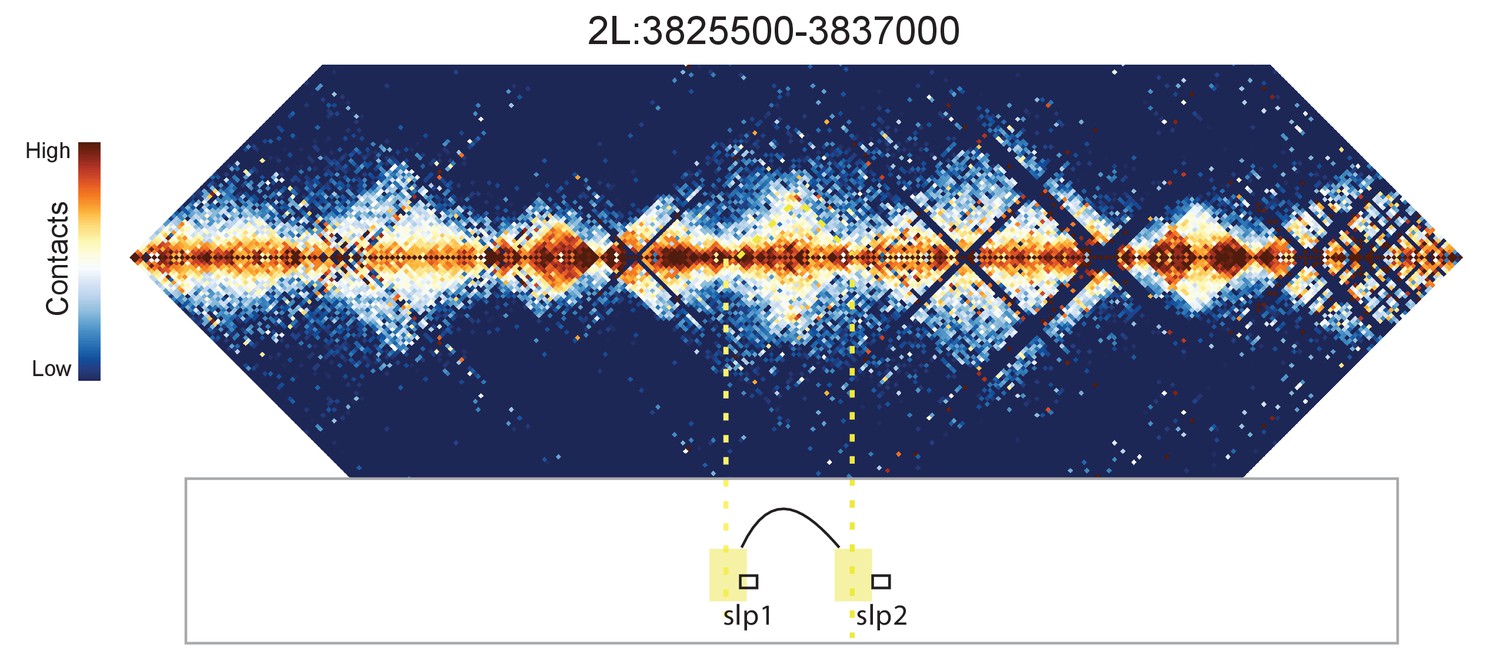
Hi-C map for the locus spanning 2L:3825500-3837000.
A weak looping interaction is seen between the 5' ends of slp1 and slp2.
Figure 8—figure supplement 5
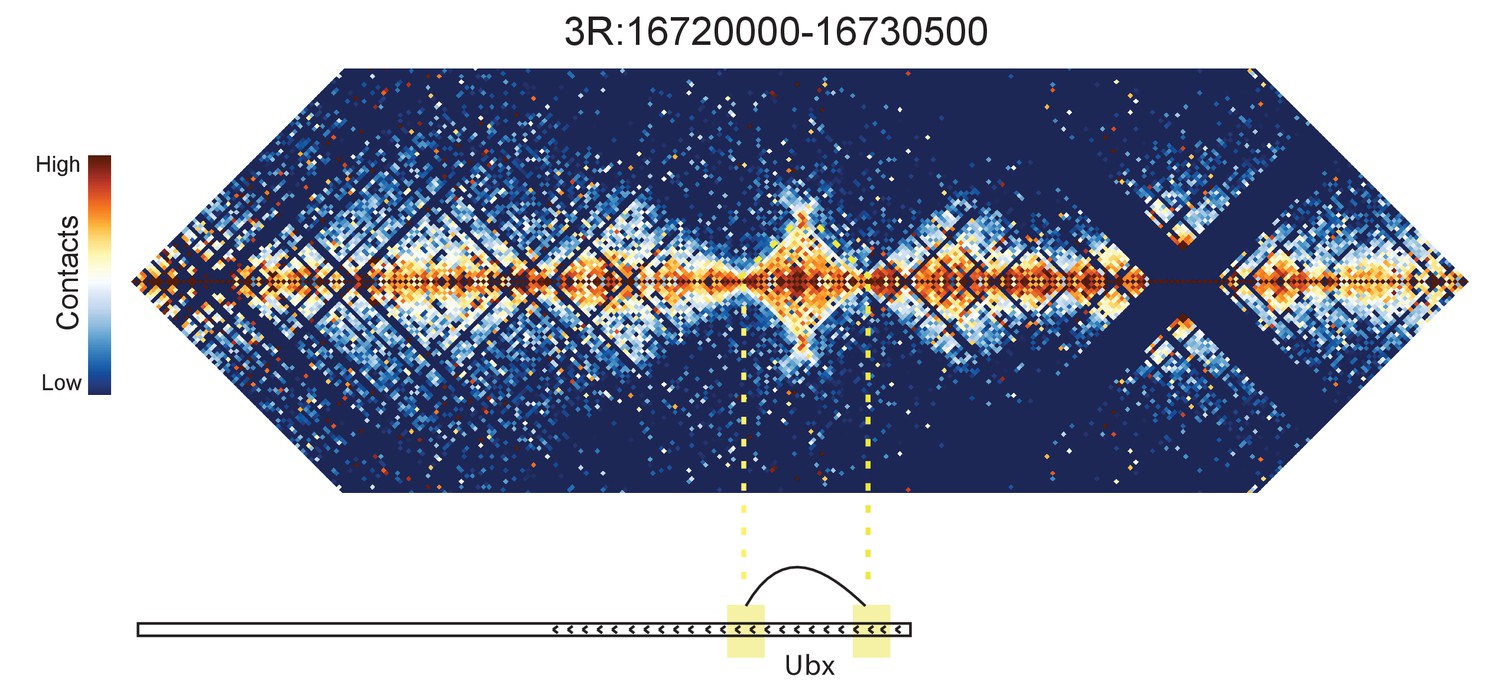
Hi-C map for the locus spanning 3R:16720000-16730500.
A looping interaction is seen between two regions contained within the Ubx transcription unit.
Figure 8—figure supplement 6
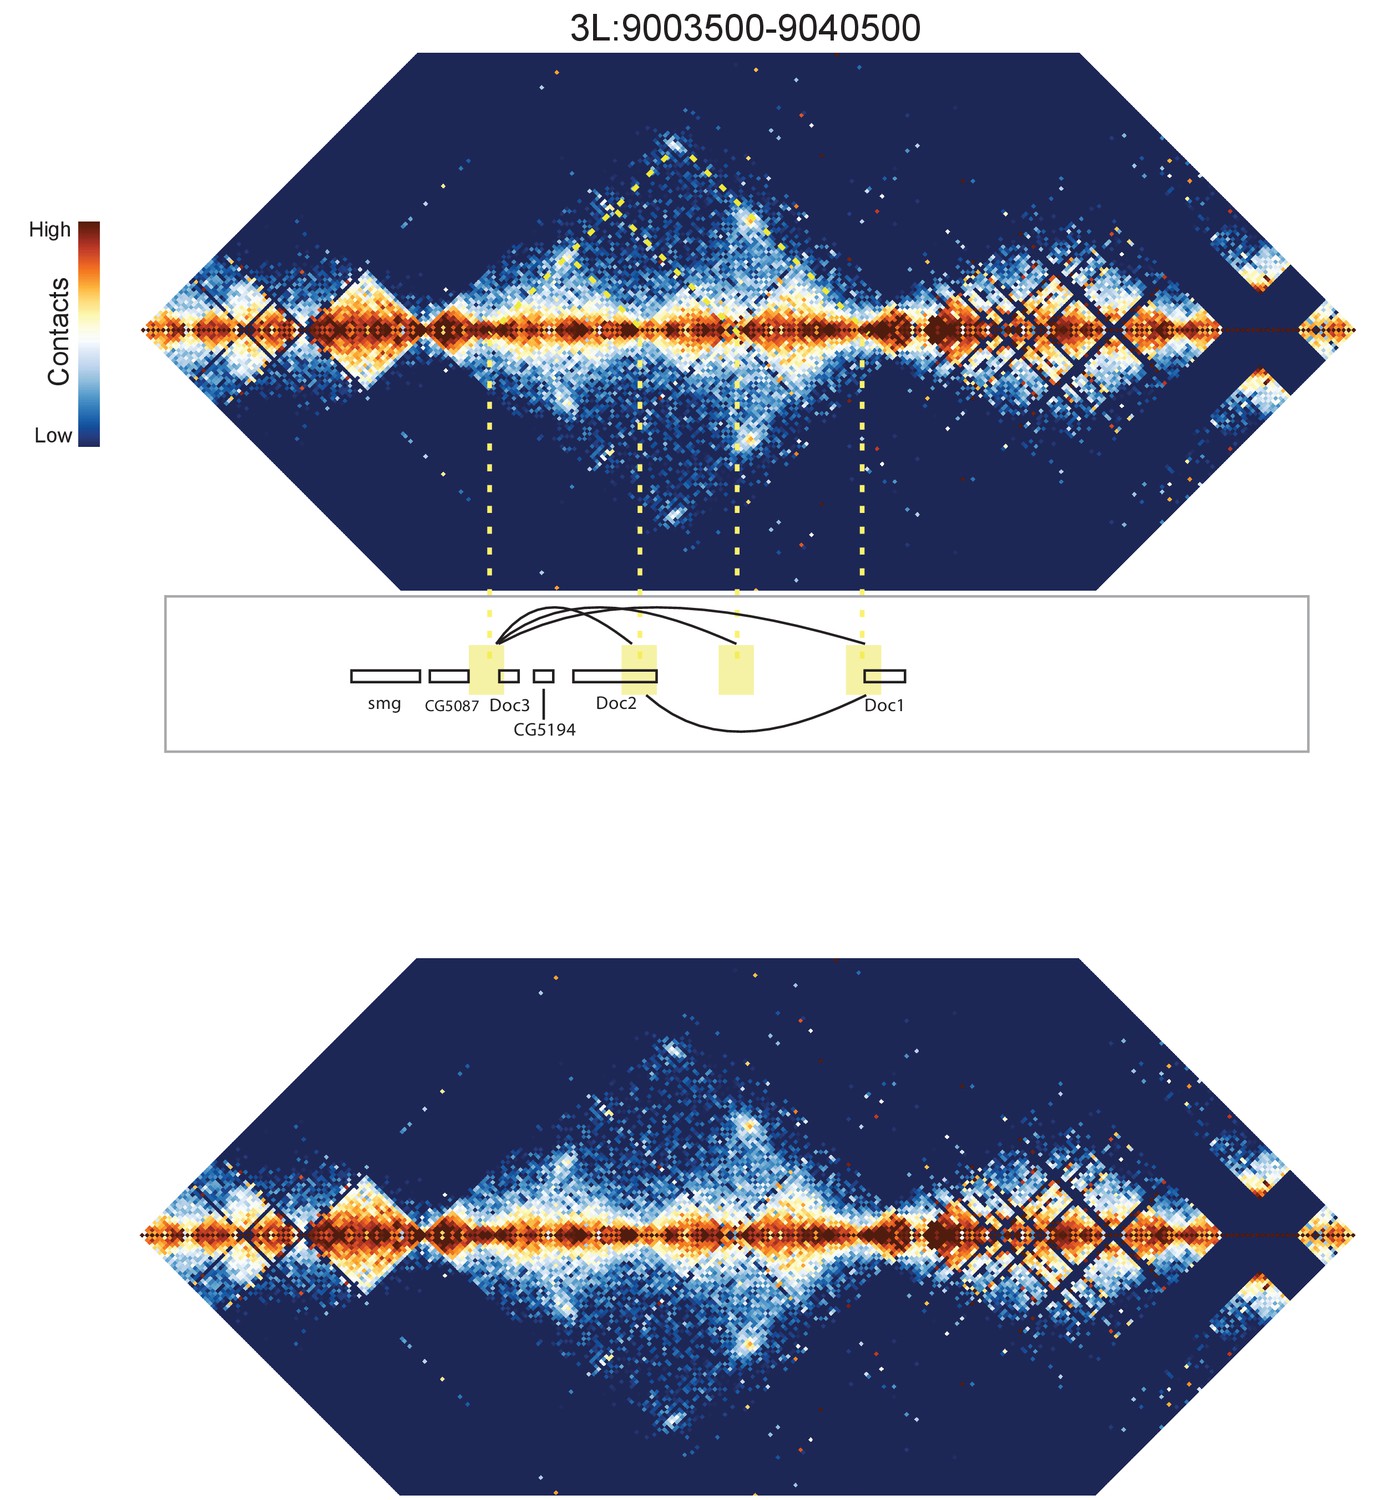
Hi-C map for the locus spanning 3L:9003500-9040500.
A complex set of looping interactions are seen between four distinct positions. Interactions seem to occur between the Doc1, Doc2, and Doc3 genes. A map of the locus without overlaid guide lines is shown below for clarity.
Figure 8—figure supplement 7
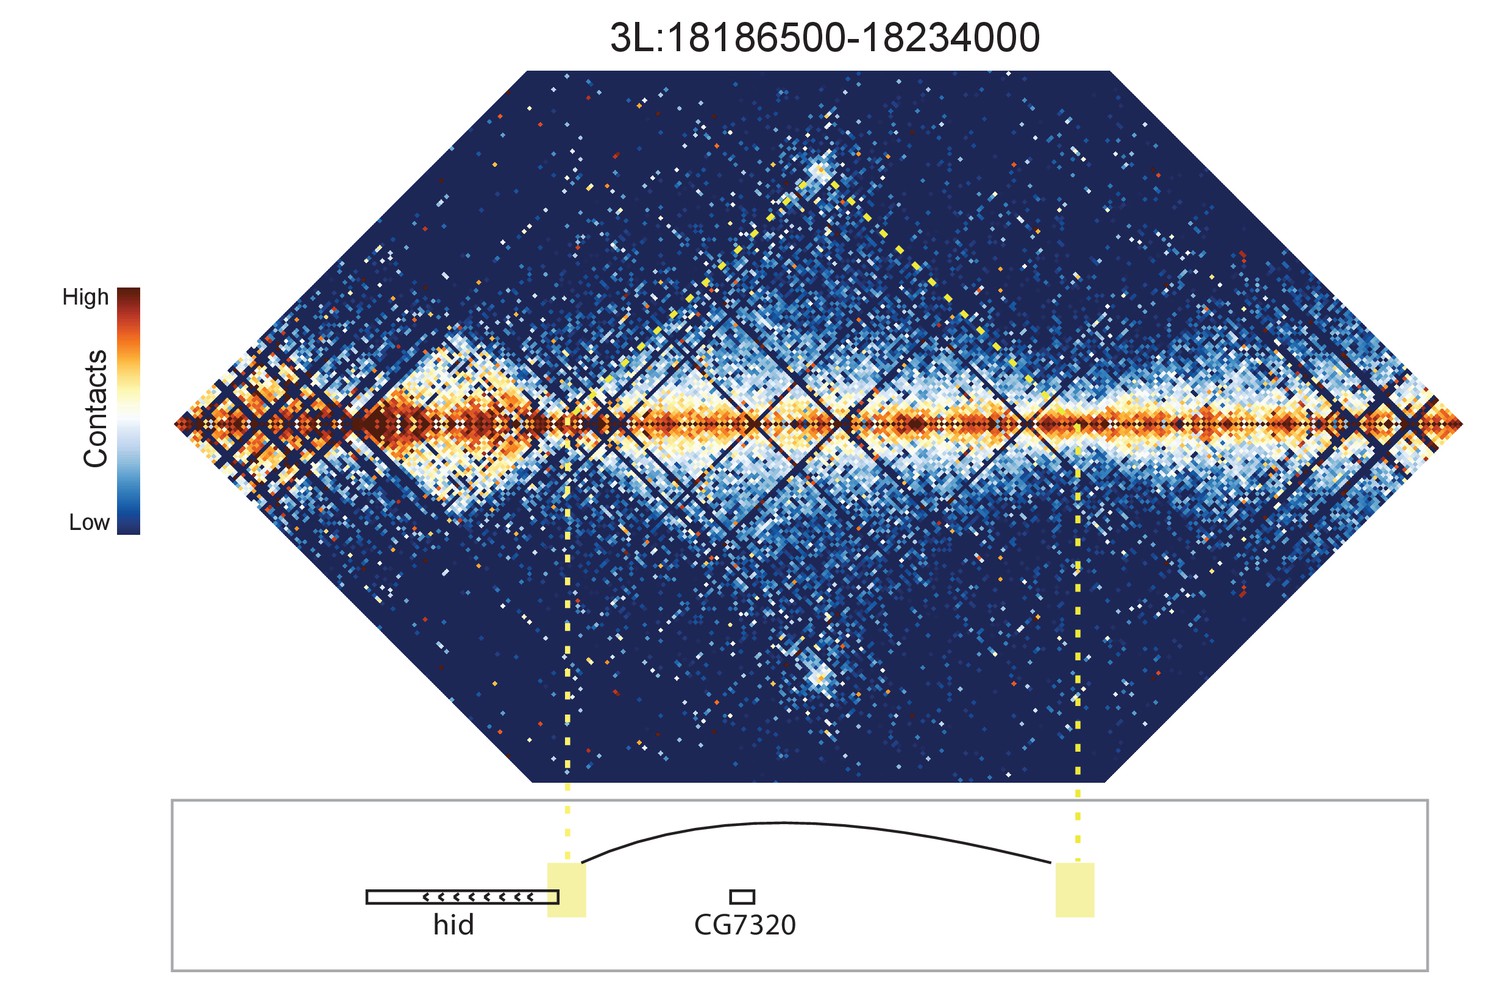
Hi-C map for the locus spanning 3L:18186500-18234000.
A looping interaction is observed between the 5' end of the hid gene and an upstream intergenic region.
Figure 8—figure supplement 8
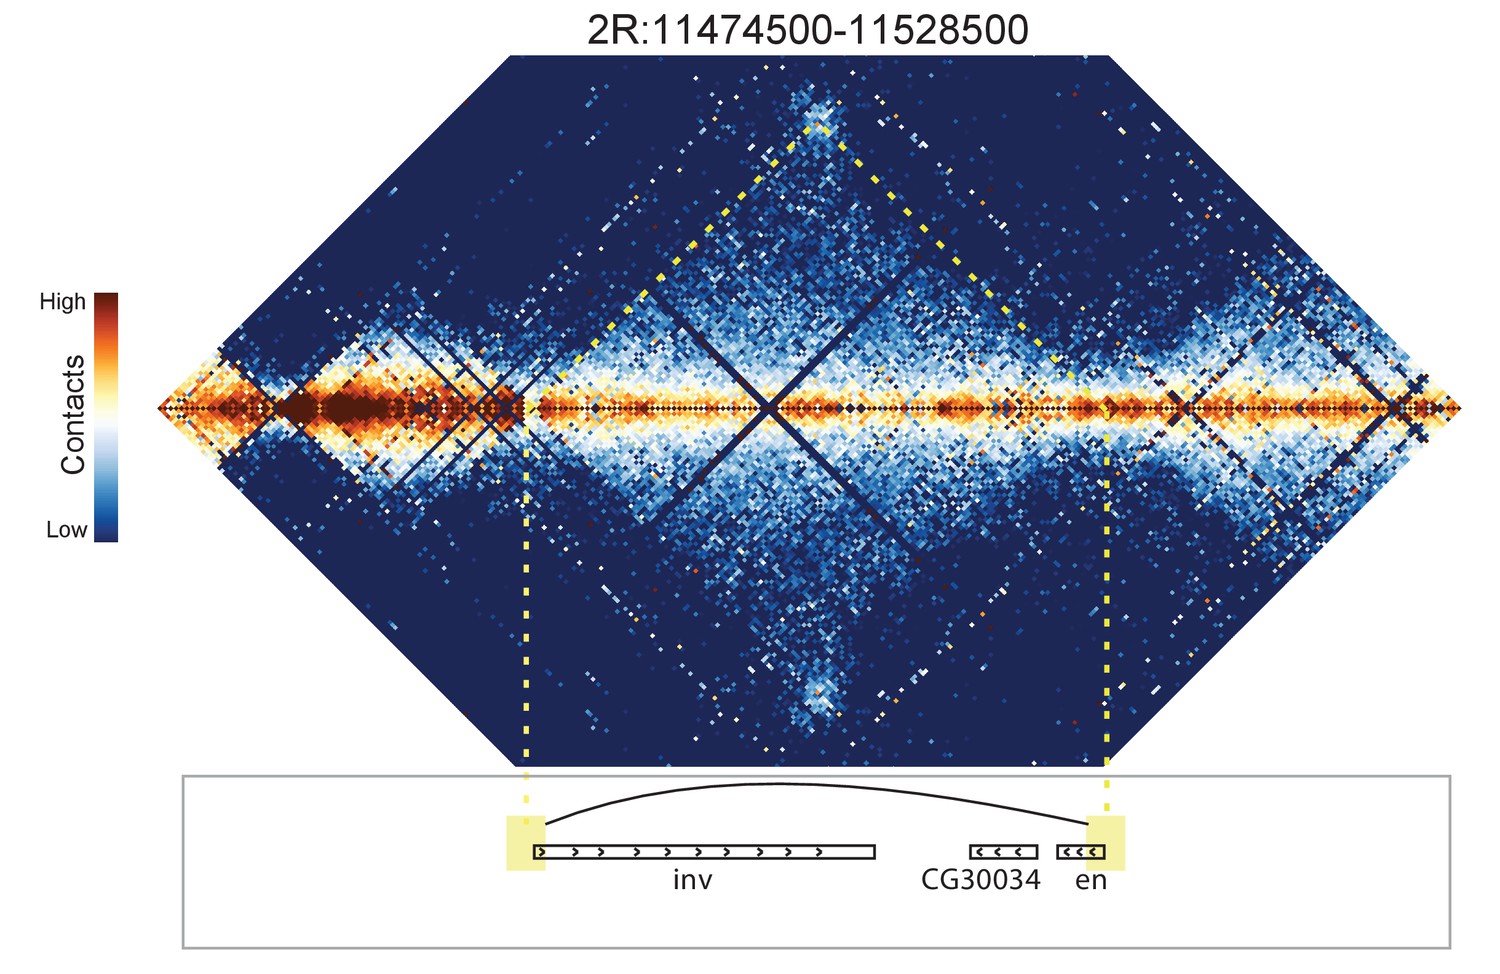
Hi-C map for the locus spanning 2R:11474500-11528500.
A weak looping interaction is seen between the 5' ends of the inv and en genes.
Figure 8—figure supplement 9
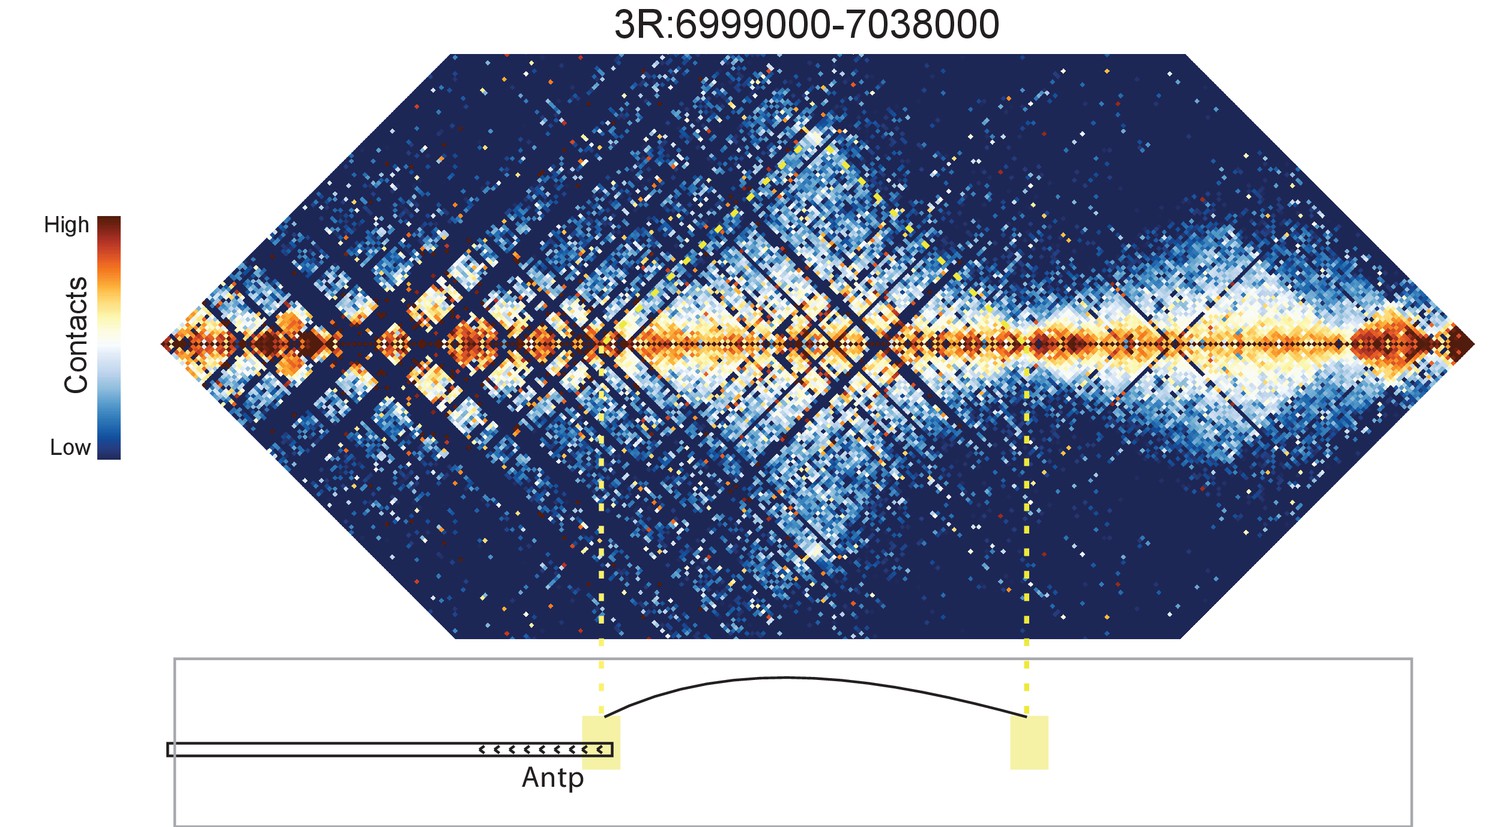
Hi-C map for the locus spanning 3R:6999000-7038000.
A weak loop is detected between the 5' end of the Antp gene and an upstream intergenic region.
Figure 8—figure supplement 10
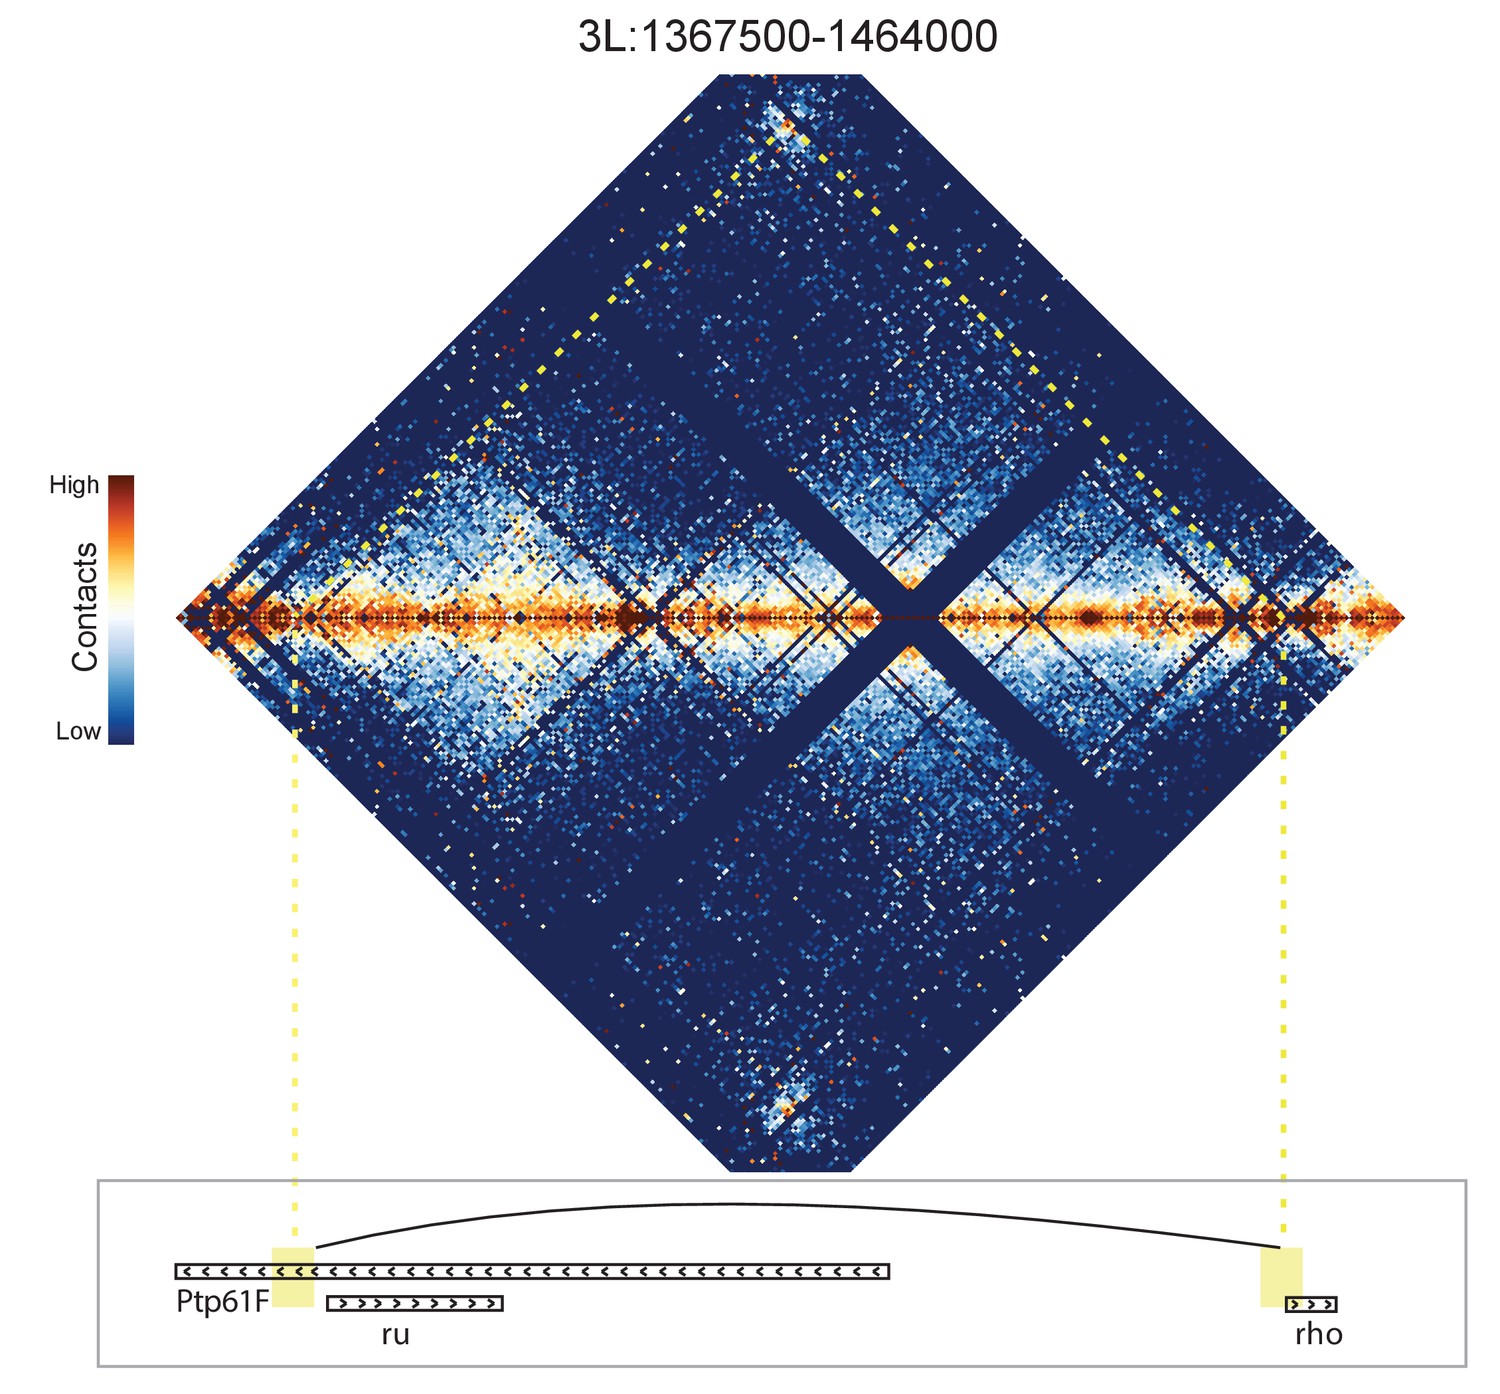
Hi-C map for the locus spanning 3L:1367500-1464000.
A loop is detected between the 5' end of the rho gene and a region near the 5' end of ru.
Figure 9

A chromatin extension model of insulator function.
We propose a model in which insulators achieve domain separation by lowering the compaction ratio of bound chromatin, thereby converting the short lengths of insulator DNA (measured in base pairs) into large relative physical distances. By increasing the distance between domains, this model plausibly explains how insulators can achieve their diverse effects, including organizing chromatin structure, blocking enhancer-promoter interactions, and limiting the spread of chromatin silencing states.
Additional files
-
Supplementary file 1
Supplemental tables.
S1: List of samples used to generate Hi-C libraries. S2: Sequencing and processing statistics for Hi-C libraries. S3: Location of loops and domain-skipping identified in nc14 embryos. S4: Manually called boundaries. S5: Computationally identified boundaries. S6: Representative boundary set, merge of manual and computational curations.
- https://doi.org/10.7554/eLife.29550.034
-
Supplementary file 2
Source data for ChIP and similar enrichment files, e.g. in Figure 3.
- https://doi.org/10.7554/eLife.29550.035
-
Supplementary file 3
Source data for Hi-C heatmaps.
- https://doi.org/10.7554/eLife.29550.036
Download links
A two-part list of links to download the article, or parts of the article, in various formats.
Downloads (link to download the article as PDF)
Open citations (links to open the citations from this article in various online reference manager services)
Cite this article (links to download the citations from this article in formats compatible with various reference manager tools)
Convergence of topological domain boundaries, insulators, and polytene interbands revealed by high-resolution mapping of chromatin contacts in the early Drosophila melanogaster embryo
eLife 6:e29550.
https://doi.org/10.7554/eLife.29550


