Switch-like Arp2/3 activation upon WASP and WIP recruitment to an apparent threshold level by multivalent linker proteins in vivo
- University of California, Berkeley, United States
Figures
Figure 1 with 2 supplements
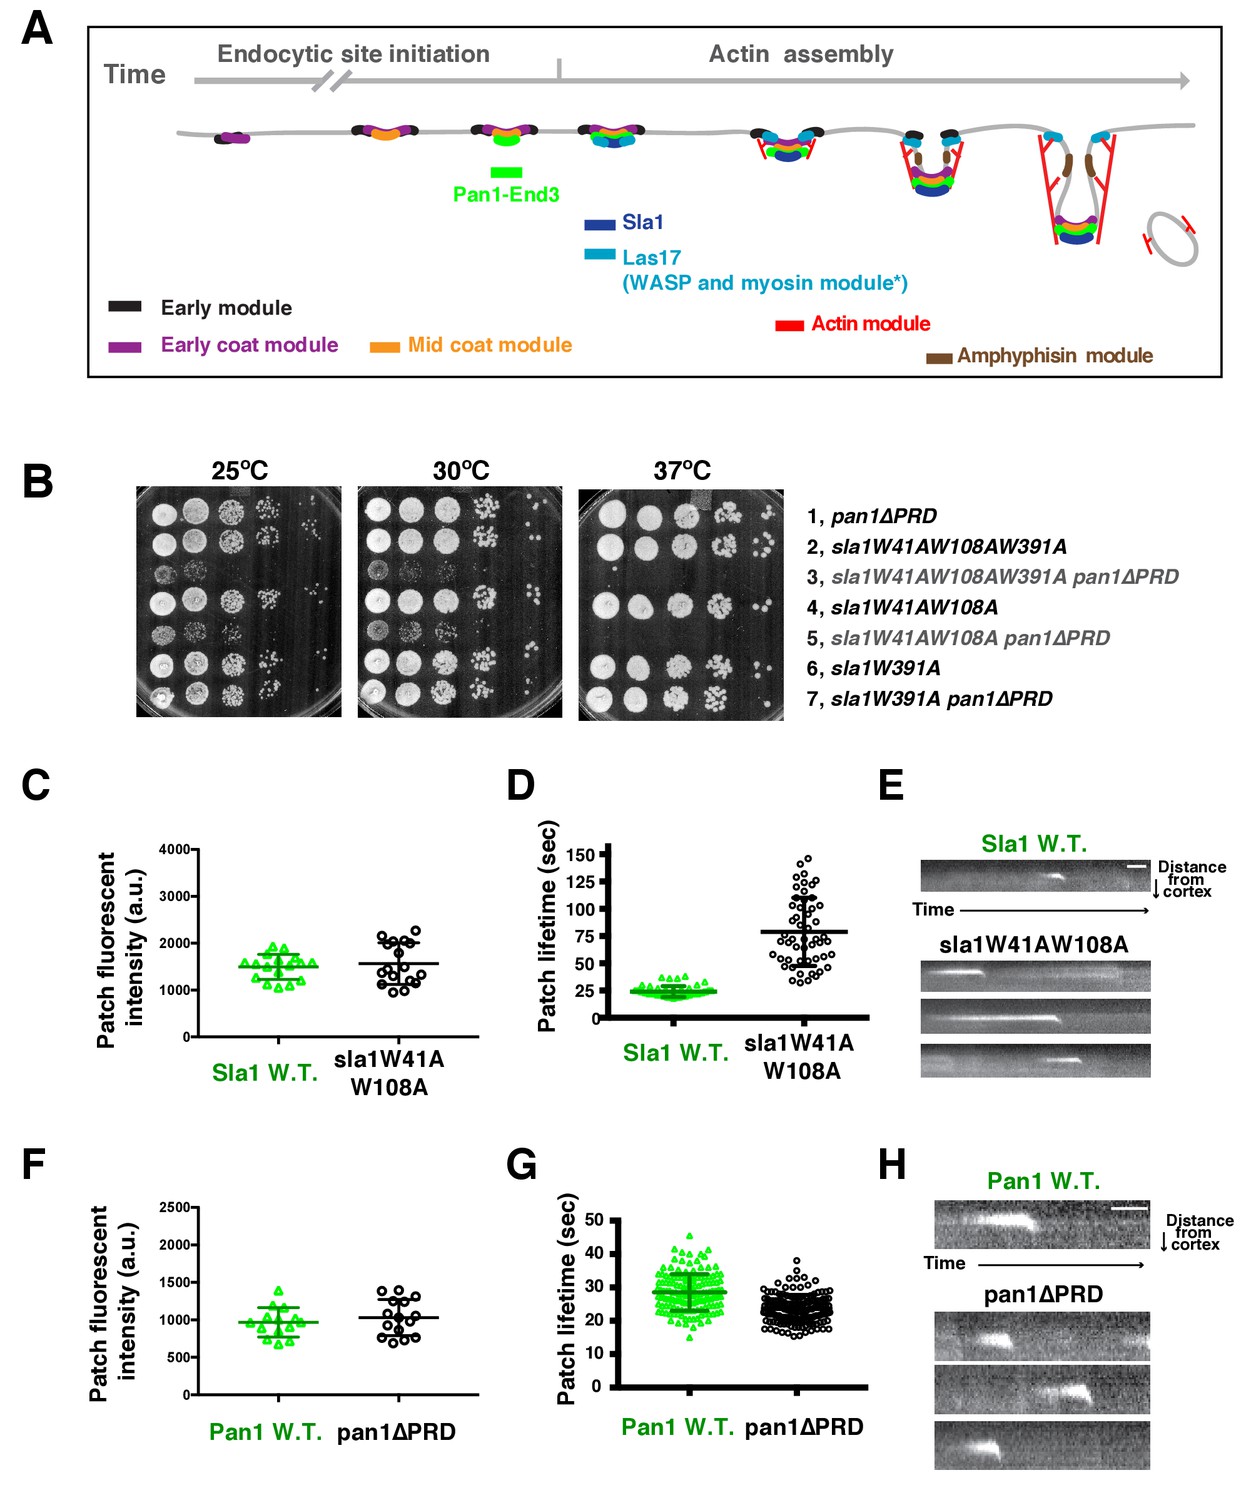
Two Sla1 SH3 domains and a Pan1 PRD domain share a crucial role for cell growth.
(A) Spatial-temporal recruitment of endocytic proteins. Endocytic proteins are grouped into several modules (Lu et al., 2016) as indicated. Pan1 and End3 appear after the mid coat module proteins but slightly before Sla1 and Las17 appear (Sun et al., 2015). * Note that proteins of the WASP-Myosin module arrive at endocytic sites with different timing. Las17 arrives with a similar timing to Sla1, while the remaining components of the WASP-Myosin module arrive later (Sun et al., 2006). (B) Synthetic genetic interaction between sla1W41AW108A and pan1∆PRD. Cell growth of indicated yeast strains was compared by spotting serial dilutions of liquid cultures on plates at 25°C, or 30°C or 37°C. (C-E) Analysis of sla1W41A-W108A-GFP dynamics. (F-H) Analysis of pan1∆PRD-GFP dynamics. C and F, Maximum fluorescence intensity of GFP-tagged patch proteins at endocytic sites (also see Figure 1—figure supplement 1D and E). (D and G) Lifetime (mean ± SD) of GFP-tagged proteins. E and H, Radial kymograph representations (for explanation, please see Figure 1—figure supplement 2) of GFP-tagged proteins. The scale bars are 20 s.
Figure 1—figure supplement 1
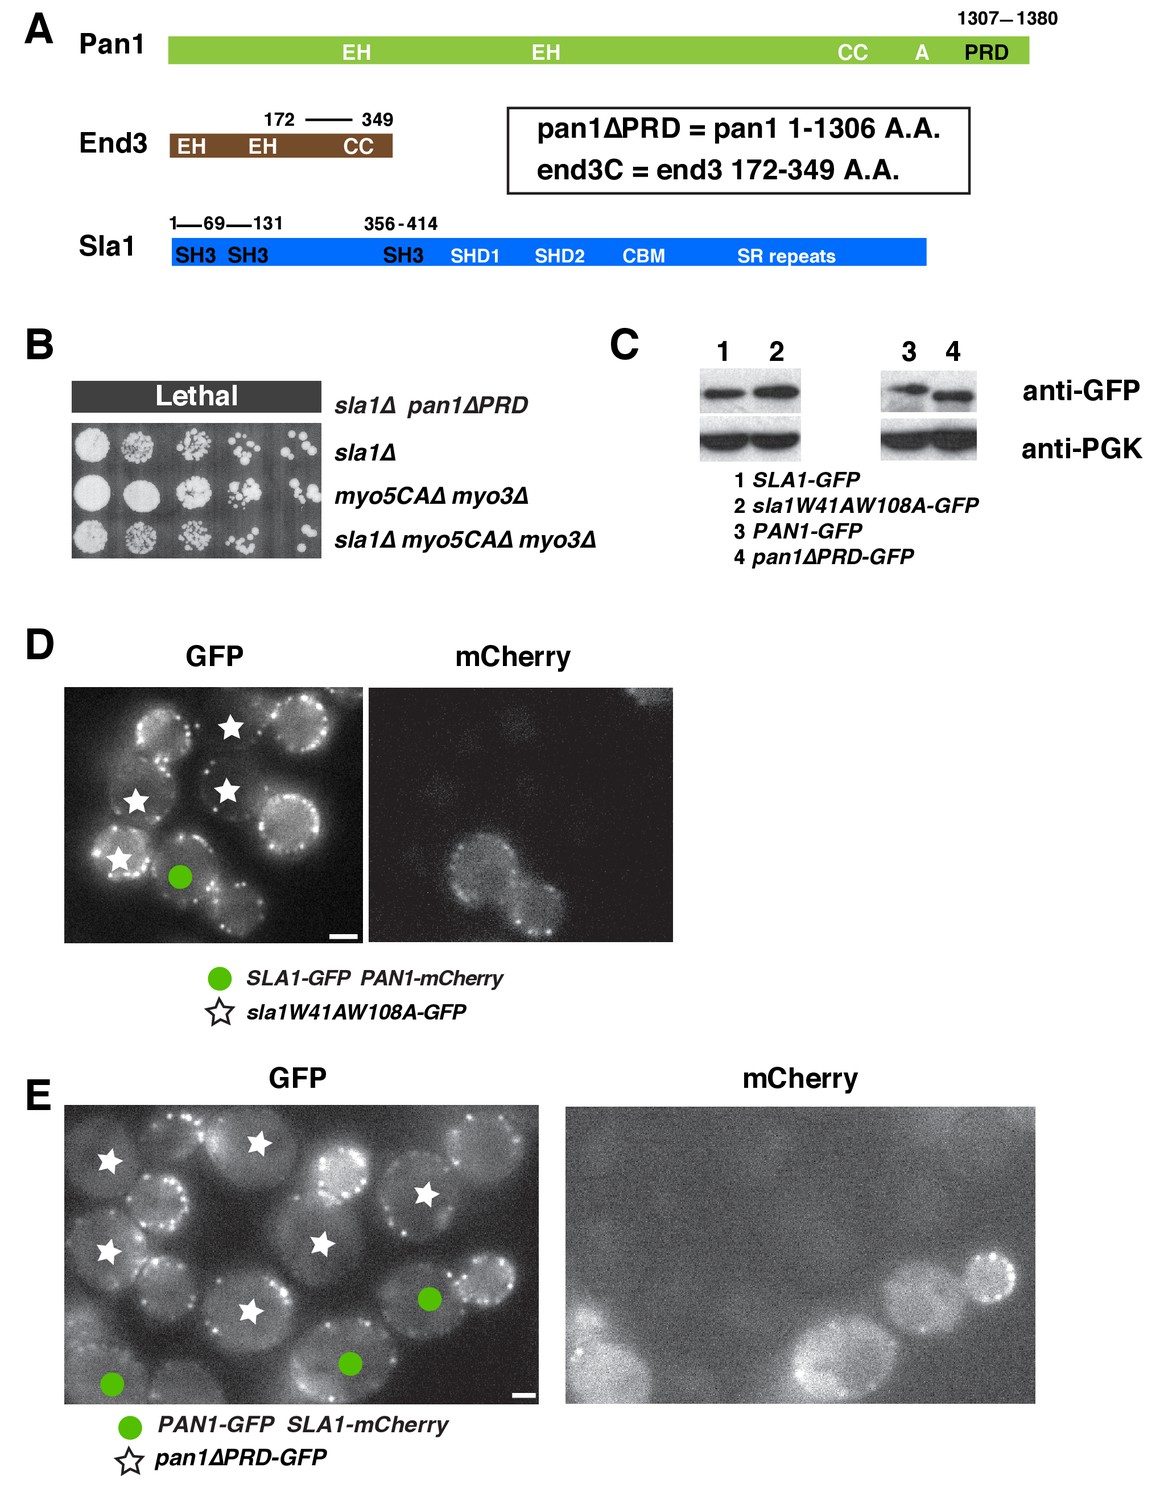
Characterization of sla1W41AW108A and pan1∆PRD mutant cells.
(A) Domain structures of Pan1, End3 and Sla1. EH, Eps15 homology; CC, coiled-coil domain; PRD, proline rich domain; SH3, Src homology 3; SHD1, Sla1 homology domain 1; SHD2, Sla1 homology domain 2; CBM, clathrin-binding motif; SR repeats, LxxQxTG repeats. (B) Examining cell growth of indicated yeast strains by spotting serial dilutions of liquid cultures on plate at 30°C. (C) Immunoblot analysis of whole-cell extracts from indicated yeast cells. PGK (phosphoglycerate kinase) serves as a loading control. (D) Single frame from a movie in which SLA1-GFP PAN1-mCherry cells and sla1W41AW108A-GFP cells were simultaneously imaged in the GFP channel. PAN1-mCherry was used to identify wild-type cells. (E) Single frame from a movie in which PAN1-GFP SLA1-mCherry cells and pan1∆PRD-GFP cells were simultaneously imaged in the GFP channel. SLA1-mCherry was used to identify wild-type cells. The scale bars on cell pictures are 2 µm.
Figure 1—figure supplement 2
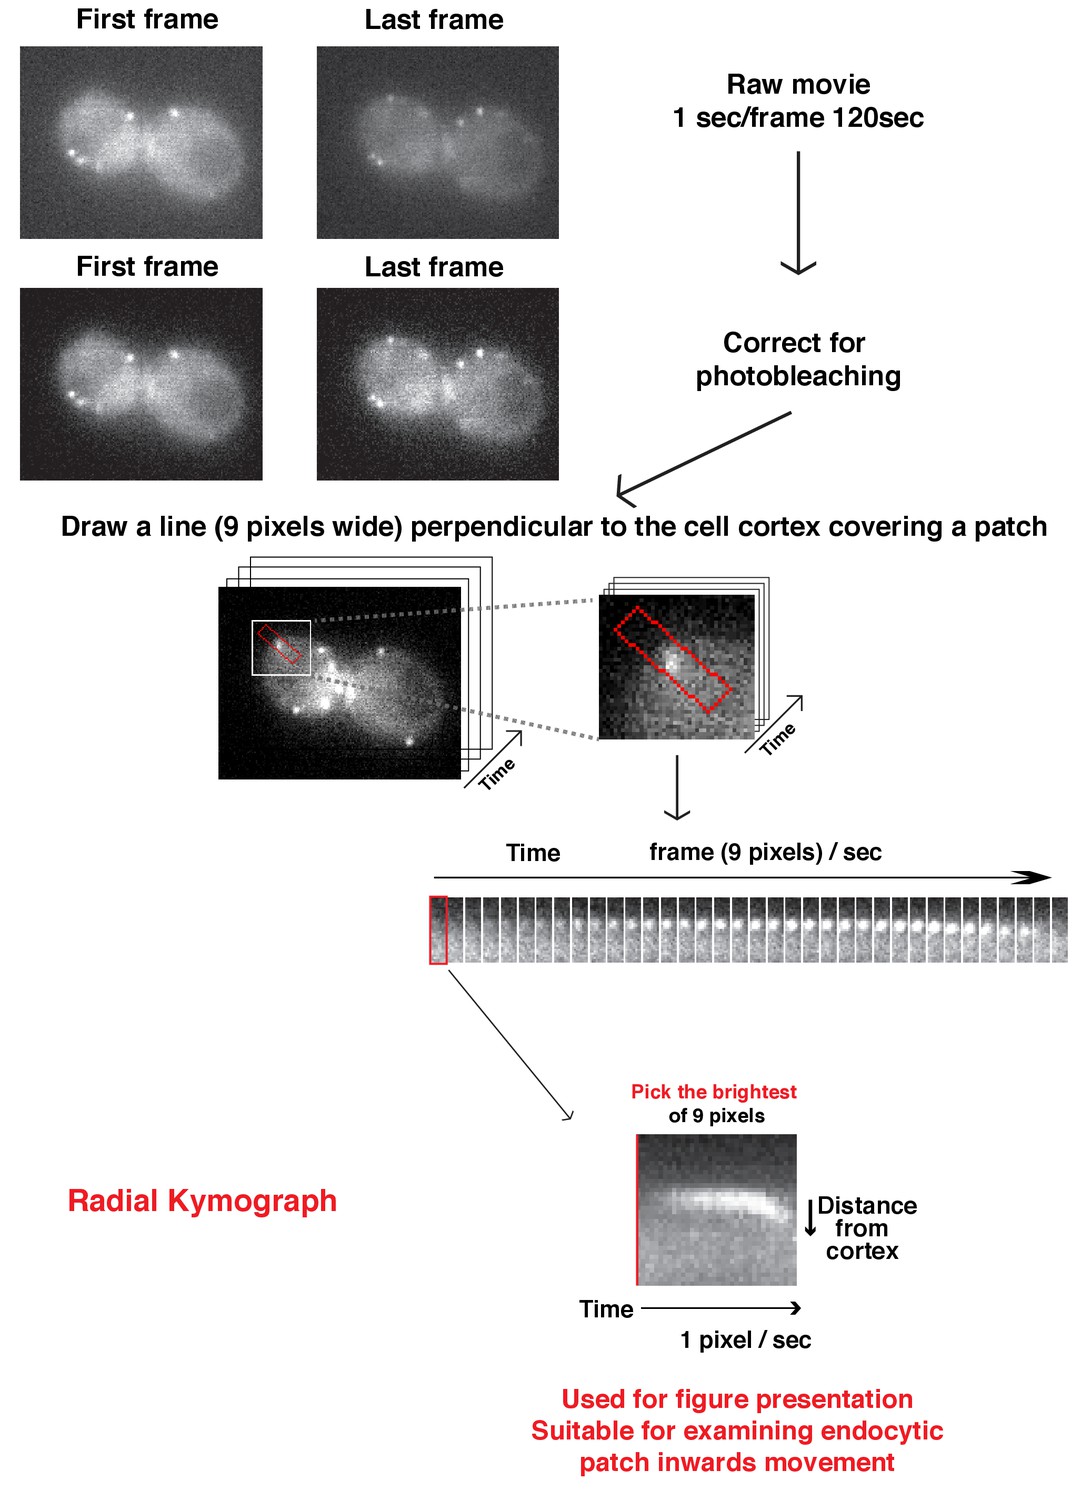
Flowchart for scheme used to generate radial kymograph of fluorescently labeled-proteins in a movie.
Radial kymograph is suitable for presenting how a single endocytic patch moves away from plasma membrane overtime.
Figure 2 with 2 supplements
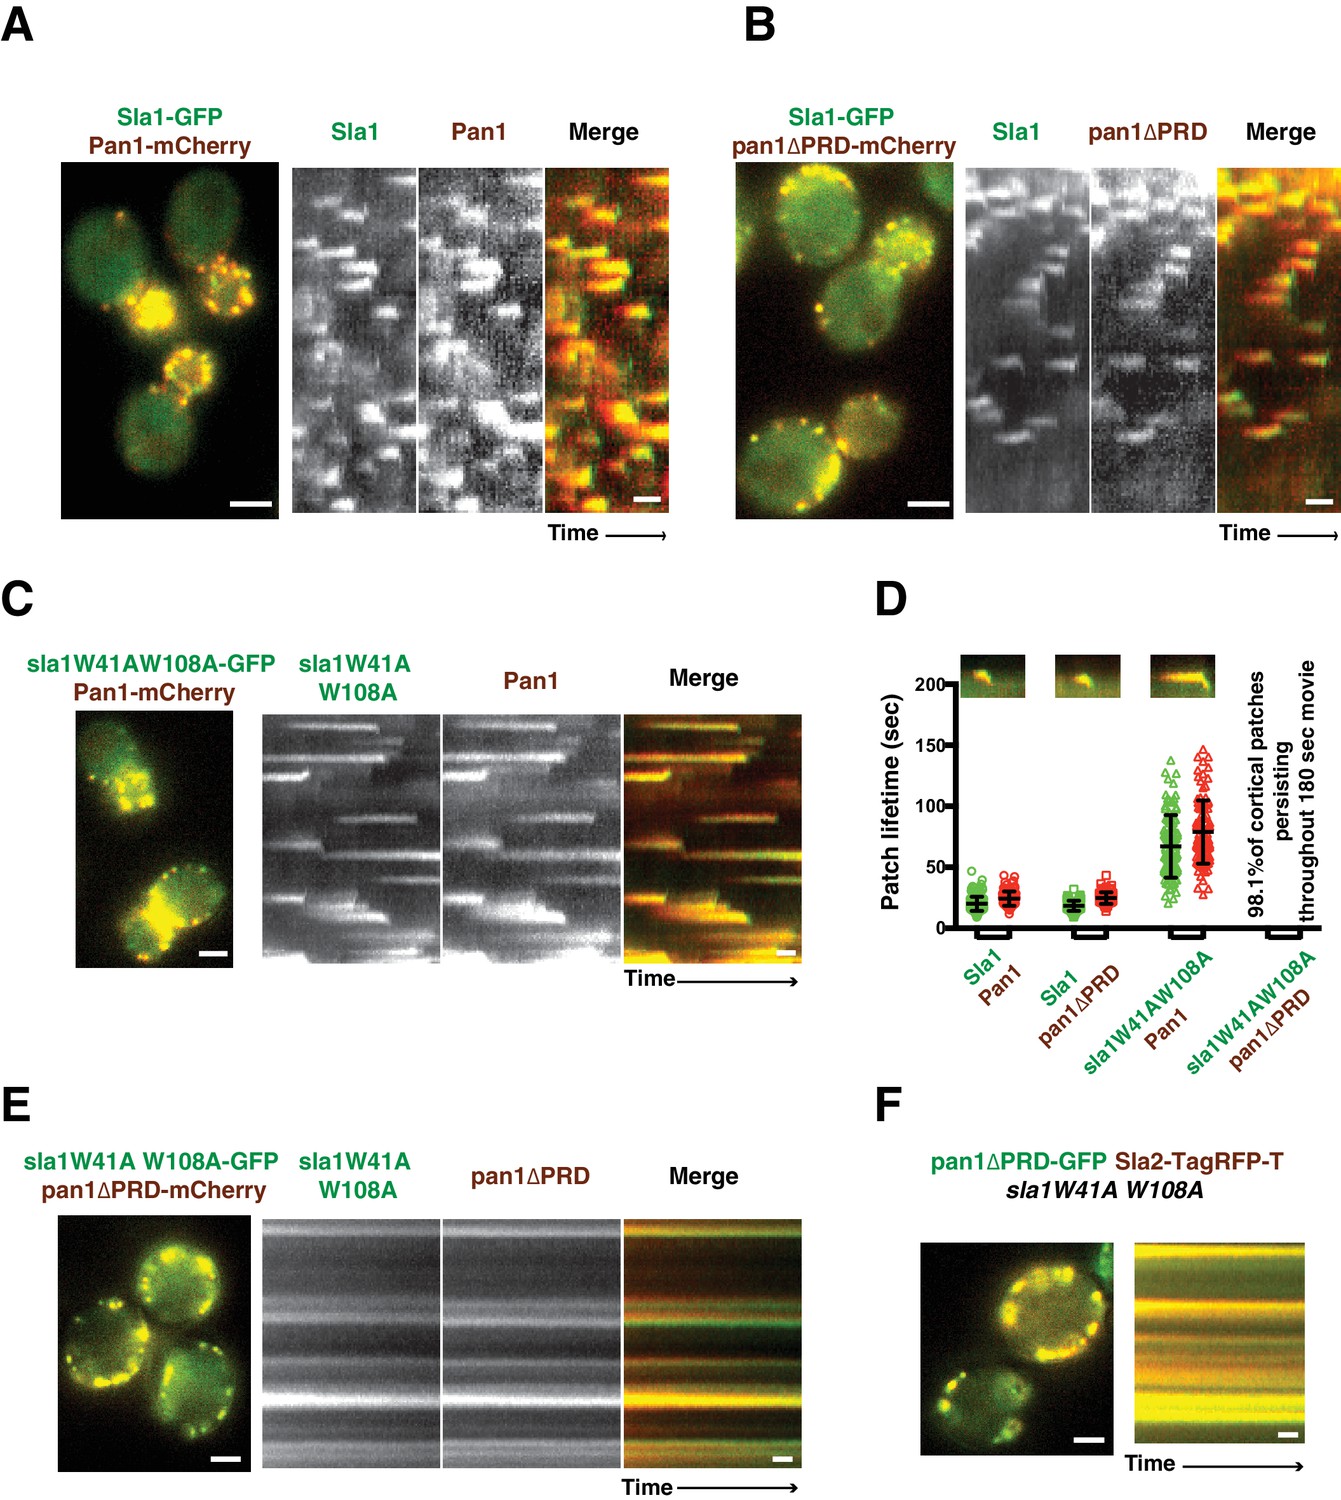
Endocytic internalization is defective in sla1 W41AW108A pan1∆PRD mutant cells.
(A-C) Single frames (left) from movies and circumferential kymograph representations (for the explanation, please see Figure 2—figure supplement 1) for GFP- and mCherry-tagged proteins. (A) SLA1-GFP PAN1-mCherry cells. (B) SLA1-GFP pan1∆PRD-mCherry cells. (C) sla1W41AW108A-GFP PAN1-mCherry cells. (D) Lifetime (mean ±SD) and radial kymograph representations of GFP- and mCherry-tagged proteins for indicated strains. (E) Single frame (left) from a 3 min movie and circumferential kymograph representations of sla1W41AW108A-GFP pan1∆PRD-mCherry cells. (F) Single frame (left) from 3 min movie and circumferential kymograph representation of pan1∆PRD-GFP and Sla2-TagRFP-T in sla1W41AW108A cells. The scale bars on kymographs are 20 s. The scale bars on cell pictures are 2 µm.
Figure 2—figure supplement 1
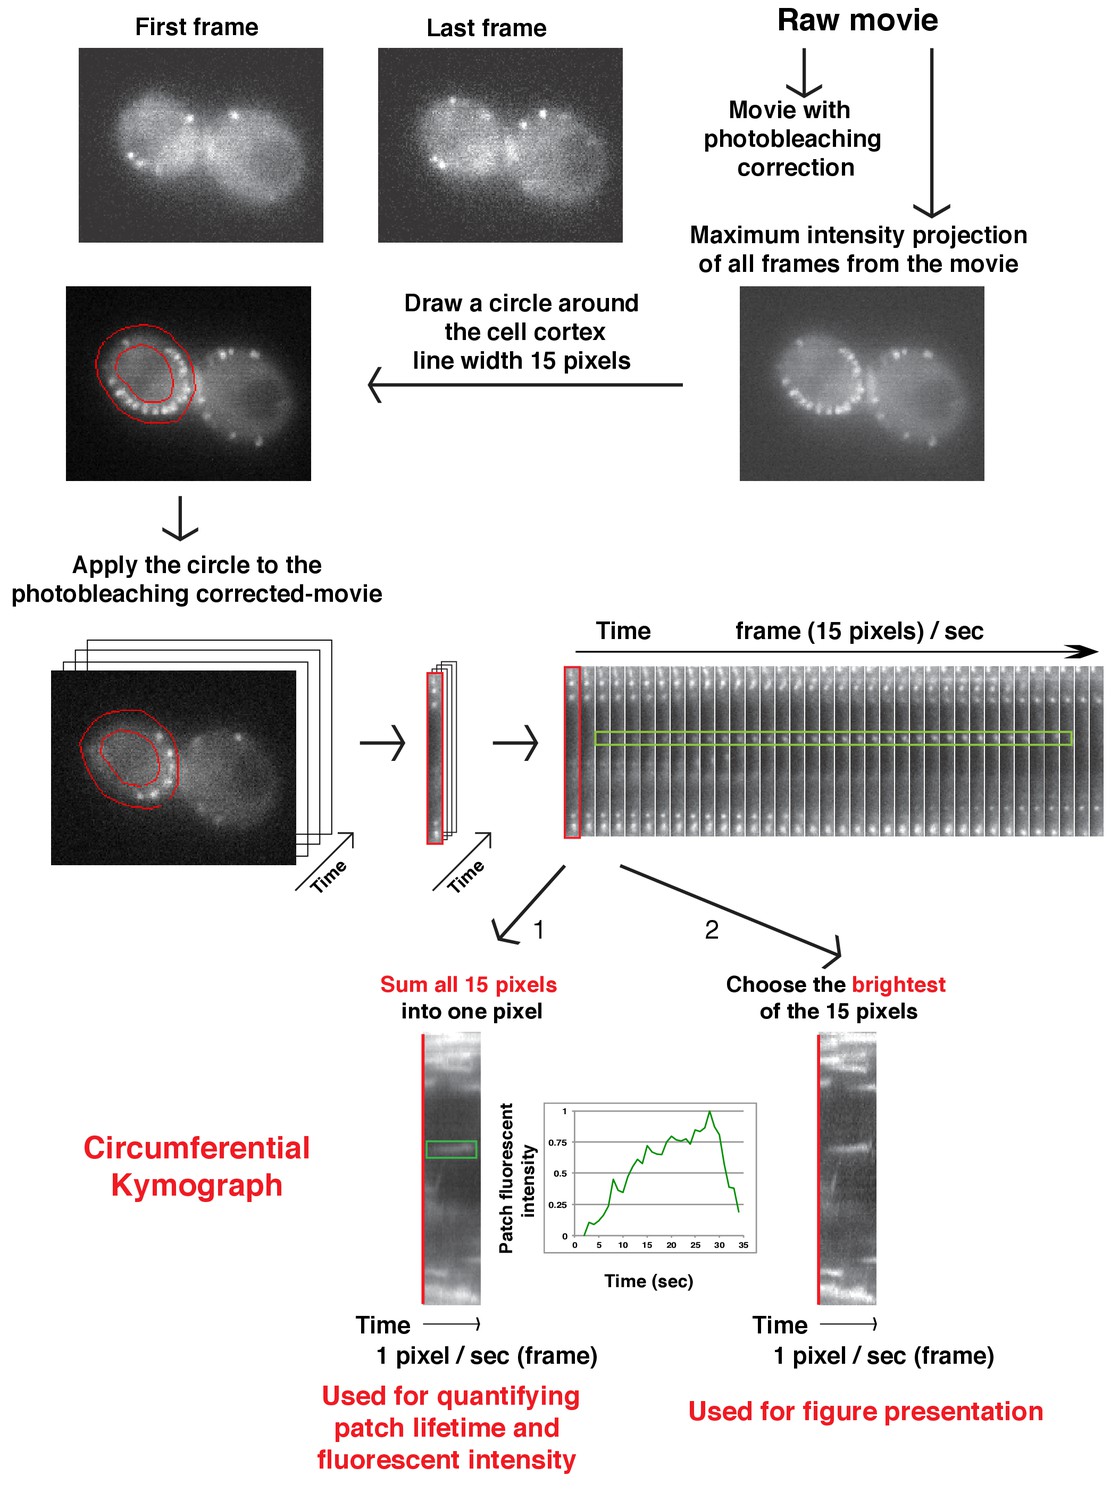
Flowchart for scheme used to generate circumferential kymograph of fluorescently labeled patch proteins on the cell cortex in a movie.
Circumferential kymographs are useful for showing how fluorescence intensity of patch proteins develops at multiple endocytic sites during the duration of the movie.
Figure 2—figure supplement 2
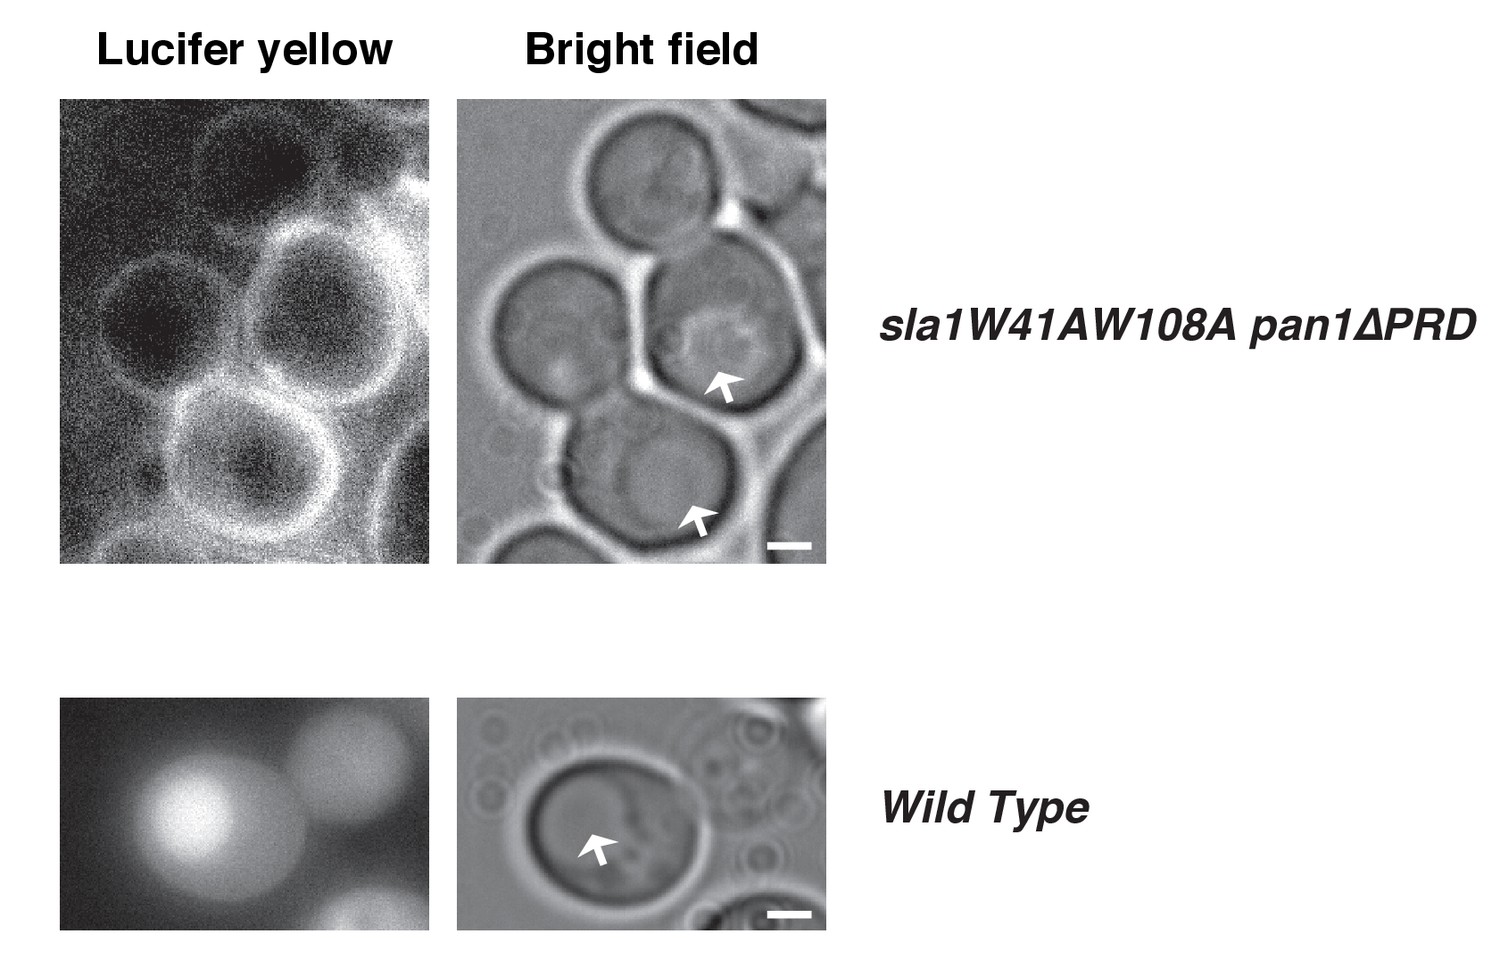
Lucifer yellow (LY) uptake is defective in an sla1W41AW108A pan1∆PRD strain.
The arrows indicate vacuoles. Note that there is no LY signal in the vacuoles or cytoplasm. 270 cells were examined. Lucifer yellow uptake was blocked in 98.5% of the cells. The scale bars on cell pictures are 2 µm.
Figure 3
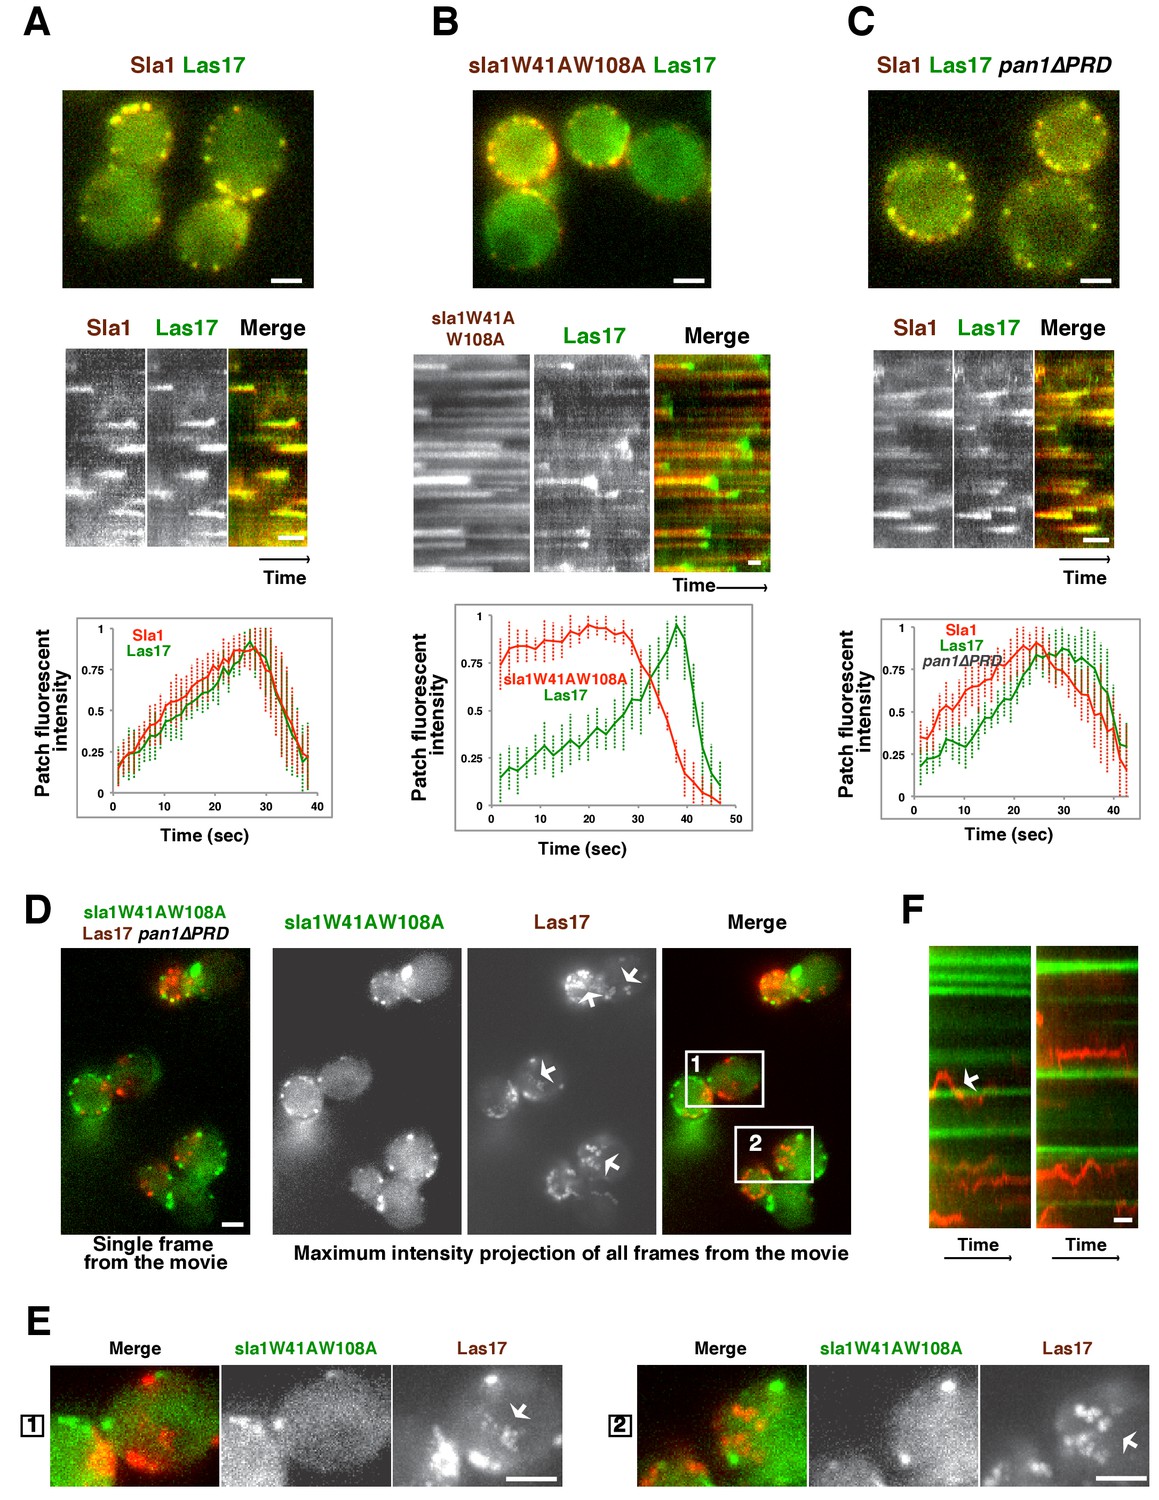
Las17 (yeast WASP) is not recruited to cortical endocytic sites in sla1W41AW108A pan1∆PRD mutant cells.
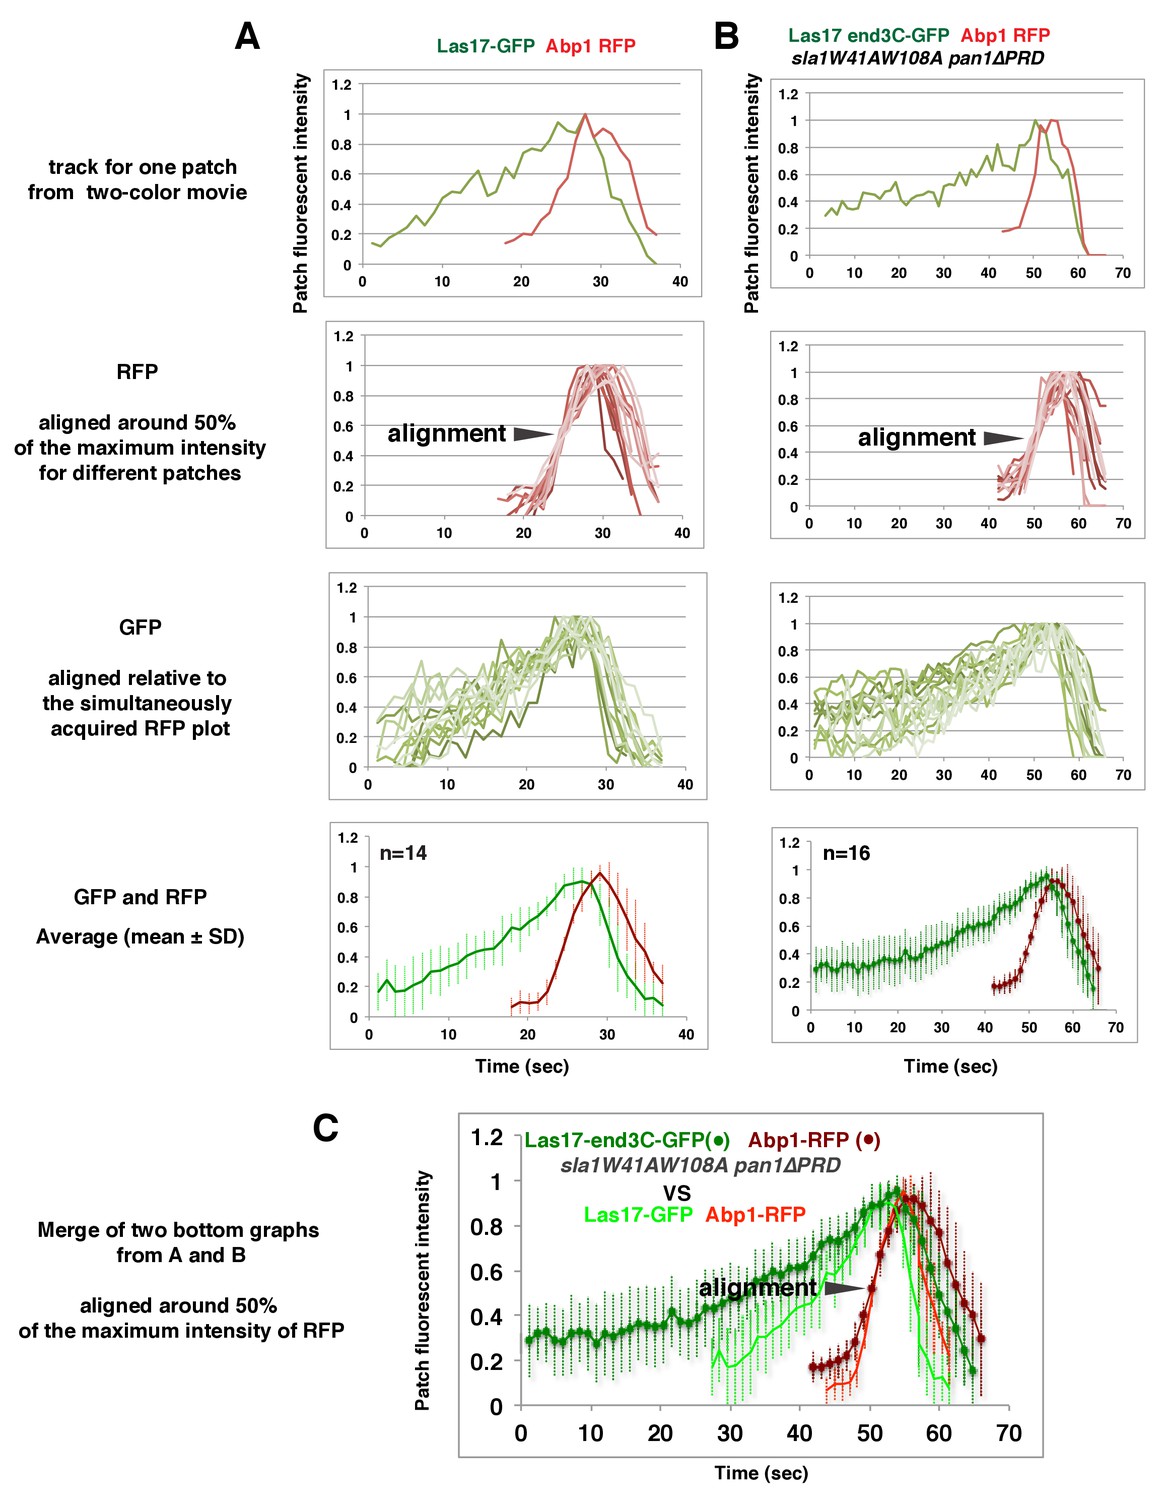
(A-C) Single frames (top) from movies and circumferential kymograph representations (middle) of GFP- and mCherry-tagged proteins. Averaged (mean ±SD) fluorescent intensity profiles for GFP- and mCherry-tagged proteins from 10 individual patches (bottom). (A) SLA1-mCherry LAS17-GFP cells. (B) sla1W41AW108A-mCherry LAS17-GFP cells. Note that the fluorescence intensity profile for this strain was only analyzed for the last 50 s of the patch lifetime. (C) SLA1-mCherry LAS17-GFP pan1∆PRD cells. (D and E) A single frame and maximum intensity projection of all frames from a movie (Video 1) of sla1W41AW108A-GFP LAS17-TagRFP-T pan1∆PRD cells. (E) Enlarged views of the boxed-areas shown in D. The arrows indicate Las17 patches in cytoplasm. (F) Circumferential kymograph representation of sla1W41AW108A-GFP and Las17-TagRFP-T in pan1∆PRDcells. The arrow indicates that a Las17-TagRFP-T patch transiently colocalizes with a static sla1W41AW108A-GFP patch. The scale bars on kymographs are 20 s. The scale bars on cell pictures are 2 µm.
Figure 4 with 1 supplement
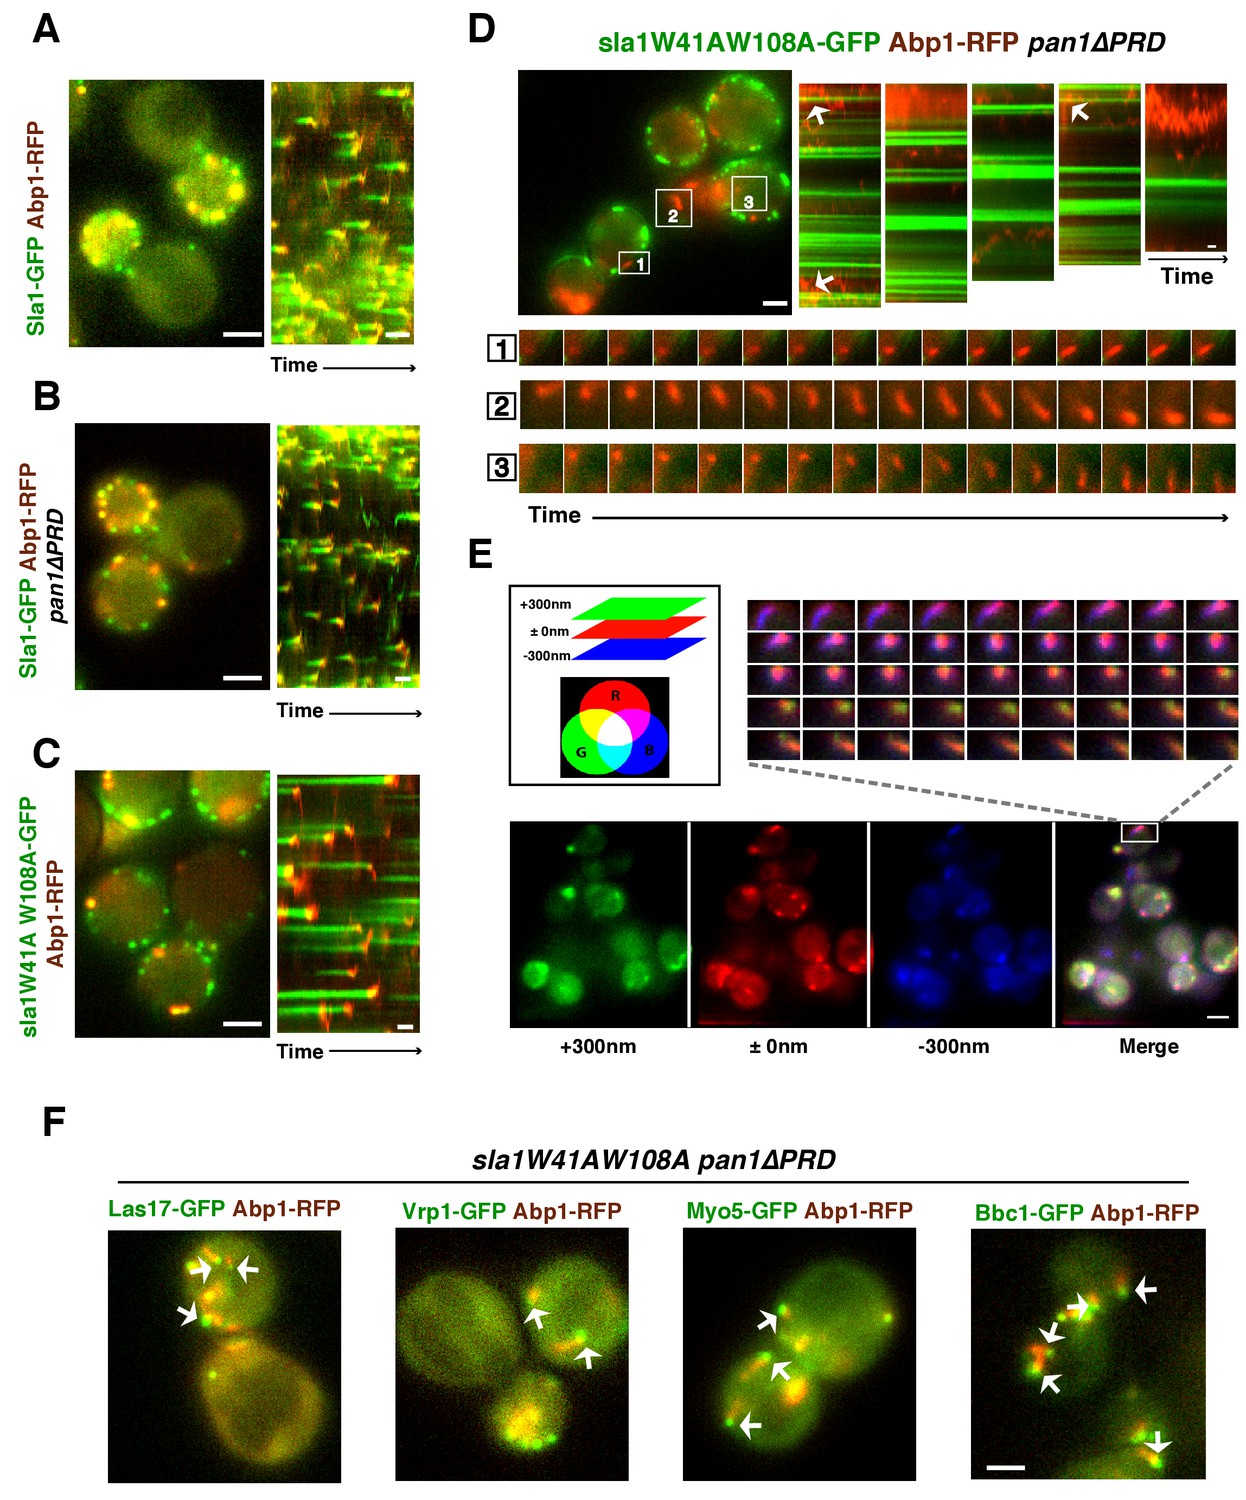
WASP-Myosin module proteins localize at the leading tip of actin comet tails in sla1W41AW108A pan1∆PRD mutant cells.
(A-C) Single frames (left) from movies and circumferential kymograph presentations (right) of GFP- and RFP-tagged proteins. (A) SLA1-GFP ABP1-RFP cells. (B) SLA1-GFP ABP1-RFP pan1∆PRD cells. (C) sla1W41AW108A-GFP ABP1-RFP cells. (D) Single frame (top left) from movie (Video 3) and circumferential kymograph representations (top right) of sla1W41AW108A-GFP and Abp1-RFP in pan1∆PRD cells. Montages of individual actin comet tails in the boxed areas in the top left image (bottom). (E) Dynamics of Sac6-GFP in sla1W41AW108A pan1∆PRD cells observed by multifocus microscopy (MFM). An example of three simultaneously acquired Z-planes that are artificially colored in green, red or blue (bottom panel). Note that the actin tails in the merged image reveal different colors depending on their positions in Z-planes. Montage of one actin comet tail from a movie (Video 2) acquired in multiple Z-planes simultaneously at 1 frame/250 msec (top right). Note that the actin tail changes colors over time, reflecting movement through the cytoplasm. (F) Single frames from movies (Videos 4 and 5) of cells expressing indicated GFP-tagged protein and Abp1-RFP. The arrows indicate that WASP-Myosin module proteins localize at the leading tip of actin comet tails in sla1W41AW108A pan1∆PRD mutants. The scale bars for kymographs are 20 s. The scale bars for cell pictures are 2 µm.
Figure 4—figure supplement 1
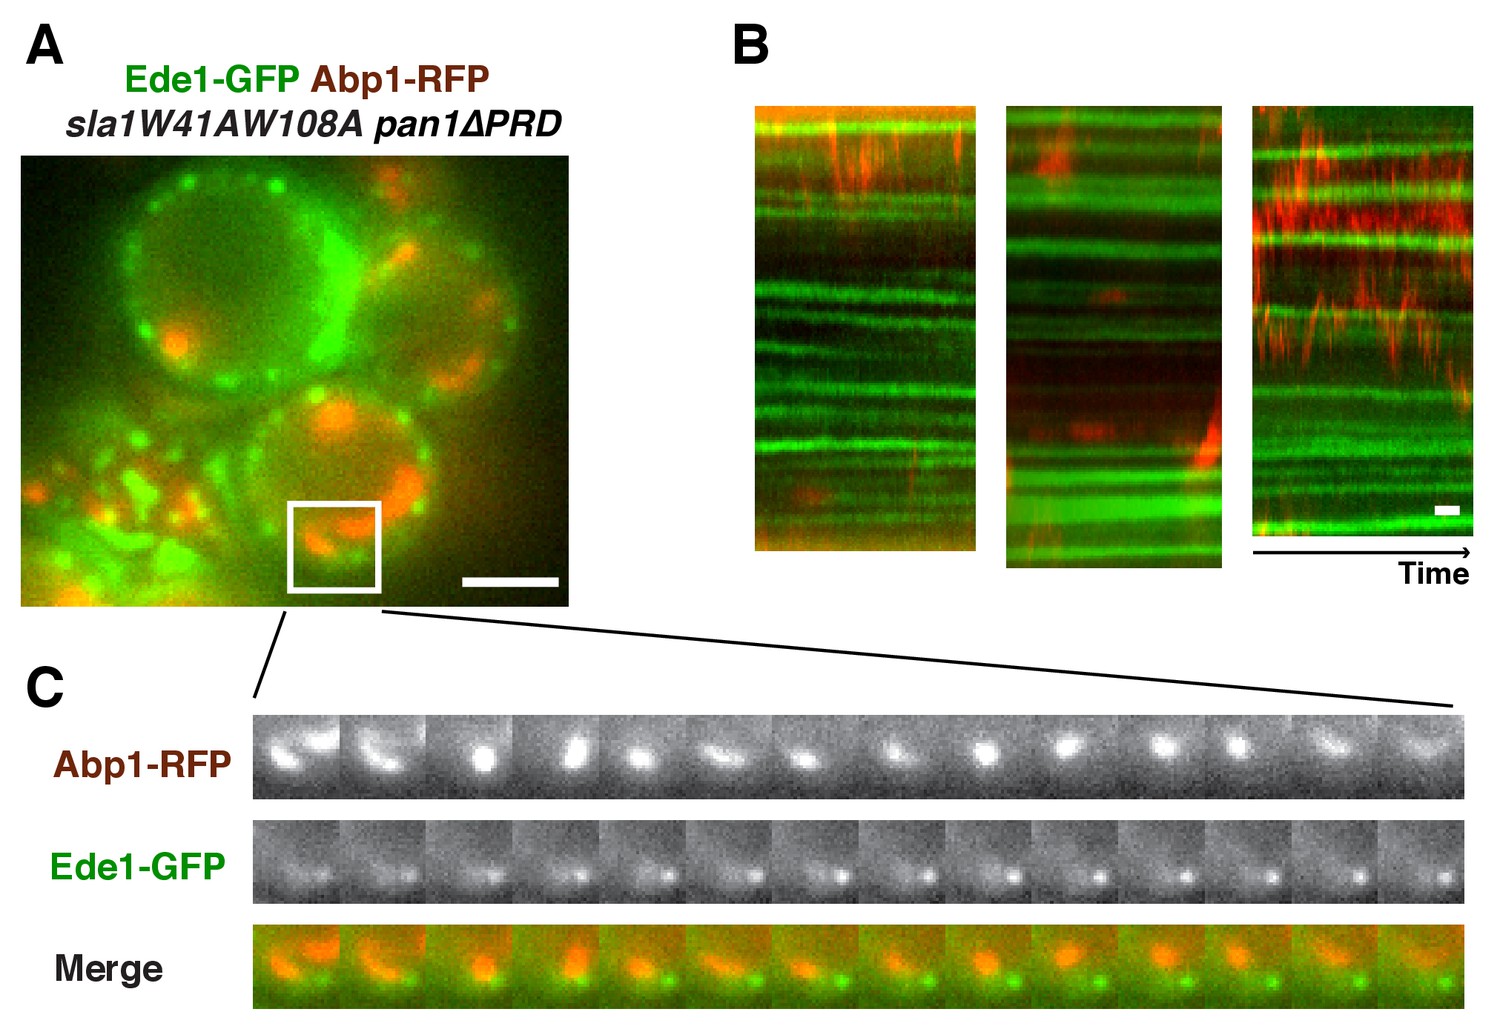
Localization of Ede1 in sla1W41AW108A pan1∆PRD mutant cells.
Single frame (A) from movie and circumferential kymograph representations (B) of Ede1-GFP and Abp1-RFP in sla1W41AW108A pan1∆PRD cells. (C) Montage of the boxed areas in A. The scale bars for kymographs are 20 s. The scale bars for cell pictures are 2 µm.
Figure 5 with 3 supplements
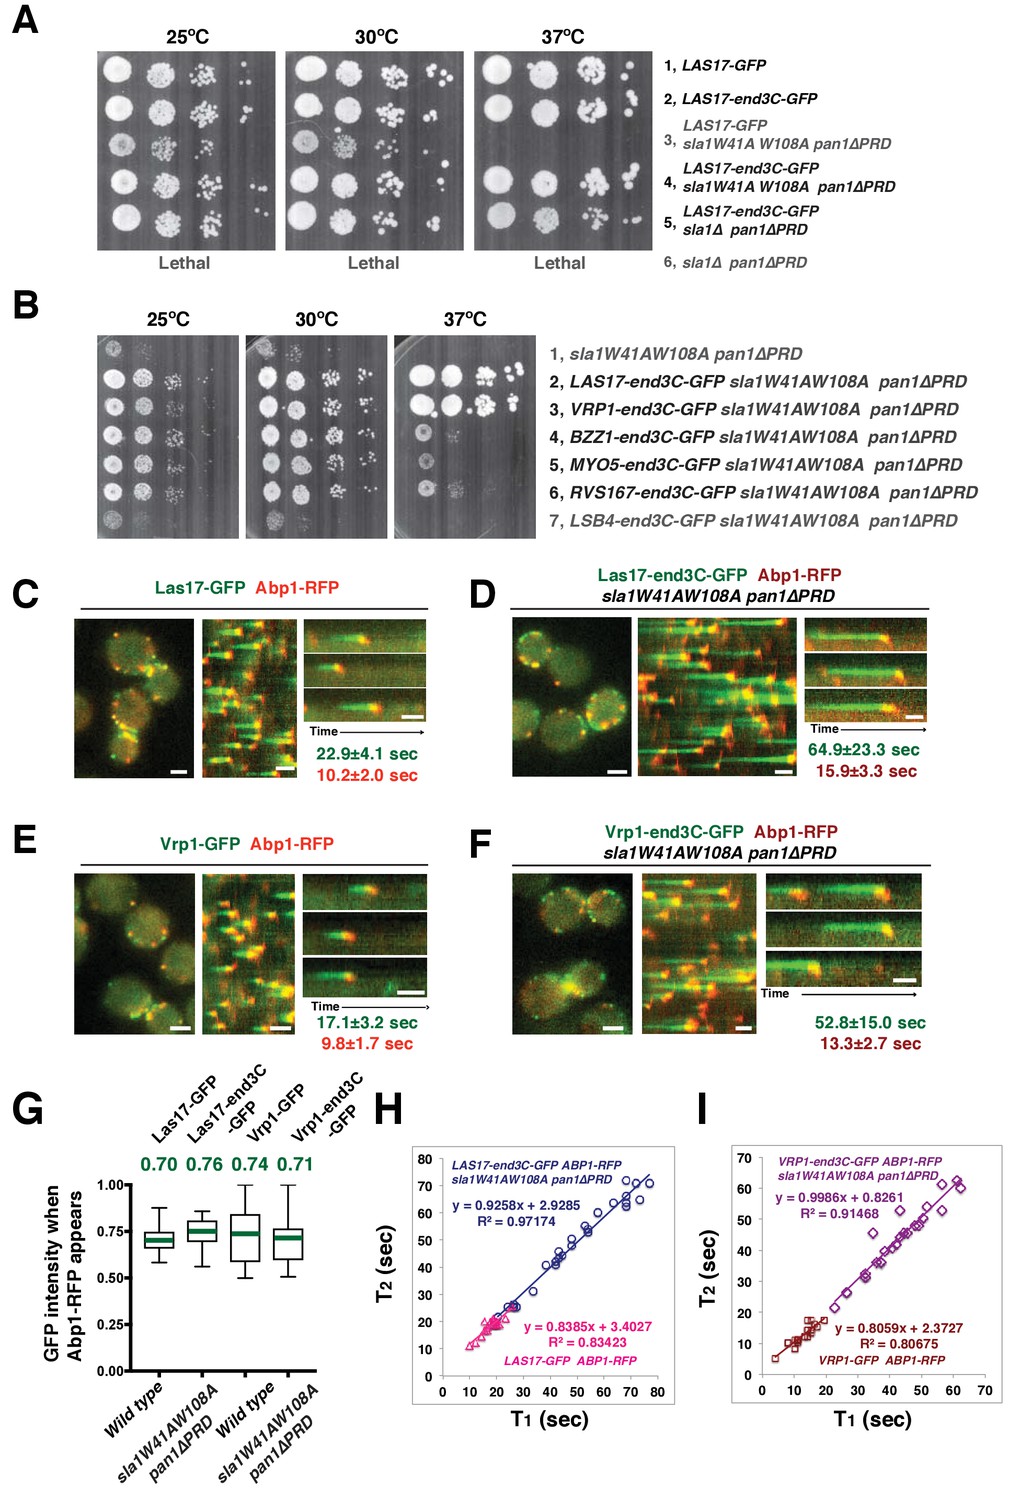
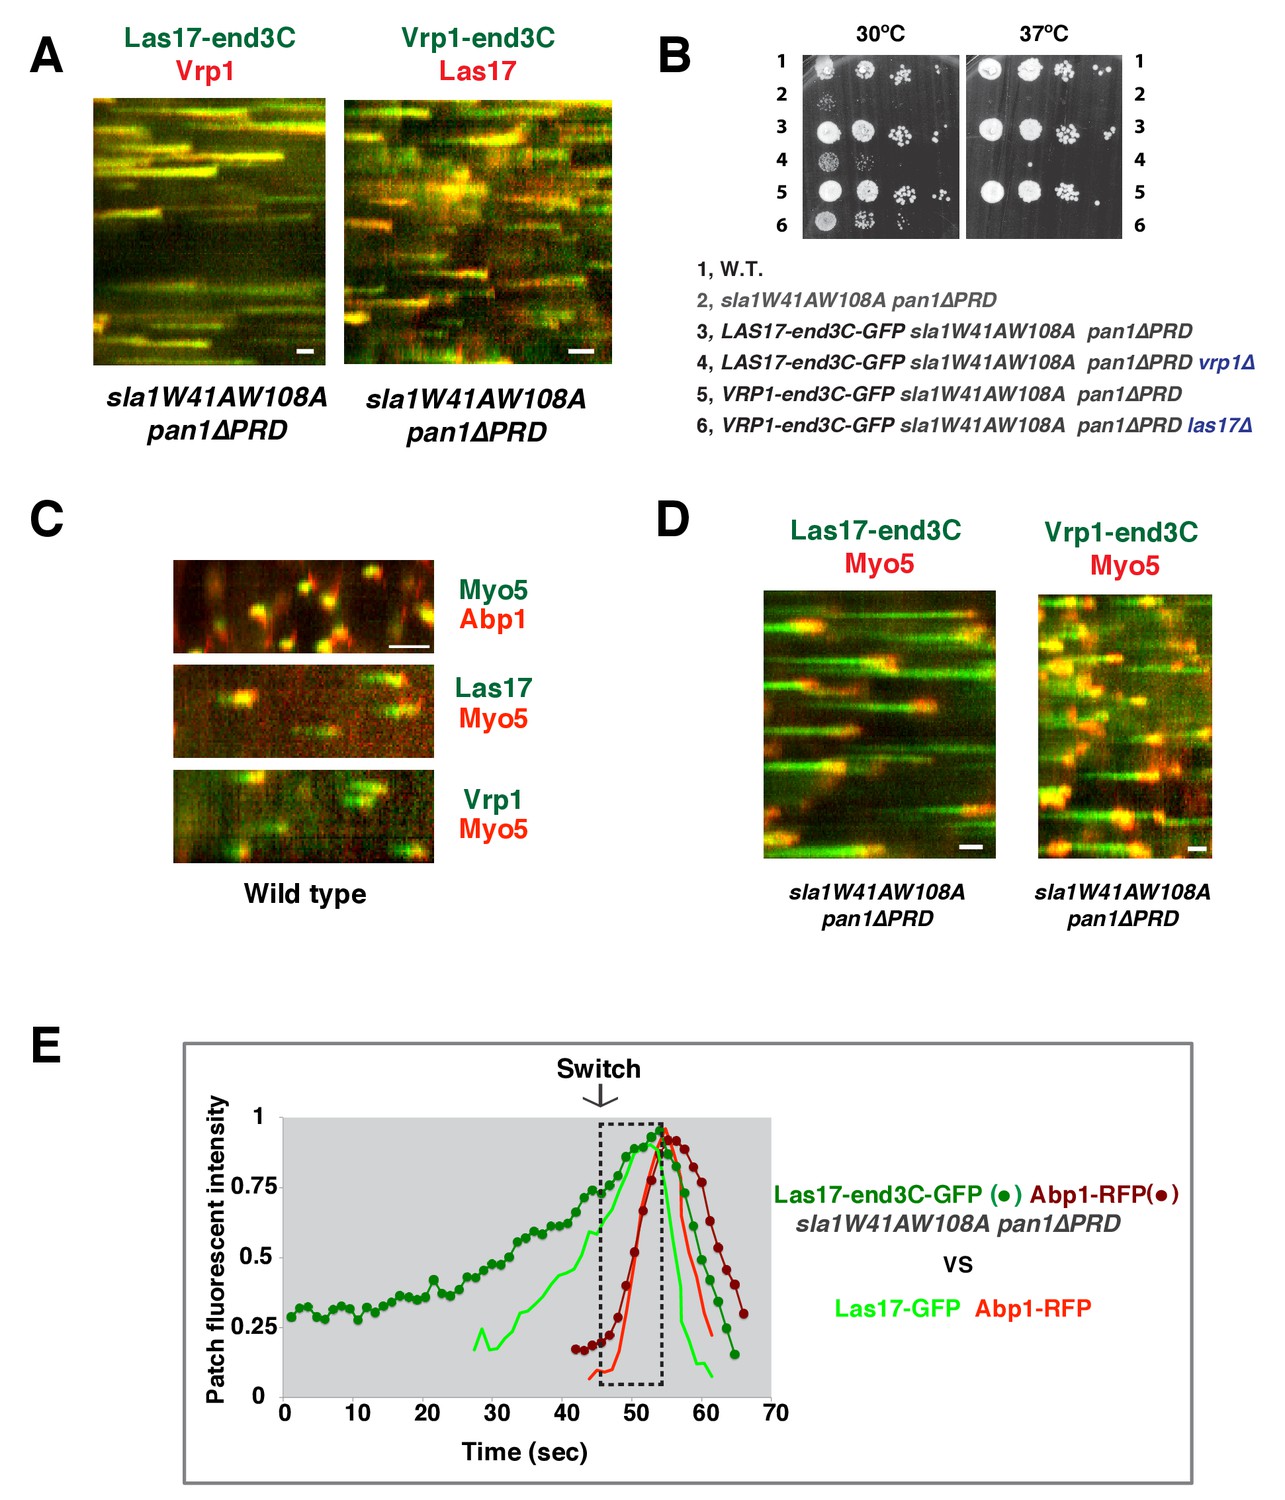
A WASP-end3C chimeric protein or a WIP-end3C chimeric protein restores normal growth and productive endocytic actin assembly in an sla1W41AW108A pan1∆PRD mutant.
The onset of actin assembly is tightly coupled to accumulation of a threshold of WASP or WIP at endocytic sites. (A and B) Cell growth at 25°C, 30°C or 37°C of indicated yeast strains spotted as serial dilutions of liquid cultures on plates (also see Figure 5—figure supplement 1B). (C and E) Single frame (left) from movie (Video 6 or Video 7), circumferential kymograph representation (middle), and radial kymograph representations (right) of Las17-GFP and Abp1-RFP, or Vrp1-GFP and Abp1-RFP in wild-type cells. (D and F) Single frame (left) from movie (Video 6 and Video 7), circumferential kymograph presentation (middle), and radial kymograph representation (right) of Las17-end3C-GFP and Abp1-RFP, or Vrp1-end3C-GFP and Abp1-RFP in sla1W41AW108A pan1∆PRD cells. The numbers shown in C-F are lifetime of GFP-tagged protein (in green) and Abp1-RFP (in red) in the indicated strains (also see Figure 5—figure supplement 3A). (G) The average fluorescence intensity of GFP-tagged patch proteins at the moment when the Abp1-RFP signal appear at endocytic sites for the indicated strains. H and I, T1vs T2 plots for indicated strains (for the details, please see Figure 5—figure supplement 3B). The scale bars in kymographs are 20 s. The scale bars on cell pictures are 2 µm.
Figure 5—figure supplement 1
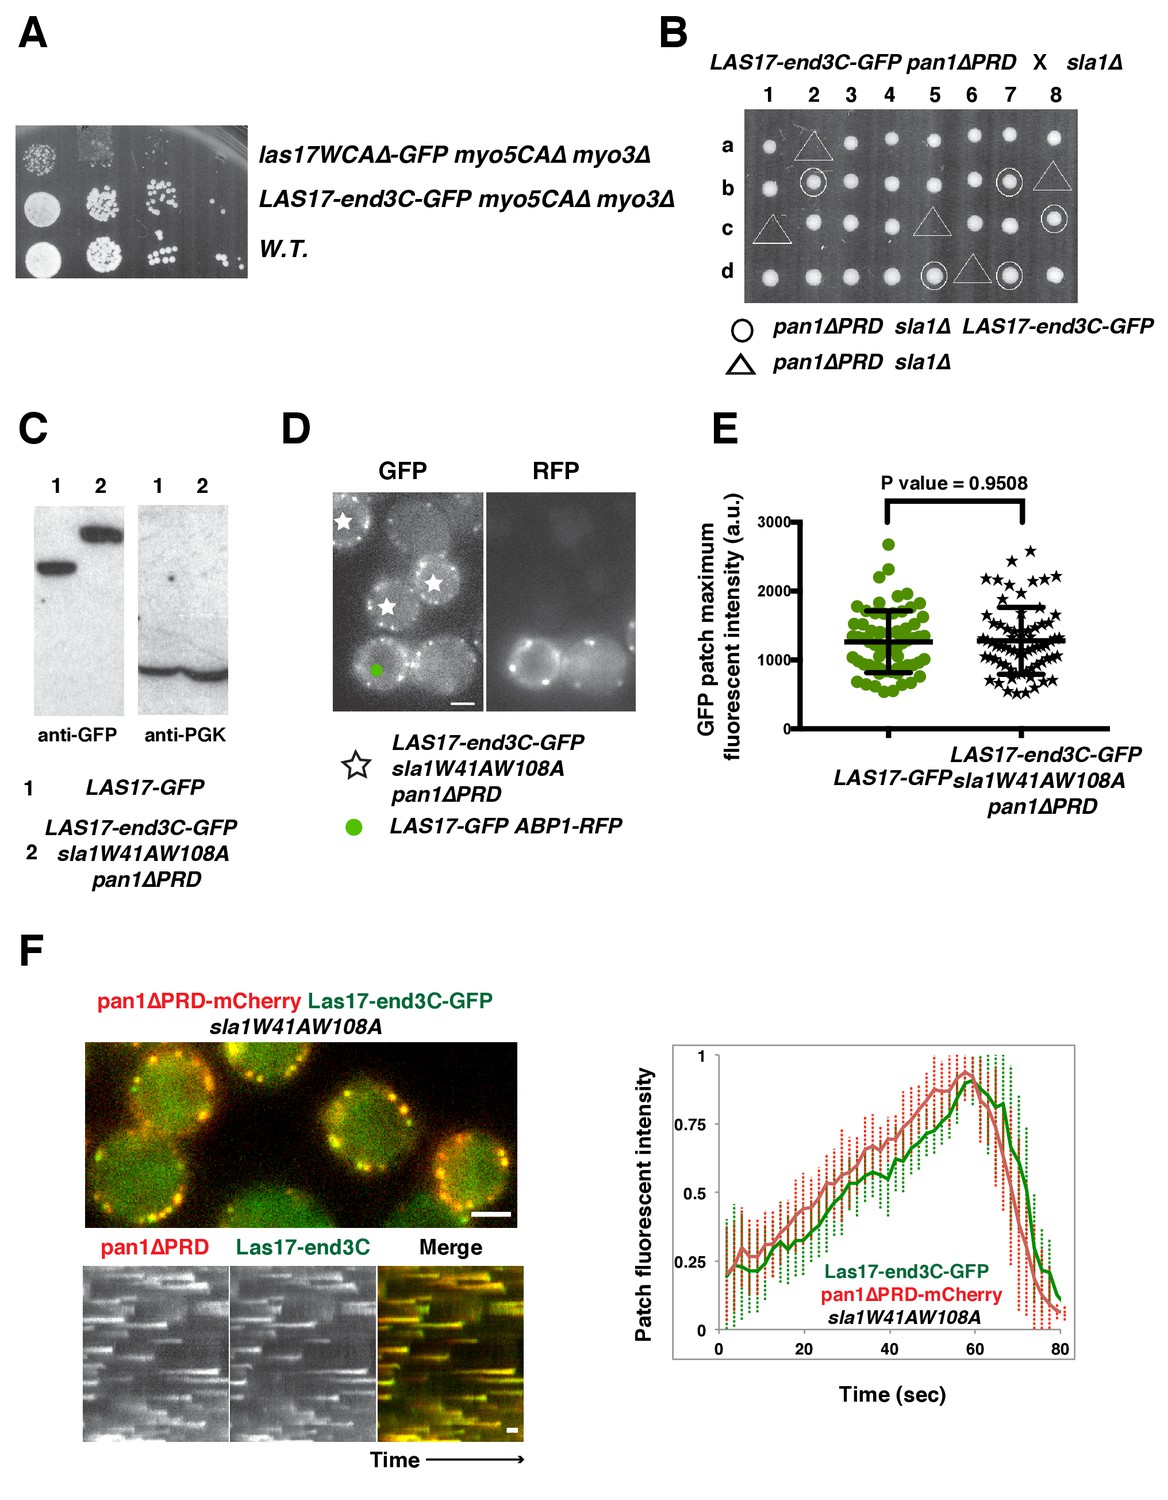
The end3C fusion does not interfere with Las17’s NPF activity and is sufficient to recruit Las17 to cortical endocytic sites in sla1W41AW108A pan1∆PRD mutant cells.
(A) Examining growth of indicated yeast strains by spotting serial dilutions of liquid cultures on plate at 30°C. (B) Tetrad analysis of diploids made by crossing sla1∆ to LAS17-end3C-GFP pan1∆PRD. 1–8 are tetrad dissections and a–d are haploid spore colonies. (C) Immunoblot analysis of whole-cell extracts from LAS17-GFP or LAS17-end3C-GFP sla1W41AW108A pan1∆PRD cells. The intensities of anti-GFP-labeled bands were normalized to that of PGK (phosphoglycerate kinase) loading controls. The ratio of Las17-GFP to Las17-end3C-GFP is 1.0: 0.98. (D) Single frames from a movie in which LAS17-GFP ABP1-RFP cells and LAS17-end3C-GFP sla1W41AW108A pan1∆PRD cells were simultaneously imaged in the GFP channel. ABP1-RFP was used to identify wild-type cells. (E) Maximum fluorescence intensity of GFP-tagged patch proteins at endocytic sites in the indicated strains. (F) Single frames (top left) from movie and circumferential kymograph representations (bottom left) of Las17-end3C-GFP and pan1∆PRD-mCherry in sla1W41AW108A cells. Averaged (mean ±SD) fluorescent intensity profiles (right) for GFP- and mCherry-tagged proteins (n = 15). The scale bars in kymographs are 20 s. The scale bar on cell picture is 2 µm.
Figure 5—figure supplement 2
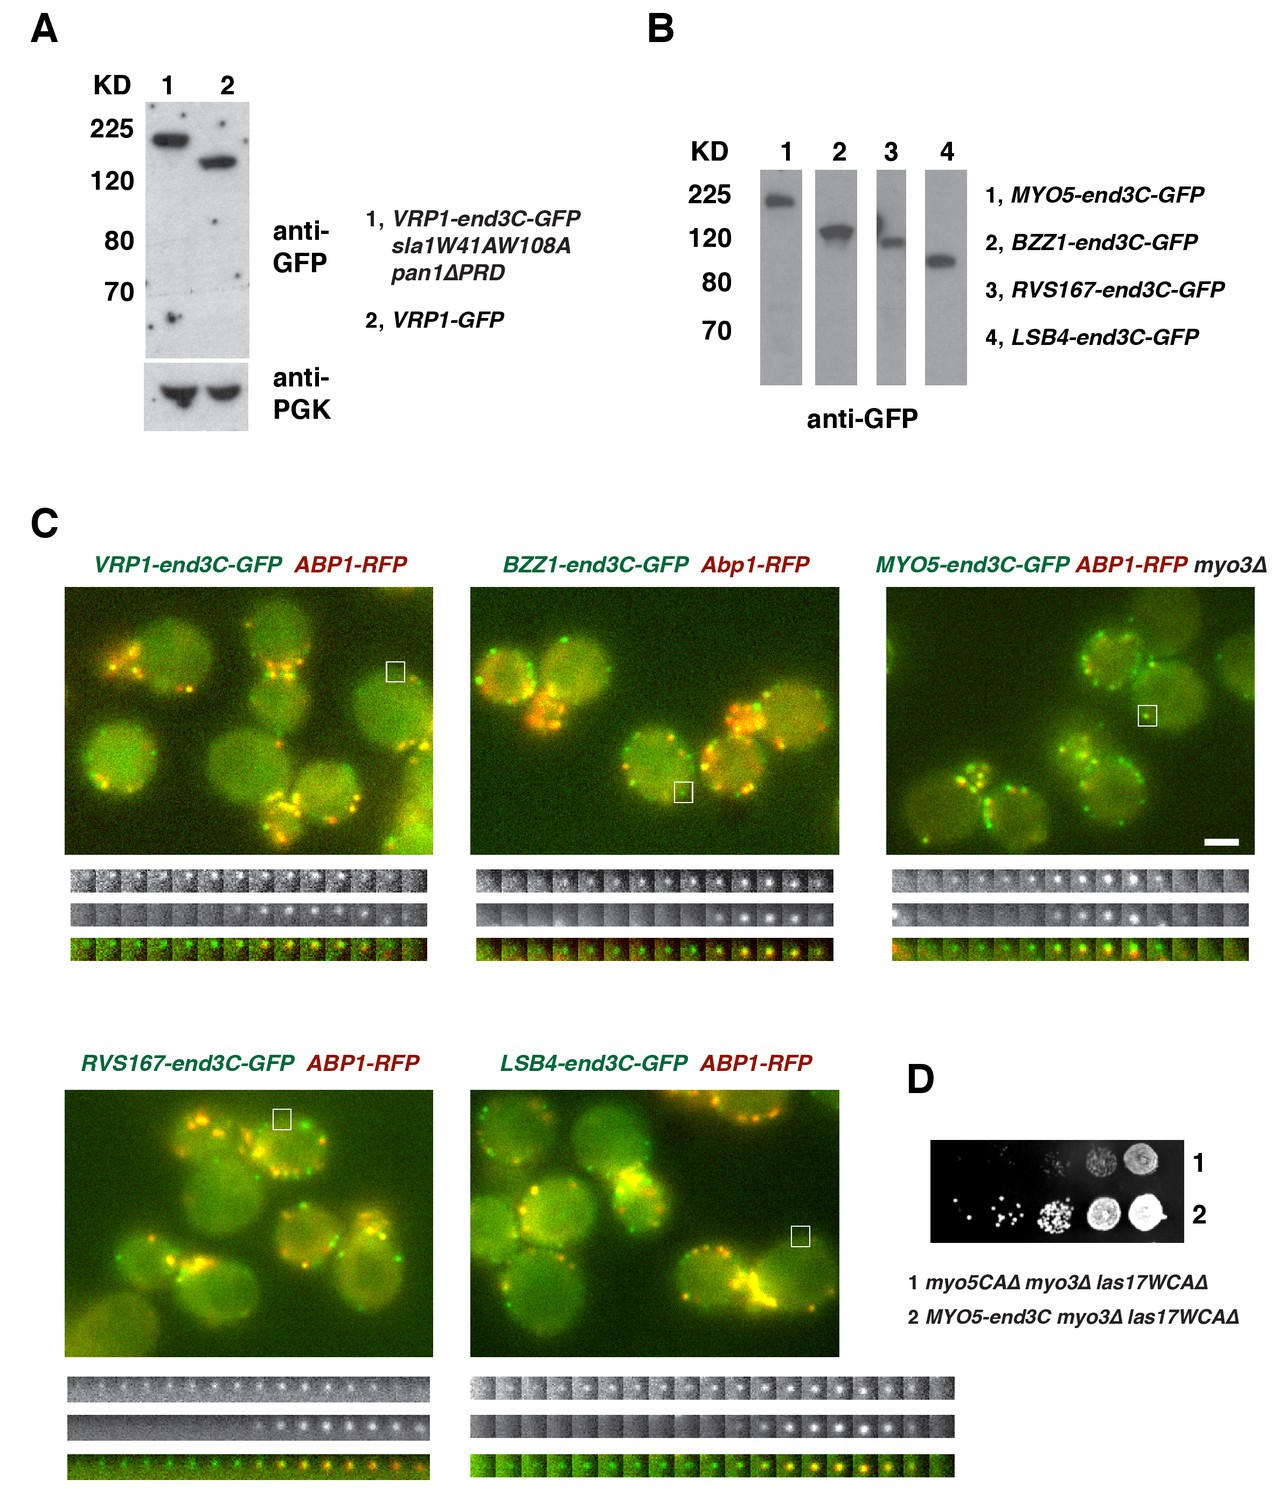
Protein expression and dynamics of various end3C fused proteins.
(A) Immunoblot analysis of whole-cell extracts from VRP1-GFP or VRP1-end3C-GFP sla1W41AW108A pan1∆PRD cells. The intensities of anti-GFP-labeled bands were normalized to that of PGK (phosphoglycerate kinase) loading controls. The ratio of Vrp1-GFP and Vrp1-end3C-GFP is 1.00:1.02. (B) Immunoblot analysis of whole-cell extracts for indicated strains probed with an anti-GFP antibody. (C) Single frames from movies of cells expressing GFP-tagged and RFP-tagged protein pairs. Montages, single-channel or merged images of single patches from movies of cells expressing GFP-tagged and RFP-tagged protein pairs. All the strains show fairly normal growth and endocytic actin patch dynamics. The scale bar on cell picture is 2 µm. (D) Examining growth of indicated yeast strains by spotting serial dilutions of liquid cultures on plate at 30°C.
Figure 5—figure supplement 3
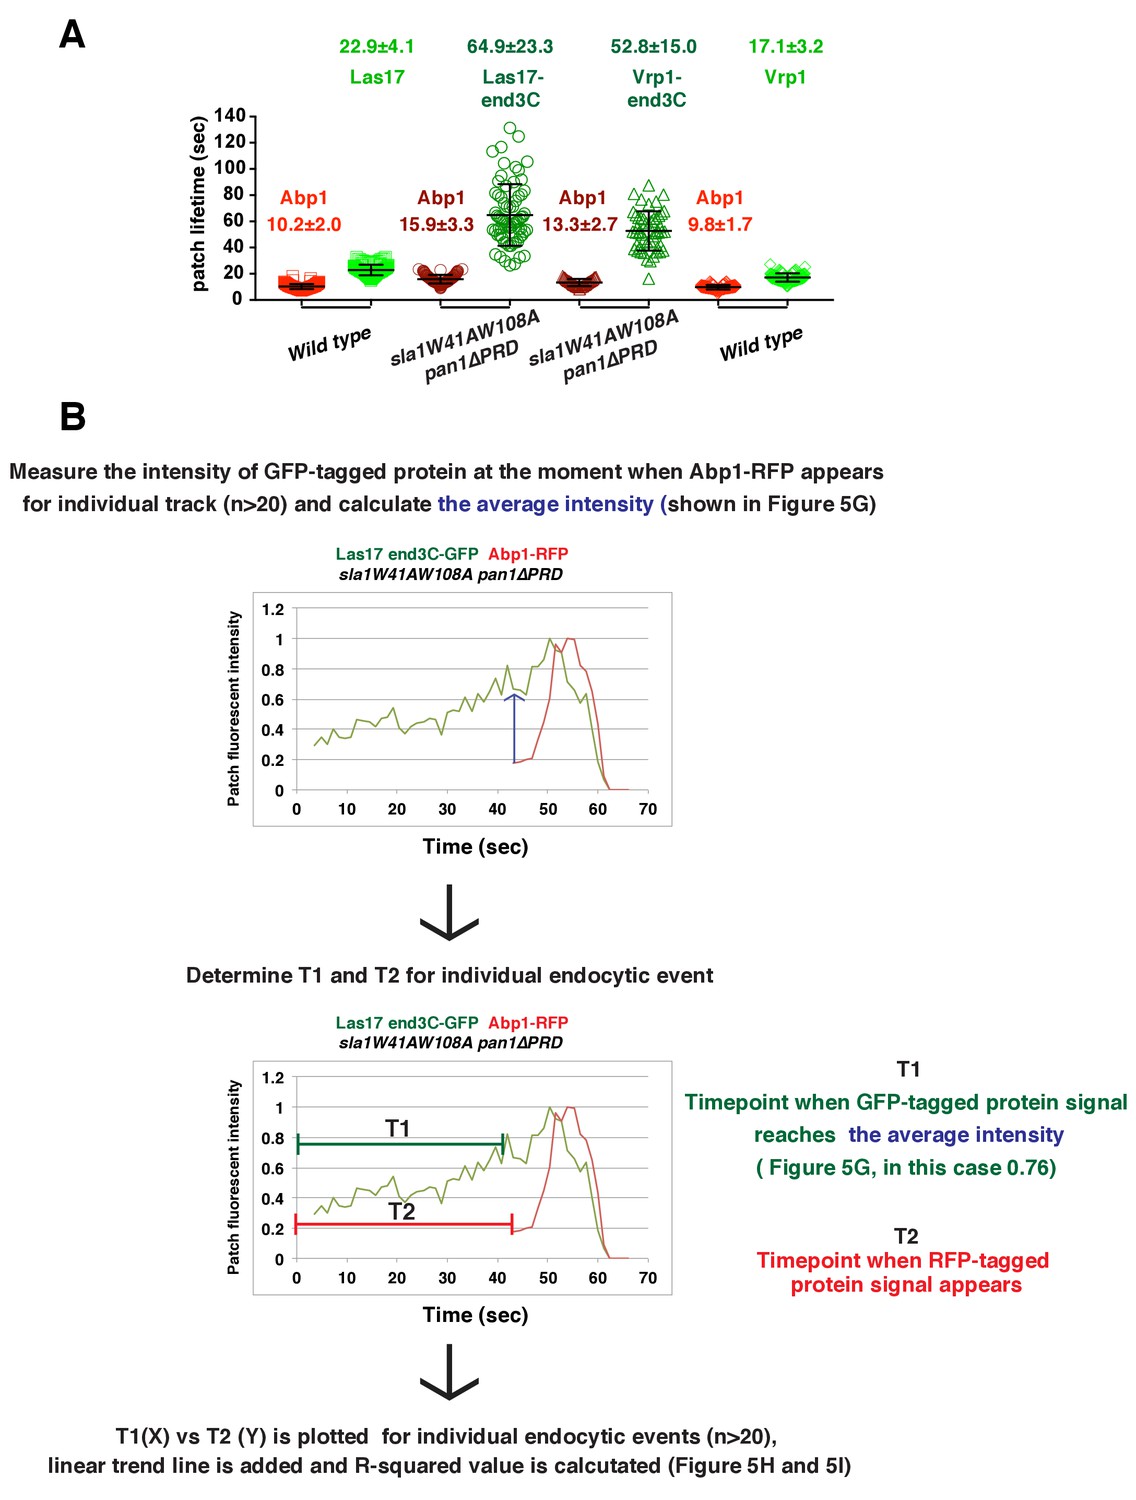
Quantification of endocytic patch protein lifetime for strains shown in Figure 5C–F and flowchart for scheme used to plot graphs shown in Figure 5H and I.
(A) Lifetimes of GFP- and RFP-tagged proteins in the indicated strains that were presented in Figure 5C–F. (B) Flowchart for method used to determine T1 and T2 for each individual endocytic events to plot graphs shown in Figure 5H and I.
Figure 6 with 2 supplements
Actin assembly is triggered in a switch-like manner that corresponds to a threshold level of WASP-WIP accumulation.
(A) Circumferential kymograph presentations of GFP- and mCherry- or TagRFP-T-tagged proteins for indicated yeast strains (also see Figure 6—figure supplement 1). (B) Examining growth of indicated yeast strains by spotting serial dilutions of liquid cultures on plate. (C) Circumferential kymograph presentations of GFP- and RFP- or TagRFP-T-tagged proteins in wild-type cells. (D) Circumferential kymograph presentations of GFP- and TagRFP-T-tagged proteins for indicated yeast strains. (E) Alignment of averaged intensity measurements of GFP- and RFP-tagged proteins from the indicated yeast cells. For more details, please also see Figure 6—figure supplement 2. The scale bars in kymographs are 20 s.
Figure 6—figure supplement 1
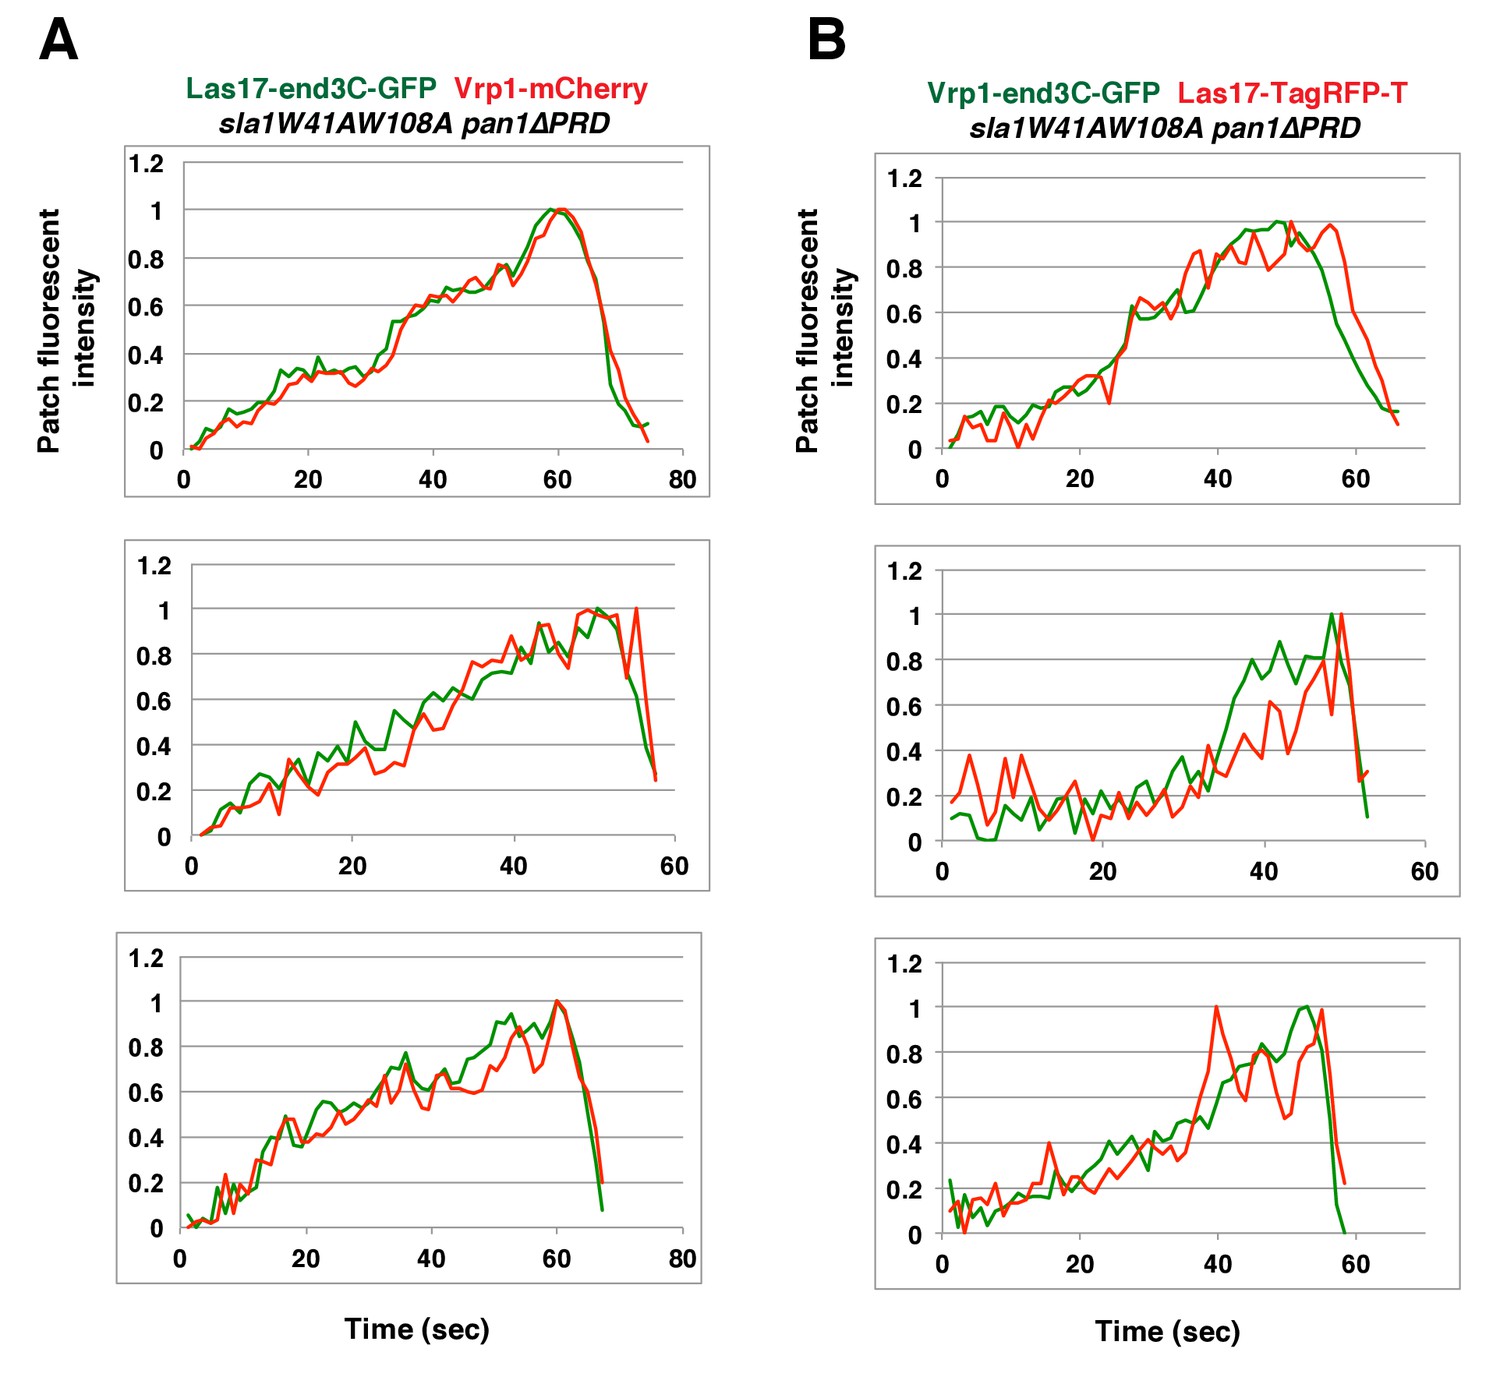
Two-color fluorescence intensity profiles for Las17-end3C-GFP and Vrp1-mCherry, or Vrp1-end3C-GFP and Las17-TagRFP-T in sla1W41AW108A pan1∆PRD mutant cells.
(A and B) Fluorescence intensity profiles of GFP- and mCherry- or TagRFP-T-tagged proteins over time at endocytic sites in the indicated yeast strains. The plots shown are representative of three independent endocytic events for each strain.
Figure 6—figure supplement 2
Alignment of averaged (mean ±SD) intensity measurements for GFP- and RFP-tagged proteins in the indicated yeast strains (note different time scales in A and B).
https://doi.org/10.7554/eLife.29140.025
Figure 7 with 1 supplement

The onset of actin assembly coincides with WIP recruitment to a threshold level in cells expressing Myo5-end3C-GFP.
(A) Circumferential kymograph presentations of GFP- and RFP- or TagRFP-T-tagged proteins in the indicated yeast strains. The MYO3 gene was knocked out in all strains. (B) Lifetimes of GFP- and RFP-tagged proteins in the indicated strains. (C) Time difference between the arrival of GFP- and RFP tagged proteins in the indicated strains. (D) Alignment of averaged intensity profiles of GFP- and mCherry or RFP-tagged proteins in the indicated yeast cells. For more details, please also see Figure 7—figure supplement 1. The scale bars in kymographs are 20 s.
Figure 7—figure supplement 1
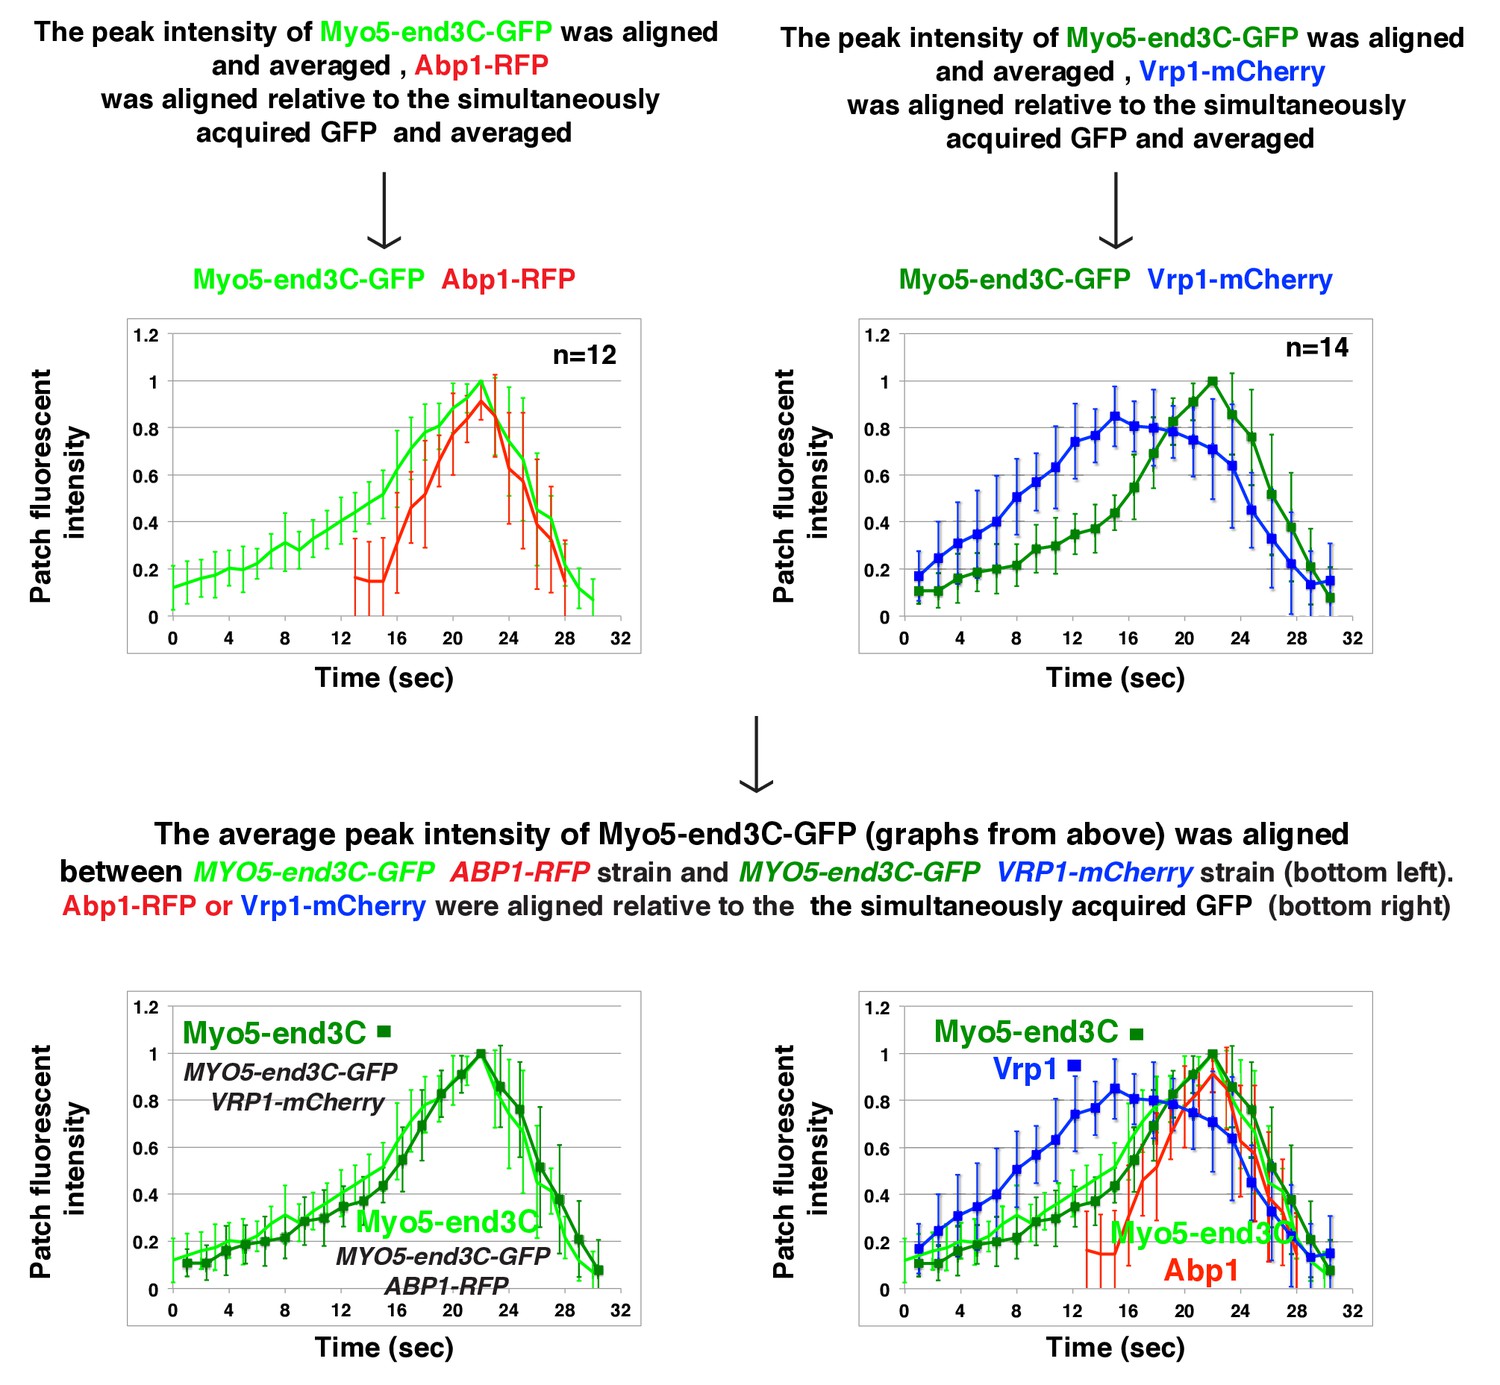
Alignment of averaged (mean ±SD) intensity measurements for GFP- and mCherry or RFP-tagged proteins from the indicated yeast strains.
https://doi.org/10.7554/eLife.29140.027
Figure 8

Switch-like activation of the Arp2/3 complex mediated by SH3 domain-PRM mediated interactions during yeast CME.
Models for roles of SH3 domain-PRM interactions in spatiotemporal regulation of actin assembly in wild-type cells (A), in sla1W41AW108A pan1∆PRD cells (B), in sla1W41AW108A pan1∆PRD LAS17-end3C-GFP or sla1W41AW108A pan1∆PRD VRP1-end3C-GFP cells (C). Blue represents PRD containing proteins. Yellow represents SH3 domain-containing proteins. The gray two-way arrows indicate SH3 domain-PRM interactions previously demonstrated by in vitro assays. The dotted line with a question mark indicates possible SH3 domain-PRM interactions. The purple arrows indicate non-SH3 domain-PRM interactions that have previously been identified. The green arrow indicates the interaction between end3C and pan1∆PRD. The grey half circle indicates that multiple proteins function as a complex. The switch symbol marks the onset of actin assembly. See Discussion for description.
Videos
Video 1
Dynamics of sla1W41AW108A-GFP and Las17-TagRFP-T in sla1W41AW108A-GFP LAS17-TagRFP-T pan1∆PRD cells.
Time to acquire one image pair is 1.8 s. Interval between frames is 1.8 s.
Video 2
Dynamics of Sac6-GFP in sla1W41AW108A pan1∆PRD cells captured by multifocus microscopy (MFM).
Time interval between frames is 250 ms.
Video 3
Dynamics of sla1W41AW108A-GFP and Abp1-RFP in sla1W41AW108A-GFP ABP1-RFP pan1∆PRD cells.
Time to acquire one image pair is 1.8 s. Interval between frames is 1.8 s.
Video 4
Dynamics of Las17-GFP or Bbc1-GFP and Abp1-RFP in sla1W41AW108A pan1∆PRD cells.
Time to acquire one image pair is 1.8 s. Interval between frames is 1.8 s.
Video 5
Dynamics of Vrp1-GFP or Myo5-GFP and Abp1-RFP in sla1W41AW108A pan1∆PRD cells.
Time to acquire one image pair is 1.8 s. Interval between frames is 1.8 s.
Video 6
, Dynamics of Las17-GFP and Abp1-RFP in wild type cells and dynamics of Las17-end3C-GFP and Abp1-RFP in sla1W41AW108A pan1∆PRD cells.
Time to acquire one image pair is 1.1 s. Interval between frames is 1.1 s.
Video 7
, Dynamics of Vrp1-GFP and Abp1-RFP in wild-type cells and dynamics of Vrp1-end3C-GFP and Abp1-RFP in sla1W41AW108A pan1∆PRD cells.
Time to acquire one image pair is 1.2 s. Interval between frames is 1.2 s.
Video 8
Dynamics of Myo5-GFP and Abp1-RFP in wild-type cells and dynamics of Myo5-end3C-GFP and Abp1-RFP in myo3∆ cells.
Time to acquire one image pair is 1.0 s. Interval between frames is 1.0 s.
Additional files
-
Supplementary file 1
Yeast strains used in this study.
- https://doi.org/10.7554/eLife.29140.030
Download links
A two-part list of links to download the article, or parts of the article, in various formats.
Downloads (link to download the article as PDF)
Open citations (links to open the citations from this article in various online reference manager services)
Cite this article (links to download the citations from this article in formats compatible with various reference manager tools)
Switch-like Arp2/3 activation upon WASP and WIP recruitment to an apparent threshold level by multivalent linker proteins in vivo
eLife 6:e29140.
https://doi.org/10.7554/eLife.29140


