miR-9 regulates basal ganglia-dependent developmental vocal learning and adult vocal performance in songbirds
- Louisiana State University School of Medicine, United States
- Hunter College, United States
Figures
Figure 1 with 2 supplements
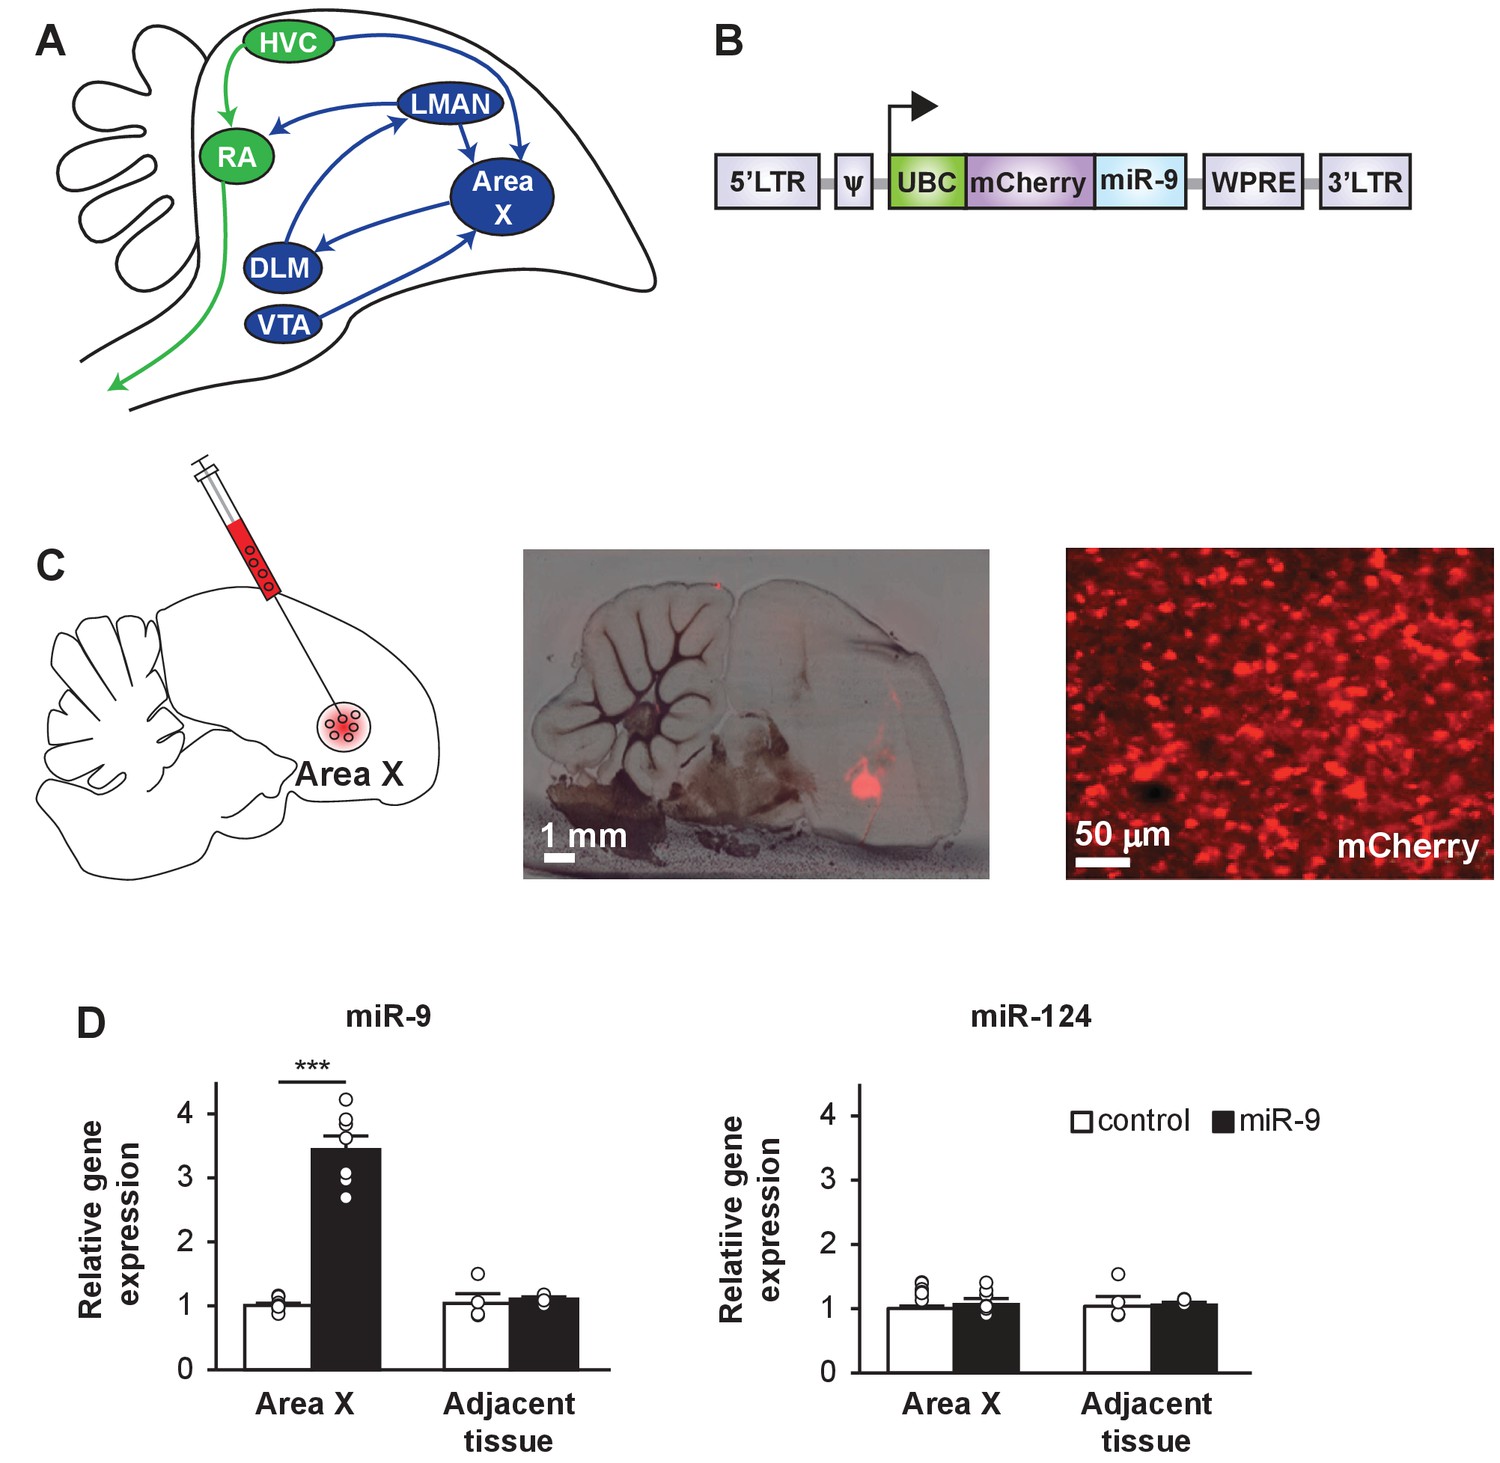
A lentiviral approach to manipulate miR-9 expression in Area X of the zebra finch brain.
(A) Schematic drawing of the song control circuit in the zebra finch brain. The motor pathway (green), which connects HVC (used as a proper name) to RA (robust nucleus of the arcopallium) and eventually the vocal organ, controls song production. The anterior forebrain pathway (blue), which connects HVC to the basal ganglia nucleus Area X, DLM (medial nucleus of the dorsolateral thalamus), LMAN (lateral magnocellular nucleus), and then back to RA, is required for song learning. Area X also receives dopaminergic inputs from the VTA (ventral tegmental area). (B) The lentiviral vector used in this study expresses an mCherry fluorescent marker and miR-9 driven by the human ubiquitin promoter. (C) (Left) A diagram showing viral injection into Area X. (Middle and right) Sagittal sections of the zebra finch brain showing mCherry fluorescent signal in juvenile Area X four weeks after lentivirus injection. (D) The expression of miR-9 and miR-124 in Area X 4 weeks after injection with the lenti-miR-9 virus. p < 0.0001, t(12) = 11.21 for miR-9; p = 0.2879, t(12) = 1.112 for miR-124, unpaired t-test. n = 7 for Area X; n = 4 for adjacent tissue. Data are presented as mean ± SEM.
Figure 1—figure supplement 1

A lentiviral approach to manipulate miR-9 expression.
(A) 293T cells infected with the lenti-control or the lenti-miR-9 virus. Note the virally expressed mCherry fluorescence. (B) Western blot analysis of FOXP1 and FOXP2 protein expression in 293T cells infected with the lenti-miR-9 or lenti-control virus. Lenti-control virus (4 µl infection) titer was 2.5 × 10⁹/ml, and lenti-miR-9 virus (4 µl and 8 µl infection) titer was 2 × 10⁹/ml. Infected cells were harvested 72 hr after virus addition. Western blot was performed using anti-FOXP1 and anti-FOXP2 antibodies. Actin was used as a loading control.
Figure 1—figure supplement 2
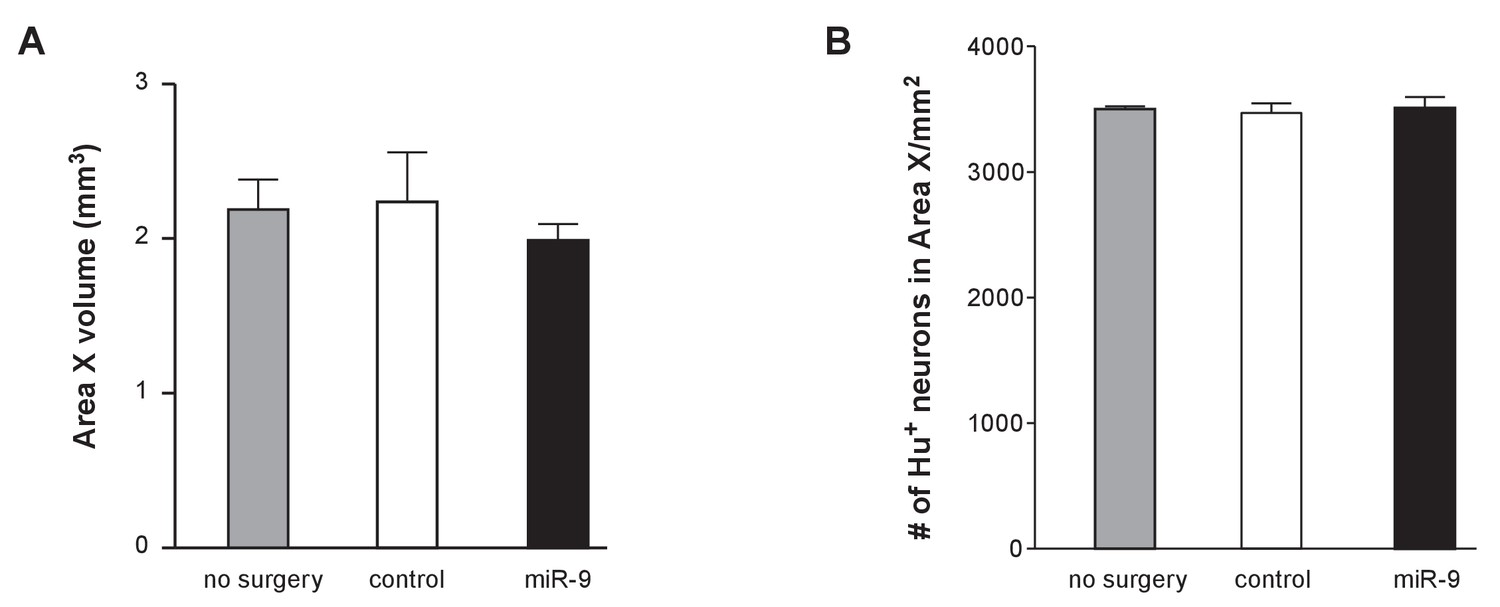
Impacts of viral injection on Area X volume and neuron number.
(A) Area X volumes in animals receiving no injection or receiving lenti-control virus injection or receiving lenti-miR-9 virus injection. p = 0.73, F(2,12) = 0.3255, one-way ANOVA; n = 3 for the non-injected group, and n = 5 for each injected group. (B) Effect of viral injection on the number of neurons in Area X. Juveniles received viral injection into Area X at about 30 days after hatching, and Hu staining was performed one month later. Hu-positive neurons in Area X were counted using Image J software. p = 0.89, F(2,9) = 0.12, one-way ANOVA; n = 4 for the non-injection group, and n = 3 for the injected groups. Error bars, SEM.
Figure 2
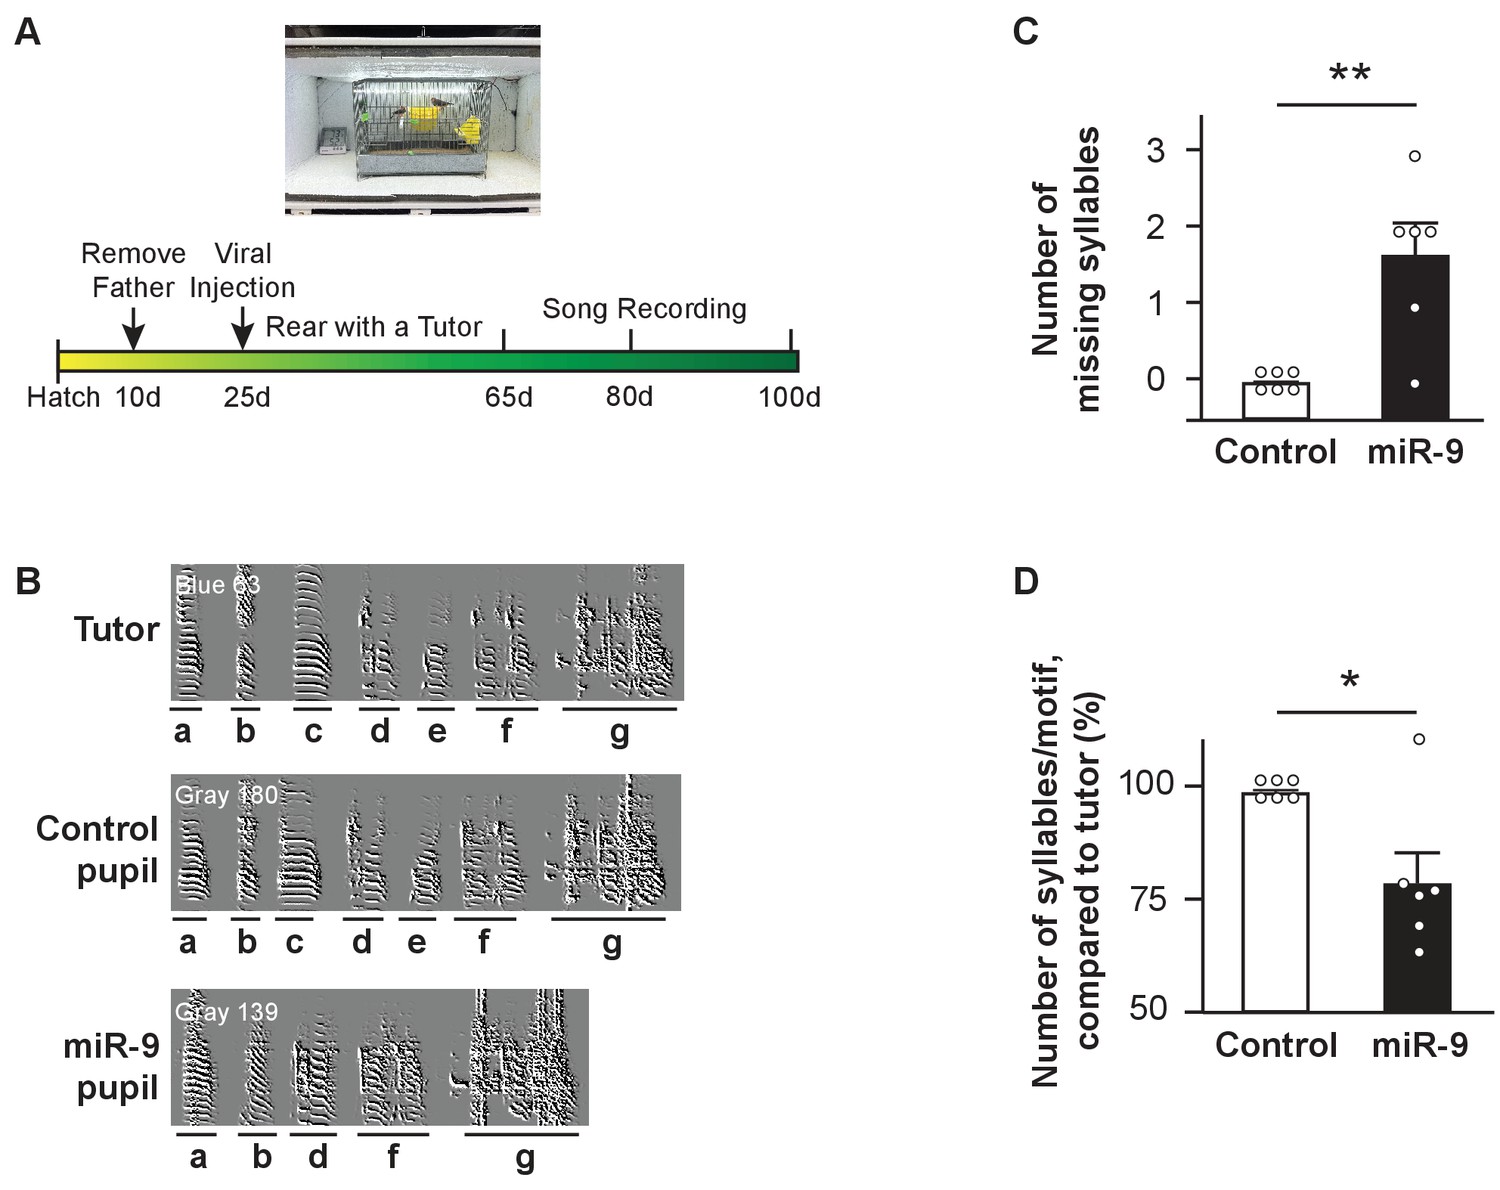
Syllable omission in pupils with miR-9 overexpression in juvenile Area X.
(A) Experimental timeline for viral injection, song learning, and song recording. (B) Representative sonograms of a tutor, a control pupil, and an miR-9 pupil. Syllables are labeled alphabetically, and indicated with underlining below the sonograms. Note that the two pupils shared the same tutor, and syllables c and e were omitted from the miR-9 pupil’s song. (C) Numbers of missing syllables in control and miR-9 pupils. p = 0.0075, U = 3, one-tailed Mann-Whitney U test; n = 6. (D) Numbers of syllables per motif in pupils’ songs compared to their tutors’ songs. p = 0.0325, U = 6, one-tailed Mann-Whitney U test; n = 6. Data are presented as mean ± SEM.
-
Figure 2—source data 1
- https://doi.org/10.7554/eLife.29087.007
Figure 3 with 1 supplement

miR-9 overexpression in juvenile Area X impairs song learning.
(A) Motif similarity scores of uninjected pupils, pupils injected with control virus, and pupils injected with miR-9 virus. p = 0.002, U = 0, two-tailed Mann-Whitney U Test; n = 6 for control and miR-9 pupils; n = 4 for uninjected pupils. (B) Syllable accuracy scores of control and miR-9 pupils. p = 0.002, U = 0, two-tailed Mann-Whitney U Test; n = 6. (C) Exemplar sonograms showing the fine structure of syllables of a tutor, a control pupil, and a miR-9 pupil. (D) Differences between syllable acoustic features of pupils’ songs and tutors’ songs. p = 0.01, U = 2 for mean frequency; p = 0.006, U = 1 for Wiener entropy, two-tailed Mann-Whitney U Test; n = 6. Data in (A), (B) and (D) are presented as mean ± SEM. (E) Syllable Wiener entropy of the control and miR-9 pupils compared to that of their tutors. p = 0.432, t(41) = 0.794 for control pupils; p < 0.001, t(24) = 8.245 for miR-9 pupils, paired t-test; control pupils: n = 42 syllables, 6 animals; miR-9 pupils: n = 25 syllables, 6 animals. Open circles represent pupils’ syllables and filled circles represent tutors’ syllables.
-
Figure 3—source data 1
- https://doi.org/10.7554/eLife.29087.010
Figure 3—figure supplement 1
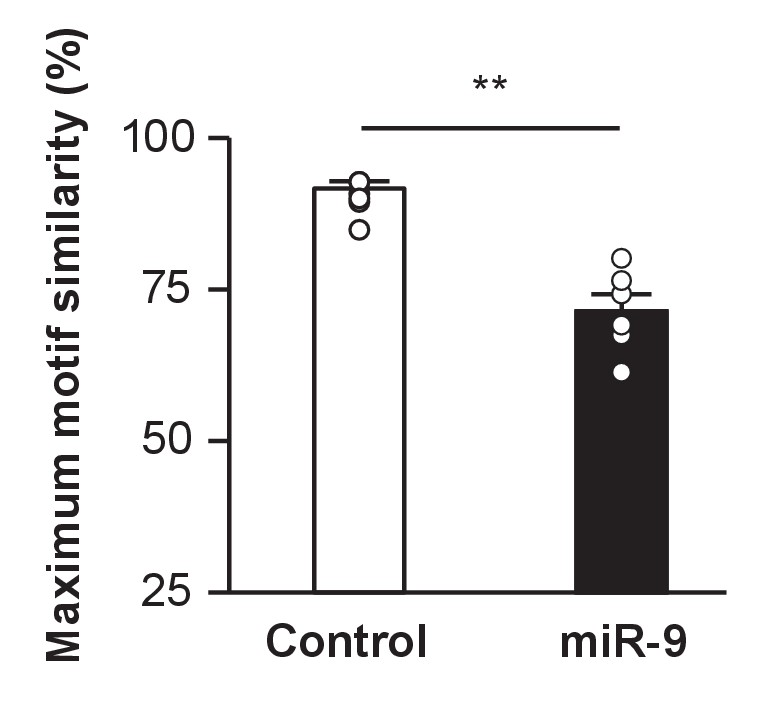
Maximum motif similarity of control and miR-9 pupils at 100 d.
For each pupil, 20 pupil motif renditions were compared to 10 tutor motif renditions. Then, the 10 highest values among the 200 pairwise measurements were averaged for each pupil. p = 0.002, U = 2, two-tailed Mann-Whitney U Test; n = 6.
Figure 4
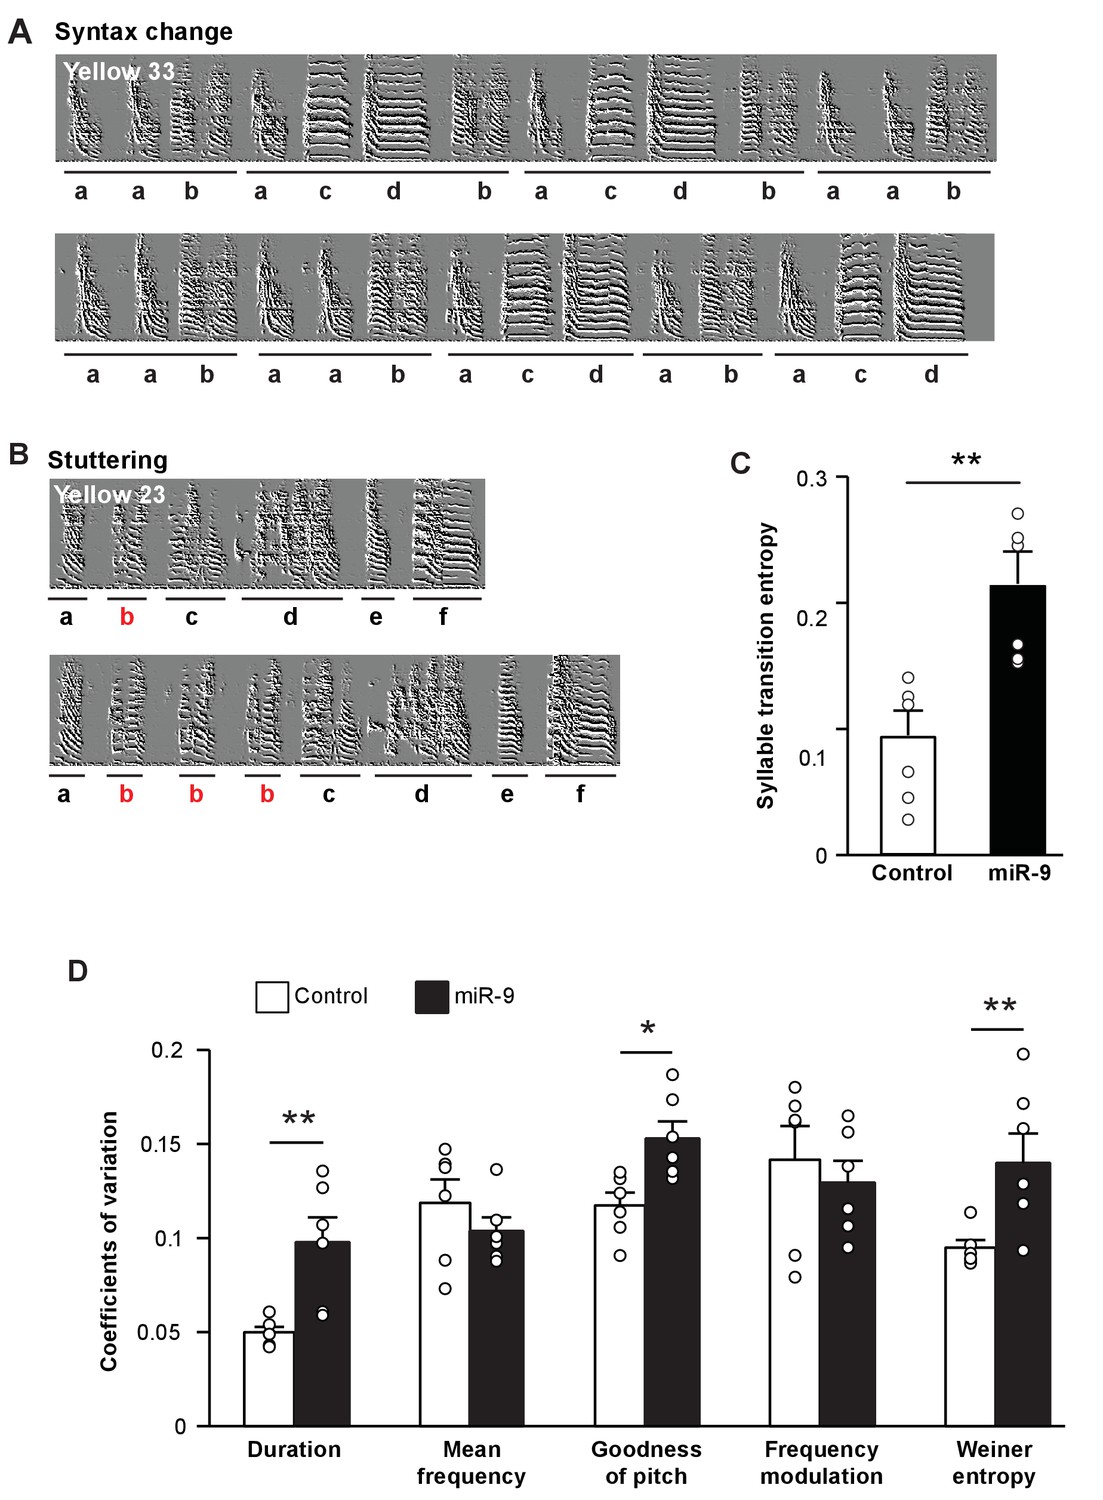
Overexpression of miR-9 in juvenile Area X impairs song performance in adulthood.
(A) Representative sonograms of miR-9 pupil Yellow 33 showing an example of variation in syllable order. (B) Representative sonograms of miR-9 pupil Yellow 23 showing an example of syllable repetition. (C) Syllable transition entropy of adult control and miR-9 pupils who received viral injection as juveniles. p = 0.002, U = 0, two-tailed Mann-Whitney U test; n = 6. (D) Variations in syllable acoustic features of adult songs of control and miR-9 pupils. p = 0.009, U = 2 for duration; p = 0.015, U = 3 for goodness of pitch; and p = 0.009, U = 2 for Wiener entropy, two-tailed Mann-Whitney U test; n = 6. Data are presented as mean ± SEM.
-
Figure 4—source data 1
- https://doi.org/10.7554/eLife.29087.012
Figure 5
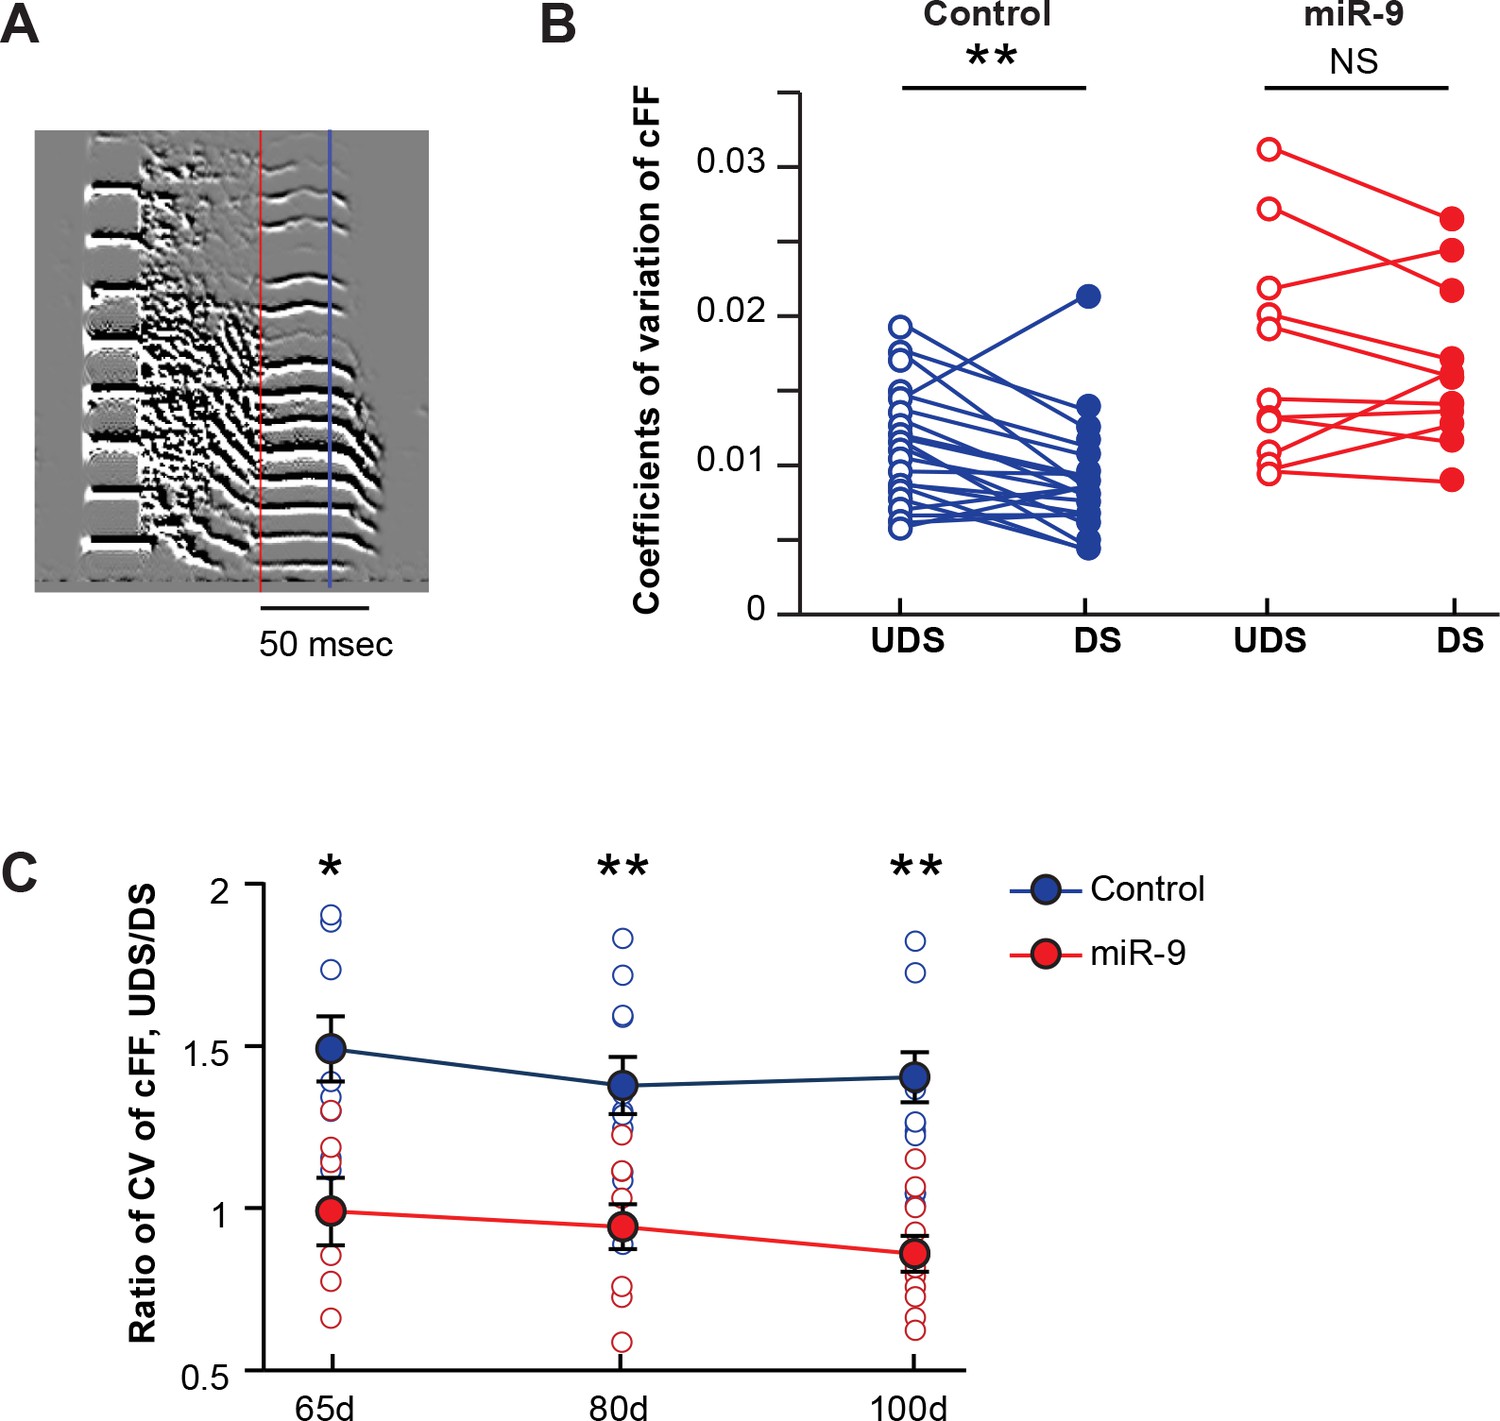
Overexpression of miR-9 in juvenile Area X abolishes social-context-dependent modulation of vocal performance.
(A) An example syllable of a directed song. The lowest constant fundamental frequency (cFF) of a syllable segment between the red and the blue lines was measured with SAP. (B) Variations in cFF of UDS and DS of control and miR-9 pupils. Each pair of empty and filled circles connected by a line represents variations in cFF values measured for a syllable in the UDS and DS of an individual pupil. For control pupils, p = 0.006, t(20) = 3.062 (21 syllables, 6 birds); for miR-9 pupils, p = 0.510, t(10) = 0.684 (11 syllables, 6 birds), paired t-test. (C) Ratio of coefficients of variation of cFF of UDS/DS of control and miR-9 pupils during development. Plot compares (cFF variation of UDS)/(cFF variation of DS) between control and miR-9 pupils. Significance of the differences between control and miR-9 pupils: at 65 d, p = 0.0127, U = 5 (control pupils: n = 8 syllables, 3 birds; miR-9 pupils: n = 6 syllables, 4 birds); at 80 d, p = 0.0016, U = 10 (control pupils: n = 11 syllables, 5 birds; miR-9 pupils: n = 9 syllables, 5 birds); and at 100 d, p = 0.001, U = 10 (control pupils: n = 14 syllables, 6 animals; miR-9 pupils: n = 10 syllables, 6 animals), two-tailed Mann-Whitney U test. Data are presented as mean ± SEM.
-
Figure 5—source data 1
- https://doi.org/10.7554/eLife.29087.014
Figure 6 with 1 supplement
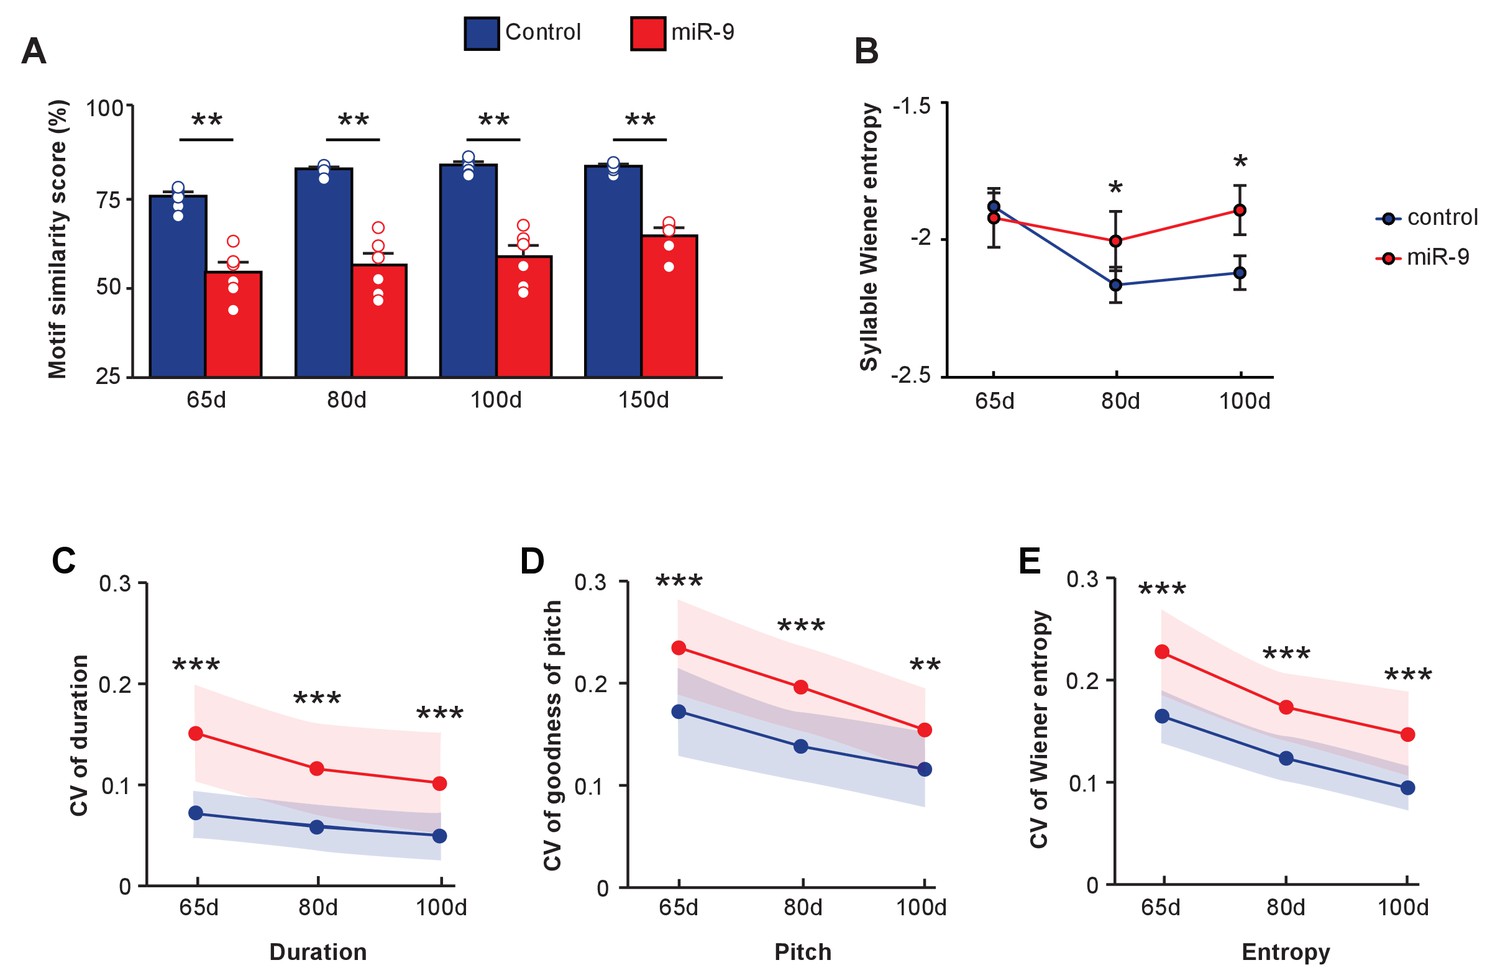
Developmental trajectory of vocal learning in virus-injected pupils.
(A) Motif similarity scores of the control and miR-9 pupils during developmental learning. p = 0.002, U = 0 at 65 d, 80 d, and 100 d, and p = 0.008, U = 0 at 150 d, two-tailed Mann-Whitney U test; n = 6 for all groups. For song improvement from 65 d to 150 d: p < 0.001 for control pupils, and p = 0.137 for miR-9 pupils, one-way ANOVA; n = 6 for all groups. (B) Syllable Wiener entropy of control and miR-9 pupils during developmental learning. p = 0.482, U = 500 at 65 d; p = 0.028, U = 428 at 80 d; p = 0.020, U = 417 at 100 d, one-tailed Mann-Whitney U test. For Wiener entropy reduction: p = 0.002 for control pupils, p = 0.709 for miR-9 pupils, one-way ANOVA; n = 6 for all groups. (C–E) Variation in syllable performance with respect to duration (C), goodness of pitch (D), and Wiener entropy (E) during developmental song learning in control and miR-9 pupils. The dots represent mean coefficient of variation values for each acoustic feature at each age; shaded areas represent the range of standard deviations. For comparisons between the control and miR-9 pupils: p < 0.0001 for all acoustic features at all ages except p < 0.01 for pitch at 100 d, two-tailed Mann-Whitney U test. For variability reduction: p < 0.001 for duration, goodness of pitch, and Wiener entropy for both control and miR-9 pupils, one-way ANOVA. In (B–E), control pupils: n = 42 syllables, 6 animals; miR-9 pupils: n = 25 syllables, 6 animals at each age. Data are presented as mean ± SEM.
Figure 6—figure supplement 1
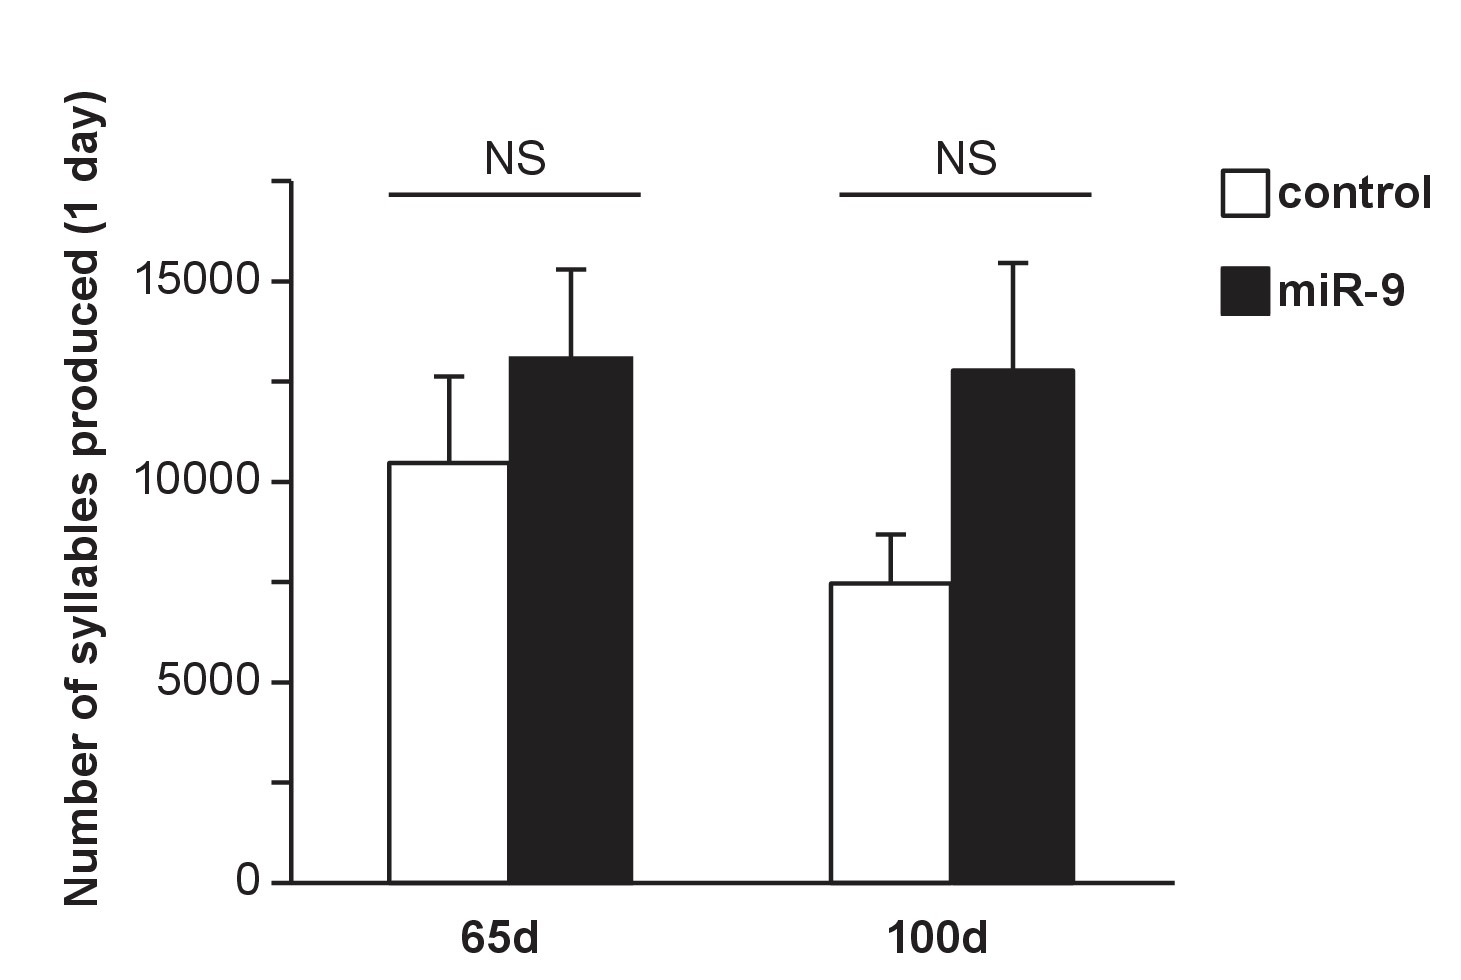
Amount of song production by control and miR-9 pupils at 65 d and 100 d.
The number of syllables produced from 8:00 a.m. to 12:00 p.m. during one day are plotted. p = 0.485, U = 13 for the 65 d groups; p = 0.132, U = 8.00 for the 100 d groups, two-tailed Mann-Whitney U test; n = 6 for all groups. Data are presented as mean ± SEM.
Figure 7 with 1 supplement
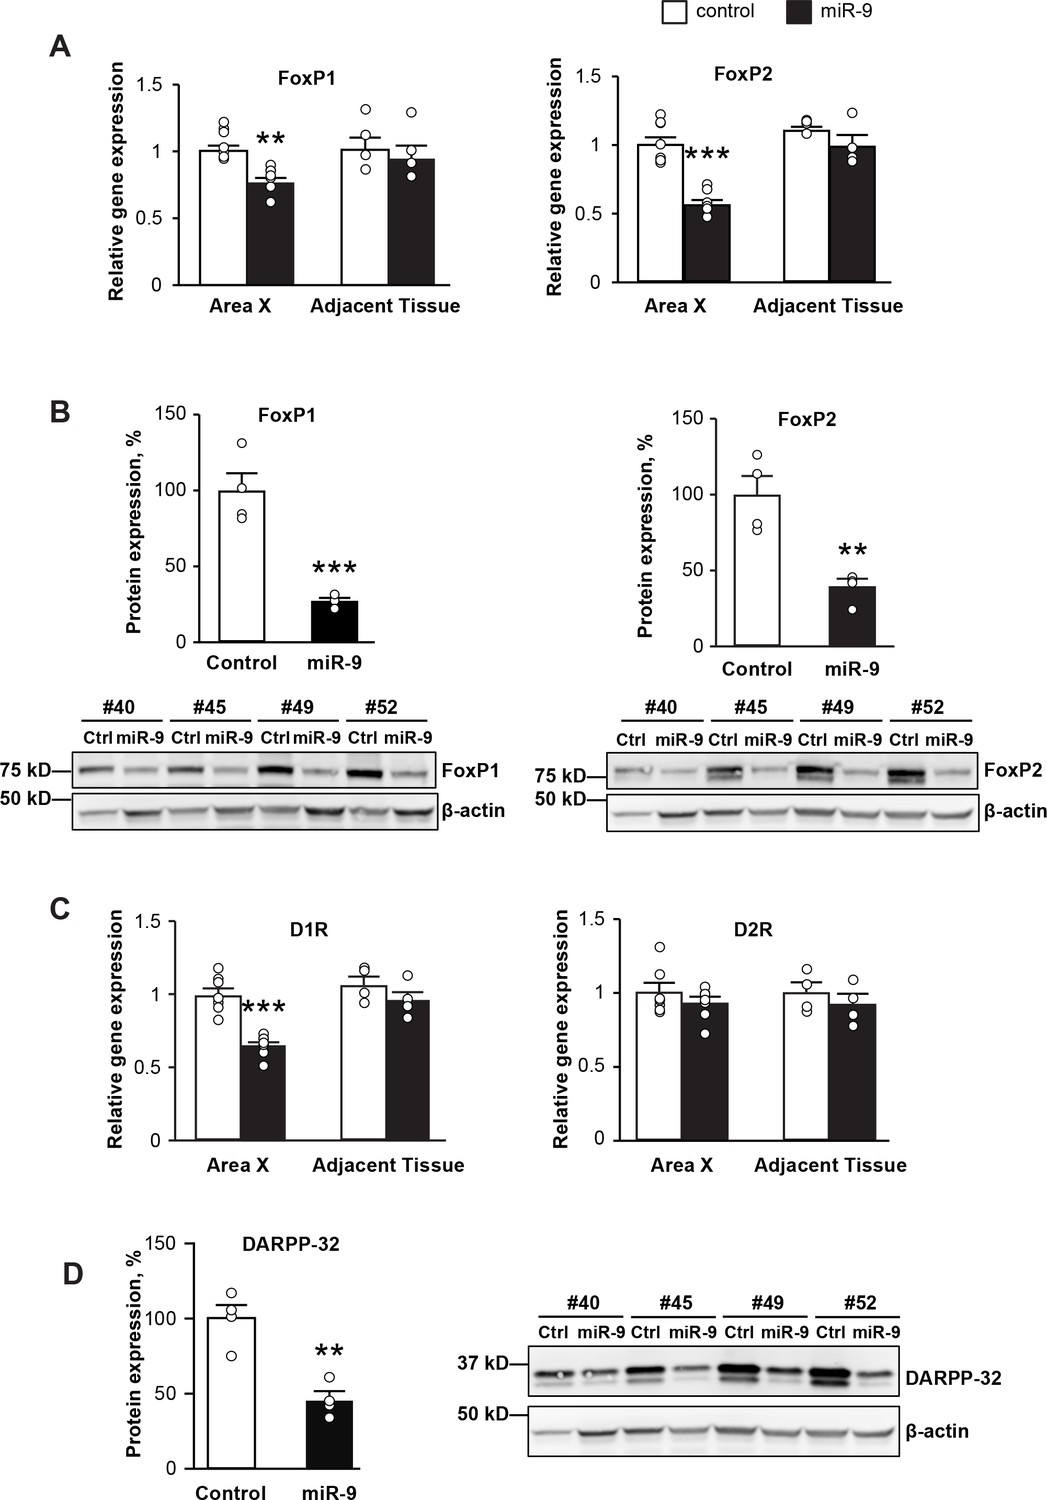
miR-9 overexpression in Area X downregulates the expression of FoxP1 and FoxP2 and disrupts dopamine signaling.
(A) Expression of FoxP1 and FoxP2 mRNAs in Area X measured 4 weeks after injection with the lenti-miR-9 virus by qRT-PCR. p = 0.006, t(12) = 4.608 for FoxP1; p < 0.0001, t(12) = 7.062 for FoxP2, unpaired t-test. n = 7 for Area X; n = 4 for adjacent tissue. (B) Western blot showing expression of FoxP1 and FoxP2 proteins in Area X 4 weeks after injection with the lenti-miR-9 virus. p = 0.0007, t(6) = 6.313 for FoxP1; p = 0.0037, t(6) = 4.608 for FoxP2, unpaired t-test; n = 4. (C) Expression of dopamine receptors D1R and D2R mRNAs in Area X 4 weeks after injection with the lenti-miR-9 virus measured by qRT-PCR. For D1R, p < 0.0001, t(12) = 6.441; for D2R, p = 0.3384, t(12) = 0.9971, unpaired t-test; n = 7 for Area X. (D) DARPP-32 protein expression in Area X 4 weeks after injection with lenti-miR-9 virus. p = 0.0022, t(6) = 5.104, unpaired t-test; n = 4. Data are presented as mean ± SEM. Lenti-control and lenti-miR-9 viruses were injected into Area X of contralateral hemispheres, #40, #45, #49 and #52 in western blot images are IDs of animals.
Figure 7—figure supplement 1
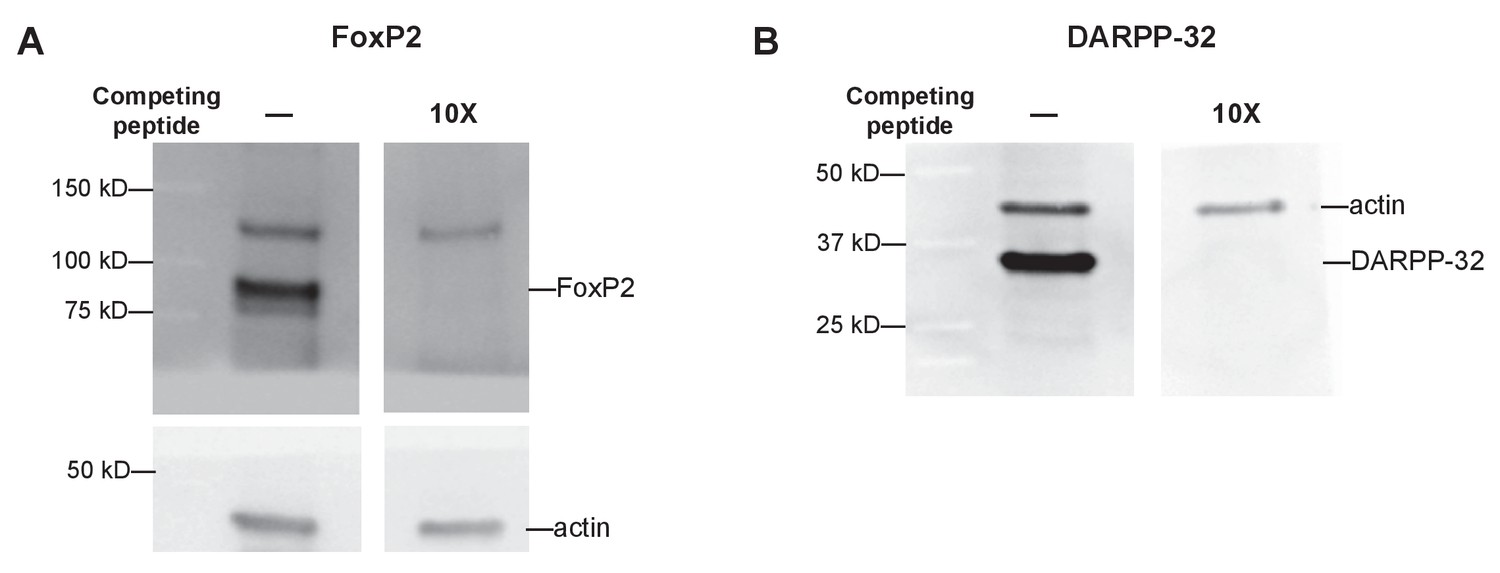
Western blots showing specificity of detection of FoxP2 and DARPP-32 proteins in Area X tissue indicated by inhibition of detection of(A) FoxP2 and (B) DARPP-32 after primary antibodies were pre-incubated with 10-fold molar excess of competing peptides.
https://doi.org/10.7554/eLife.29087.018
Figure 8 with 1 supplement
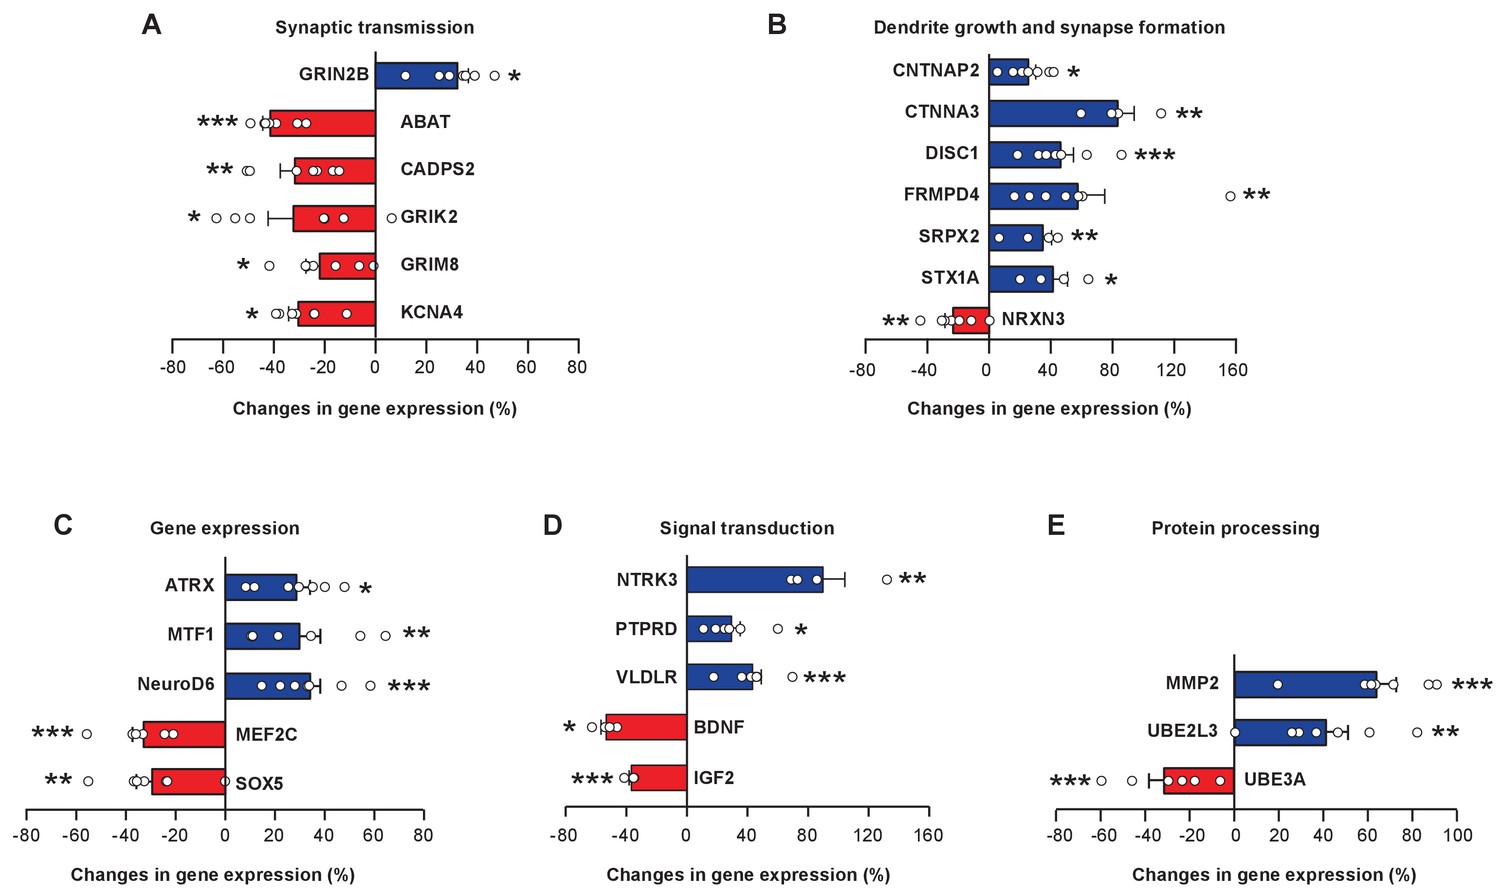
miR-9 overexpression alters expression levels of numerous FoxP1 and FoxP2 downstream target genes in Area X.
Blue bars, upregulated genes; red bars, downregulated genes. Genes are grouped into five functional groups: (A) neurotransmitter receptors and channels; (B) proteins involved in dendritic growth and synapse formation; (C) transcription factors; (D) signaling molecules; and (E) proteins for protein processing and degradation. Reverse transcription and qRT-PCR were performed twice, and qRT-PCR was performed in triplicate. *p < 0.05, **p < 0.01, ***p < 0.001, unpaired t-test; n = 7 for all genes, except for BDNF, CTNNA3, NRTK, and STX1A, n = 4. Data are presented as mean ± SEM.
Figure 8—figure supplement 1
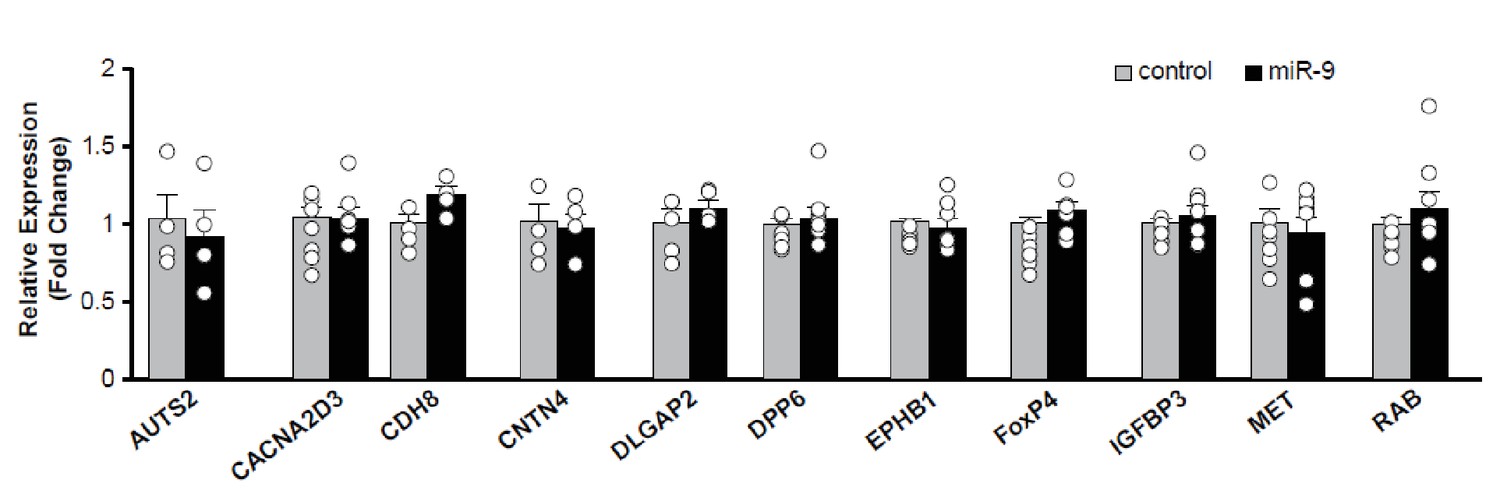
Downstream target genes of FoxP1 and FoxP2 that were unaffected by miR-9 overexpression in Area X.
Reverse transcription and qRT-PCR were performed twice, and qRT-PCR was performed in triplicate. All p values > 0.05, unpaired t-test. n = 7 for all genes except for AUTS2, CDH8, CNTN4, DLGAP2, n = 4. Data are presented as mean ± SEM.
Additional files
-
Supplementary file 1
Symbols, names, and functional descriptions of genes shown in Figure 8.
Functional descriptions are based on NCBI (National Center for Biotechnology Information) database. For associations between genes and neural developmental and mental disorders, see the online database SFARI Genes (Simons Foundation Autism Research Initiative) and references therein. For genes not included in the SFARI Gene list (e.g., KCNA4 and SRPX2), see references cited in the main text.
- https://doi.org/10.7554/eLife.29087.021
-
Supplementary file 2
Sequences of primers used in all qRT-PCR experiments.
- https://doi.org/10.7554/eLife.29087.022
-
Audio file 1
A song file of tutor Blue 63 (the tutor for Gray 180 and Gray 139).
- https://doi.org/10.7554/eLife.29087.023
-
Audio file 2
A song file of control pupil Gray 180.
- https://doi.org/10.7554/eLife.29087.024
-
Audio file 3
A song file of miR-9 pupil Gray 139.
- https://doi.org/10.7554/eLife.29087.025
-
Audio file 4
A song file of tutor Black 45 (the tutor for Yellow 30).
- https://doi.org/10.7554/eLife.29087.026
-
Audio file 5
A song file of miR-9 pupil Yellow 30.
- https://doi.org/10.7554/eLife.29087.027
-
Transparent reporting form
- https://doi.org/10.7554/eLife.29087.028
Download links
A two-part list of links to download the article, or parts of the article, in various formats.
Downloads (link to download the article as PDF)
Open citations (links to open the citations from this article in various online reference manager services)
Cite this article (links to download the citations from this article in formats compatible with various reference manager tools)
miR-9 regulates basal ganglia-dependent developmental vocal learning and adult vocal performance in songbirds
eLife 7:e29087.
https://doi.org/10.7554/eLife.29087


