Centriole triplet microtubules are required for stable centriole formation and inheritance in human cells
- Stanford University, United States
- Center for Cancer Research, United States
- National Cancer Institute, National Institutes of Health, United States
- Stanford School of Medicine, United States
Figures
Figure 1 with 1 supplement
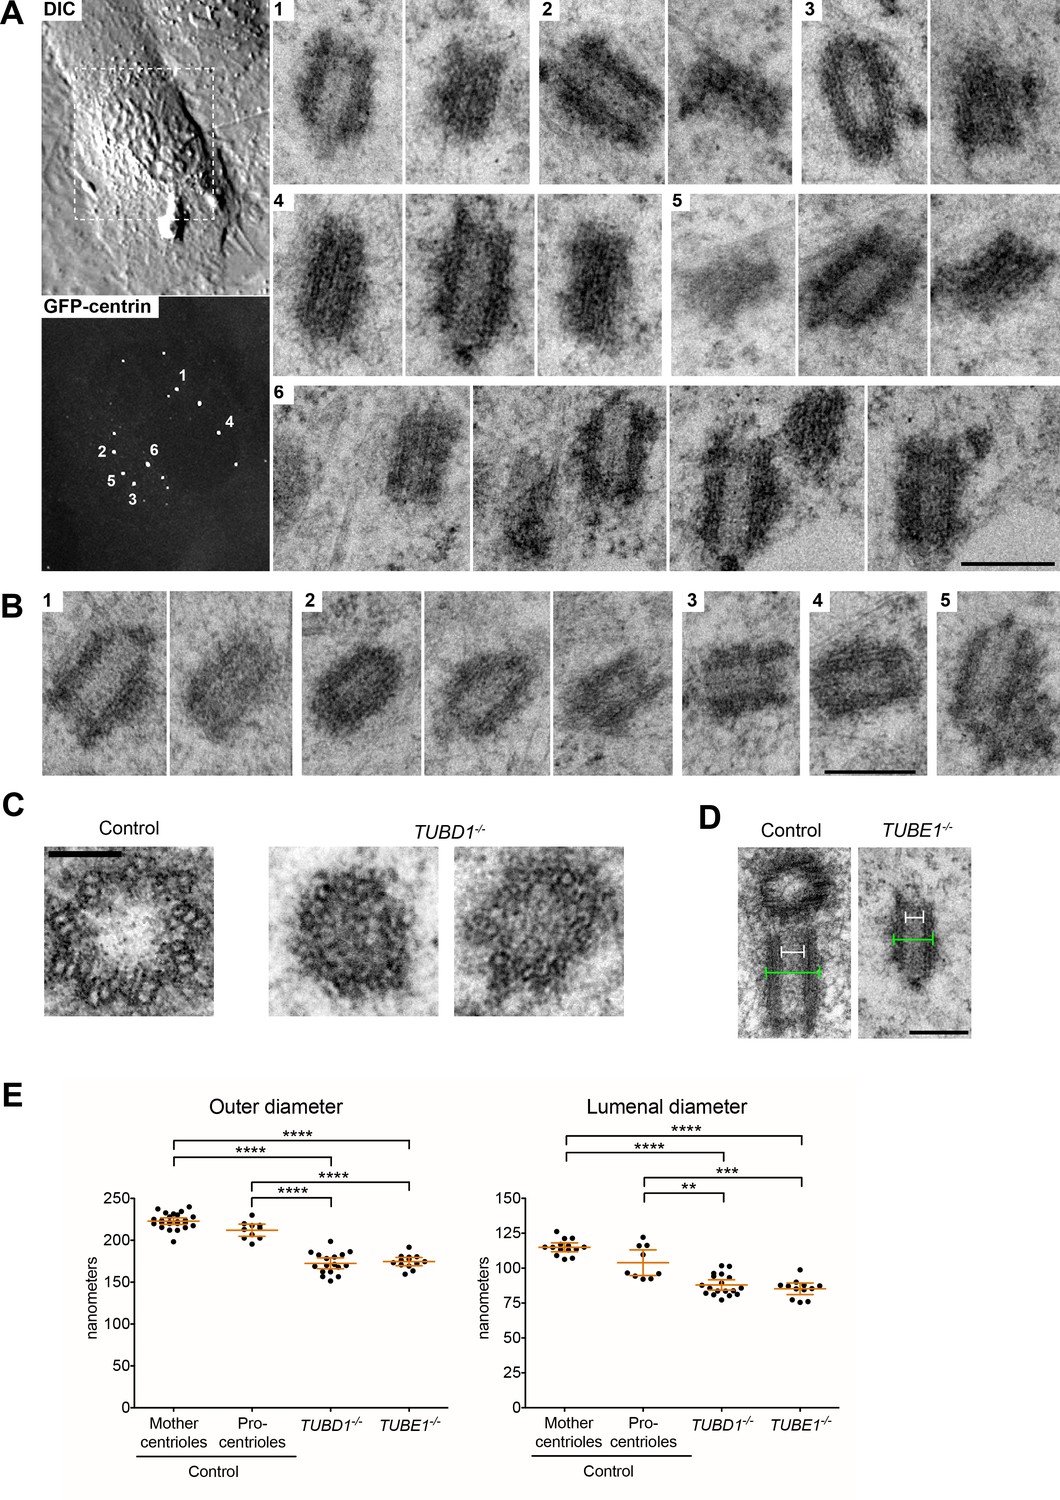
Centrioles in TUBD1−/− and TUBE1−/− cells lack triplet microtubules.
(A) Centrioles from TUBE1−/− cells. Left: DIC image and maximum intensity projection of TUBE1−/− GFP-centrin cells. Numbered GFP-centrin foci were then analyzed by correlative electron microscopy. Right: Numbered centrioles with serial sections adjacent to each other. Scale bar: 250 nm. (B) Centrioles from TUBD1−/− cells. Five centrioles are shown, and serial sections are adjacent to each other. Scale bar: 250 nm. (C) Centriole cross-sections from control and TUBD1−/− cells. Scale bar: 100 nm. (D) Longitudinal sections from control and TUBD1−/− cells. Measurements for centriole outer diameter and inner diameter are shown. Scale bar: 250 nm. (E) Quantification of centriole diameters in control TP53−/− mother and procentrioles, as well as centrioles from TUBD1−/− and TUBE1−/− cells. Mean and SEM are indicated. Statistical significance was determined using the Mann-Whitney U test. ****p-value ≤ 0.0001, ***p-value ≤ 0.001, **p-value ≤ 0.01. Original data can be found in Figure 1—source data 1.
-
Figure 1—source data 1
Centriole diameter measurements.
Related to Figure 1E. Centriole outer diameters and centriole lumenal diameters were measured from EM images. Numbers are in nm. Control cells are RPE-1 TP53−/− and both mother centrioles and procentrioles were quantitated.
- https://doi.org/10.7554/eLife.29061.005
Figure 1—figure supplement 1
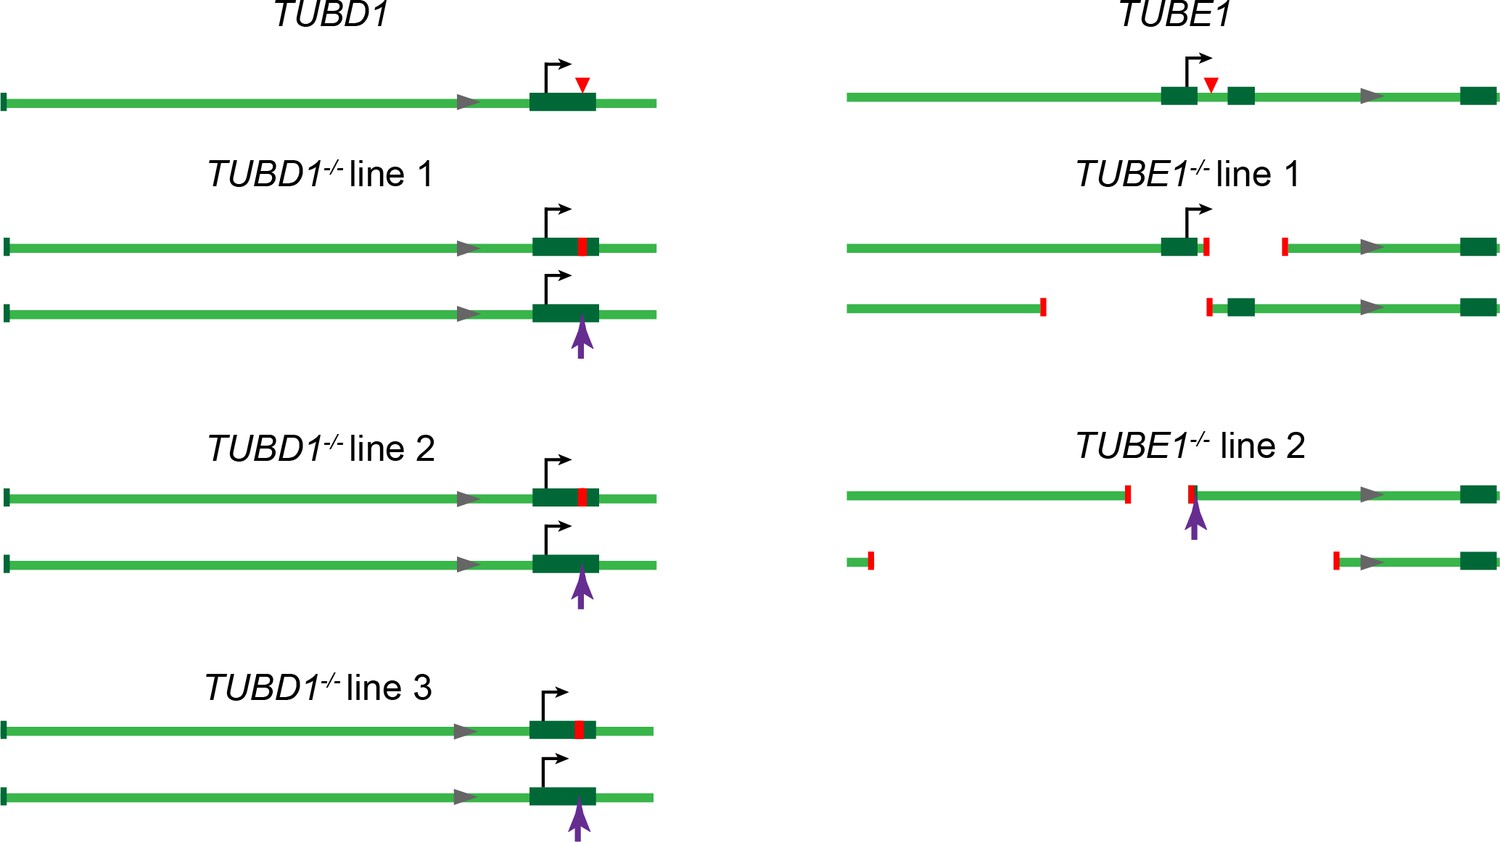
Gene loci for TUBD1−/− and TUBE1−/− cells.
Gene loci for TUBD1 (ch17:59889203–59891260) and TUBE1 (ch6: 11207685–11209742) in control and TUBD1−/− and TUBE1−/− cells (GRCh38.p7 Primary Assembly). Dark green boxes: exons, Black arrows: translation start site, Red triangle: Cas9 cut site. In mutants: Red lines: positions of deletions, Purple arrows: positions of insertions. TUBD1−/− and TUBE1−/− mutant cells are all compound heterozygotes for which the next ATG is not in-frame. TUBD1−/− line 1 contains a 8 nt deletion (ch17: 59891019–59891026) on one allele, resulting in a frameshift and premature stop after 49 amino acids, and an insertion at nt 59891024 on the other, resulting in a frameshift and premature stop after 39 amino acids. TUBD1−/− line 2 contains a 4 nt deletion (ch17: 59891023–59891026) on one allele, resulting in a frameshift and premature stop after 117 amino acids, and an insertion at nt 59891024 on the other, resulting in a frameshift and premature stop after 39 amino acids. TUBD1−/− line 3 contains a 17 nt deletion (ch17:59891015–59891031) on one allele, resulting in a frameshift and premature stop after 46 amino acids, and an insertion at nt 59891024 on the other, resulting in a frameshift and premature stop after 39 amino acids. TUBE1−/− line 1 contains a 266 nt deletion (ch6:112087525–112087790) on one allele, removing exon 2 and resulting in a frameshift and premature stop after 8 amino acids, and a 545 nt deletion (ch6:112086987–112087531) on the other allele, removing the first exon and the ATG. TUBE1−/− line 2 contains a 1049 nt deletion (ch6:112086549–112087598) on one allele, removing exon 1 and the ATG, and a 329 nt deletion (ch6:112087153–112087482) and 4 nt insertion (CCGA) on the other allele, removing the first exon and the ATG.
Figure 2
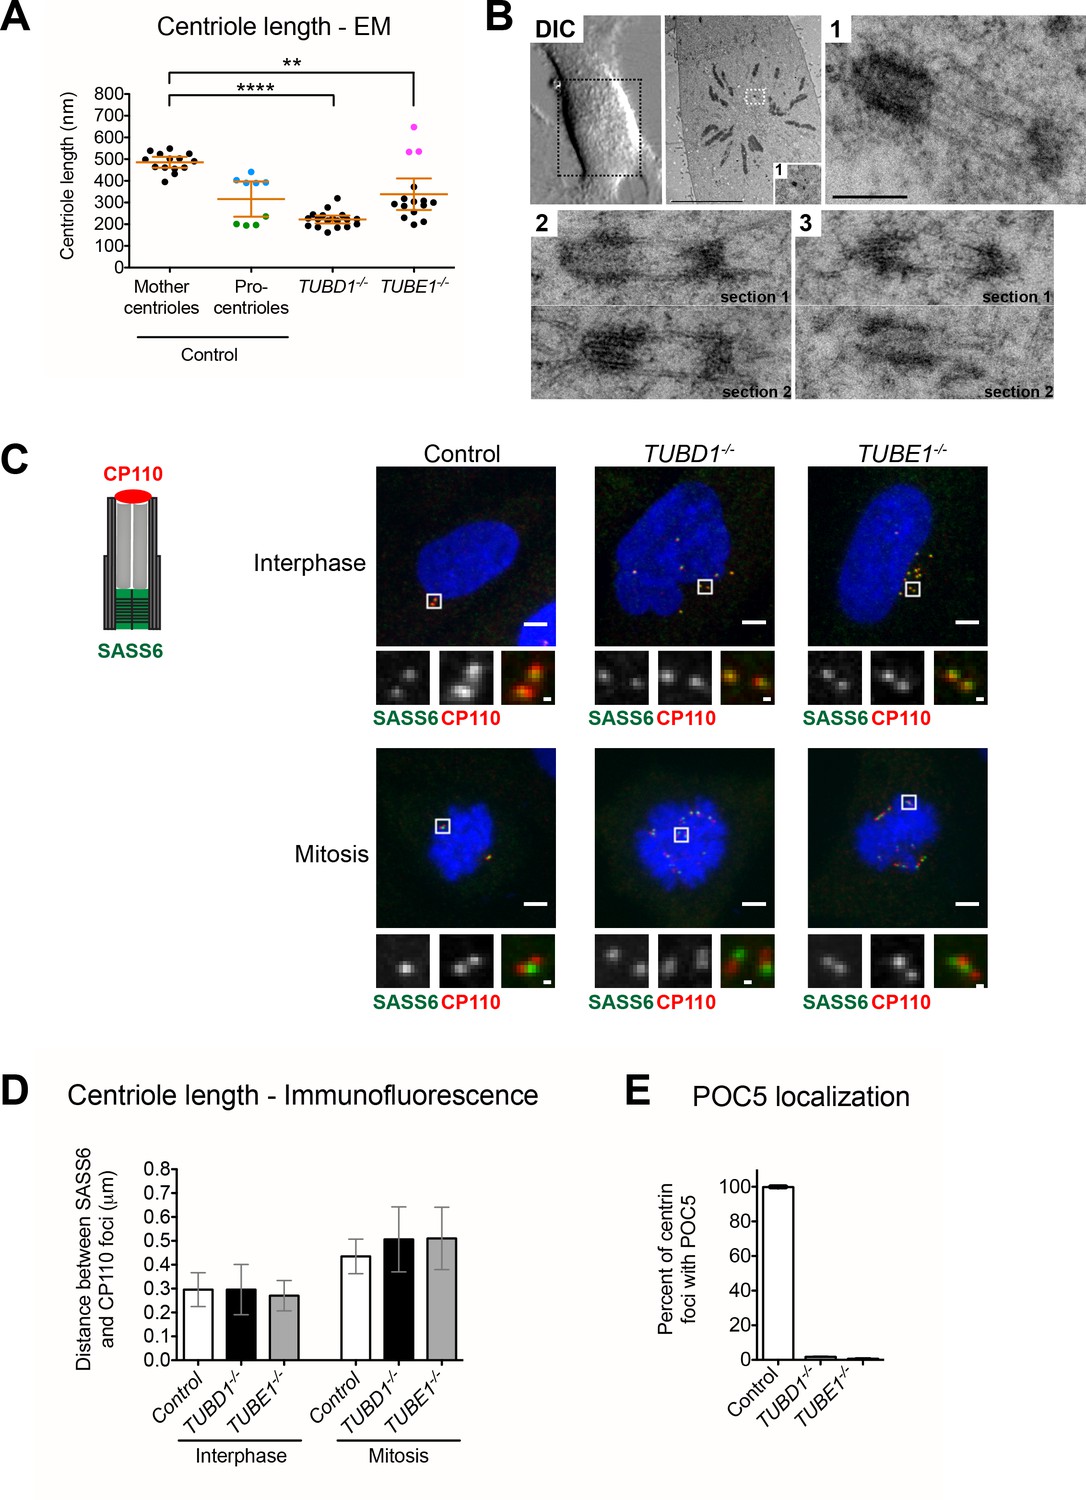
Centrioles in TUBD1−/− and TUBE1−/− cells elongate but fail to recruit POC5.
(A) Quantification of centriole length measured from EM. Mean and SEM are indicated. Blue dots represent control procentrioles in G2/M, and green dots represent control procentrioles in S-phase. Purple dots represent the total length of elongated mitotic TUBE1−/− centrioles. Statistical significance was determined using the Mann-Whitney U test. ****p-value ≤ 0.0001, **p-value ≤ 0.01. TUBD1−/− and TUBE1−/− centrioles were not significantly different from control procentrioles. Original data can be found in Figure 2—source data 1. (B) Correlative light-electron micrographs of centrioles in a single prometaphase TUBE1−/− cell. Top left: DIC image. Boxed centriole in EM overview corresponds to centriole 1. For centrioles 2 and 3, two serial sections are shown. For each centriole, the longer density referred to in the text is located on the left. Scale bars: overview, 10 µm; inset: 250 nm. (C) CP110 and SASS6 separation distance in interphase and mitotic cells. Left: schematic of CP110 and SASS6 separation. Right: Maximum projections of 250 nm confocal stacks. Control cells are RPE-1 TP53−/−. Scale bars: overview, 5 µm, inset: 500 nm. (D) Quantification of CP110 and SASS6 separation distance. Control cells are RPE-1 TP53−/−. 100 centrioles were measured for each condition. Error bars represent the standard deviation. For each cell type, mitotic measurements are significantly different from interphase measurements (two-tailed unpaired t-test, p<0.0001). (E) Quantification of the number of centrioles with POC5 localization in mitotic cells. Control cells are RPE-1 TP53−/−. Bars represent the mean of three independent experiments with 200 centrioles each, error bars represent the SEM.
-
Figure 2—source data 1
Centriole length measurements.
Related to Figure 2A. Centriole length was measured from EM images. Numbers are in nm. Highlights: blue: G2/M procentrioles, green: S-phase procentrioles, purple: mitotic TUBE1−/− centrioles. Control cells are RPE-1 TP53−/− and both mother centrioles and procentrioles were quantitated.
- https://doi.org/10.7554/eLife.29061.007
Figure 3 with 1 supplement
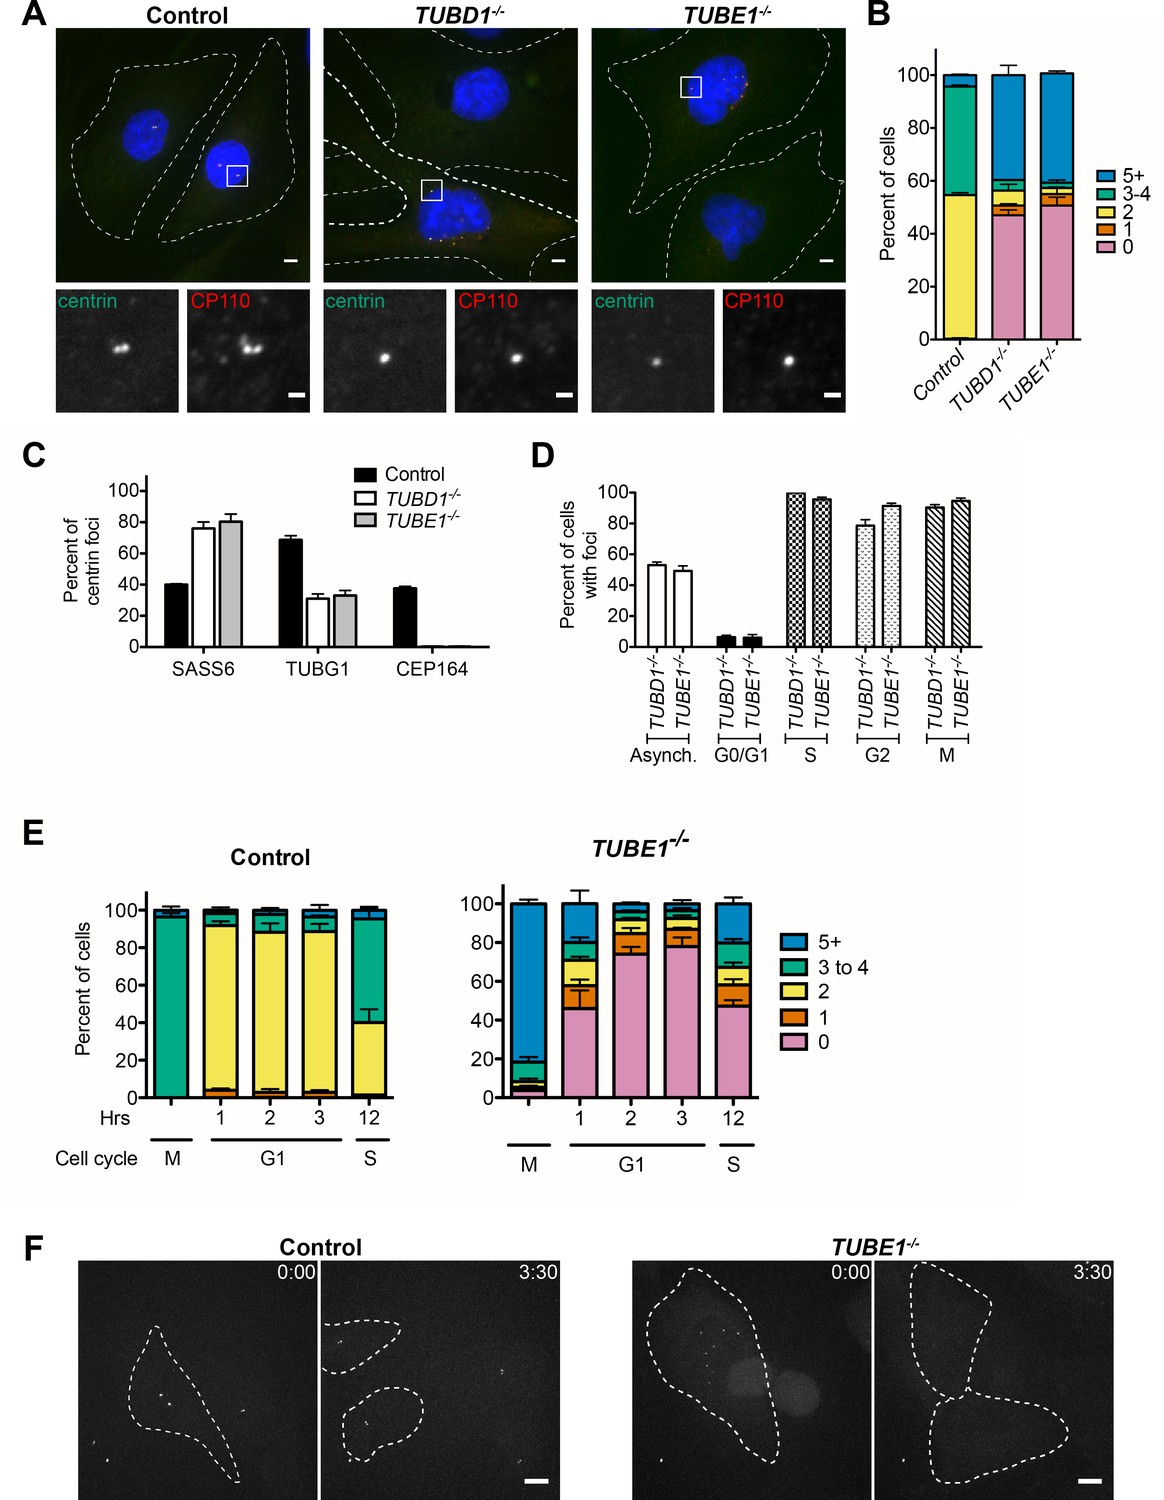
TUBD1−/− and TUBE1−/− cells undergo a futile centriole formation/disintegration cycle.
(A) Centriole phenotype for TUBD1−/− and TUBE1−/− cells. Two cells for each mutant are shown: one with no centrioles and the other with multiple centrioles. Control cells are RPE-1 TP53−/−. Scale bars: overview, 5 µm; insets: 1 µm. (B) Quantification of centriole number distribution in asynchronous cells, as measured by centrin and CP110 colocalization. Control cells are RPE-1 TP53−/−. Bars represent the mean of three independent experiments with ≥100 cells each, error bars represent the SEM. (C) Quantification of the percent of centrin foci that colocalize with indicated centriole markers. Control cells are RPE-1 TP53−/−. Bars represent the mean of three independent experiments with ≥200 centrioles each, error bars represent the SEM. D) Centriole presence in TUBD1−/− and TUBE1−/− cells is cell-cycle dependent. Quantification of the number of cells at each stage with centrin/CP110-positive centrioles. G0/G1 cells were obtained by serum withdrawal, S-phase by staining for PCNA, G2 by treatment with RO-3306, and mitosis by presence of condensed chromatin. Bars represent the mean of three independent experiments with ≥100 cells each, error bars represent the SEM. (E) Quantification of the number of cells with centrin/CP110-positive centrioles at the indicated times after mitotic shakeoff. At 12 hr, 56 ± 12% of TUBE1−/− cells entered S-phase, as marked by PCNA staining. Control cells are RPE-1 TP53−/−. Bars represent the mean of three independent experiments with ≥150 cells each, error bars represent the SEM. (F) Still images from movies of live GFP-centrin cells (Videos 1 and 2). Control cells are RPE-1 TP53−/−. Images are maximum intensity projections of 0.5 µm stacks, shown prior to division and post-division. The cells undergoing mitosis are outlined with a dashed line. Exposure time, laser intensity, number of stacks, and post-processing were equivalent for both movies. Times indicated are h:m. Scale bar: 10 µm.
Figure 3—figure supplement 1
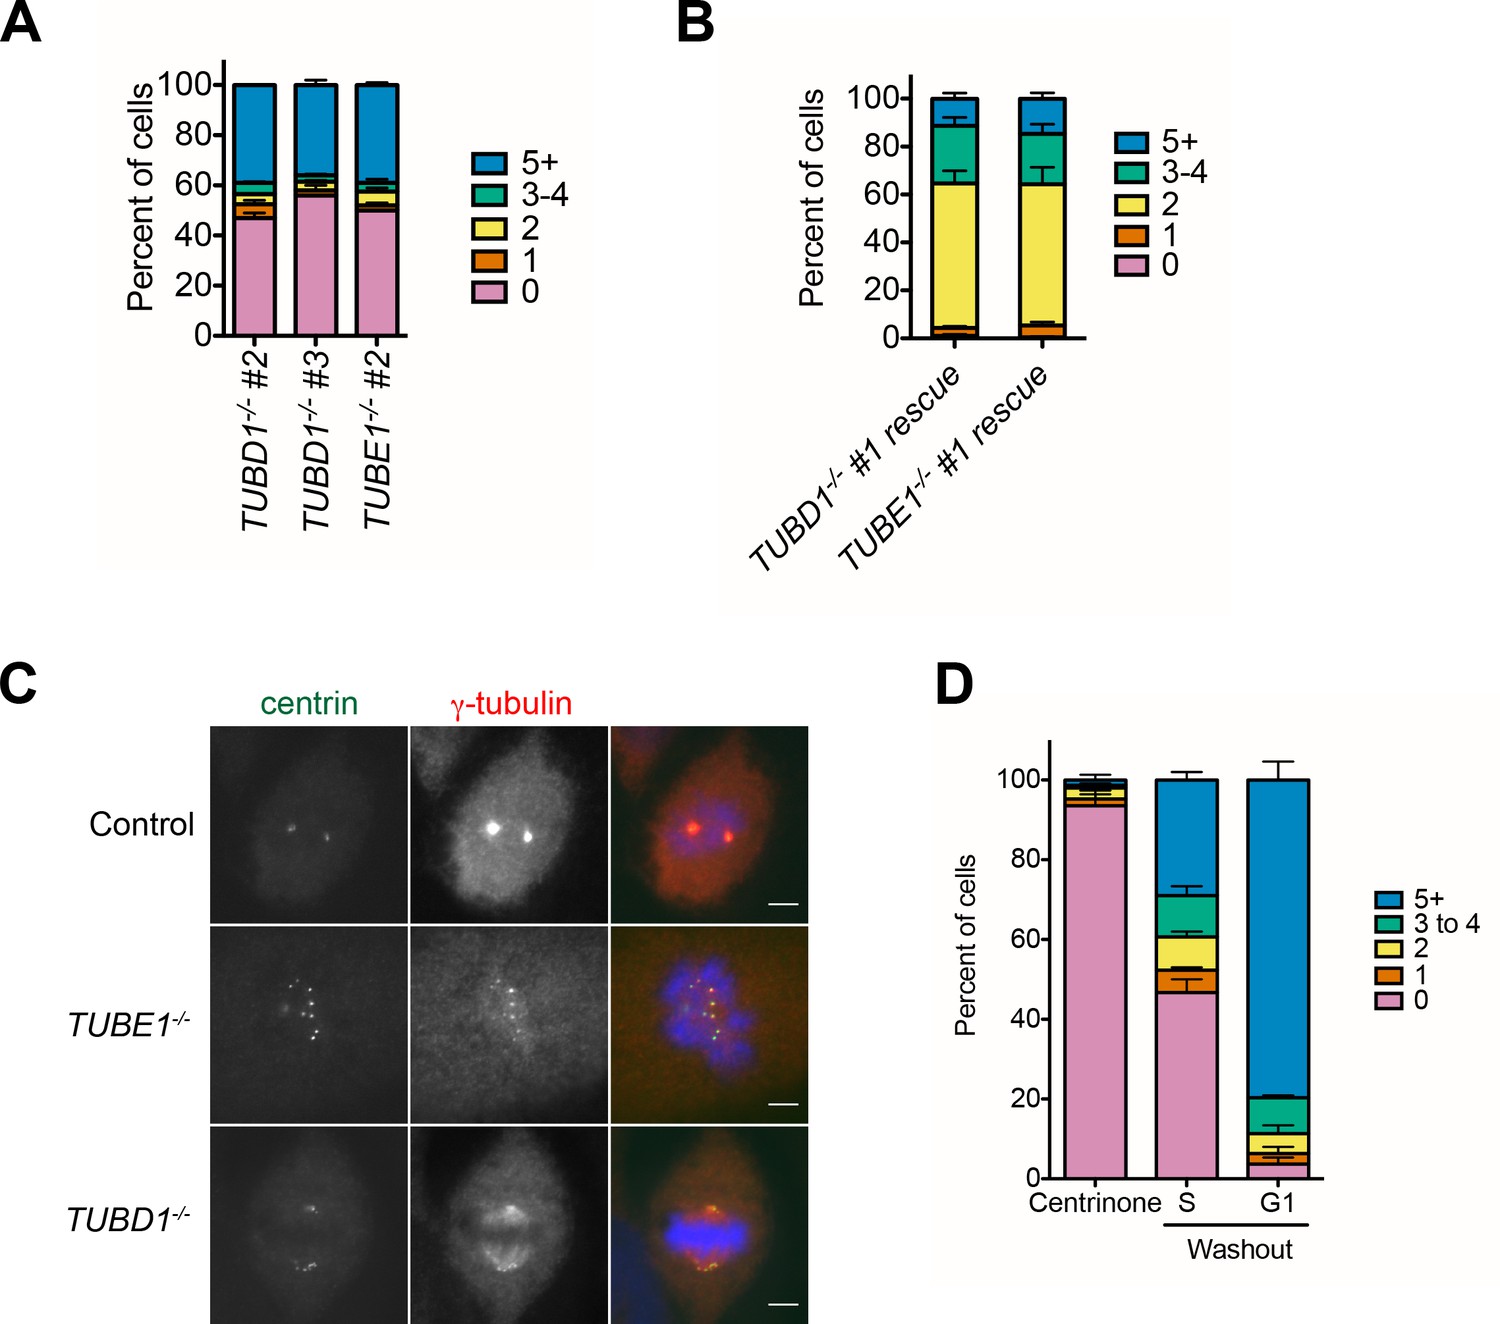
Expanded phenotype analysis of TUBD1−/− and TUBE1−/− cells.
(A) Quantification of centriole number distribution in asynchronous cells from independently-derived TUBD1−/− and TUBE1−/− clonal cell lines, as measured by centrin and CP110 colocalization. Bars represent the mean of three independent experiments with ≥100 cells each, error bars represent the SEM. (B) Quantification of centriole number distribution in asynchronous rescue lines, as measured by centrin and CP110 colocalization. Cell line #1 for each mutant was infected with virus expressing untagged delta-tubulin or epsilon-tubulin, respectively. The rescue construct also contained monomeric Kusabira Orange kappa (mKOk) under a separate promoter as a marker of infection. mKOk-positive cells were counted for each line. Bars represent the mean of three independent experiments with ≥100 cells each, error bars represent the SEM. (C) Centrin and gamma-tubulin localization in mitotic cells of the indicated cell lines. Control cells are RPE-1 TP53−/−. Scale bars: 5 µm. Control and TUBE1−/− cells are in prometaphase, and the TUBD1−/− cell is in metaphase, with mitotic spindle-associated gamma-tubulin and centrioles at the spindle poles. (D) De novo centrioles formed in control RPE1 TP53−/− cells do not disintegrate in G1. Quantification of the number of cells with centrin/CP110-positive centrioles after centrinone treatment. RPE-1 TP53−/− cells were treated with centrinone for at least 2 weeks, then mitotic cells were shifted to centrinone-free medium. Cells were analyzed 12 hr after shift, when 36% of cells had entered S-phase, and in the following G1. Bars represent the mean of three independent experiments with ≥100 cells each, error bars represent the SEM.
Figure 4 with 1 supplement
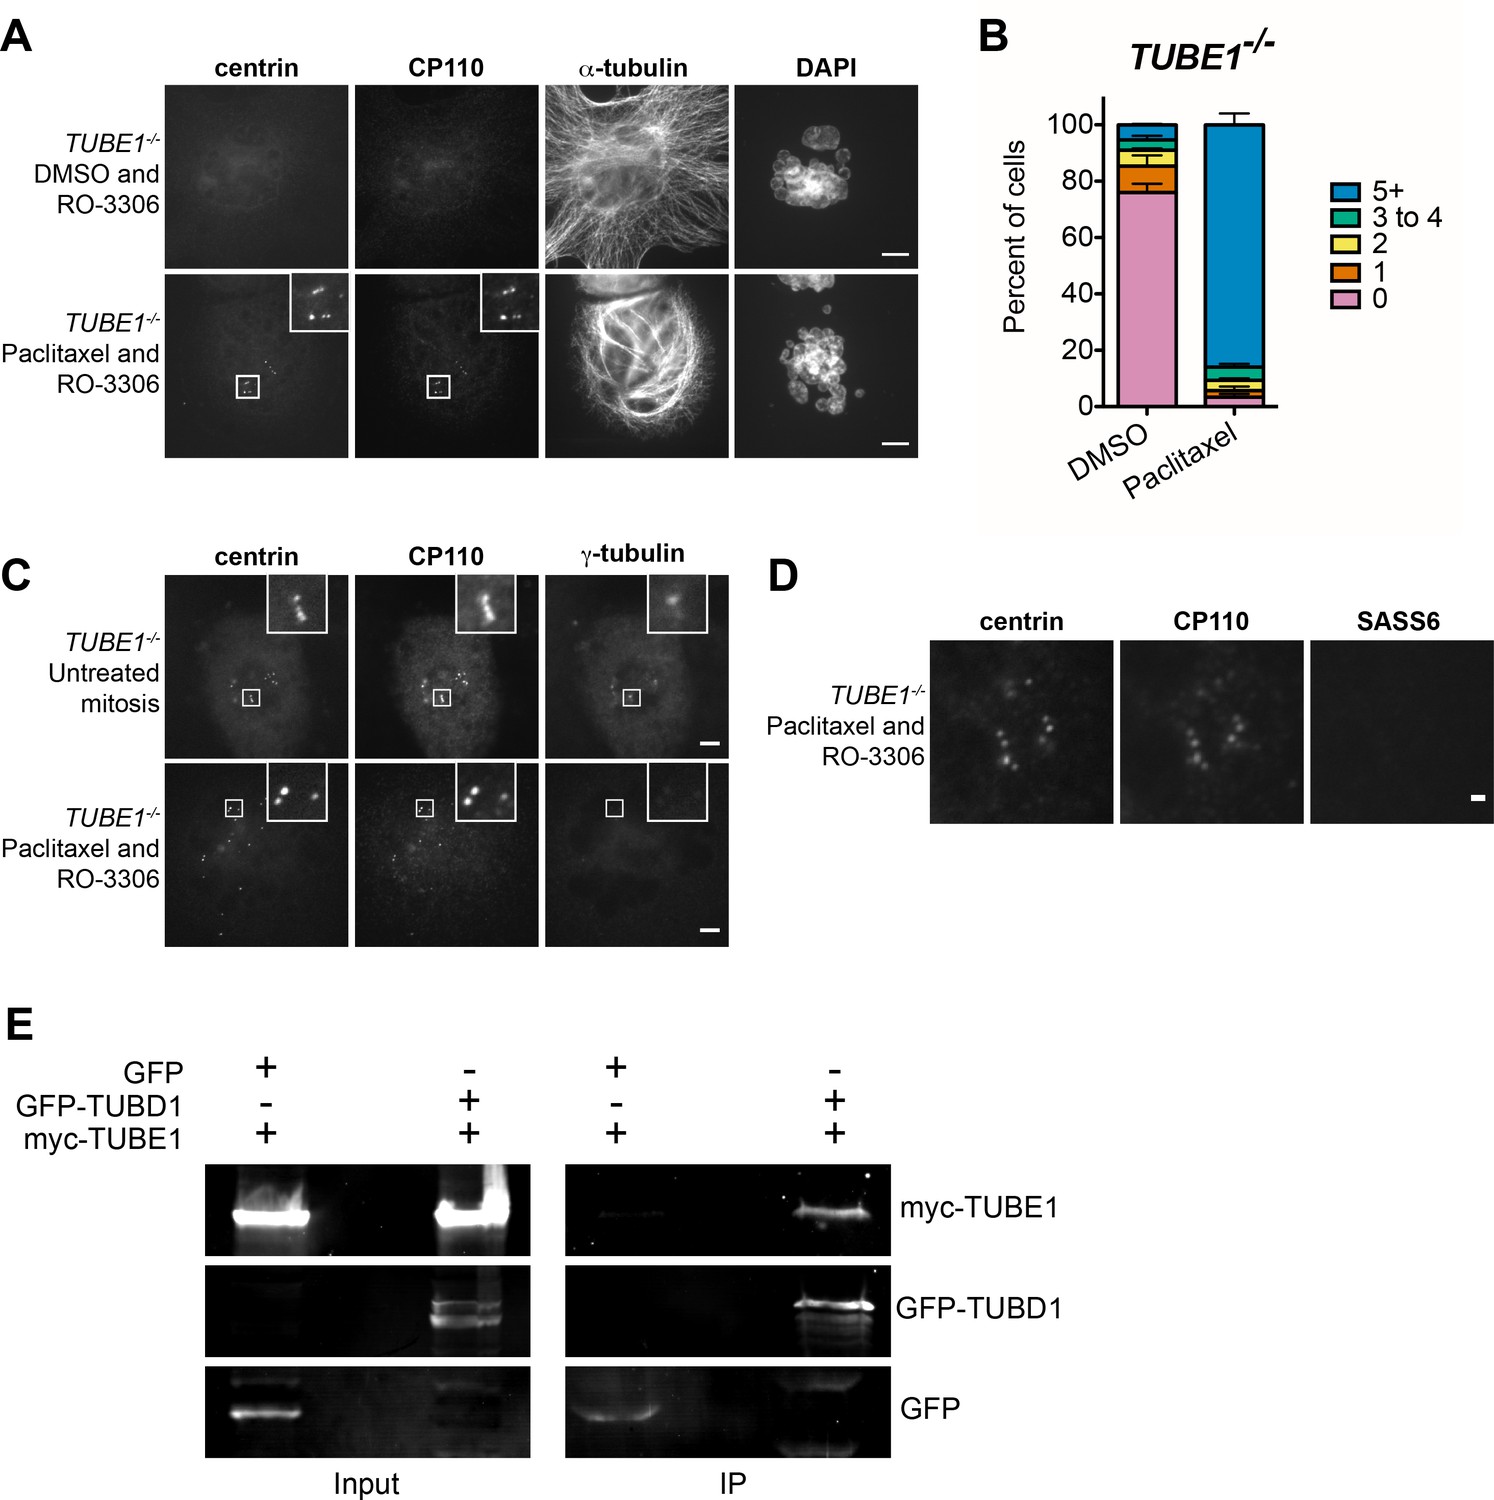
The centriole disintegration phenotype of TUBE1 loss can be suppressed by paclitaxel treatment, and TUBD1 and TUBE1 interact.
(A) Paclitaxel rescues the centriole disintegration phenotype. G2-stage TUBE1−/− cells were treated with paclitaxel or DMSO control for 3 hr. Mitotic cells were then forced into G1 with RO-3306. Centrioles are visualized by centrin and CP110 staining, and microtubules by alpha-tubulin staining. Scale bars: 5 µm. (B) Quantification of the percent of G1 cells with indicated numbers of centrin/CP110-positive centrioles upon treatment with paclitaxel or DMSO, followed by RO-3306 for 3 hr. Bars represent the mean of three independent experiments with ≥100 cells each, error bars represent the SEM. (C) Paclitaxel-stabilized centrioles in TUBE1−/− cells have reduced gamma-tubulin in G1. Untreated mitotic (top) or paclitaxel and RO-3306-treated G1 (bottom) TUBE1−/− cells were stained for the indicated proteins. Scale bars: 5 µm. (D) SASS6 is lost in stabilized centrioles in TUBE1−/− cells in G1. Cells were treated as in A), and cells were stained for the indicated proteins. Scale bar: 1 µm. (E) Co-immunoprecipitation of myc-TUBE1 and GFP-TUBD1. GFP, GFP-TUBD1 and myc-TUBE1 were expressed separately or together (Input). Complexes were immunoprecipitated (IP) with GFP-binding protein, and precipitated proteins were detected with anti-GFP and anti-myc antibodies.
-
Figure 4—source data 1
Expanded evolutionary analysis.
Accession numbers and references for evolutionary analyses.
- https://doi.org/10.7554/eLife.29061.014
Figure 4—figure supplement 1

Evolutionary analysis.
Evolutionary analysis of the correlation of TUBD1 and TUBE1 presence with centriolar triplet microtubules, in organisms with centrioles. Phylogenetic tree was generated by NCBI Common Tree. Black boxes represent genera in which the gene or feature is absent.
Videos
Video 1
Mitosis in a control RPE-1 TP53−/− cell.
Movie of live RPE-1 TP53−/− GFP-centrin cells. The cell on the left is in G2 and will enter and exit mitosis during the course of the movie. The cell on the right remains in interphase throughout the movie. Images are maximum intensity projections of 0.5 µm stacks. Times indicated are h:m. Scale bar: 10 µm. Exposure time, laser intensity, number of stacks, and post-processing were equivalent for both movies.
Video 2
Mitosis in a TUBE1−/− cell
Movie of live RPE-1 TUBE1−/− GFP-centrin cells. The cell on the left is in G2 and will enter and exit mitosis during the course of the movie. The cells on the right have exited mitosis and have dim GFP-centrin foci, which fully disappear in G1. Images are maximum intensity projections of 0.5 µm stacks. Times indicated are h:m. Scale bar: 10 µm. Exposure time, laser intensity, number of stacks, and post-processing were equivalent for both movies.
Additional files
-
Transparent reporting form
- https://doi.org/10.7554/eLife.29061.015
Download links
A two-part list of links to download the article, or parts of the article, in various formats.
Downloads (link to download the article as PDF)
Open citations (links to open the citations from this article in various online reference manager services)
Cite this article (links to download the citations from this article in formats compatible with various reference manager tools)
Centriole triplet microtubules are required for stable centriole formation and inheritance in human cells
eLife 6:e29061.
https://doi.org/10.7554/eLife.29061


