Computationally-driven identification of antibody epitopes
- Dartmouth College, United States
- Korea Advanced Institute of Science and Technology (KAIST), Republic of Korea
Figures
Figure 1
Overview of computationally-driven epitope identification by EpiScope.
(A) Ab–Ag docking models are generated using computational docking methods. In the example, the green structure is the Ag human IL-18 (PDB ID: 2VXT:A), while the cartoons represent possible poses of the Ab (limited here to three for clarity). Full details including docking models and designs for this example are provided in a PyMol session (Supplementary file 1). (B) Ag variants containing a pre-defined numbers of mutations (here triple mutations, colored triangles) are generated for each docking model. (C) Variants are clustered with respect to spatial locations in the Ag, and a set of variants predicted to disrupt all of the docking models is selected. (D) Ag mutagenesis and Ag-Ab binding experiments are performed to identify which mutations result in loss of Ab recognition. (E) Examination of the disruptive variant(s) enables localization of the Ab epitope in terms of both mutated positions (pink balls) and consistent docking models, here with the model (light pink cartoon) quite similar to the actual crystal structure (dark pink cartoon).
Figure 2 with 1 supplement

Small sets of designed Ag variants enable epitope localization for two different B7H6-targeting Abs.
(A–C). TZ47; (D-F) PB11. (A and D) Designed Ag variants, color-coded by triple mutation sets (Table 1). NKp30, a natural ligand for B7H6, is shown in grey ribbon. (B and E) Flow cytometry results from staining variant-expressing HEK cells with the relevant Ab, using NKp30-Ig as a positive control. Fluorescence is normalized to WT Ag-expressing cells. The dotted lines represent average background fluorescence measured from negative control Abs. Experiments were conducted in triplicate and error bars show the standard deviation. (C and F) Docking models (Ab cartoons of different colors) affected by the disruptive Ag variants (highlighted in red for TZ47 and green for PB11). Bar graphs depict the average (height) and standard deviation (error bars) of the MFI of 3 technical replicates, defined as the equivalent staining of a single batch of transfected cells repeated in three separate wells in the same experiment. One outlier value was excluded (PB11-staining of PB11-Ag1) where fewer than 1500 live cells were sampled and the raw MFI was two orders of magnitude higher than the other two replicates (1145.6 vs. 14.41 and 14.20).
-
Figure 2—source data 1
Raw data values for Figure 2B and E.
- https://doi.org/10.7554/eLife.29023.005
Figure 2—figure supplement 1
Chimeric variant (SD9) design confirmed the localization of the TZ47 epitope.
(A) Chimeric human-macaque B7H6 variant SD9 was designed based on sequence differences between the two species homologues at the region identified by EpiScope (colored green and black). (B) Histograms depicting binding of TZ47 (red), NKp30 (blue), and secondary anti-mouse fluorescent Abs (black) to chimeric human-macaque B7H6 variant (SD9) expressing cells (left) and wild-type RMA-B7H6 cells (right) are shown.
Figure 3 with 2 supplements

A single set of Ag variants enables simultaneous localization of two different B7H6-targeting Abs.
(A) Designed Ag variants color-coded by triple-mutant design, with natural binding partner NKp30 in grey ribbon. (B) Flow cytometry results from staining variant-expressing HEK cells with the relevant Ab, using NKp30 as a positive control. Fluorescence was normalized to WT antigen-expressing cells. The dotted line represents average background fluorescence measured from negative control Abs. (C) Docking models (Ab cartoons of different colors) affected by disruptive Ag variants (highlighted in orange for TZ47 and magenta for PB11), for left: TZ47 and right: PB11. Bar graphs depict the average (height) and standard deviation (error bars) of the MFI of 3 technical replicates, defined as the equivalent staining of a single batch of transfected cells repeated in three separate wells in the same experiment. One replicate value was excluded where fewer than 1500 live cells were sampled from the well (one replicate of PB11-staining of MULTI-1) and the raw MFI was two orders of magnitude larger than the other two replicates (232.8 vs. 2.55 and 3.71).
-
Figure 3—source data 1
Raw data values for Figure 3B.
- https://doi.org/10.7554/eLife.29023.011
Figure 3—figure supplement 1
B7H6 and epitope localization for its binding antibodies.
The modeled loop region (Chain A 150–157; DQVGMKEN) is colored in green. The binding interface of a binding antibody (17B1.3) in PDB (4ZSO) is in red. The disruptive designs for TZ47 are in yellow and PB11 in blue. The epitopes of the Abs seem not to overlap.
Figure 3—figure supplement 2
Docking models for TZ47 and PB11 substantially overlap.
Residues predicted to be part of the binding interface by ClusPro generated docking models are color-coded by those specific to one Ab (blue) or shared between both Abs (red).
Figure 4 with 4 supplements
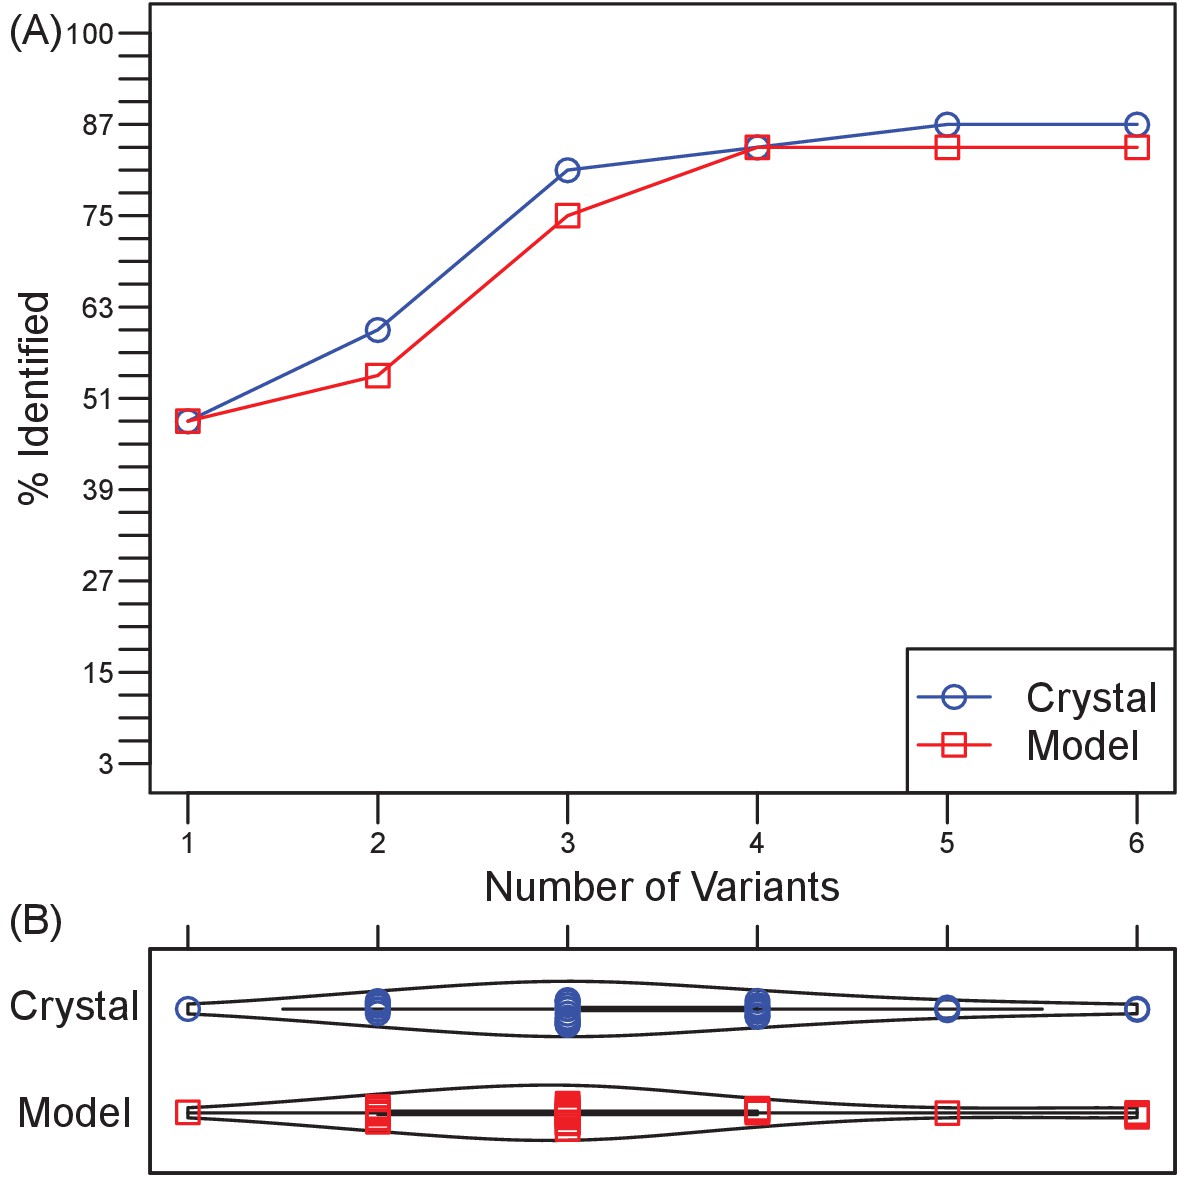
Retrospective validation demonstrates generality of efficiency and effectiveness in localizing epitopes.
(A) Over a test set of 33 diverse Ab-Ag pairs with co-crystal structures, the number of pairs in which at least one binding interface residue is included among the disruptive mutations in a set of 1–6 Ag triple-mutant variants. Ultimately, two pairs were missed when using Ag crystal structure and three pairs when using Ag homology models. (B) Violin plots of the number of Ag variants required to incorporate mutations predicted to disrupt all docking models.
Figure 4—figure supplement 1

Ag size vs. number of Ag variants to cover docking models.
(A) Using Ag crystal structure; (B) using Ag homology model. There is a slight trend between number of surface residues on the Ag and number of variants needed to localize the epitope. The marks in the scatterplot indicate which variant sets included (open circles) or missed (solid triangles) epitope residues.
Figure 4—figure supplement 2
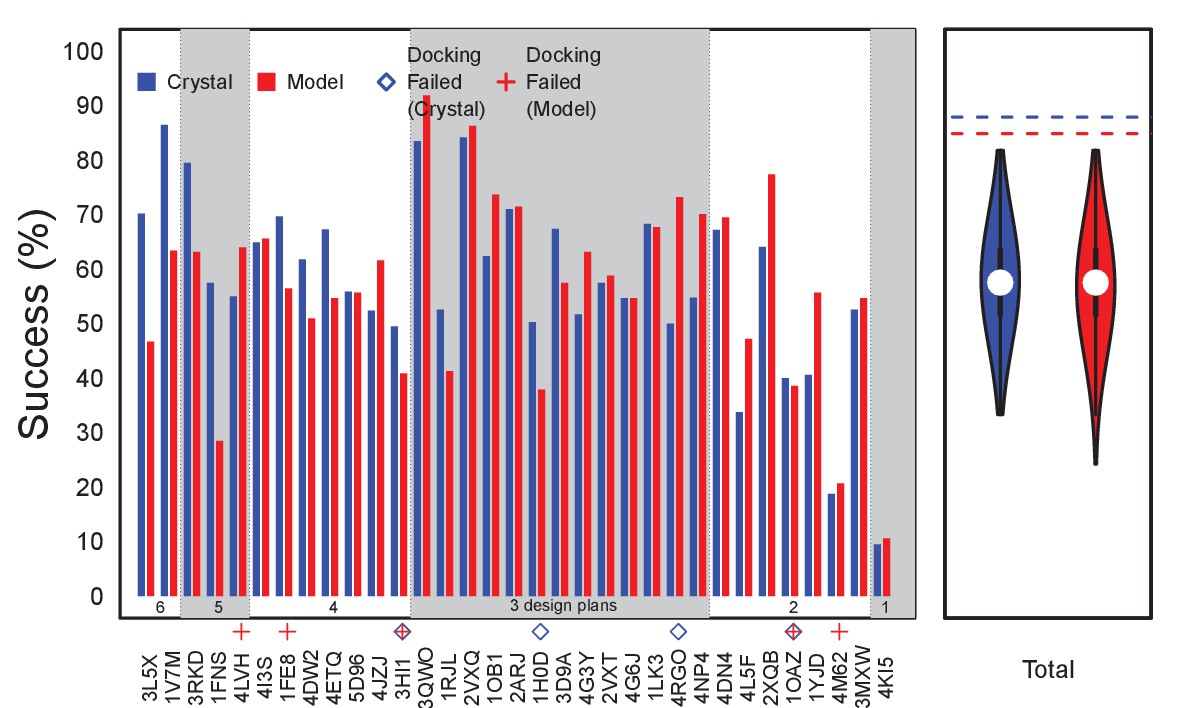
Performance using size-matched sets of random triple-mutants instead of docking-based disruptive ones.
The bars show success rates for the individual targets (i.e., Ab:Ag pairs, identified by PDB ID) over 1000 runs selecting designs from 1000 different random triple mutants. Targets are sorted in terms of the size-matched number of selected designs and the number of Ag surface residues. Annotations indicate where docking-based disruptive designs failed. Violin plots depict the total number of successes over all the targets and all the runs, with dashed lines at the top indicating previously described EpiScope success rates based on docking disruption.
-
Figure 4—figure supplement 2—source data 1
Raw data values forFigure 4—figure supplement 2.
- https://doi.org/10.7554/eLife.29023.018
Figure 4—figure supplement 3
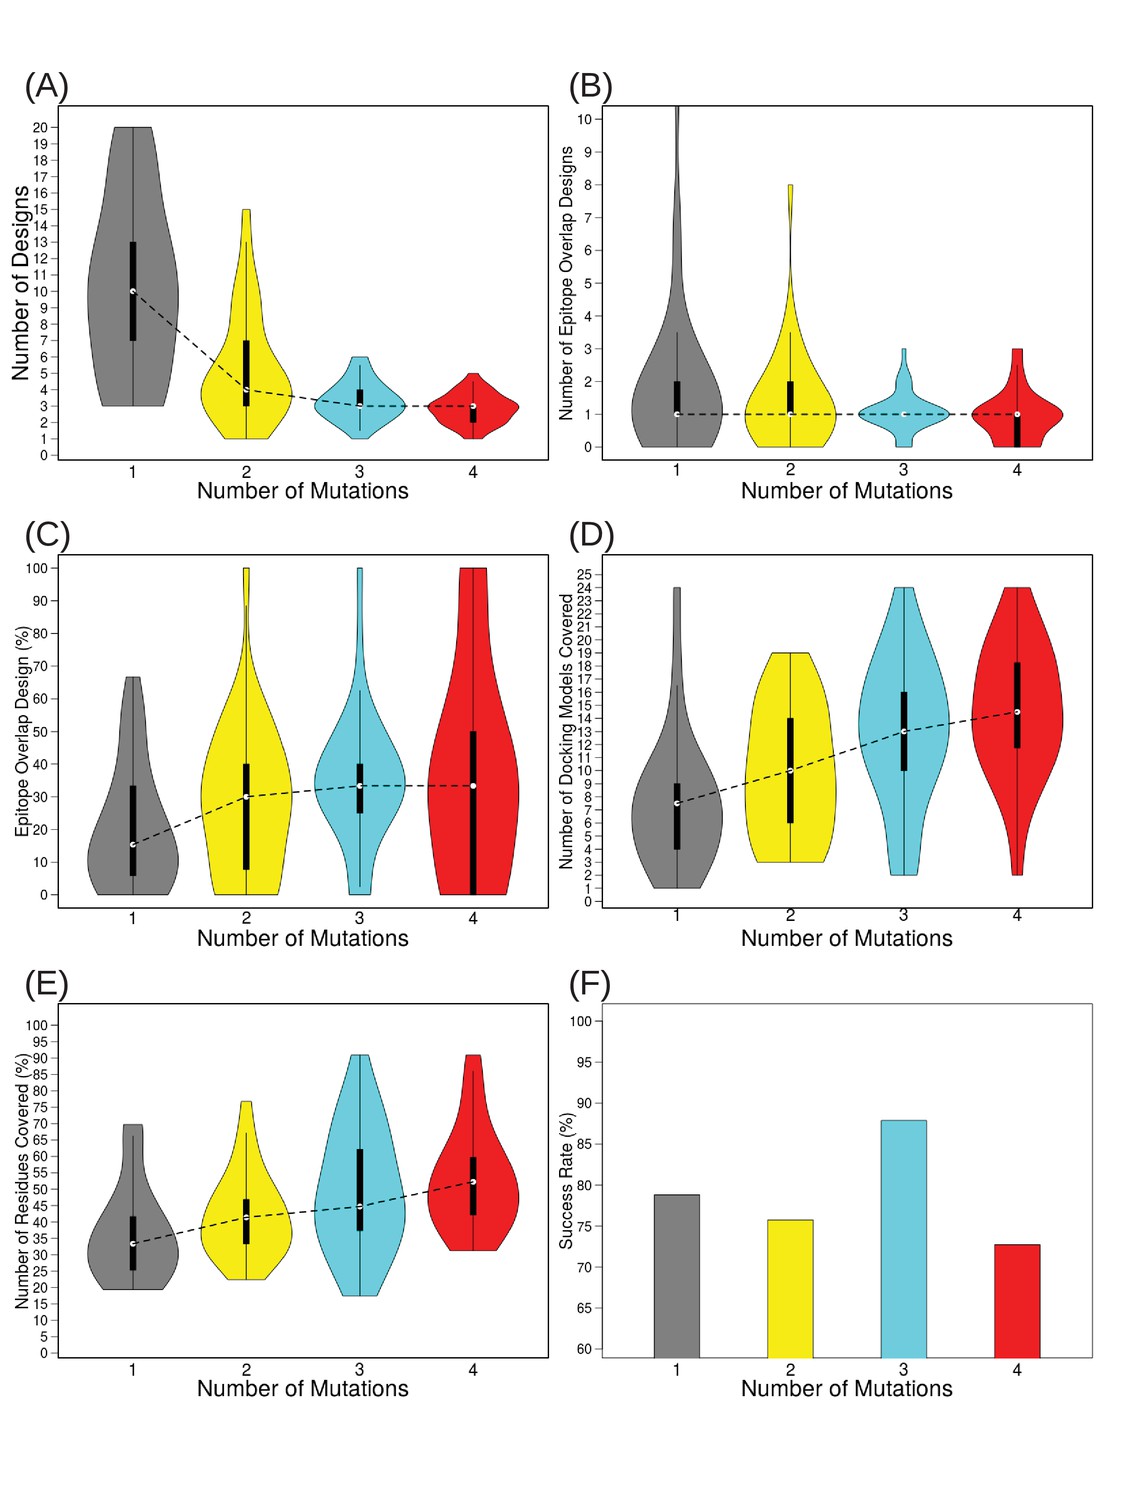
Varying the number of mutations to include per design from 1 to 4 demonstrates that the most efficient epitope localization occurs at three mutations/design.
Violin plots depict: (A) the number of total designs needed to disrupt all docking models, (B) the number of designs overlapping true Ab epitope residues, (C) the percentage of designs overlapping true Ab epitope residues, (D) the number of docking models remaining after filtering for those overlapping disruptive designs, (E) the percentage of surface residues covered by filtered docking models, on which to focus further scanning efforts if desired, and (F) percentage of test cases for which at least one design contained a mutation overlapping the true Ab epitope.
-
Figure 4—figure supplement 3—source data 2
Raw data values for Figure 4—figure supplement 3.
- https://doi.org/10.7554/eLife.29023.019
Figure 4—figure supplement 4
Effects of inter-mutation distances on epitope localization resolution and success rate.
(A) Average Cα distances of two and three mutation variants. The distributions are peaked at 11 ~ 15 Å. (B–D) Success rates and resolution, in terms of consistent docking models and their residue coverage, with varying distance thresholds. Each plan uses a single 1-mutation, 2-mutation, or 3-mutation variant optimized to cover docking models for a target. Bars show averages and standard deviation over the retrospective test set.
-
Figure 4—figure supplement 4—source data 3
Raw data values for Figure 4—figure supplement 4.
- https://doi.org/10.7554/eLife.29023.020
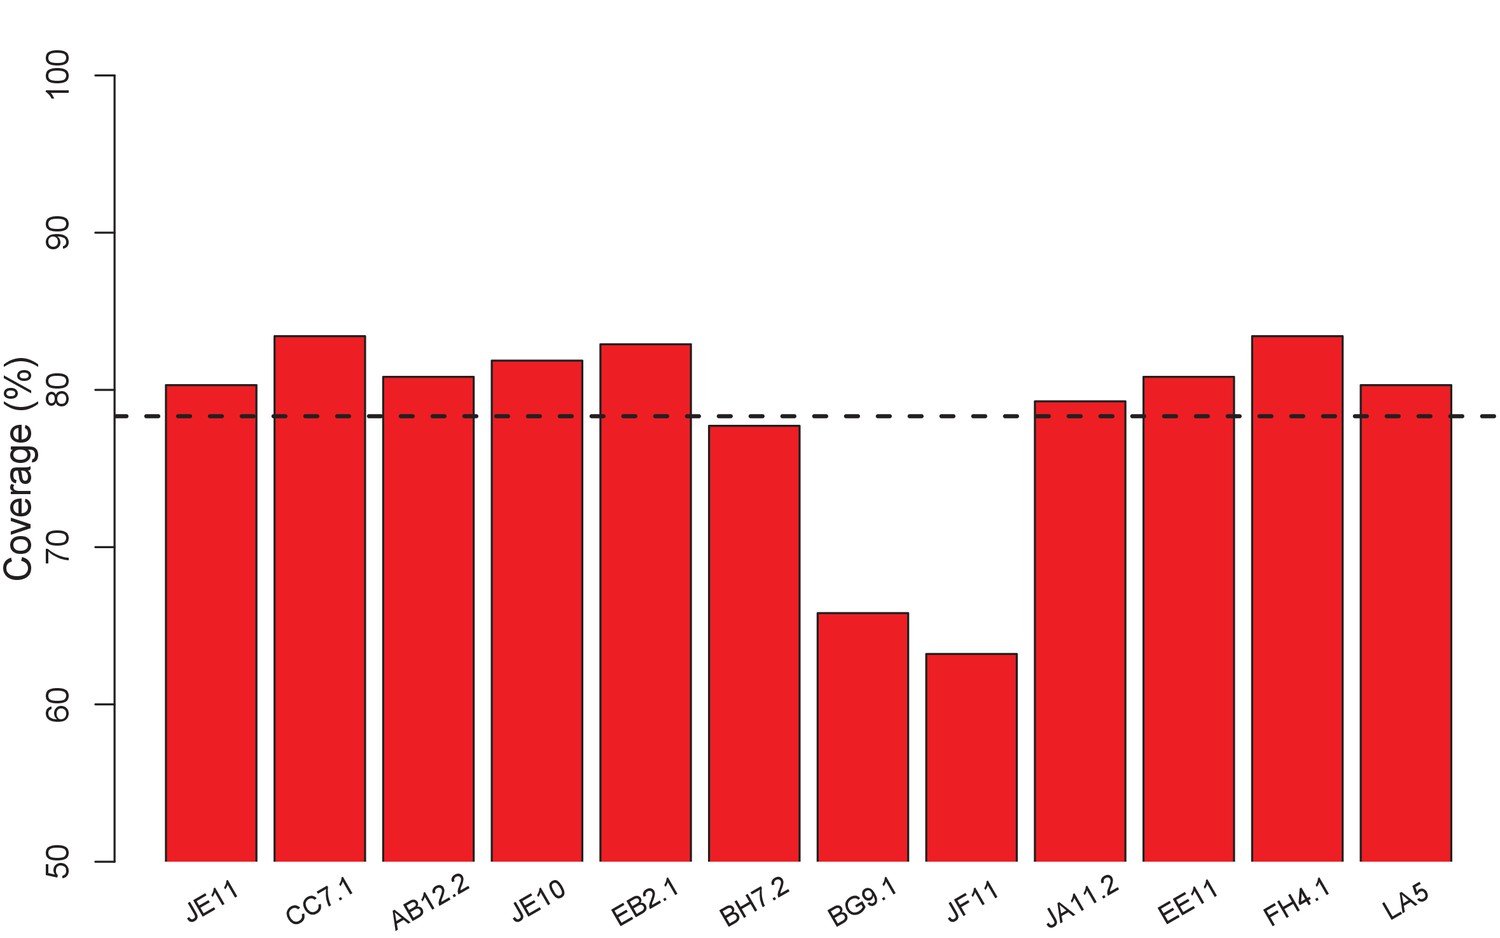
Figure 5 with 3 supplements
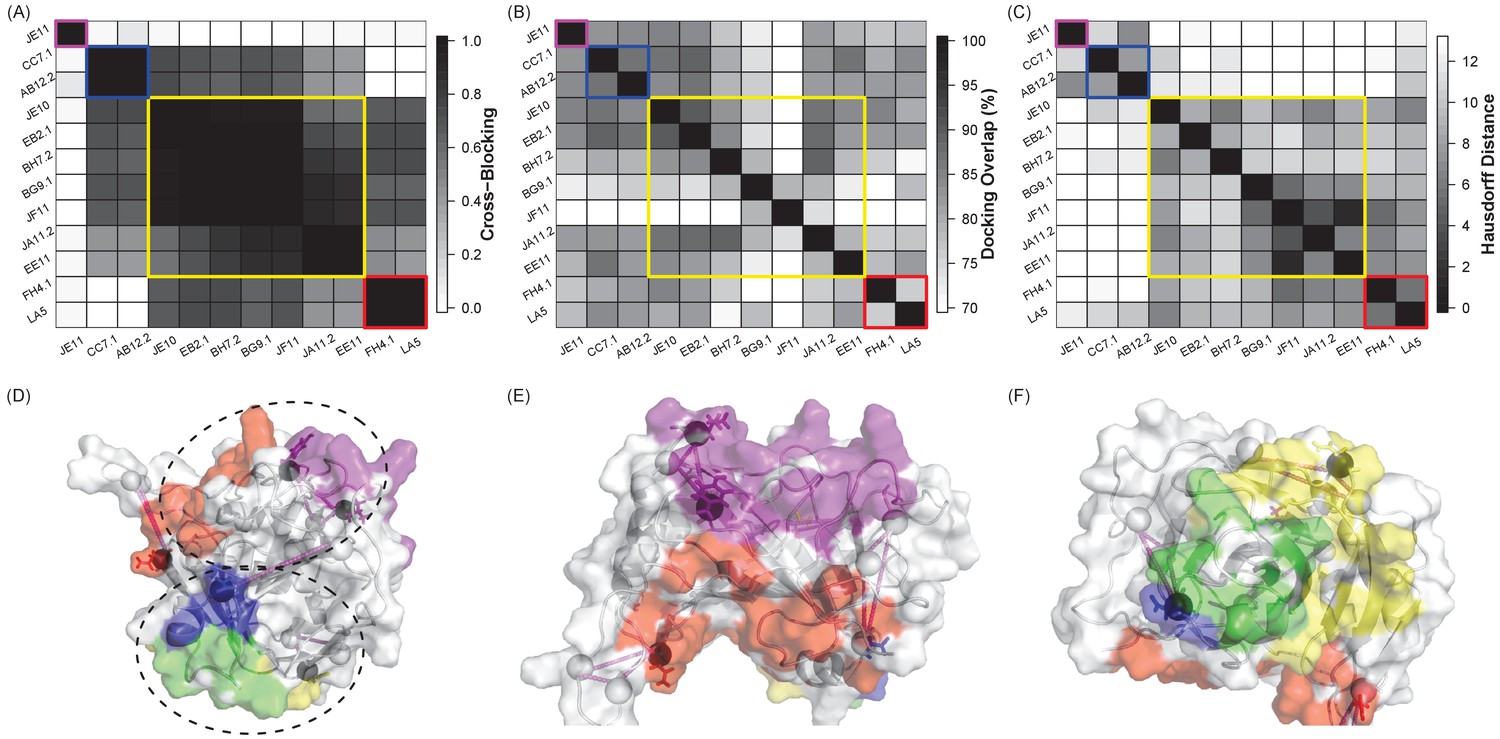
A small set of Ag variants has the potential to simultaneously localize multiple Ab epitopes for a single Ag.
(A) Heat map of competitive binding data (Sela-Culang et al., 2014) for 12 antibodies directed against the vaccinia virus D8 protein, with the extent of cross-blocking ranging from 0.0 (white, no effect) to 1.0 (black, complete blocking). Colors in all panels refer to the four Ab groups identified by this competition assay (I: purple, II: blue, III: yellow, and IV: red). (B) Heat map of the overlap between ClusPro-generated docks for each pair of Abs, ranging from 60% (white) to 100% (black). (C) Heat map of the average Hausdorff distance between Ag variants designed for each Ab, ranging from 0 (identical mutation sites, black) to 12 (white). (D–F) Ag variants designed to disrupt one Ab from each group (I: JE11, II: CC7.1, III: EE11, IV: LA5) are represented as triangles. Four designs were sufficient to cover all docking models, and the designs overlapped all of the epitope groups. True epitopes are color coded by group on the surface of the antigen; epitopes in group II and III overlapped, and are colored in green. Design residues overlapping the true epitopes are indicated with circles. (E and F) Zoomed views of epitope faces.
-
Figure 5—source data 1
Raw data values for Figure 5A, B and C.
- https://doi.org/10.7554/eLife.29023.030
Figure 5—figure supplement 1
ClusPro generates docking models that cover nearly all surface residues for the set of 12 VACV anti-D8 envelope targeting Abs.
Bars show fraction of surface residues in contact with a docking model; 78% on average (dashed line).
-
Figure 5—figure supplement 1—source data 1
Raw data values for Figure 4—figure supplement 1.
- https://doi.org/10.7554/eLife.29023.031
Figure 5—figure supplement 2
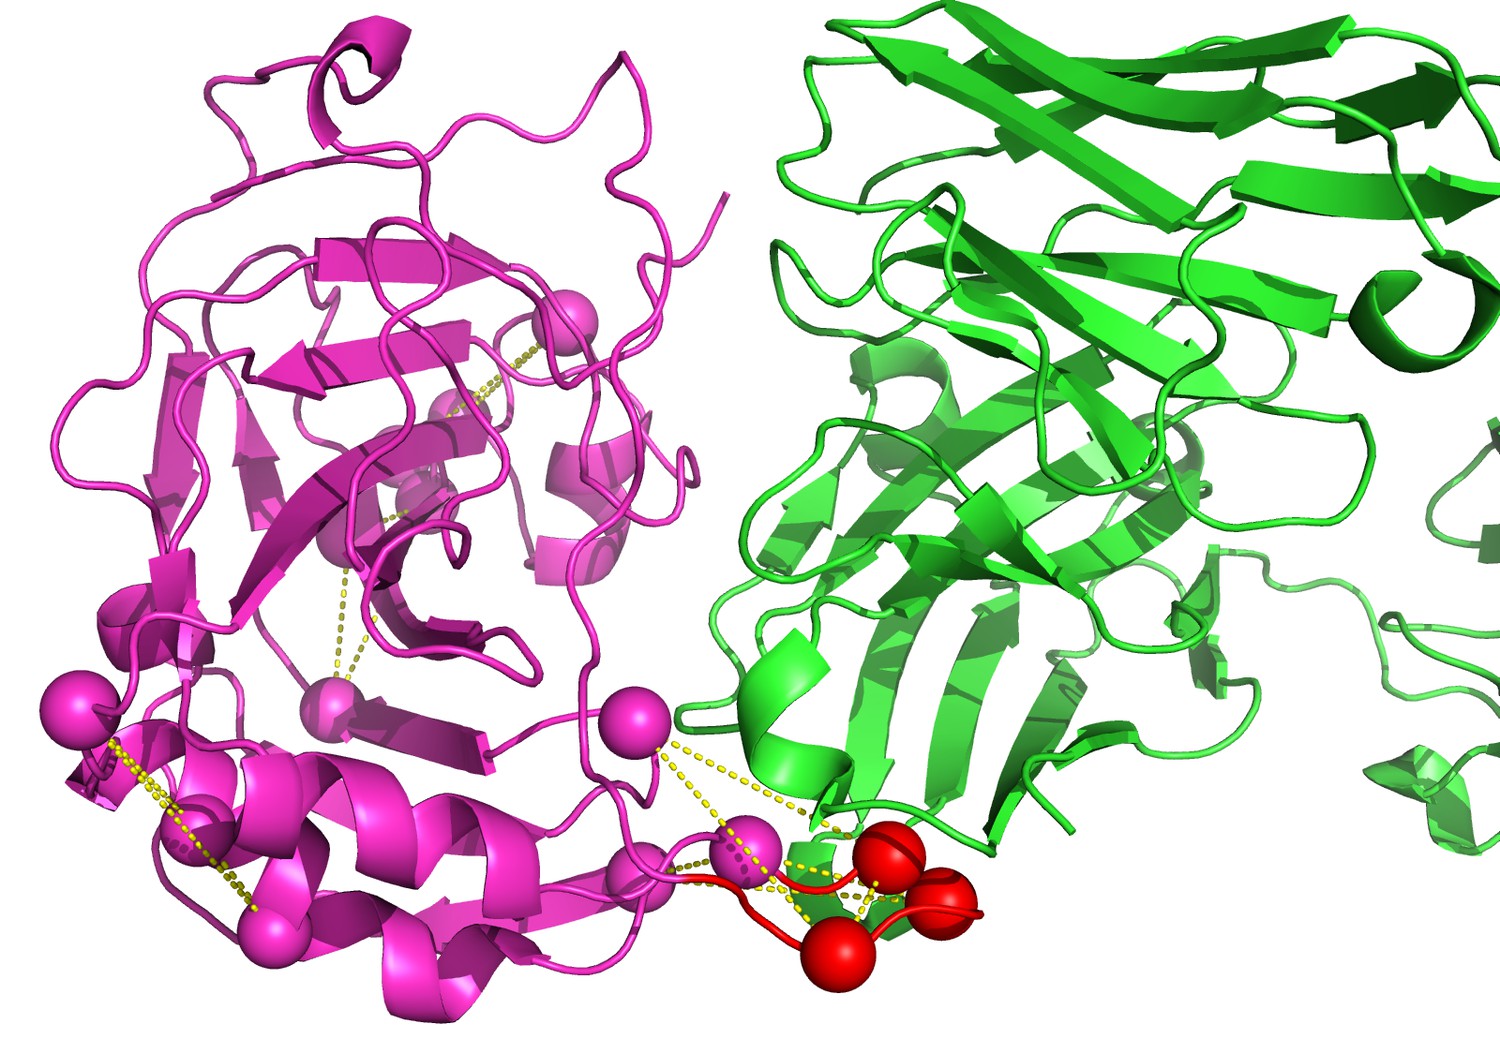
Identification of vaccinia D8 epitopes against LA5.
The LA5 Ab is in green and the D8 Ag is in magenta (PDB id 4ETQ). The modeled loop is in red. Five designs were generated by EpiScope and two of them are in the binding interface region.
Figure 5—figure supplement 3

Heatmaps of sequence identity between the selected 7 VACV anti-D8 Envelope targeting Abs.
Different panels are restricted to different CDRs, with ‘All’ for average over all CDRs. Colored square outlines represent the 4 groups of antibodies (epitope bins) identified by competitive binding assays (Sela-Culang et al., 2014).
-
Figure 5—figure supplement 3—source data 2
Raw data values for Figure 5—figure supplement 3.
- https://doi.org/10.7554/eLife.29023.032
Figure 6 with 2 supplements
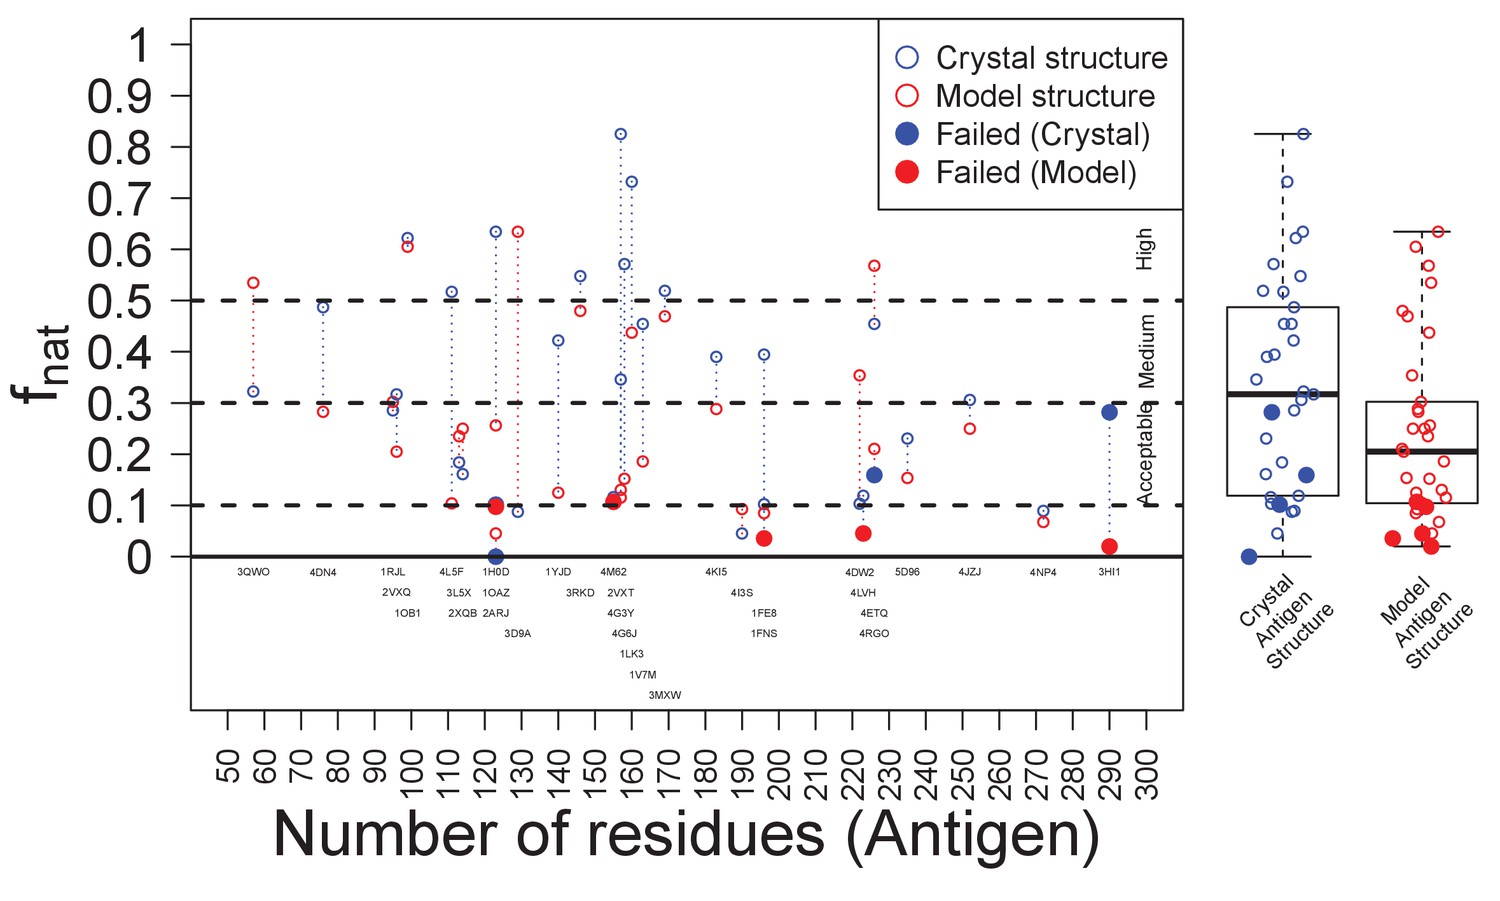
Success of EpiScope and the quality of docking models.
In general, docking using Ag crystal structures is better than using Ag homology models according to the fnat value; it is above ‘medium’ for crystal structures but only ‘acceptable’ for model structures. Poor docking models are necessary, but not sufficient, for the failure of the EpiScope approach: EpiScope still identifies epitopes for some poorly docked models, but all failed cases have low fnat values.
-
Figure 6—source data 1
Raw data values for Figure 6.
- https://doi.org/10.7554/eLife.29023.006
Figure 6—figure supplement 1

Examples of success and failure depending on qualities of Ab structure (A and B) and Ag structure (C and D).
Crystal structures are colored in blue and homology models in yellow. (A) In the case of 1FE8, though Ab modeling was highly successful (TM-score: 0.96 and backbone RMSD of CDR-H3: 0.63A), the docking models were very poor (fnat: 0.1) and epitope localization was not successful. The crystal structure of CDR-H3 is highlighted in red with stick representation. (B) Though modeling of Ab structure 2XQB was poor (TM-score: 0.92 and backbone RMSD of CDR-H3: 7.21A), moderate quality docking models were generated (fnat: 0.32) and the identification of epitopes was successful. (C) The Ag model of 4LVH was extremely accurate (TM-score: 0.9; template seq. ID: 41%) but poor modeling of the loop in the binding interface region (Ab structure is in ribbon) likely contributed in failure of epitope localization. (D) The receptor (4JZJ) was poorly modeled (TM-score: 0.33; template seq. ID: 32%) due to highly flexible loops, but the Ab binding region was modeled well and epitope identification succeeded.
Figure 6—figure supplement 2
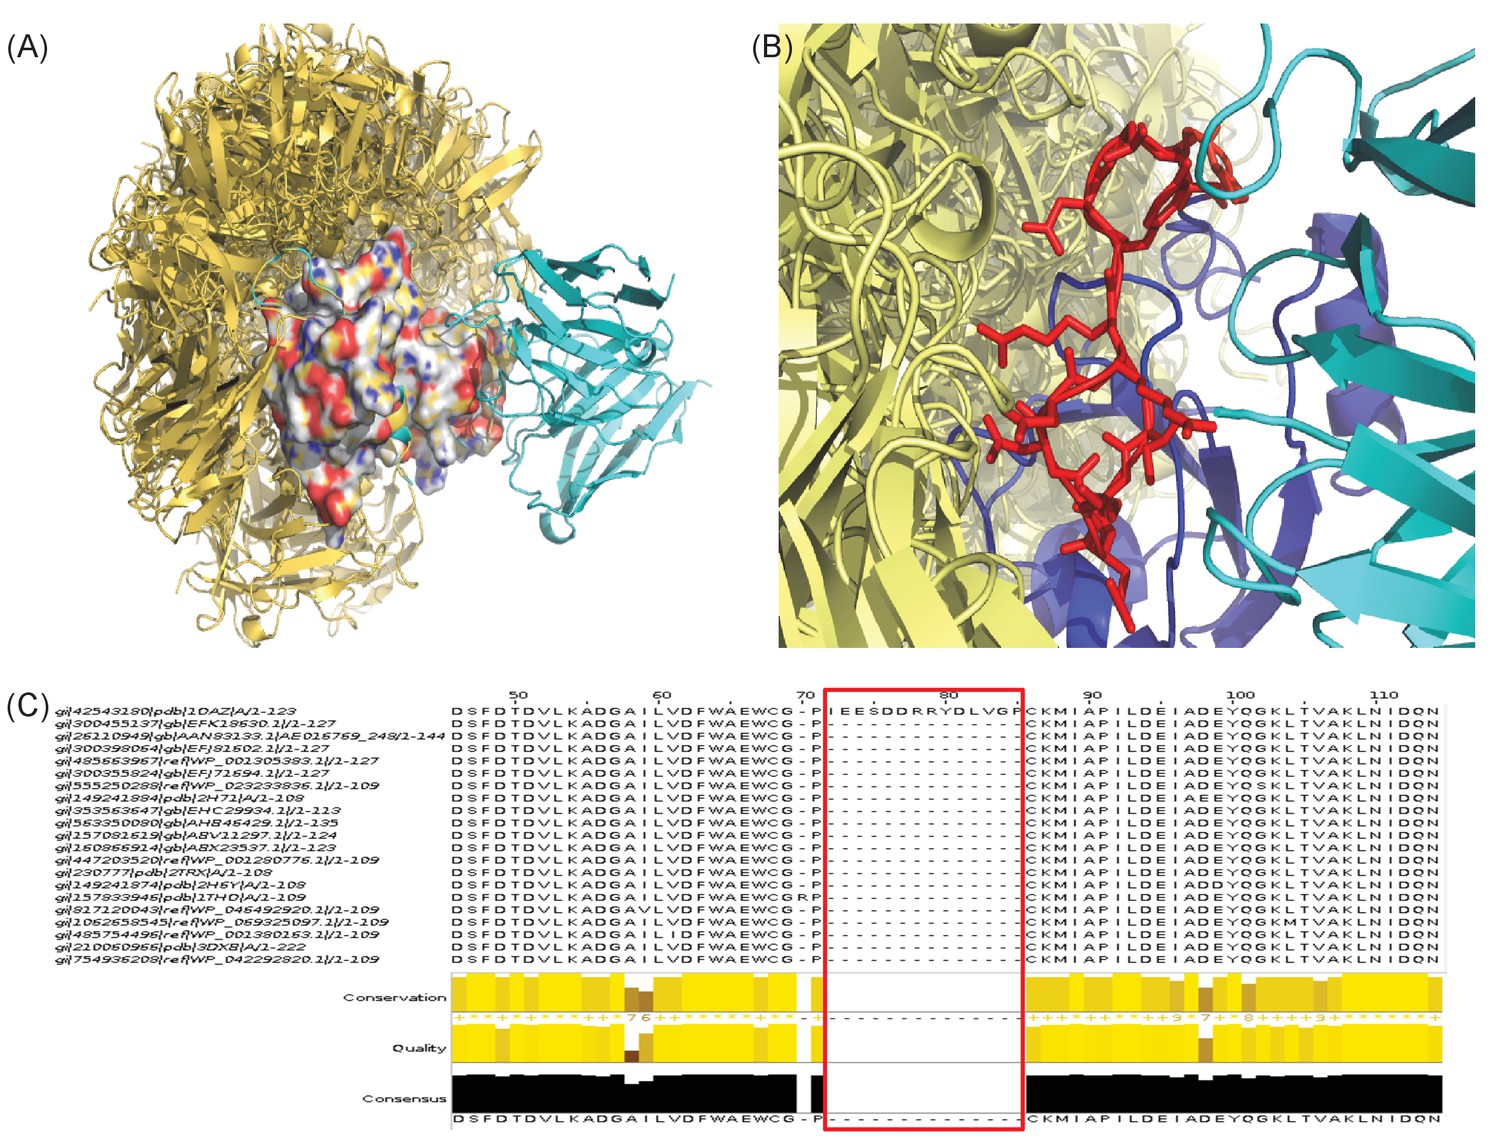
Two examples of EpiScope failure cases.
All ClusPro-generated docks (yellow) are shown with the crystal structures of Ab (cyan)-Ag complexes. (A) Failure due to poor docking quality (1H0D). (B and C) Failure due to insufficient mutational choice information (1OAZ). The Ag has a large long flexible loop involved in Ab binding (red in stick, panel B). Since the loop has no mutational information in closely related protein sequences (panel C), mutations that could disrupt binding are not considered in the design process.
Tables
Table 1
Summary of mutations in EpiScope Ag designs for each Ab.
Designs that disrupted binding for each Ab are highlighted.
| Design | Mutations |
|---|---|
| TZ47-Ag1 | F47Y, N49Q, W98E |
| TZ47-Ag2 | F184D, I188Q, V225T |
| TZ47-Ag3 | T71K, K74E, V76H |
| TZ47-Ag4 | M154E, N157G, S217H |
| PB-Ag1 | M30V, Q132V, Q136L |
| PB-Ag2 | F51H, Y52D, R99G |
| PB-Ag3 | A88T, F89T, G111R |
| PB-Ag4 | T176K, V194I, R231E |
| PB-Ag5 | N216K, S217A, Q219V |
Table 2
Summary of mutations in Multi-Ab specific EpiScope Ag designs.
Designs that disrupted binding for each Ab are highlighted.
| Design | Mutations |
|---|---|
| MULTI-1 | N57D, D84N, W98E (PB11) |
| MULTI-2 | F66Y, T71K, F72D |
| MULTI-3 | V78L, F89T, G111R |
| MULTI-4 | M154E, N157E, N216K (TZ47) |
| MULTI-5 | A172H, R231E, A233E |
| MULTI-6 | T176K, R231E, H236S |
Table 3
Retrospective test cases.
Columns indicate the PDB ID of each Ab-Ag pair; the number of residues for various subsets of the Ag; the number and success of EpiScope designs based on crystal and model Ag structures; a measure of the quality of the closest native-like docking model among ClusPro generated models (fnat[Lensink et al., 2007]); the quality of the homology models built for Ab and Ags (TM-score [Zhang and Skolnick, 2004]); and the number of docking decoys generated by ClusPro.
| PDB code | Number of residues | Crystal structure | Model structure | Fnat | TM-score | Number of docking decoys | |||||||
|---|---|---|---|---|---|---|---|---|---|---|---|---|---|
| Whole | Surface | Epitopes | Number of designs | Overlap with epitopes | Number of designs | Overlap with epitopes | Crystal | Model | Antibody | Antigen | Crystal | Model | |
| 1FE8 | 196 | 124 | 27 | 4 | Y | 3 | N | 0.1 | 0.04 | 0.96 | 0.84 | 30 | 24 |
| 1FNS | 196 | 120 | 12 | 5 | Y | 2 | Y | 0.39 | 0.09 | 0.96 | 0.86 | 26 | 20 |
| 1H0D | 123 | 96 | 14 | 3 | N | 2 | Y | 0 | 0.05 | 0.98 | 0.79 | 30 | 30 |
| 1LK3 | 160 | 102 | 26 | 3 | Y | 3 | Y | 0.73 | 0.44 | 0.97 | 0.74 | 23 | 29 |
| 1OAZ | 123 | 101 | 14 | 2 | N | 2 | N | 0.1 | 0.1 | 0.97 | 0.77 | 30 | 29 |
| 1OB1 | 99 | 74 | 13 | 3 | Y | 4 | Y | 0.62 | 0.61 | 0.97 | 0.85 | 30 | 29 |
| 1RJL | 95 | 82 | 13 | 3 | Y | 2 | Y | 0.29 | 0.3 | 0.96 | 0.89 | 30 | 27 |
| 1V7M | 163 | 113 | 20 | 6 | Y | 3 | Y | 0.45 | 0.19 | 0.96 | 0.78 | 27 | 24 |
| 1YJD | 140 | 86 | 14 | 2 | Y | 3 | Y | 0.42 | 0.13 | 0.98 | 0.77 | 25 | 30 |
| 2ARJ | 123 | 90 | 17 | 3 | Y | 3 | Y | 0.63 | 0.26 | 0.97 | 0.75 | 24 | 30 |
| 2VXQ | 96 | 71 | 21 | 3 | Y | 3 | Y | 0.32 | 0.21 | 0.89 | 0.89 | 30 | 30 |
| 2VXT | 157 | 116 | 19 | 3 | Y | 3 | Y | 0.83 | 0.13 | 0.95 | 0.93 | 13 | 19 |
| 2XQB | 114 | 87 | 18 | 2 | Y | 3 | Y | 0.16 | 0.25 | 0.92 | 0.89 | 17 | 21 |
| 3D9A | 129 | 93 | 19 | 3 | Y | 2 | Y | 0.09 | 0.63 | 0.93 | 0.93 | 22 | 29 |
| 3HI1 | 290 | 246 | 20 | 4 | N | 3 | N | 0.28 | 0.02 | 0.97 | 0.83 | 30 | 29 |
| 3L5X | 113 | 83 | 8 | 6 | Y | 3 | Y | 0.18 | 0.24 | 0.98 | 0.83 | 30 | 30 |
| 3MXW | 169 | 108 | 22 | 2 | Y | 2 | Y | 0.52 | 0.47 | 0.96 | 0.92 | 20 | 23 |
| 3QWO | 57 | 48 | 10 | 3 | Y | 4 | Y | 0.32 | 0.53 | 0.96 | 0.86 | 30 | 30 |
| 3RKD | 146 | 105 | 18 | 5 | Y | 3 | Y | 0.55 | 0.48 | 0.97 | 0.49 | 30 | 30 |
| 4DN4 | 76 | 50 | 12 | 2 | Y | 2 | Y | 0.49 | 0.28 | 0.92 | 0.88 | 20 | 27 |
| 4DW2 | 222 | 175 | 20 | 4 | Y | 3 | Y | 0.1 | 0.35 | 0.92 | 0.85 | 30 | 30 |
| 4ETQ | 226 | 186 | 22 | 4 | Y | 3 | Y | 0.45 | 0.57 | 0.96 | 0.94 | 30 | 30 |
| 4G3Y | 157 | 114 | 12 | 3 | Y | 4 | Y | 0.35 | 0.12 | 0.94 | 0.86 | 30 | 30 |
| 4G6J | 158 | 109 | 13 | 3 | Y | 3 | Y | 0.57 | 0.15 | 0.97 | 0.85 | 30 | 30 |
| 4I3S | 190 | 163 | 23 | 4 | Y | 4 | Y | 0.05 | 0.09 | 0.81 | 0.82 | 30 | 30 |
| 4JZJ | 252 | 210 | 18 | 4 | Y | 6 | Y | 0.31 | 0.25 | 0.95 | 0.33 | 30 | 30 |
| 4KI5 | 183 | 108 | 7 | 1 | Y | 1 | Y | 0.39 | 0.29 | 0.95 | 0.93 | 24 | 20 |
| 4L5F | 111 | 79 | 9 | 2 | Y | 3 | Y | 0.52 | 0.1 | 0.97 | 0.8 | 30 | 30 |
| 4LVH | 223 | 184 | 13 | 5 | Y | 6 | N | 0.12 | 0.05 | 0.93 | 0.9 | 30 | 29 |
| 4M62 | 155 | 105 | 6 | 2 | Y | 2 | N | 0.12 | 0.11 | 0.92 | 0.81 | 24 | 24 |
| 4NP4 | 272 | 230 | 25 | 3 | Y | 5 | Y | 0.09 | 0.07 | 0.96 | 0.67 | 30 | 30 |
| 4RGO | 226 | 187 | 17 | 3 | N | 6 | Y | 0.16 | 0.21 | 0.97 | 0.96 | 30 | 30 |
| 5D96 | 235 | 198 | 22 | 4 | Y | 4 | Y | 0.23 | 0.15 | 0.95 | 0.96 | 30 | 30 |
| Average | 162.88 | 122.52 | 16.48 | 3.30 | 3.18 | 0.33 | 0.24 | 0.95 | 0.82 | 27.12 | 27.67 | ||
| STD | 57.57 | 51.53 | 5.54 | 1.19 | 1.21 | 0.21 | 0.18 | 0.03 | 0.13 | 4.53 | 3.55 | ||
Table 4
Ab modeling quality.
Antibody structures were generally highly accurately predicted both overall (average TM-score: 0.95) and for CDRs (all-backbone-atom, including N, C, Cα and O, RMSDs reported). Overall, non-CDR-H3 loops were very well predicted based on the canonical rules, and even for CDR-H3 loops the average RMSDs was <2 Å.
| Target | Species | CDR-L1 | L2 | L3 | H1 | H2 | CDR-H3 | TM-score | ||
|---|---|---|---|---|---|---|---|---|---|---|
| RMSD | Sequence | Length | ||||||||
| 1FE8 | MOUSE | 0.42 | 0.22 | 0.74 | 1.01 | 0.51 | 0.63 | AGNYYGMDY | 9 | 0.96 |
| 1FNS | MOUSE | 0.54 | 0.18 | 0.93 | 0.27 | 0.60 | 2.10 | VRDPADYGNYDYALDY | 16 | 0.96 |
| 1H0D | MOUSE | 1.43 | 0.57 | 0.42 | 0.44 | 1.11 | 0.66 | TRLGDYGYAYTMDY | 14 | 0.98 |
| 1LK3 | RAT | 0.41 | 0.43 | 0.52 | 0.57 | 1.51 | 1.00 | TRGVPGNNWFPY | 12 | 0.97 |
| 1OAZ | MOUSE | 1.15 | 0.44 | 0.88 | 1.30 | 0.56 | 1.25 | ARMWYYGTYYFDY | 13 | 0.97 |
| 1OB1 | MOUSE | 0.58 | 0.31 | 0.63 | 0.42 | 0.63 | 1.97 | ARNYYRFDGGMDF | 13 | 0.97 |
| 1RJL | MOUSE | 1.43 | 0.57 | 4.96 | 0.69 | 1.00 | 1.16 | ARMRYGDYYAMDN | 13 | 0.96 |
| 1V7M | MOUSE | 0.70 | 0.26 | 0.83 | 0.65 | 1.10 | 0.59 | SGWSFLY | 7 | 0.96 |
| 1YJD | MOUSE | 0.88 | 0.51 | 1.34 | 0.62 | 1.19 | 1.76 | TRSHYGLDWNFDV | 13 | 0.98 |
| 2ARJ | RAT | 0.71 | 0.67 | 1.12 | 0.46 | 0.70 | 0.65 | TPLIGSWYFDF | 11 | 0.97 |
| 2VXQ | HUMAN | 0.35 | 0.74 | 0.96 | 0.90 | 1.27 | 1.05 | ARLDGYTLDI | 10 | 0.89 |
| 2VXT | MOUSE | 0.47 | 0.37 | 1.14 | 0.45 | 0.53 | 0.43 | ARGLRF | 6 | 0.95 |
| 2XQB | HUMAN | 1.61 | 0.43 | 0.98 | 1.19 | 0.89 | 7.21 | ARDPAAWPLQQSLAWFDP | 18 | 0.92 |
| 3D9A | MOUSE | 0.40 | 0.61 | 1.18 | 0.99 | 1.88 | 0.51 | ANWDGDY | 7 | 0.93 |
| 3HI1 | HUMAN | 0.80 | 0.86 | 0.83 | 0.61 | 0.44 | 1.25 | ARGPVPAVFYGDYRLDP | 17 | 0.97 |
| 3L5X | HUMAN | 0.56 | 0.61 | 0.91 | 1.05 | 0.90 | 1.73 | ARMGSDYDVWFDY | 13 | 0.98 |
| 3MXW | HUMAN | 0.58 | 0.71 | 0.71 | 1.09 | 0.82 | 0.96 | ARDWERGDFFDY | 12 | 0.96 |
| 3QWO | HUMANIZED | 0.48 | 0.28 | 1.09 | 0.87 | 0.50 | 1.13 | ARDMIFNFYFDV | 12 | 0.96 |
| 3RKD | MOUSE | 0.62 | 0.42 | 0.52 | 1.06 | 0.65 | 1.45 | ARIKSVITTGDYALDY | 16 | 0.97 |
| 4DN4 | HUMAN | 2.11 | 0.37 | 1.58 | 1.64 | 2.40 | 2.36 | ARYDGIYGELDF | 12 | 0.92 |
| 4DW2 | MOUSE | 1.20 | 0.43 | 4.12 | 0.85 | 1.14 | 3.18 | ERGELTYAMDY | 11 | 0.92 |
| 4ETQ | MOUSE | 1.07 | 0.29 | 1.59 | 0.35 | 0.91 | 0.94 | TRSNYRYDYFDV | 12 | 0.96 |
| 4G3Y | CHIMERIC | 0.68 | 0.71 | 0.57 | 0.90 | 0.98 | 1.22 | SRNYYGSTYDY | 11 | 0.94 |
| 4G6J | HUMAN | 0.72 | 0.44 | 0.90 | 0.41 | 0.35 | 1.14 | ARDLRTGPFDY | 11 | 0.97 |
| 4I3S | HUMAN | 1.34 | 0.46 | 0.64 | 4.33 | 1.08 | 3.49 | ARQKFYTGGQGWYFDL | 16 | 0.81 |
| 4JZJ | HUMAN | 0.59 | 0.54 | 0.98 | 0.84 | 1.04 | 2.96 | ARSHLLRASWFAY | 13 | 0.95 |
| 4KI5 | MOUSE | 0.74 | 0.52 | 0.78 | 2.14 | 0.44 | 1.49 | AREDDGLAS | 9 | 0.95 |
| 4L5F | MOUSE | 0.76 | 0.42 | 1.03 | 0.49 | 0.94 | 1.83 | TKRINWALDY | 10 | 0.97 |
| 4LVH | MOUSE | 1.63 | 0.71 | 2.82 | 1.46 | 2.70 | 1.91 | ARHGSPGYTLYAWDY | 15 | 0.93 |
| 4M62 | HUMAN | 2.08 | 0.79 | 1.40 | 2.55 | 2.78 | 8.26 | AREGTTGSGWLGKPIGAFAY | 20 | 0.92 |
| 4NP4 | HUMAN | 2.21 | 0.87 | 2.84 | 0.88 | 0.55 | 1.53 | ARRRNWGNAFDI | 12 | 0.96 |
| 4RGO | MOUSE | 0.53 | 1.01 | 0.75 | 0.71 | 0.31 | 2.20 | VRDLYGDYVGRYAY | 14 | 0.97 |
| 5D96 | MOUSE | 0.74 | 0.57 | 0.53 | 0.62 | 0.89 | 3.43 | ASDSMDPGSFAY | 12 | 0.95 |
| Average | 0.92 | 0.52 | 1.25 | 0.99 | 1.01 | 1.92 | 0.95 | |||
| STD | 0.53 | 0.20 | 1.01 | 0.78 | 0.62 | 1.71 | 0.03 | |||
-
Table 4—source data 1
- https://doi.org/10.7554/eLife.29023.023
Table 5
The quality of Ag models and their template structures.
Failed cases are highlighted in red.
| Target | Template | Template chain | Seq. ID. | TM-score |
|---|---|---|---|---|
| 1FE8 | 3PPY | A | 28.09 | 0.84 |
| 1FNS | 4IGI | A | 24.73 | 0.86 |
| 1H0D | 3MWQ | A | 33.88 | 0.79 |
| 1LK3 | 4DOH | A | 27.94 | 0.74 |
| 1OAZ | 2PUK | C | 48.04 | 0.77 |
| 1OB1 | 1N1I | A | 49.44 | 0.85 |
| 1RJL | 2FKJ | C | 62.11 | 0.89 |
| 1V7M | 1CN4 | C | 23.74 | 0.78 |
| 1YJD | 1AH1 | A | 30.70 | 0.77 |
| 2ARJ | 4XMN | F | 26.26 | 0.75 |
| 2VXQ | 1N10 | A | 41.30 | 0.89 |
| 2VXT | 4XFS | A | 94.23 | 0.93 |
| 2XQB | 2PSM | A | 69.91 | 0.89 |
| 3D9A | 2EQL | A | 49.22 | 0.93 |
| 3HI1 | 2BF1 | A | 33.94 | 0.83 |
| 3L5X | 3BPO | A | 99.05 | 0.83 |
| 3MXW | 2IBG | B | 70.00 | 0.92 |
| 3QWO | 1EDK | A | 50.94 | 0.86 |
| 3RKD | 3RKC | A | 88.19 | 0.49 |
| 4DN4 | 3FPU | B | 41.67 | 0.88 |
| 4DW2 | 2ODQ | A | 25.94 | 0.85 |
| 4ETQ | 2ZNC | A | 30.56 | 0.94 |
| 4G3Y | 1TNR | A | 36.43 | 0.86 |
| 4G6J | 3NJ5 | A | 35.37 | 0.85 |
| 4I3S | 2B4C | A | 61.96 | 0.82 |
| 4JZJ | 4RS1 | A | 31.97 | 0.33 |
| 4KI5 | 4QDR | A | 44.97 | 0.93 |
| 4L5F | 2HG0 | A | 45.92 | 0.80 |
| 4LVH | 5BNY | A | 40.89 | 0.90 |
| 4M62 | 4GQX | A | 23.94 | 0.81 |
| 4NP4 | 2GJ6 | A | 35.86 | 0.67 |
| 4RGO | 5FKA | C | 34.23 | 0.96 |
| 5D96 | 3G6O | A | 80.77 | 0.96 |
| Average | 46.13 | 0.82 | ||
| STD | 21.06 | 0.13 |
Table 6
Success rates with epitopes defined according to IEDB or according to contacts in the binding interface.
Success is indicated as ‘T’ and failure as ‘F’. In test cases colored blue, EpiScope failed to find IEDB epitopes but did find binding interface residues.
| Target | Crystal structure | Model structure | Target | Crystal structure | Model structure | ||||
|---|---|---|---|---|---|---|---|---|---|
| IEDB | Interface | IEDB | Interface | IEDB | Interface | IEDB | Interface | ||
| 1FE8 | T | T | F | F | 3QWO | T | T | T | T |
| 1FNS | T | T | T | T | 3RKD | T | T | T | T |
| 1H0D | F | F | T | T | 4DN4 | T | T | T | T |
| 1LK3 | T | T | T | T | 4DW2 | T | T | T | T |
| 1OAZ | F | F | F | F | 4ETQ | T | T | T | T |
| 1OB1 | T | T | T | T | 4G3Y | T | T | T | T |
| 1RJL | T | T | T | T | 4G6J | T | T | T | T |
| 1V7M | T | T | T | T | 4I3S | T | T | T | T |
| 1YJD | T | T | T | T | 4JZJ | T | T | T | T |
| 2ARJ | T | T | T | T | 4KI5 | T | T | T | T |
| 2VXQ | T | T | T | T | 4L5F | T | T | T | T |
| 2VXT | T | T | T | T | 4LVH | T | T | F | T |
| 2XQB | T | T | T | T | 4M62 | T | T | F | T |
| 3D9A | T | T | T | T | 4NP4 | T | T | T | T |
| 3HI1 | F | F | F | F | 4RGO | F | T | T | T |
| 3L5X | T | T | T | T | 5D96 | T | T | T | T |
| 3MXW | T | T | T | T | Total | 29 (88%) | 30 (91%) | 28 (85%) | |
Table 7
Comparison of residues predicted by PEASE for TZ47 and PB11 to mutations included in disruptive EpiScope designs.
Residue score cut-off 0.43 was used for PEASE.
| Patch | Predicted patch residue positions | Patch score | Disruptive EpiScope design mutation positions |
|---|---|---|---|
| TZ47-Patch 1 | 158,159,160,161,162 | 0.41 | 154, 157, 217 (TZ47-Ag4) |
| TZ47-Patch2 | 158,160,161,162,163 | 0.4 | 154, 157, 216 (MULTI-4) |
| TZ47-Patch3 | 1,29,30,31,32 | 0.4 | |
| TZ47-Patch4 | 1,2,30,31,106 | 0.39 | |
| PB-Patch1 | 1,2,30,31,106 | 0.47 | 51, 52, 99 (PB-Ag2) |
| PB-Patch2 | 46,47,48,49,50 | 0.41 | 57, 84, 98 (MULTI-1) |
| PB-Patch3 | 158,160,161,162,163 | 0.4 | |
| PB-Patch4 | 195,196,197,198,203 | 0.38 | |
| PB-Patch5 | 123,124,125,126,139 | 0.38 |
Table 8
Comparison of predictive components of PEASE and EpiScope on retrospective test set of 33 non-redundant Ab-Ag pairs.
The number of designs needed/considered indicates the number of designs generated by EpiScope to cover all ClusPro docking models. An equivalent number of the top ranked PEASE patch predictions are considered for each Ab. Coloring highlights the cases in which Episcope (green) or PEASE (red) succeeded where the other method failed. Grey coloring indicates cases in which both methods failed.
| Target | Crystal structure of ag | Modeled structure of ag | ||||
|---|---|---|---|---|---|---|
| # of Designs Needed/Considered | # of EpiScopeDesigns Overlapping True Epitope | # of PEASE patches Overlapping True Epitope | # of Designs Needed/Considered | # of EpiScopeDesigns Overlapping True Epitope | # of PEASE patches Overlapping True Epitope | |
| 1FE8 | 4 | 2 | 4 | 3 | 0 | 0 |
| 1FNS | 5 | 2 | 5 | 2 | 1 | 2 |
| 1H0D | 3 | 0 | 0 | 2 | 1 | 0 |
| 1LK3 | 3 | 1 | 0 | 3 | 1 | 0 |
| 1OAZ | 2 | 0 | 2 | 2 | 0 | 2 |
| 1OB1 | 3 | 1 | 0 | 4 | 2 | 4 |
| 1RJL | 3 | 1 | 3 | 2 | 1 | 2 |
| 1 V7M | 6 | 1 | 0 | 3 | 1 | 2 |
| 1YJD | 2 | 1 | 0 | 3 | 1 | 0 |
| 2ARJ | 3 | 1 | 3 | 3 | 1 | 3 |
| 2VXQ | 3 | 1 | 3 | 3 | 1 | 3 |
| 2VXT | 3 | 1 | 3 | 3 | 1 | 3 |
| 2XQB | 2 | 1 | 2 | 3 | 1 | 3 |
| 3D9A | 3 | 1 | 0 | 2 | 1 | 0 |
| 3HI1 | 4 | 0 | 0 | 3 | 0 | 0 |
| 3L5X | 6 | 1 | 6 | 3 | 2 | 3 |
| 3MXW | 2 | 1 | 2 | 2 | 1 | 2 |
| 3QWO | 3 | 2 | 3 | 4 | 3 | 4 |
| 3RKD | 5 | 2 | 3 | 3 | 1 | 2 |
| 4DN4 | 2 | 1 | 0 | 2 | 1 | 0 |
| 4DW2 | 4 | 1 | 2 | 3 | 1 | 1 |
| 4ETQ | 4 | 1 | 1 | 3 | 1 | 1 |
| 4G3Y | 3 | 1 | 0 | 4 | 2 | 3 |
| 4G6J | 3 | 1 | 2 | 3 | 1 | 3 |
| 4I3S | 4 | 2 | 3 | 4 | 1 | 2 |
| 4JZJ | 4 | 1 | 0 | 6 | 4 | 0 |
| 4KI5 | 1 | 1 | 0 | 1 | 1 | 0 |
| 4 L5F | 2 | 1 | 0 | 3 | 1 | 0 |
| 4LVH | 5 | 1 | 0 | 6 | 0 | 2 |
| 4 M62 | 2 | 1 | 0 | 2 | 0 | 0 |
| 4 NP4 | 3 | 1 | 0 | 5 | 3 | 0 |
| 4RGO | 3 | 0 | 2 | 6 | 1 | 3 |
| 5D96 | 4 | 1 | 0 | 4 | 1 | 0 |
Additional files
-
Source code 1
TINKER minimization key file.
- https://doi.org/10.7554/eLife.29023.038
-
Source code 2
OSPREY configuration files.
- https://doi.org/10.7554/eLife.29023.039
-
Supplementary file 1
PyMol session file for an example of 2VXT as shown in Figure 1.
- https://doi.org/10.7554/eLife.29023.040
-
Supplementary file 2
PyMol session file for B7H6 binding disruptive designs against TZ47 and PB11.
- https://doi.org/10.7554/eLife.29023.041
-
Supplementary file 3
Full sequences of TZ47, PB11, and all B7H6 variants.
- https://doi.org/10.7554/eLife.29023.042
-
Transparent reporting form
- https://doi.org/10.7554/eLife.29023.043
Download links
A two-part list of links to download the article, or parts of the article, in various formats.
Downloads (link to download the article as PDF)
Open citations (links to open the citations from this article in various online reference manager services)
Cite this article (links to download the citations from this article in formats compatible with various reference manager tools)
Computationally-driven identification of antibody epitopes
eLife 6:e29023.
https://doi.org/10.7554/eLife.29023


