Kinesin motility is driven by subdomain dynamics
- Texas A&M University, United States
- Korea Institute for Advanced Study, Korea
- Vanderbilt University, United States
- Vanderbilt University School of Medicine, United States
- Harvard University, United States
- ISIS, Université de Strasbourg, France
Figures
Figure 1 with 1 supplement
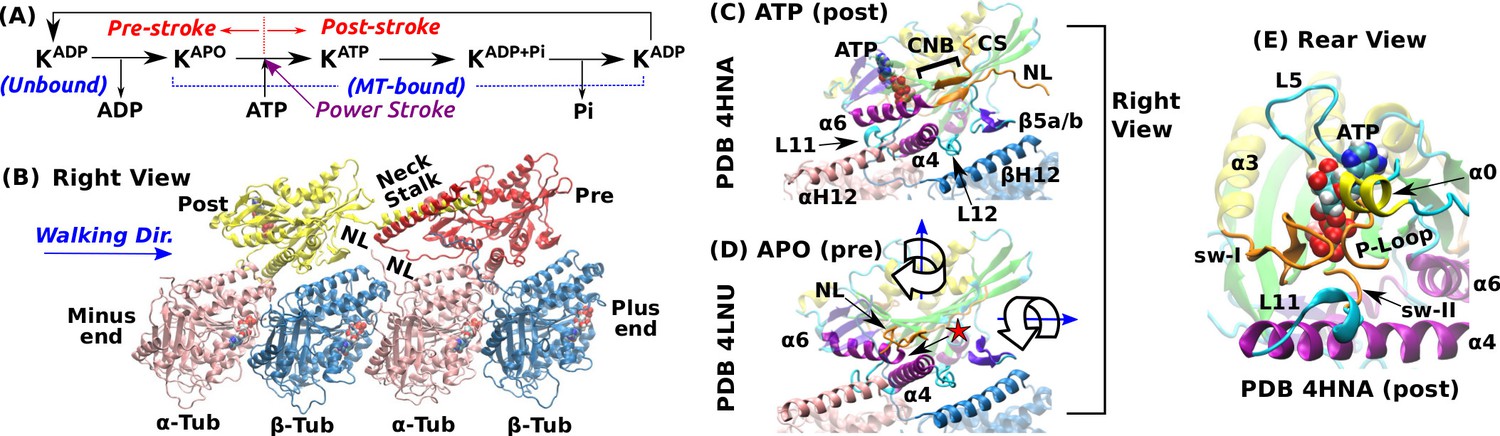
Overview of kinesin structure and motility cycle.
(A) Diagram of the ATPase cycle of a motor head. Binding of an ATP triggers the conformational change to the post-stroke state. (B) Model of a kinesin dimer bound to the MT. The rear and front heads are in the post- and pre-stroke states, respectively. The neck linker (NL) connects the C-terminal end of the motor head to the -helical neck stalk. (C,D) Comparison between (C) post- (Gigant et al., 2013) and (D) pre-stroke (Cao et al., 2014) states, defined based on the orientation of relative to . CS: cover strand. H12/H12: C-terminal helices of -/-tubulins that form major contacts with kinesin, mainly with L11, , L12, and (also called L8). In the pre-stroke state, shortens and its C-terminal end connecting to the NL is positioned behind (red star). This is coupled with the rightward tilting and clockwise rotation about the vertical axis of the motor head (wide arrows). (E) The ATP binding pocket. MT is not shown. Kinesin structures are compared in Supplementary file 1. A complete list of kinesin domain names are in Figure 1—figure supplement 1.
Figure 1—figure supplement 1
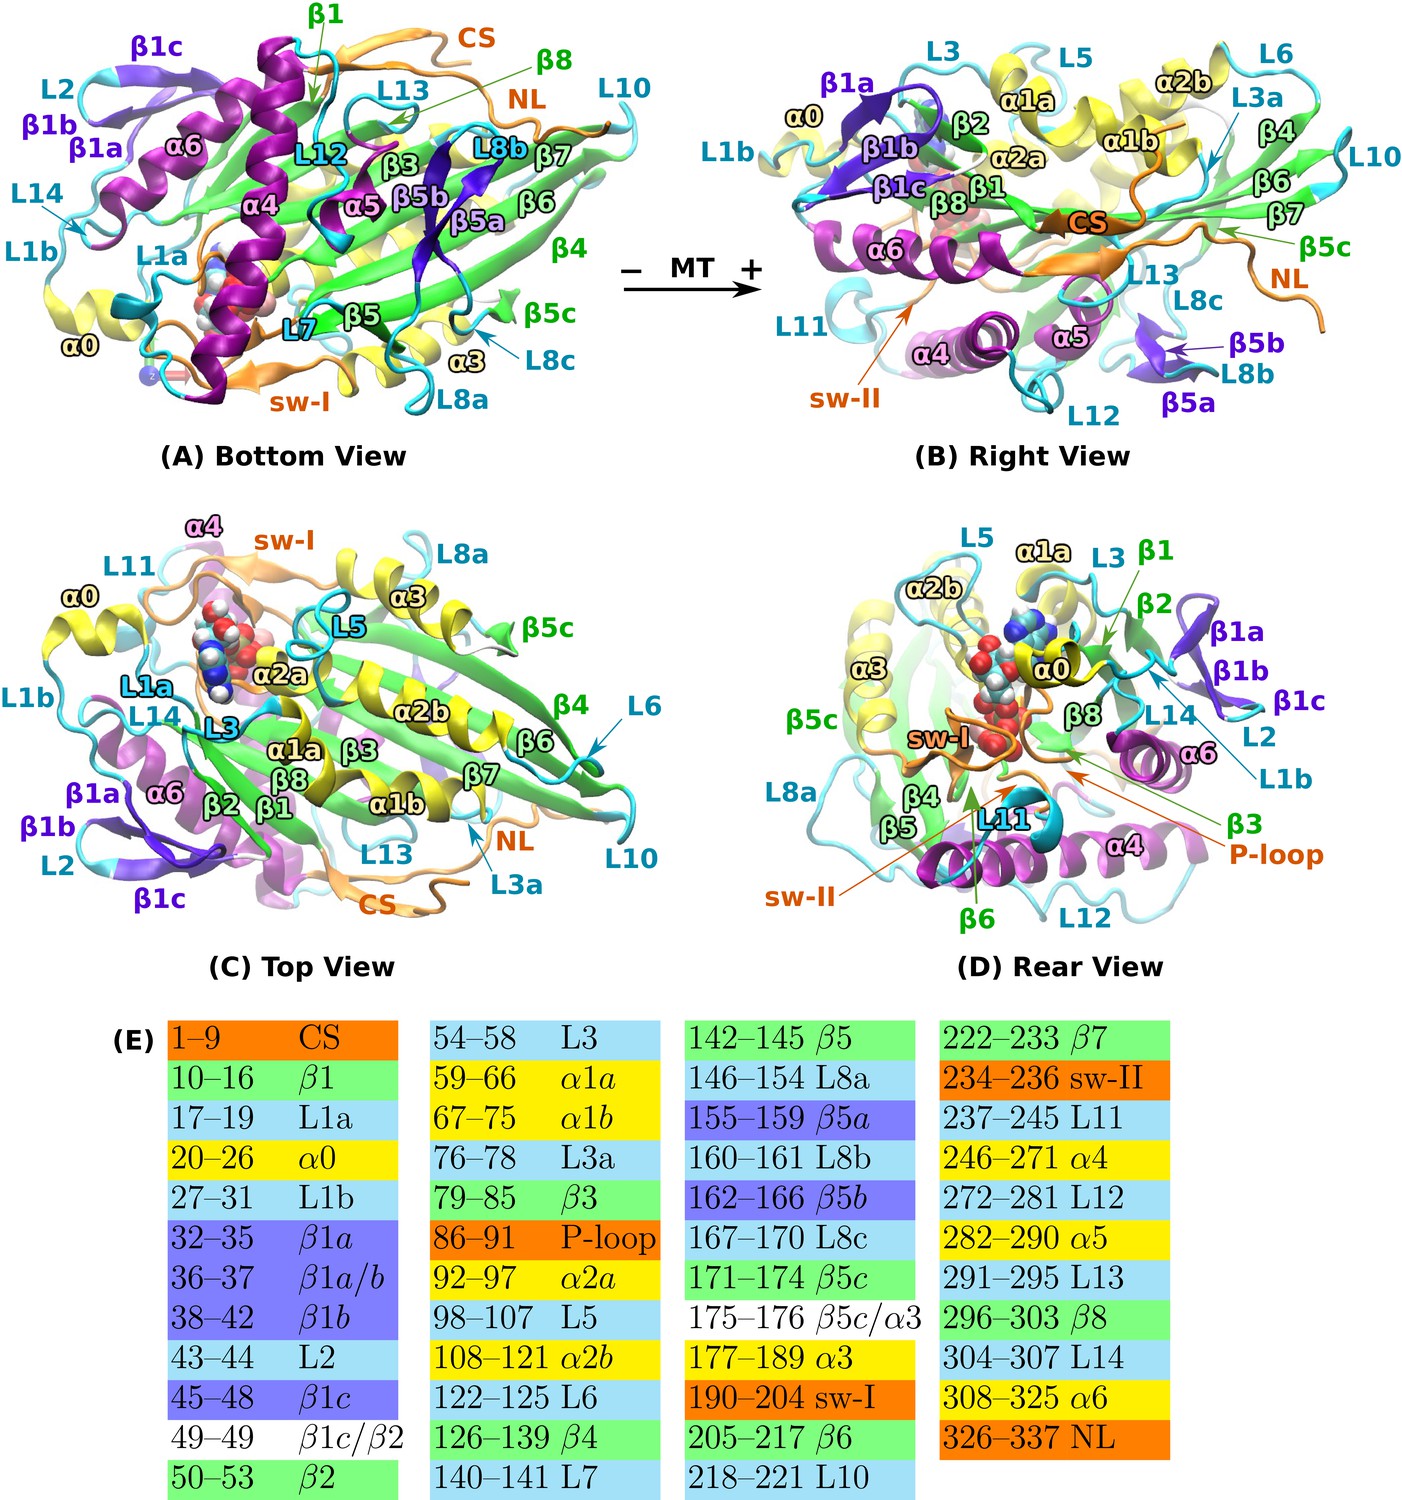
Structural overview of kinesin.
PDB 4HNA in the ATP state was used (Gigant et al., 2013). (A) Bottom view. (B) The view in (A) rotated by 90 about the horizontal axis. (C) The view in (A) rotated by 180 about the horizontal axis. (D) The view in (B) rotated by 120 about the vertical axis. In (A–C), MT plus end is approximately to the right. Bound ATP is in van der Waals representation. (E) Residue number range for each domain. Human kinesin sequence numbering was used. Colors match those in (A-D). Compared to the earlier naming of domains (Sack et al., 1997; Hwang et al., 2008), some of the domain names were refined to avoid ambiguity. For instance, we assign subdomains L1a/b, and L3a, as they are segmented. CS: cover strand (), P-loop (L4), sw-I: switch-I (encompasses L9 and ), sw-II: switch-II. We assign sw-II only to the conserved GSE residues immediately below ATP instead of considering the switch-II cluster that includes up to L12 (Hwang et al., 2008). NL: neck linker ( and ).
Figure 2 with 1 supplement
Conformational dynamics of the motor head.
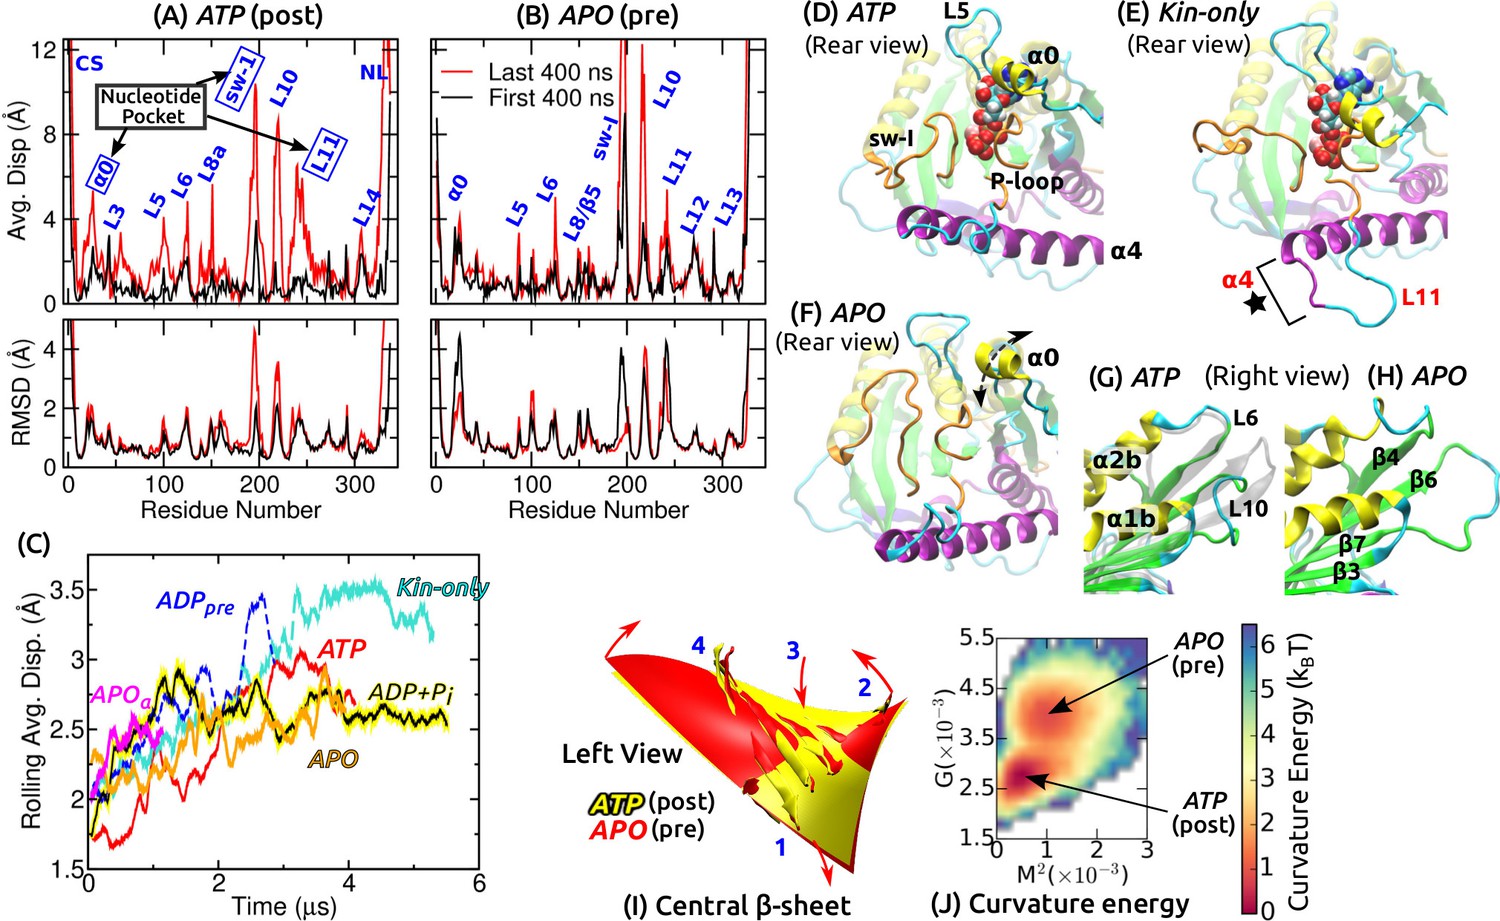
Related data for systems not shown here are in Figure 2—figure supplement 1. (A,B) Average displacement of C atoms from their initial positions (top row) and RMSD (bottom row) during the first/last 400 ns (black/red lines). The central -sheet of kinesin was used for alignment. Domain names are in Figure 1—figure supplement 1. (A) ATP and (B) APO. (C) Rolling average (100-ns window) of displacements of C atoms excluding the CS and NL. Only residues with displacements greater than 1 Å were considered. (D–F) Conformation of domains around the nucleotide pocket at the end of simulation (cf., Figure 1E). (D) ATP. Sw-I lost its pseudo -hairpin conformation. (E) Kin-only. N-terminal end of (star) and L11 also unfolded. (F) APO. Direction of motion of is marked by a dashed arrow. (G,H) Unfolding of the front end of the motor head. (G) ATP. The initial structure is shown in transparent gray, for comparison. (H) APO. (I) Curvature of the central -sheet in ATP (yellow) and APO (red). Surfaces take the average curvatures in respective simulations. A higher saddle-point (Gaussian) curvature in APO can be seen by the greater bending of the corners 1, 3 and 2, 4 in opposite directions (arrows). (J) Combined energy landscape parameterized by the mean () and Gaussian () curvatures of the central -sheet.
Figure 2—figure supplement 1

Conformational behavior of the motor head.
(A–D) Average displacement of C atoms from their initial positions (top row) and RMSD (bottom row) during the first/last 400 ns (black/red lines). (cf., Figure 2A,B) (E,F) Structure of the nucleotide pocket at the end of simulation (cf., Figure 2D–F). (E) ADP+Pi, and (F) APO where sw-I maintains -helical structure. (G–J) Unfolding of the front end of the motor head at the end of simulation (cf., Figure 2G,H). (K) Free energy landscape parameterized by the mean () and Gaussian () curvatures of the central -sheet. Numbers below each graph are average and standard deviation (in parentheses) of and .
Figure 3 with 1 supplement
Mobility of kinesin on the MT.
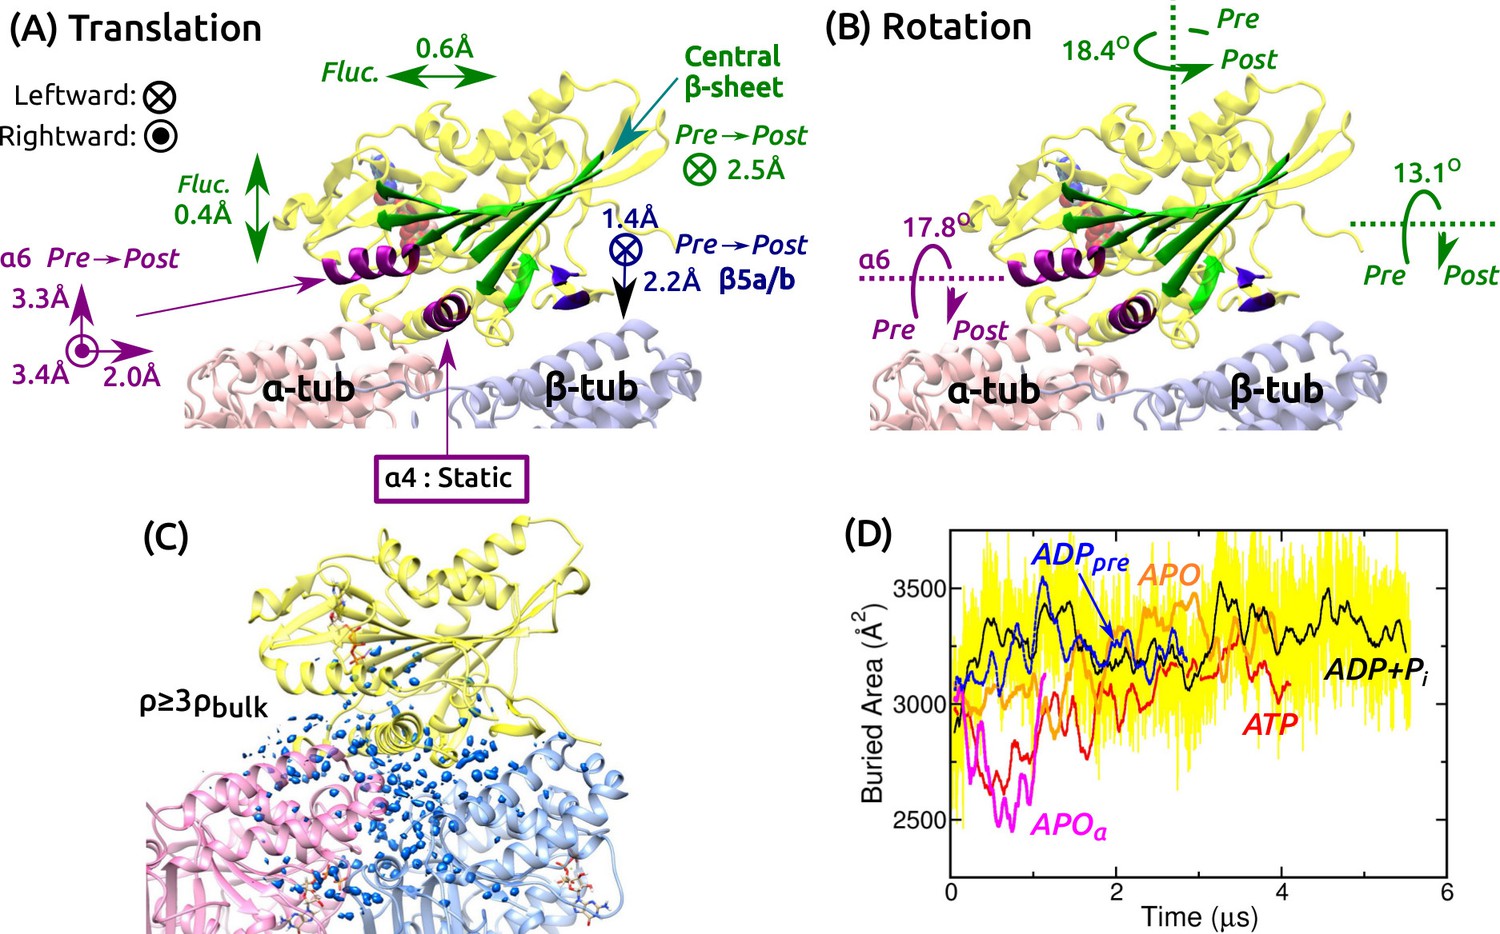
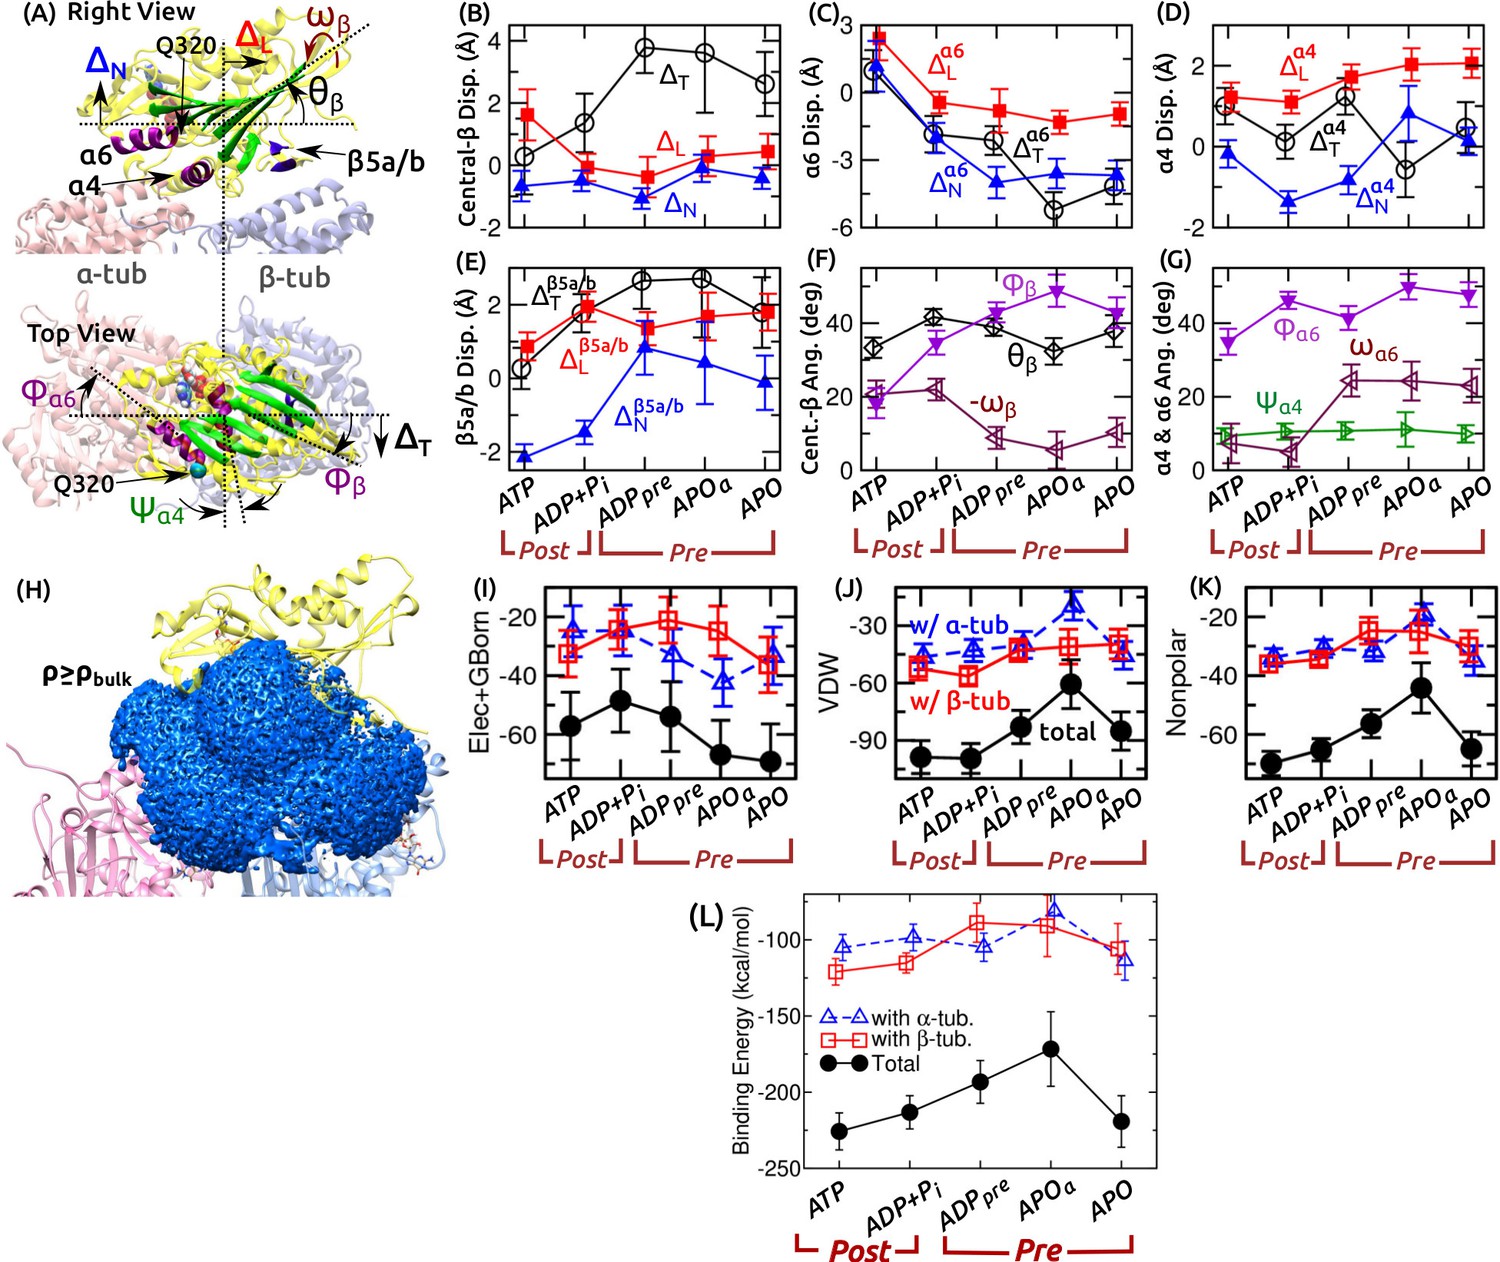
(A,B) Summary of translational and rotational motion. See Figure 3—figure supplement 1A–G for detailed analysis. Direction and magnitude of (A) translation and (B) rotation of major domains between pre- and post-stroke states. (C) Hydration of the kinesin-MT interface. Blue blobs: regions where water density is higher than three times the bulk value. The hydration shell at cutoff equal to the bulk density is in Figure 3—figure supplement 1H. (D) Trajectory of buried area between kinesin and the MT (100-ns rolling average). Yellow: raw data for ADP+Pi, revealing large fluctuation. Raw data for other simulations fluctuate with comparable magnitude.
Figure 3—figure supplement 1
Flexibility of the kinesin-MT interface.
(A) Definition of displacements (denoted by ) and angles. Longitudinal (), normal (), and transverse () displacements of the central -sheet are shown. Displacements of , Q320 of , and are similarly defined. For orientation, forward tilt (), transverse tilt (), and azimuthal () angles of the central -sheet were measured. For , the angle is relative to the transverse direction. For , the transverse tilt () and azimuthal () angles were measured. (B–G) Average and RMSD of the measured quantities relative to the first frame of ATP during the last 500 ns of each simulation. (B–E) Translation, (F,G) Rotation. In (B), translation of was measured using Q320 on its C-terminal end. Notable differences between pre- and post-stroke states are summarized in Figure 3A,B. In (F), the sign of is inverted for the plot. It increases in the pre-stroke state, similar to in (G). (H) Water density map (blue) near and MT. Last 500 ns of ATP was used for calculation. A density cutoff of 0.033 Å(bulk density) was used for visualizing the map. Compare with Figure 3C. (I–K) Decomposition of the binding energy between kinesin and tubulin (in kcal/mol units). (I) Combined electrostatic interaction and the generalized-Born solvation free energy. (J) van der Waals energy, (K) Nonpolar energy, which approximately follows the van der Waals profile. (L) The net binding energy (sum of the energies in (I–K)) between kinesin and -tubulin (triangle), -tubulin (square), and together (solid circle). More negative energy indicates stronger binding. Note that conformational entropy is not included in the energy calculation.
Figure 4 with 1 supplement
Contact analysis.
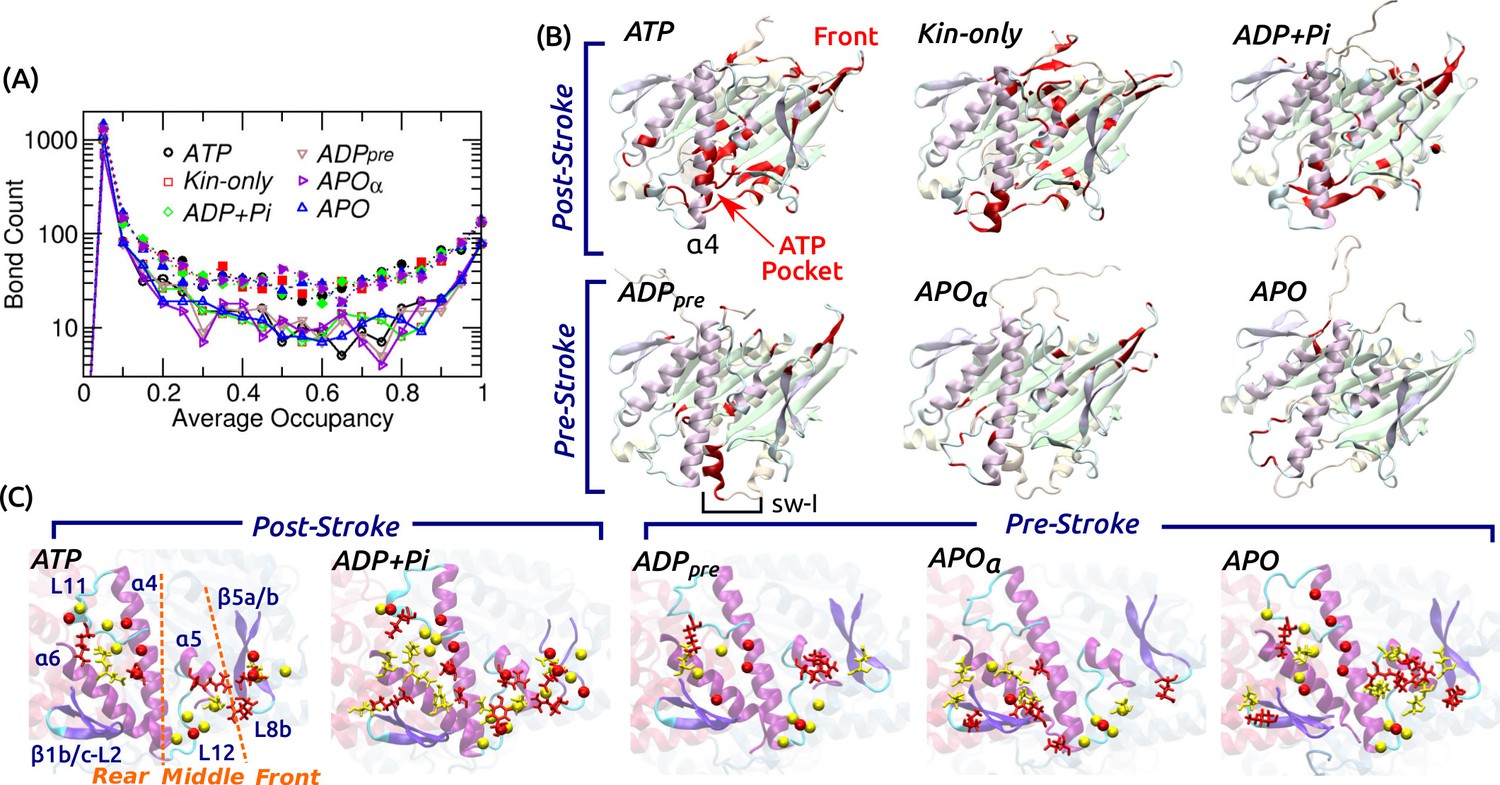
(A) Occupancy distribution of intra-kinesin contacts. Filled symbols: nonpolar contacts. Open symbols with solid lines: H-bonds. Figure 4—figure supplement 1A shows examples of occupancy trajectories. (B) Locations of intra-kinesin contacts that broke or formed during simulation (colored red). Bottom view. See Supplementary file 2 for the list of contacts and their transition times. Cumulative numbers of contacts formed or broken over time are in Figure 4—figure supplement 1B. Post-stroke states involve more contacts formed or broken, mainly around the ATP pocket and the front end of the motor head. The first frame of each simulation was used for visualization. In APO, the frontal part of the motor head was unstable from the beginning of the simulation, thus no clear contact changes were identified. (C) Residues forming kinesin-MT contacts with higher than 80% occupancy. Top view. For kinesin, only MT-facing domains are shown. Red: kinesin residues, yellow: MT residues. Stick: residues forming H-bonds, sphere: residues forming nonpolar contacts. In ATP, the three contact positions (rear, middle, front) are marked. Post-stroke states have more contacts with the front part. Supplementary file 3 lists individual kinesin-MT contacts.
Figure 4—figure supplement 1
Dynamics of intra-kinesin and kinesin-MT contacts.
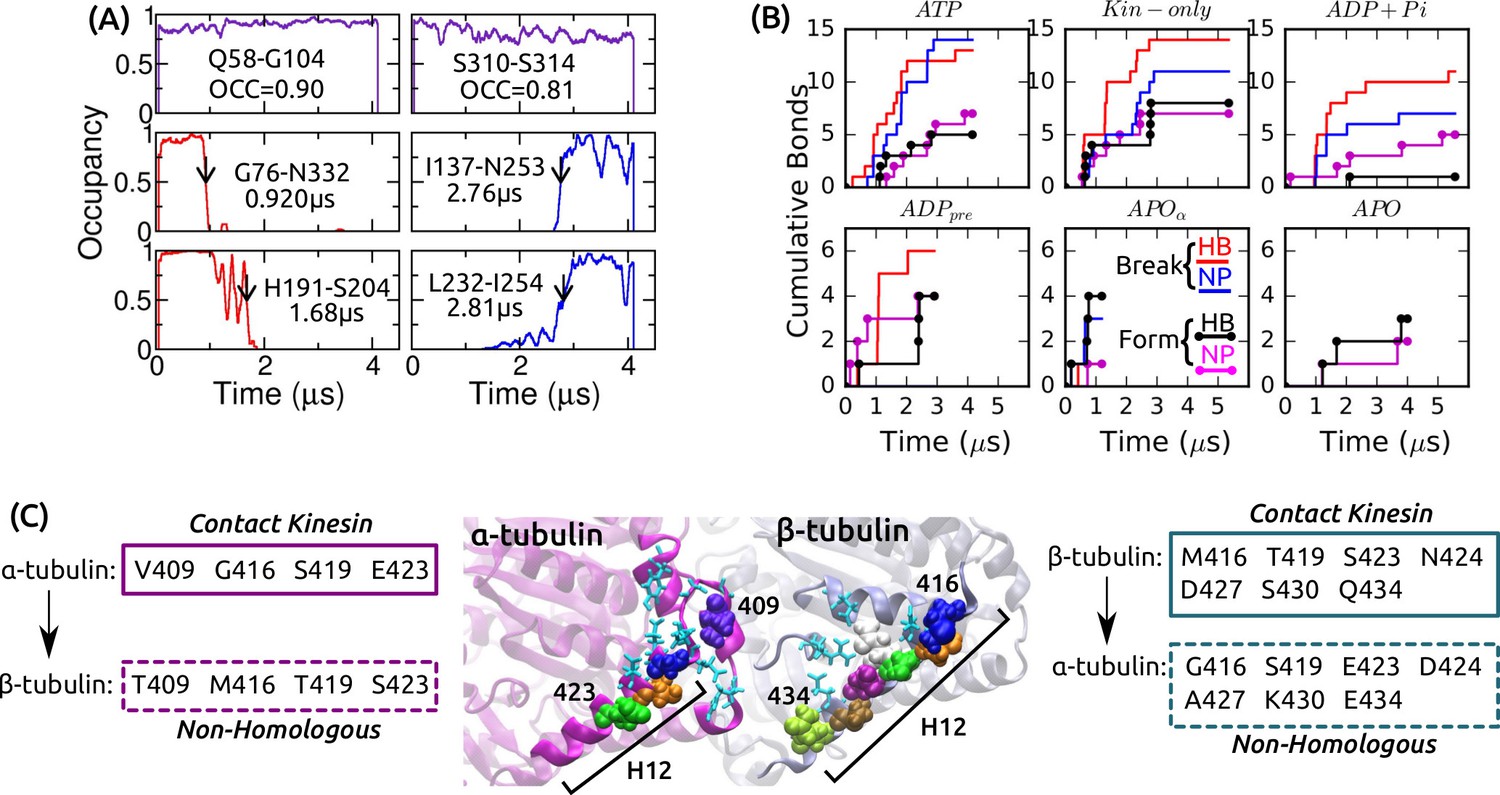
(A) Example contact occupancy trajectories in ATP. Top row: H-bonds that maintain contact throughout the simulation. ‘OCC’: Average occupancy. Middle/bottom: H-bonds/nonpolar contacts that break or form. Identified transition times are marked by arrows and are also shown (cf., Supplementary file 2A). (B) Cumulative numbers of intra-kinesin contacts that break or form during each simulation. (C) Comparison between residues of - and -tubulins making contact with kinesin. Homologous residues between the two tubulins are in light-blue, stick representation. Non-homologous residues are in van der Waals representation. Boxes: list of tubulin residues that contact kinesin (solid boxes) which have non-homologous counterparts in the other tubulins (dashed boxes). Seven out of nine residues in H12 of -tubulin that contact kinesin are different from those of -tubulin, highlighting their importance in discriminating between - vs. - surfaces by kinesin.
Figure 5 with 2 supplements

Mobility of sw-I in nucleotide processing.
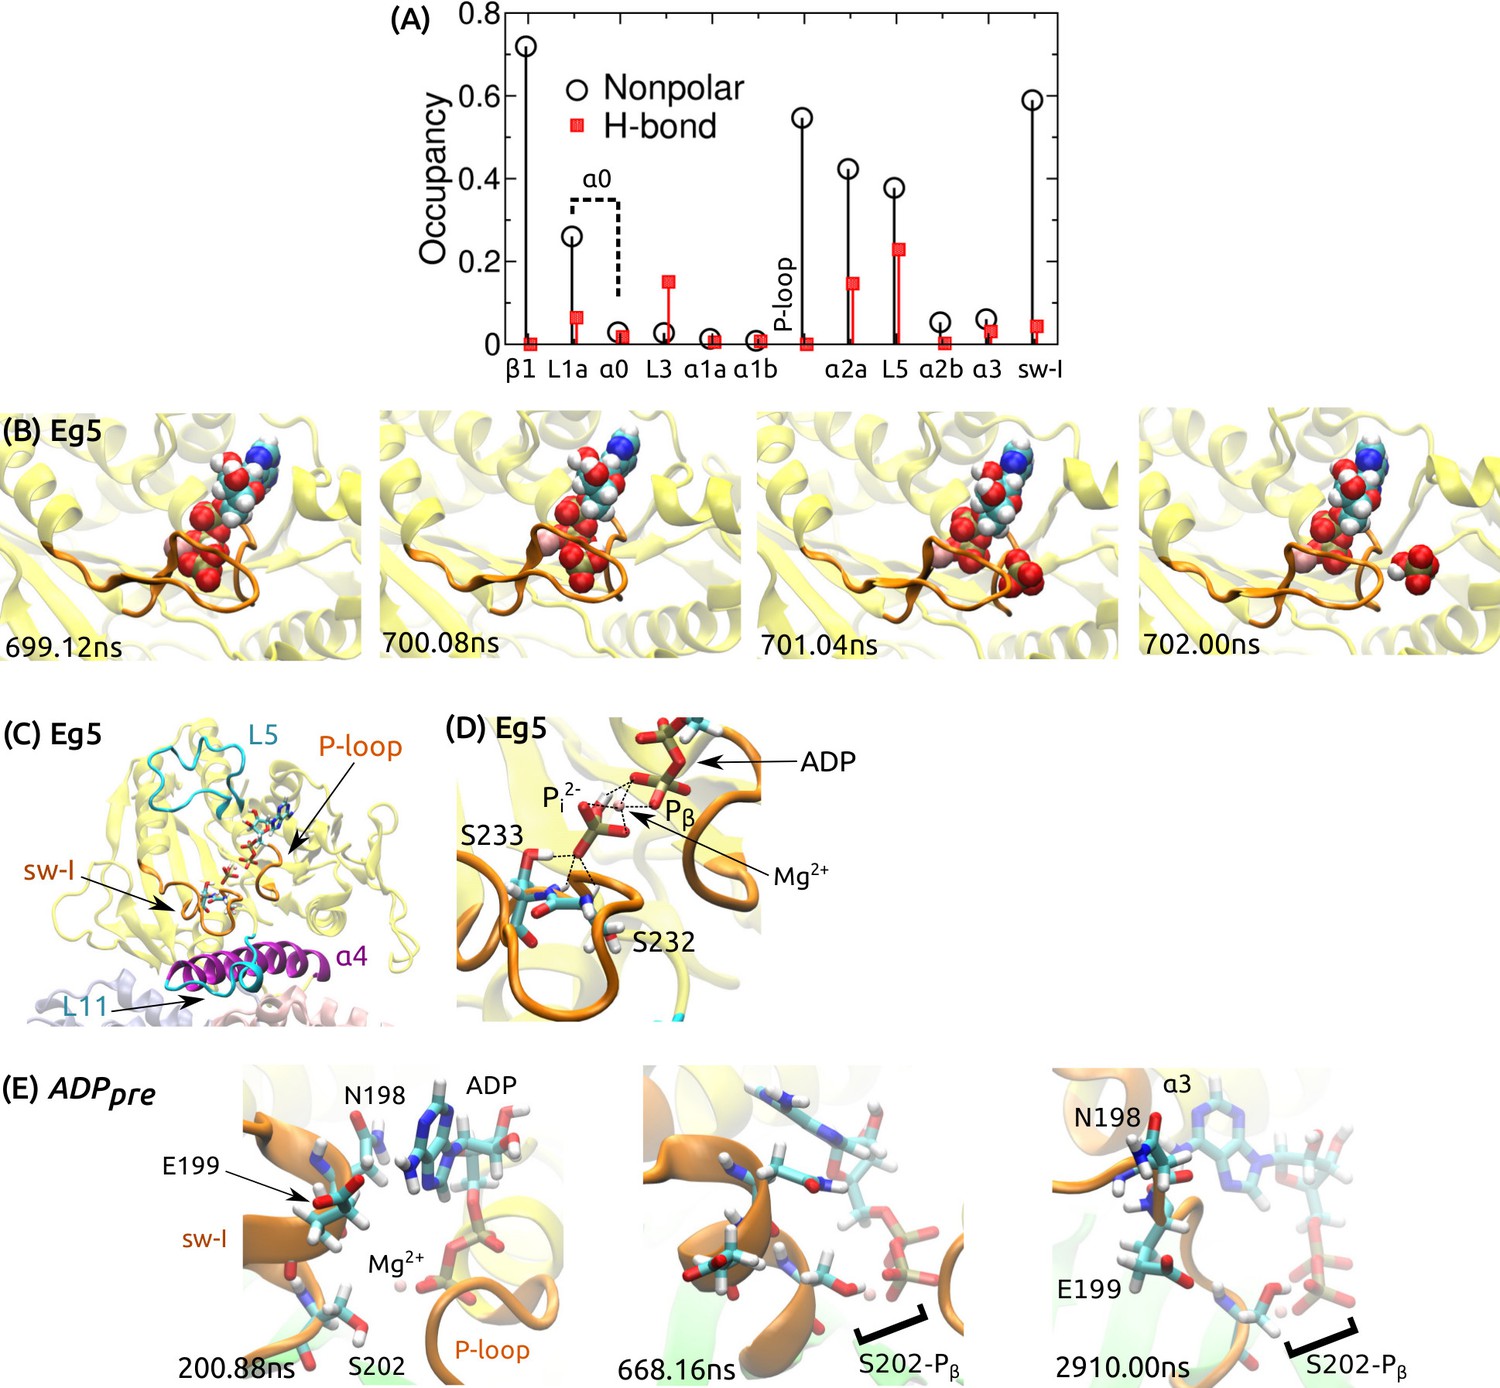
(A) Unfolding of the sw-I hairpin in ATP (Video 1 and Figure 5—figure supplement 1A). Residues forming backbone H-bonds in the initial hairpin, and the rotation of are marked. (B) Occupancy trajectories of contacts for the hairpin in ATP. (C) Orientational angle of measured relative to the first frame of ATP. Red arrow: approximate time at which the sw-I hairpin unfolds. (D) Capturing ATP in the APO state by the ‘/L5/sw-I trio’ (a 2.04-s simulation; Video 2). 960 ns: Adenosine ring is close to its position in the bound state, but the phosphate moiety points outward (star). 1608 ns: Spontaneous formation of an -helical turn in sw-I is visible. 2040 ns: ATP is positioned behind L5. Major domains that made contacts with the moving ATP are labeled (Figure 5—figure supplement 2A). (E) P release in ADP+Pi (Video 3; Figure 5—figure supplement 2B shows P release in Eg5). Box: Magnified view of P in contact with ADP. At 739.92 ns, sw-I pulls P out (arrow), after which it snaps back (arrow in 740.88 ns). (F) ADP release in ADP (Video 4). Sw-I in an -helical conformation turns and contacts ADP (200.88 ns). Outward rotation of sw-I moves ADP out of P-loop (668.16 ns). Later, sw-I loses its -helical conformation (star in 2910 ns). A magnified view is in Figure 5—figure supplement 2E.
Figure 5—figure supplement 1

Deformability of the sw-I hairpin.
(A) Rear view of the structure in Figure 5A. Residues making nonpolar contacts with ( and the central -sheet) are in van der Waals representation (orange: 0 ns, yellow: 4.16 s). The only noticeable change in contact accompanying the rotation of is hydrogen bonds with R190, which changes contact from D231 to E136. R190-D231 breaks in all simulations of post-stroke states. R190-E136 also forms in ADP+Pi (Supplementary file 2C), and it has high occupancy in all pre-stroke states (89.7–99.5%). This further supports that has a tendency to rotate outward, which will impede formation of the sw-I hairpin. (B–E) Crystal contacts for the sw-I hairpin in different kinesin structures. In each panel, the left side shows kinesin subunits (gray) that make contact with sw-I (purple) of the yellow subunit. The right side is a zoom-in view of the boxed area. (B) PDB 4HNA, used for ATP. R190 at the N-terminal end of sw-I where the hairpin opening initiates, is stabilized by a lysine in the neighboring tubulin. (C) PDB 1I6I (2.00 Å resolution) (Kikkawa et al., 2001), (D) PDB 3ZFC (1.80 Å) (Chang et al., 2013), (E) PDB 3HQD (2.19 Å) (Parke et al., 2010). In addition to the gray subunit, the green subunit makes additional contact with sw-I. (F) PDB 1VOM (1.90 Å), a pre-stroke myosin structure (Rayment et al., 1993). Sw-I in the hairpin conformation makes extensive contacts with residues in the upper 50 kDa domain (U50; gray stick representation). Also note similarity to kinesin in the arrangements of the P-loop, sw-II and the relay helix that corresponds to kinesin’s . (G) PDB 1VFV (1.85 Å) (Nitta et al., 2004). The partially visible sw-I does not have any crystal contact. A rear view of the nucleotide pocket is shown on the right. The C-terminal side of sw-I maintains contact with ATP, consistent with our simulation.
Figure 5—figure supplement 2
ATP processing in Kin-1 and Eg5.
(A) Contact occupancy between the moving ATP and kinesin domains during the simulation shown in Figure 5D. L1a is located at the N-terminus of , which we collectively call as . (B) P release during a 2.04-s simulation of Eg5 (Kin-5) bound to MT (PDB 4AQV) (Goulet et al., 2012), with ATP converted to ADPP. P exits rearward from the nucleotide pocket (cf., Figure 5E; Video 3). (C) The last frame of a 3.72-s simulation of PDB 4AQV where HPO (P) instead of the monovalent P was used. P did not release. (D) Magnified view of (C), showing extensive contacts that P forms with Mg, P of ADP, and S232/S233 of sw-I’s SSR motif (dotted lines; residue numbering follows that of Eg5). (E) Magnified view of the ADP release process in Figure 5F. At 200.88 ns, the adenosine ring of ADP forms a transient nonpolar contact with N198 of sw-I. At 668.16 ns, in addition to the nonpolar contact between sw-I and ADP, S202 forms a H-bond with an oxygen atom (red) of P. Contact with S202 is also present at the end of the simulation (2910 ns), where the adenosine ring forms a nonpolar contact with .
Figure 6
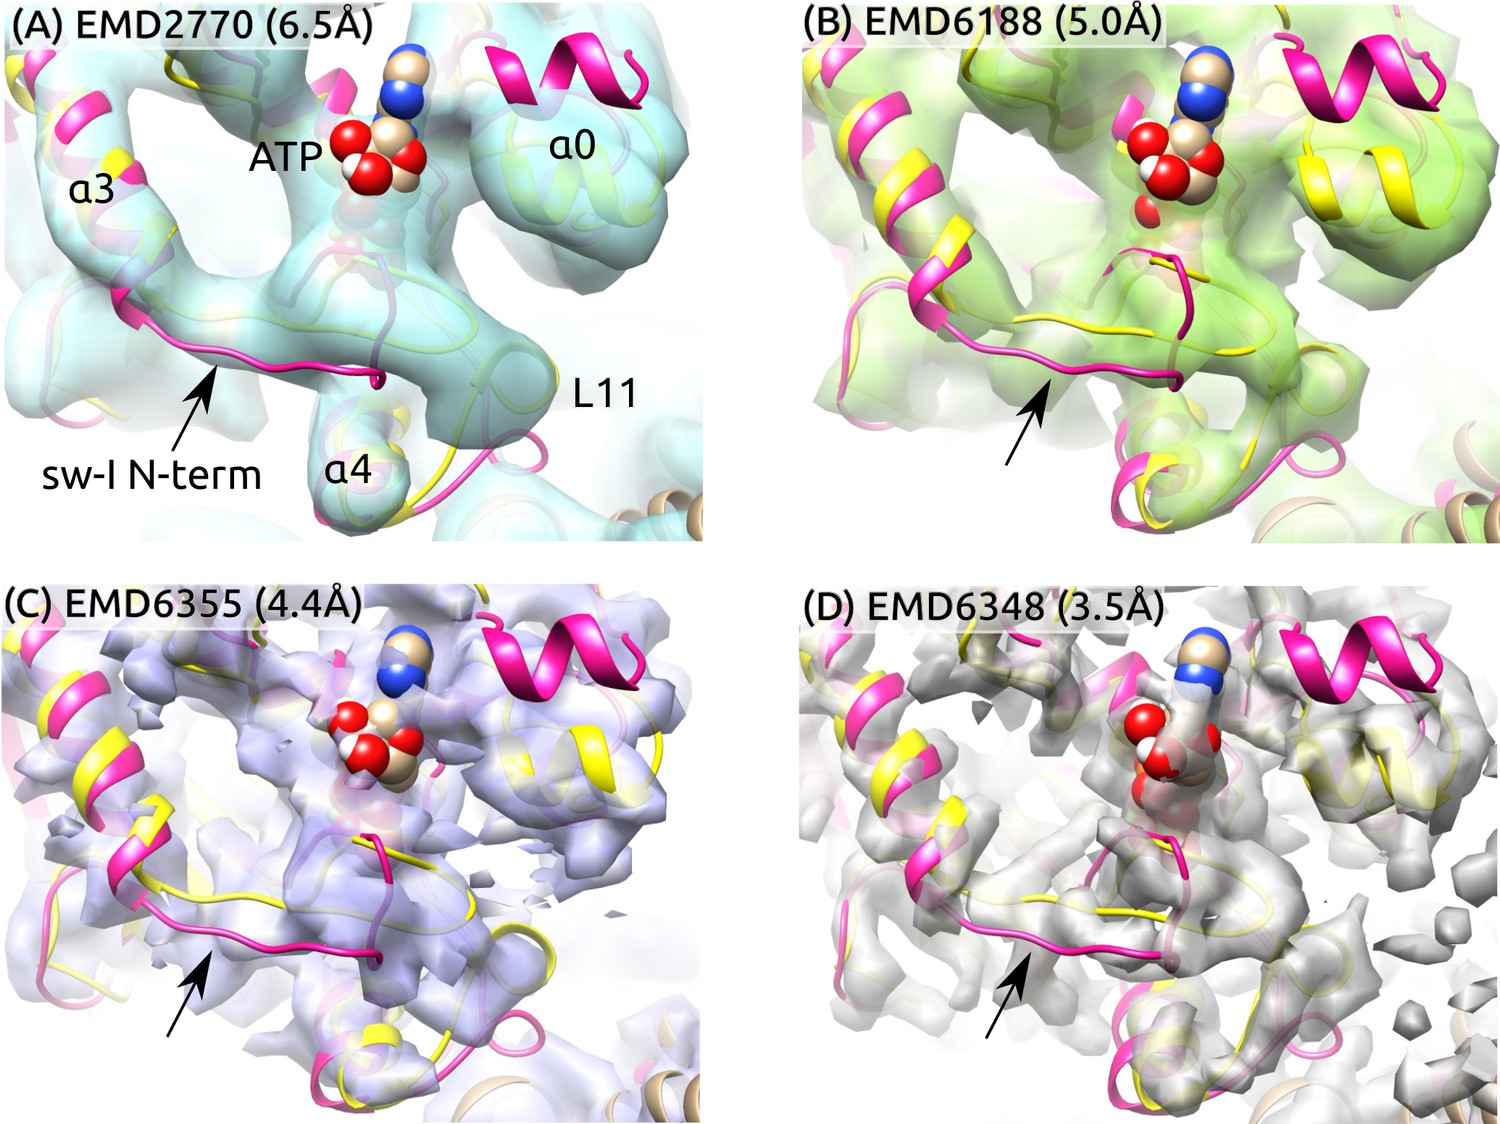
Sw-I conformation in cryo-EM structures of the ATP-state kinesin-MT complexes.
Yellow/magenta ribbons: Initial structure of ATP (PDB 4HNA) and structure at 3.79-s that has an unfolded sw-I. Compared to the C-terminal side, the N-terminal side of sw-I aligns less well with cryo-EM maps (arrows), consistent with its mobility in our simulation. References: (A) (Atherton et al., 2014), (B) (Shang et al., 2014), (C,D) (Zhang et al., 2015). Resolutions of the maps are shown in each panel.
Figure 7 with 1 supplement
ATP hydrolysis mechanism.
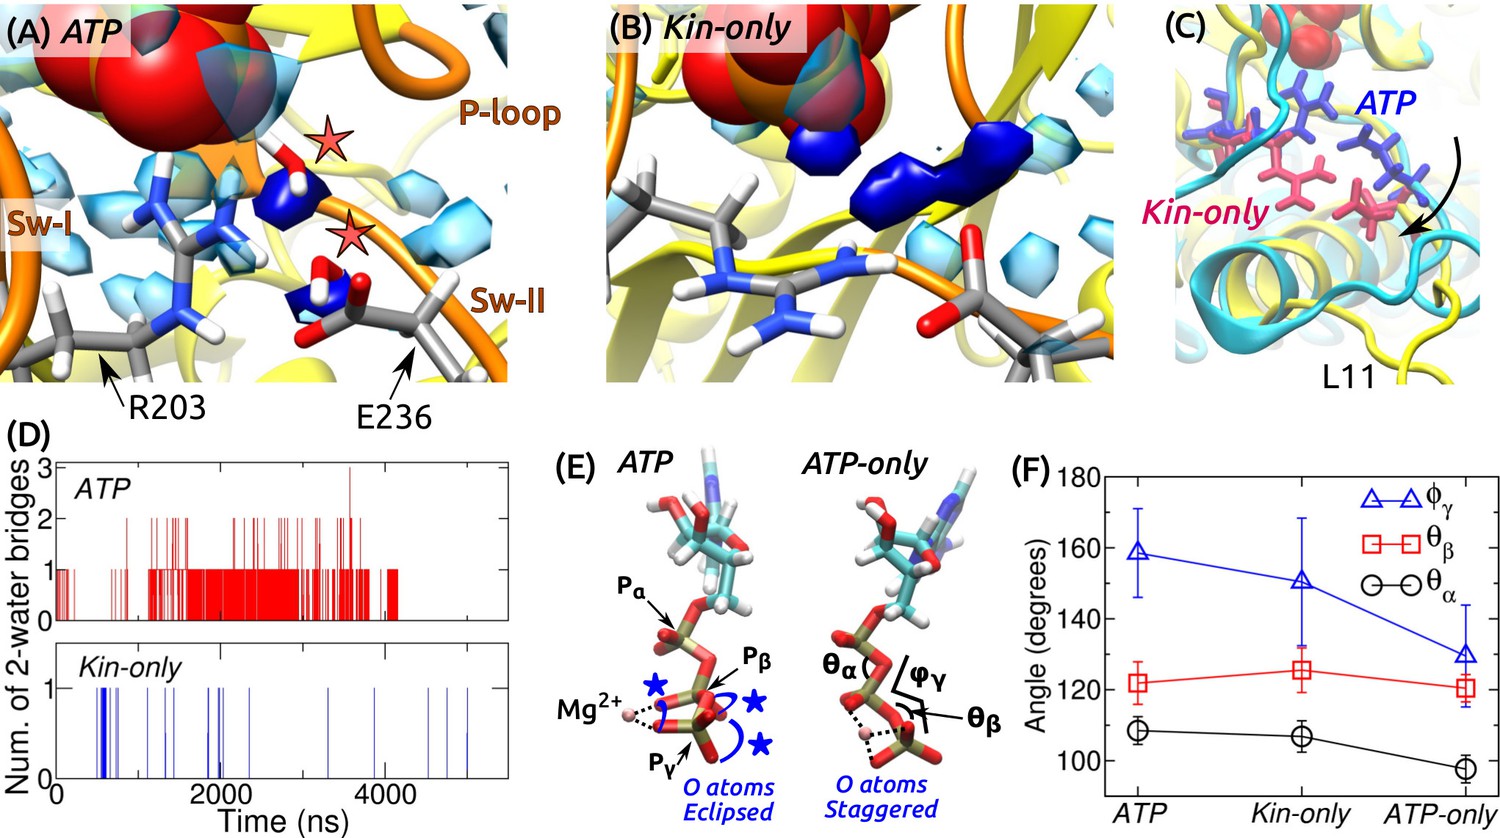
(A) Average water density map near P during the last 500 ns of ATP. Blobs in semi-transparent blue have water density greater than three times the bulk density (cf., Figure 3C). Densities for two catalytic water molecules bridging between P and E236 are in dark blue. A coordinate frame where the two-water bridge is present is displayed, with the catalytic water molecules marked by stars. (B) Water density map for Kin-only. The density close to E236 is broader. (C) Alignment of the structures in (A) (cyan) and (B) (yellow). R203/E236 are in blue (ATP) and red (Kin-only). In Kin-only, downward movement of L11 leads to lowering of R203-E236 (arrow). (D) Number of 2-water bridges between P and E236 during respective simulations. (E) Conformations of Mg-ATP at the end of ATP and ATP-only. Mg forms bidentate (ATP) and tridentate (ATP-only) contacts with O atoms (dotted lines). O atoms of P and P are eclipsed in ATP (blue stars), whereas they are staggered in ATP-only. (F) Angles defined in (E) (avgstd). The dihedral angle reflects the eclipsed vs. staggered states.
Figure 7—figure supplement 1
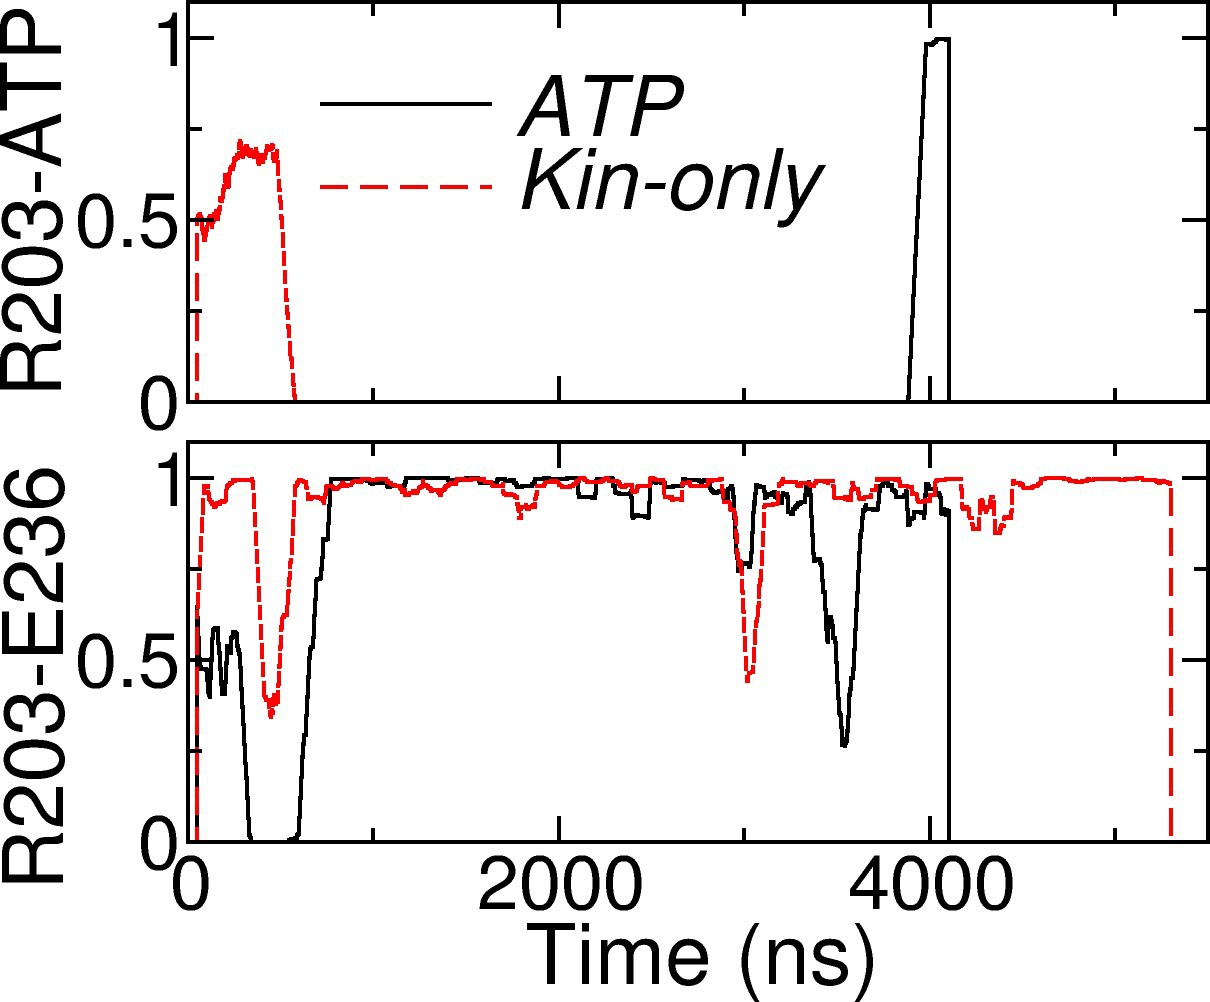
Contact occupancy trajectories of R203-ATP (top) and R203-E236 (bottom) in ATP and Kin-only.
The latter is the main contact between sw-I and sw-II (cf., Figure 7A,B).
Figure 8
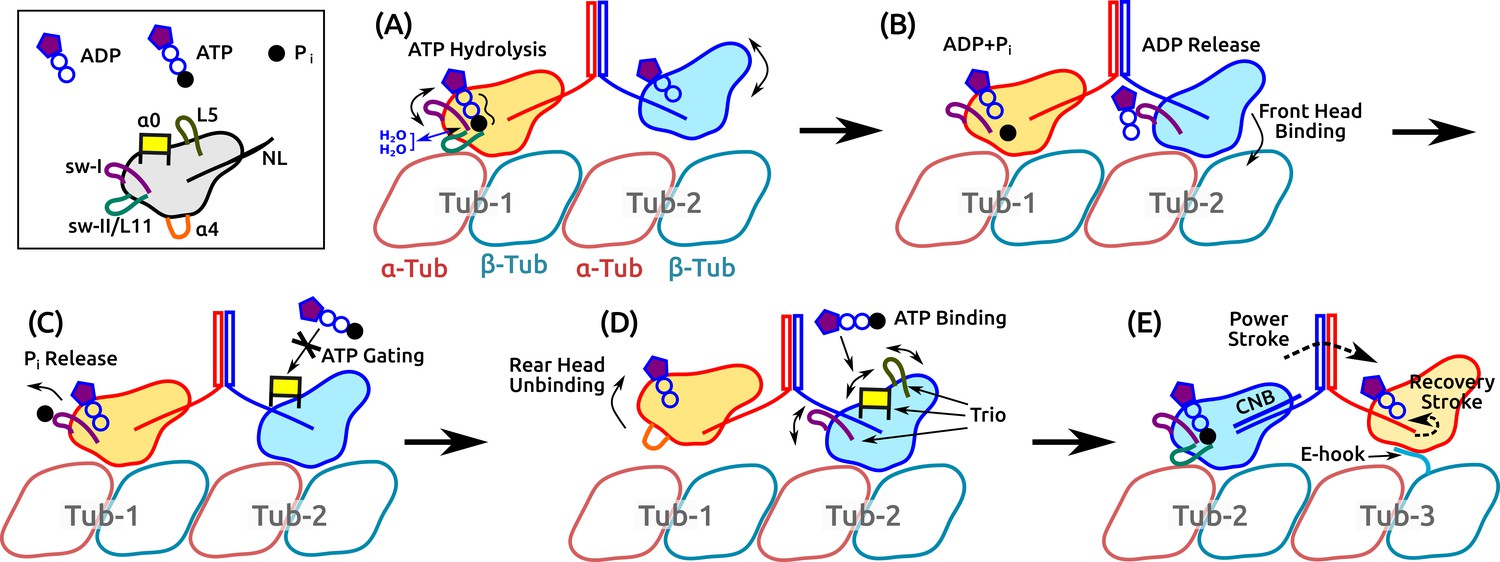
Motility of a Kin-1 dimer driven by subdomain dynamics.
Video 5 shows an overview of the process. In each panel, only relevant domains are shown. Tubulin dimers are labeled Tub-1–Tub-3. (A) ATP hydrolysis is driven by sw-I motion, sw-I–II connection, dynamic water coordination, and torsional strain (wavy line) on P. The front head may not be fully bound. (B) ATP hydrolysis in the rear head allows full binding of the front head to Tub-2 (Milic et al., 2014), which releases ADP, mediated by sw-I. (C) Until P releases from the rear head (assisted by sw-I), ATP binding to the front head is gated (Andreasson et al., 2015; Hancock, 2016), potentially by that is close to the rearward-pointing NL. (D) Rear head (ADP state) unbinds, possibly coupled with unfolding of . This allows ATP binding to the front head, assisted by the trio domains. (E) Power stroke is generated by the CNB formation (Hwang et al., 2008). The new front head contacts Tub-3 via interaction with the E-hook (Sirajuddin et al., 2014).
Author response image 1
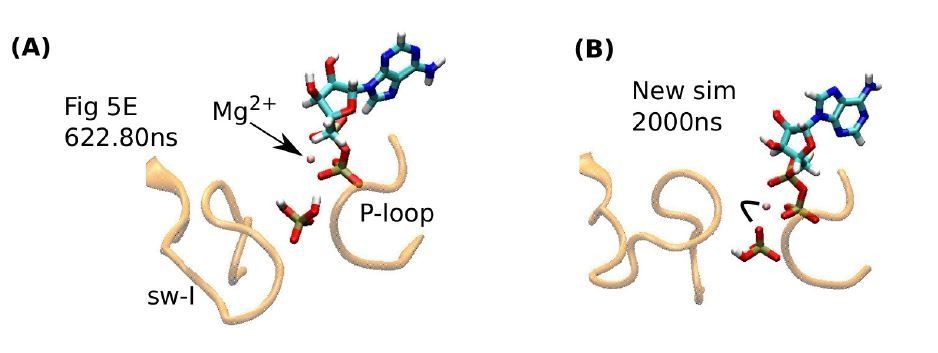
Influence of Pi orientation on its release.
(A) Re-rendering of Figure 5E, 622.80 ns. Pi does not have a direct contact with Mg2+. (B) The last frame of a new 2-µs simulation. An oxygen atom of Pi maintains contact with Mg2+(marked by a bent line).
Videos
Video 1
Unfolding of sw-I in Kin-1 and Kin-5 (Eg5).
https://doi.org/10.7554/eLife.28948.014
Video 2
Assisting of ATP binding by the α0/L5/sw-I trio.
It shows a part of the simulation, demonstrating how an unbound ATP interacts with kinesin.
Video 3
P release in Kin-1 and Kin-5 (Eg5).
https://doi.org/10.7554/eLife.28948.016
Video 4
Process of ADP release by sw-I.
Only a part is shown.
Video 5
Illustrative model of the motility of a kinesin dimer.
https://doi.org/10.7554/eLife.28948.022Additional files
-
Supplementary file 1
Conformational variability of kinesin
- https://doi.org/10.7554/eLife.28948.023
-
Supplementary file 2
Intra-kinesin hydrogen bonds (HB) and nonpolar (NP) contacts that break or form during each simulation
- https://doi.org/10.7554/eLife.28948.024
-
Supplementary file 3
Kinesin-MT contacts.
- https://doi.org/10.7554/eLife.28948.025
-
Transparent reporting form
- https://doi.org/10.7554/eLife.28948.026
Download links
A two-part list of links to download the article, or parts of the article, in various formats.
Downloads (link to download the article as PDF)
Open citations (links to open the citations from this article in various online reference manager services)
Cite this article (links to download the citations from this article in formats compatible with various reference manager tools)
Kinesin motility is driven by subdomain dynamics
eLife 6:e28948.
https://doi.org/10.7554/eLife.28948


