HMMR acts in the PLK1-dependent spindle positioning pathway and supports neural development
- University of British Columbia, Canada
- Leibniz Institute on Aging—Fritz Lipmann Institute, Germany
- University of Alberta, Canada
- BC Children’s Hospital, Canada
- Life Sciences Centre, University of British Columbia, Canada
Figures
Figure 1 with 1 supplement
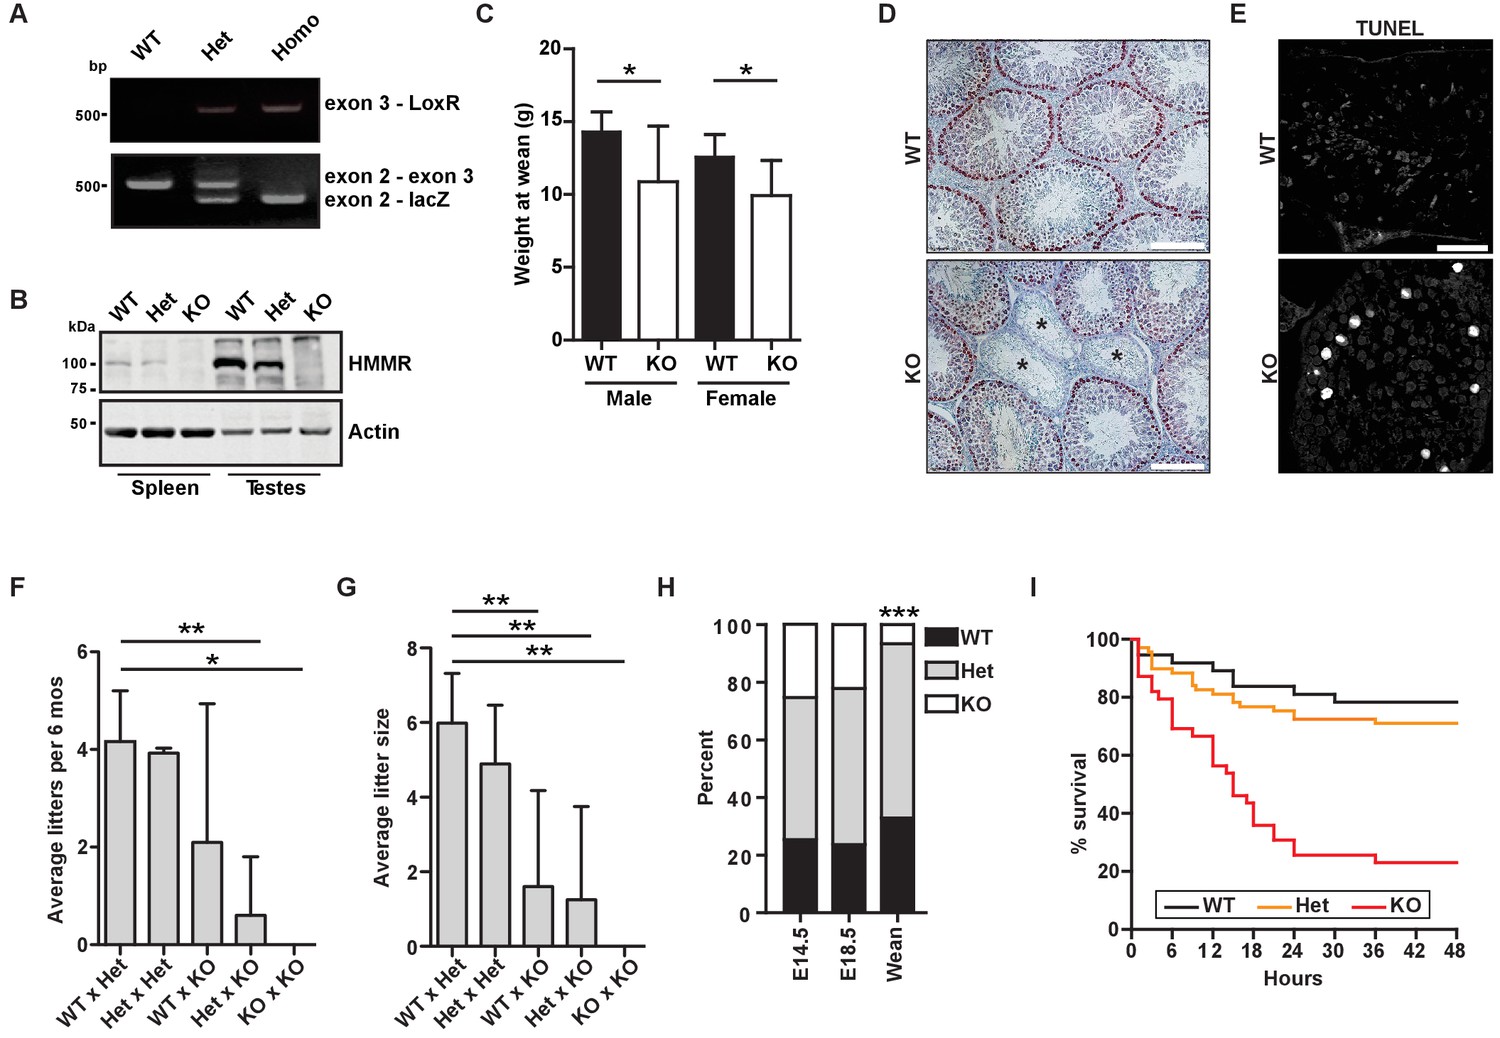
Hmmrtm1a/tm1a mice are smaller, exhibit fertility defects, and have decreased survival.
(A) Genotyping PCR confirmed insertion of the targeting vector between exon 2 and exon 4 in Hmmrtm1a/+ (Het) or Hmmrtm1a/tm1a (KO) but not in Hmmr+/+ (WT) mice. (B) HMMR expression in tissues extracted from WT, Het, or KO mice. Actin served as a loading control. (C) Weight at wean for WT and KO mice. Data are represented as mean ±SD (*p=0.028 (males), p=0.022 (females); for males, n = 10 (WT), 3 (KO); for females, n = 12 (WT), 4 (KO)). (D) Defects in seminiferous tubules are present in a KO male (*, atrophic tubules) relative to age-matched WT mouse stained with H&E. Scale bars, 200 µm. (E) Apoptosis (TUNEL staining) in KO male seminiferous tubules relative to age-matched WT mouse. Scale bars, 100 µm. (F) Number of litters per 6 months breeding time for matings of WT, Het, and KO mice. (*p<0.05; **p<0.01; n = 11 matings (WT x Het), 2 (Het x Het), 4 (WT x KO), 3 (Het x KO), 2 (KO x KO)). (G) Pups per litter for matings of WT, Het, and KO mice (See Figure 1F for n values). (H) Percentage of WT, Het, and KO pups at E14.5, E18.5 and weaning (~21 days) (***p<0.001; n = 64 (E14.5), 49 (E18.5), 133 (wean)). (I) Survival analysis for WT, Het or KO neonates during the first 48 hr following birth (n = 34 (WT), 69 (Het), 36 (KO)).
Figure 1—figure supplement 1
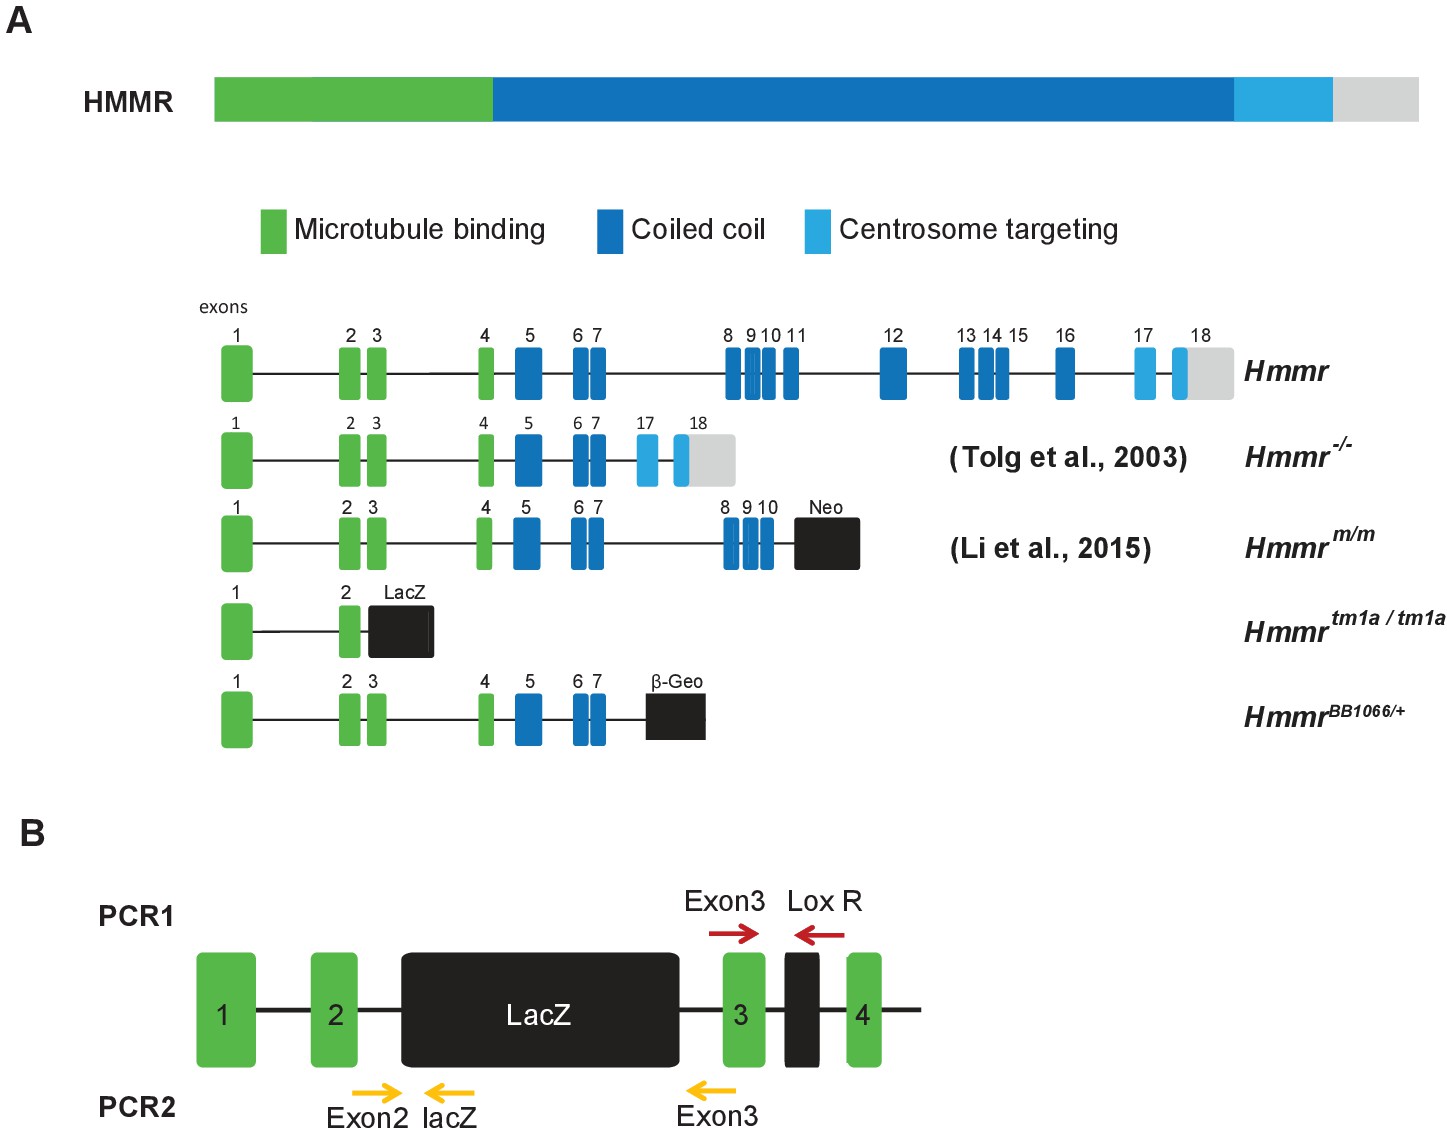
Schematic of HMMR protein/gene, mouse models, and primer locations for detection of Hmmrtm1a targeting construct.
(A) Schematic of HMMR protein/gene and mouse models. (B) Schematic of HMMR exons and the location of the primers used for genotyping PCRs.
Figure 2 with 1 supplement
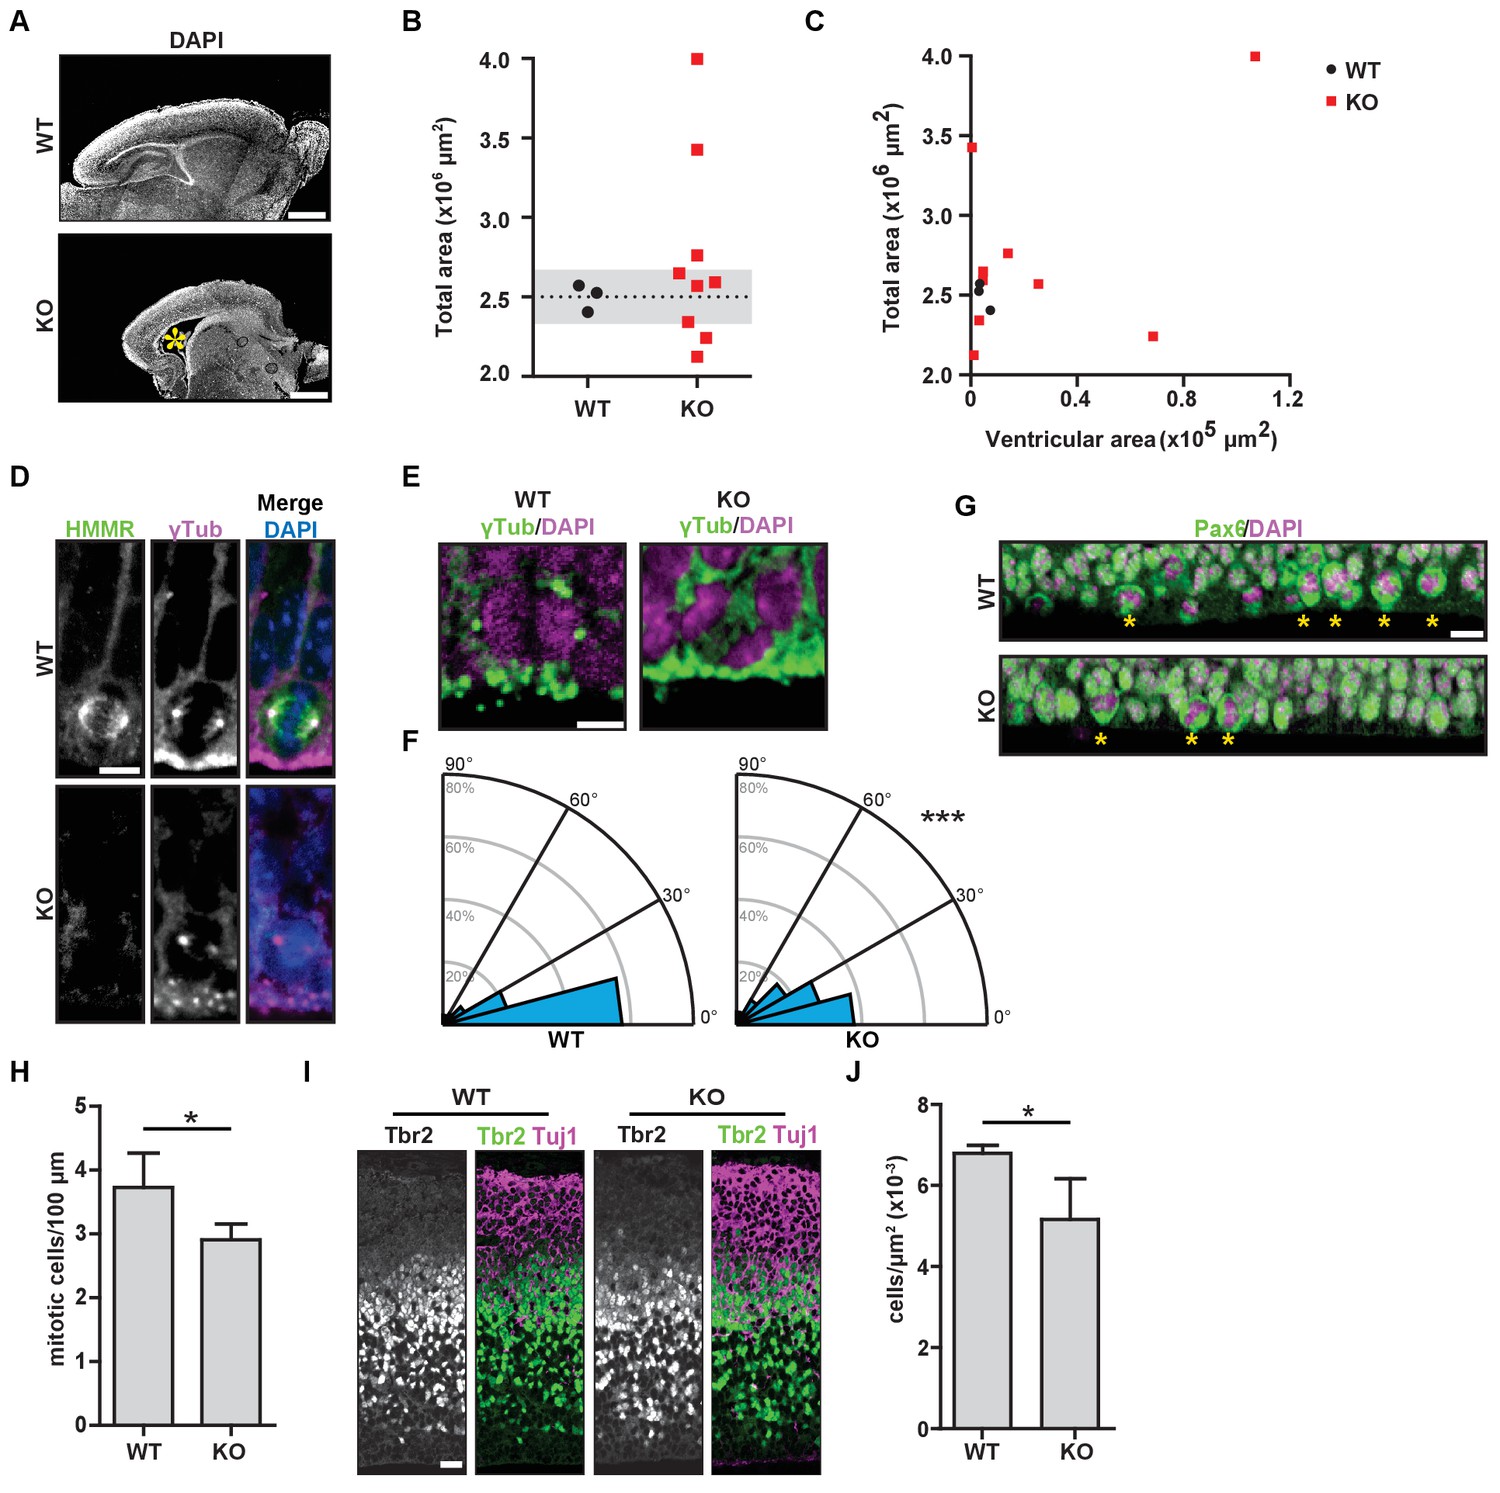
Hmmrtm1a/tm1a mice display defects in brain structure, neural progenitor division, and differentiation.
(A) Hmmrtm1a/tm1a (KO) neonate brains showed abnormalities compared to Hmmr+/+ (WT) brains (*, enlarged ventricles). Scale bars, 500 μm. (B) Quantification of brain size in WT and KO neonate (P0-1) brains. Dotted line indicates average of WT brains. The grey region indicates two standard deviations from the WT mean (n = 3 (WT), 9 (KO), p=0.512). (C) Correlation between brain size and ventricular area in WT and E14.5 P0-1 brains. (D) HMMR localization to the mitotic spindle (γ-tubulin) in neuroepithelial progenitor (NP) cells of WT and KO E14.5 brains. Scale bar, 10 μm. (E) Mitotic NP cells labeled with γ-tubulin (centrosomes) and DAPI in WT and KO E14.5 brains. Scale bar, 5 μm. (F) Division angle for NP cells in WT or KO E14.5 embryos (***p<0.001; n = 94 (WT), 96 (KO)). (G) Mitotic rate in Pax6+ NP cells in WT and KO E14.5 brains. Stars indicate dividing cells. Scale bar, 10 μm. (H) Quantification of mitotic rate in WT and KO E14.5 brains. Data are represented as mean ±SD (*p=0.018; n = 4(WT), 5(KO)). (I) Tbr2 localization in WT and KO E14.5 brains. Scale bars, 20 μm. (J) Quantification of Tbr2+ cells in E14.5 brains. Data are represented as mean ±SD (*p=0.019; n = 4 (E14.5, WT), 5 (E14.5, KO)).
Figure 2—figure supplement 1
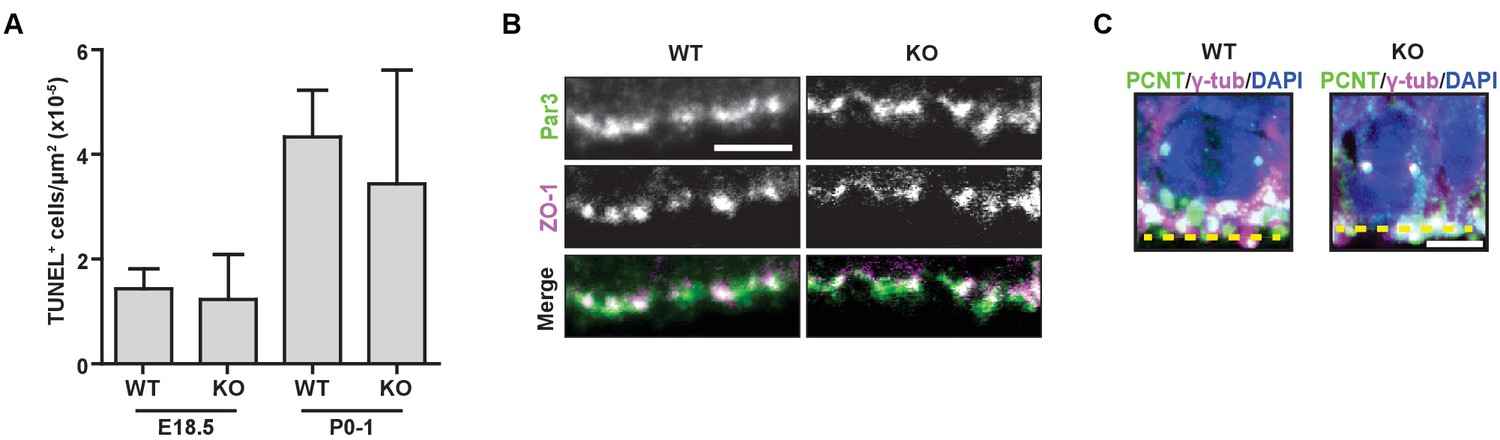
Hmmrtm1a/tm1a mice do not display increased levels of apoptosis, defects in polarity, or centrosome amplification.
(A) Quantification of apoptosis (TUNEL staining) in the cortex of E18.5 and PO-1 Hmmr+/+ (WT) and Hmmrtm1a/tm1a (KO) mice. Data are represented as mean ±SD (n = 4 (E18.5, WT); 6 (E18.5, KO); 3 (P0-1, WT); 5 (P0-1, KO). (B) Polarity markers were normal in WT and KO E18.5 neural progenitors. Scale bar, 5 µm. (C) Centrosome amplification was not observed in WT or KO E14.5 neural progenitors (Yellow dashed line indicates ventricle surface). Scale bar, 5 µm.
Figure 3 with 1 supplement
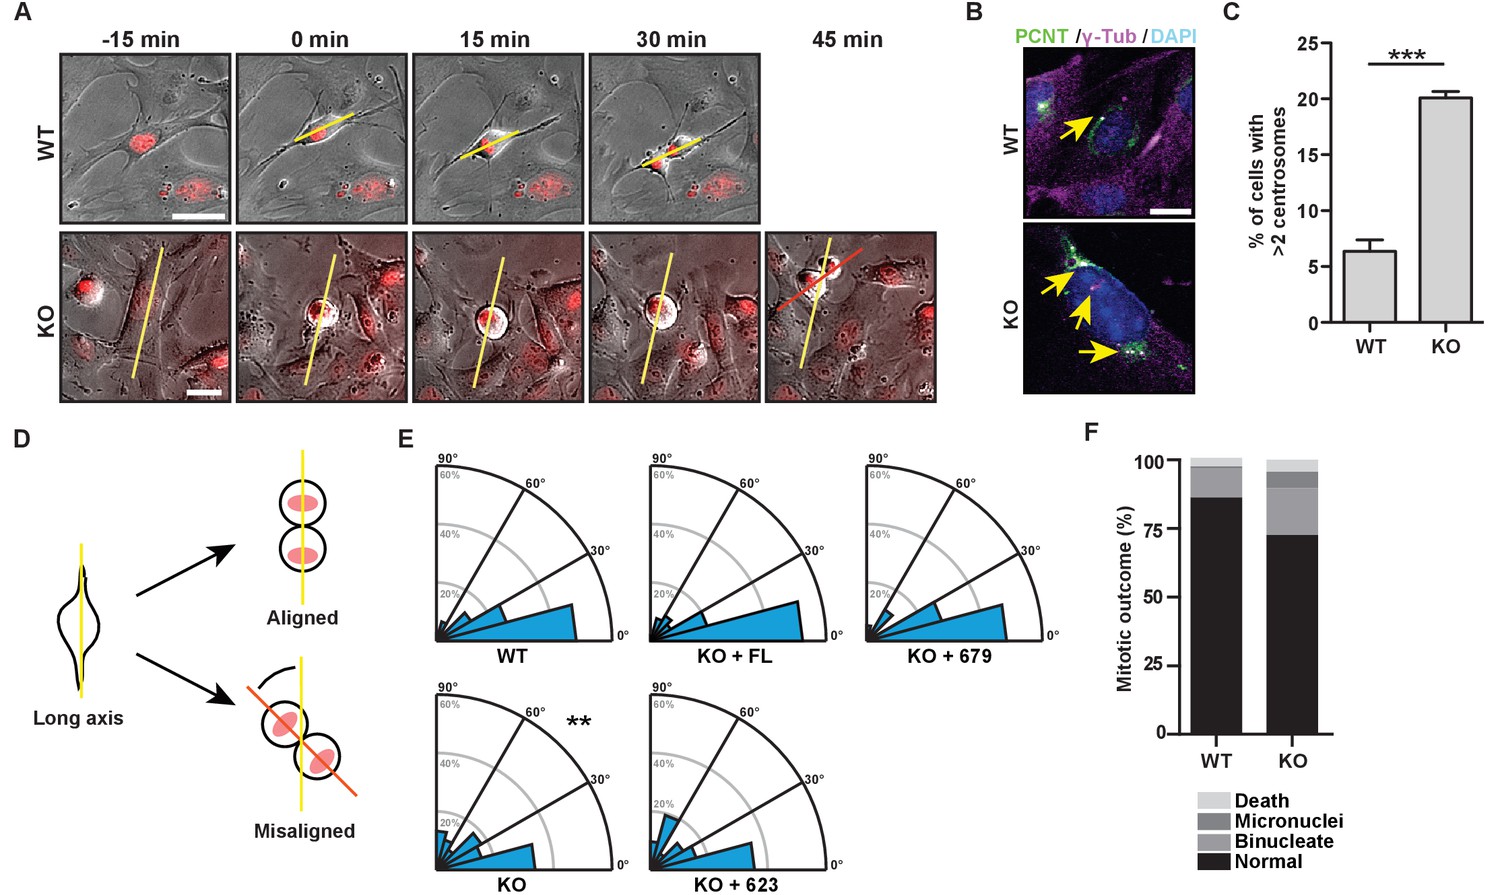
The bZip domain of HMMR is required for spindle orientation.
(A) Cell division in mouse embryonic fibroblasts (MEFs) isolated from Hmmr+/+ (WT) or Hmmrtm1a/tm1a (KO) embryos. DNA is counterstained with Hoechst (red). Yellow line indicates long axis of interphase cell and red line indicates cell division axis. Scale bars, 20 μm. (B) Centrosome amplification in WT or KO MEFs indicated by colocalization of pericentrin and γ-tubulin. Arrow indicates centrosome. (C) Quantification of centrosome amplification in WT or KO MEFs. Amplification was counted as >2 centrosomes per cell as indicated by colocalization of pericentrin and γ-tubulin. Data are represented as mean ±SD (**p=0.0002; 3 replicates of ≥100 cells). (D) Schematic of spindle angle measurement in MEFs. (E) Spindle angle in WT or KO MEFs. KO MEFs were transduced with HMMR constructs truncated at the indicated amino acid. WT and KO average spindle angle are significantly different (**p<0.01; n = 117 (WT), 114 (KO), 50 (KO + FL), 56 (KO + 679), and 31 (KO + 623)). (F) Mitotic outcomes in WT or KO MEFs (n = 111 (WT) and 94 (KO)).
Figure 3—figure supplement 1
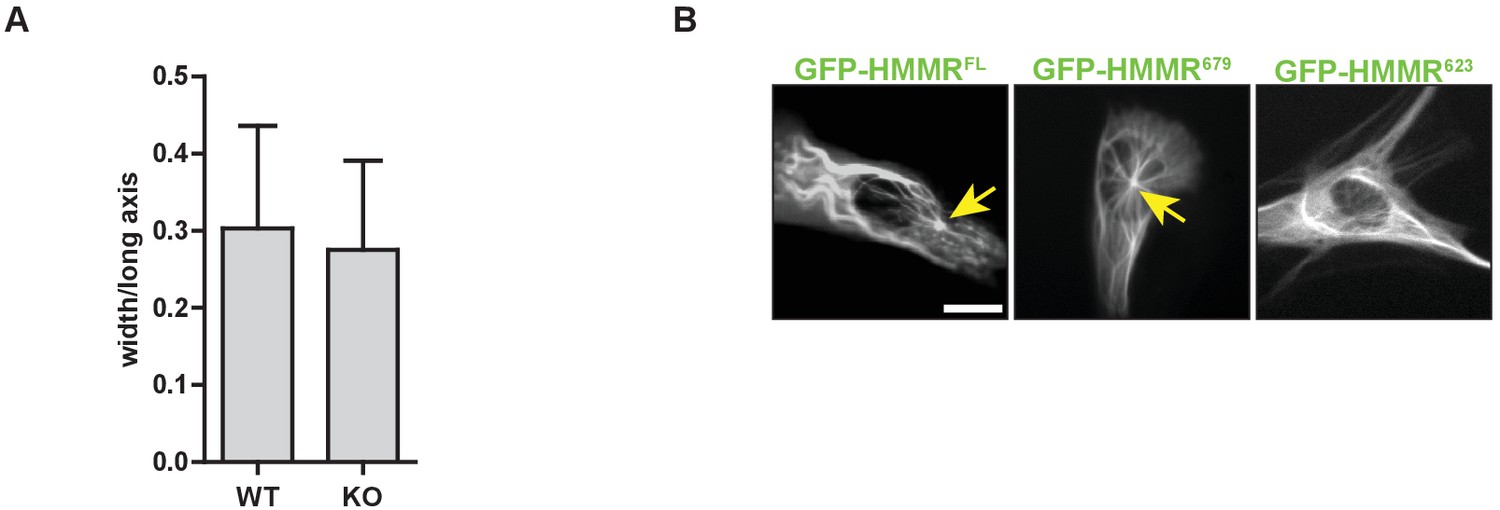
Hmmrtm1a/tm1a MEFs are similarly elongated to Hmmr+/+MEFs.
(A) Cell elongation in Hmmrtm1a/tm1a (KO) compared to Hmmr+/+ (WT). Data are represented as mean ±SD (n = 56 (WT); 61(KO)). (B) Localization of HMMR truncation constructs. Arrows point to the microtubule organizing center or centrosome. Scale bar, 10 µm.
Figure 4 with 1 supplement
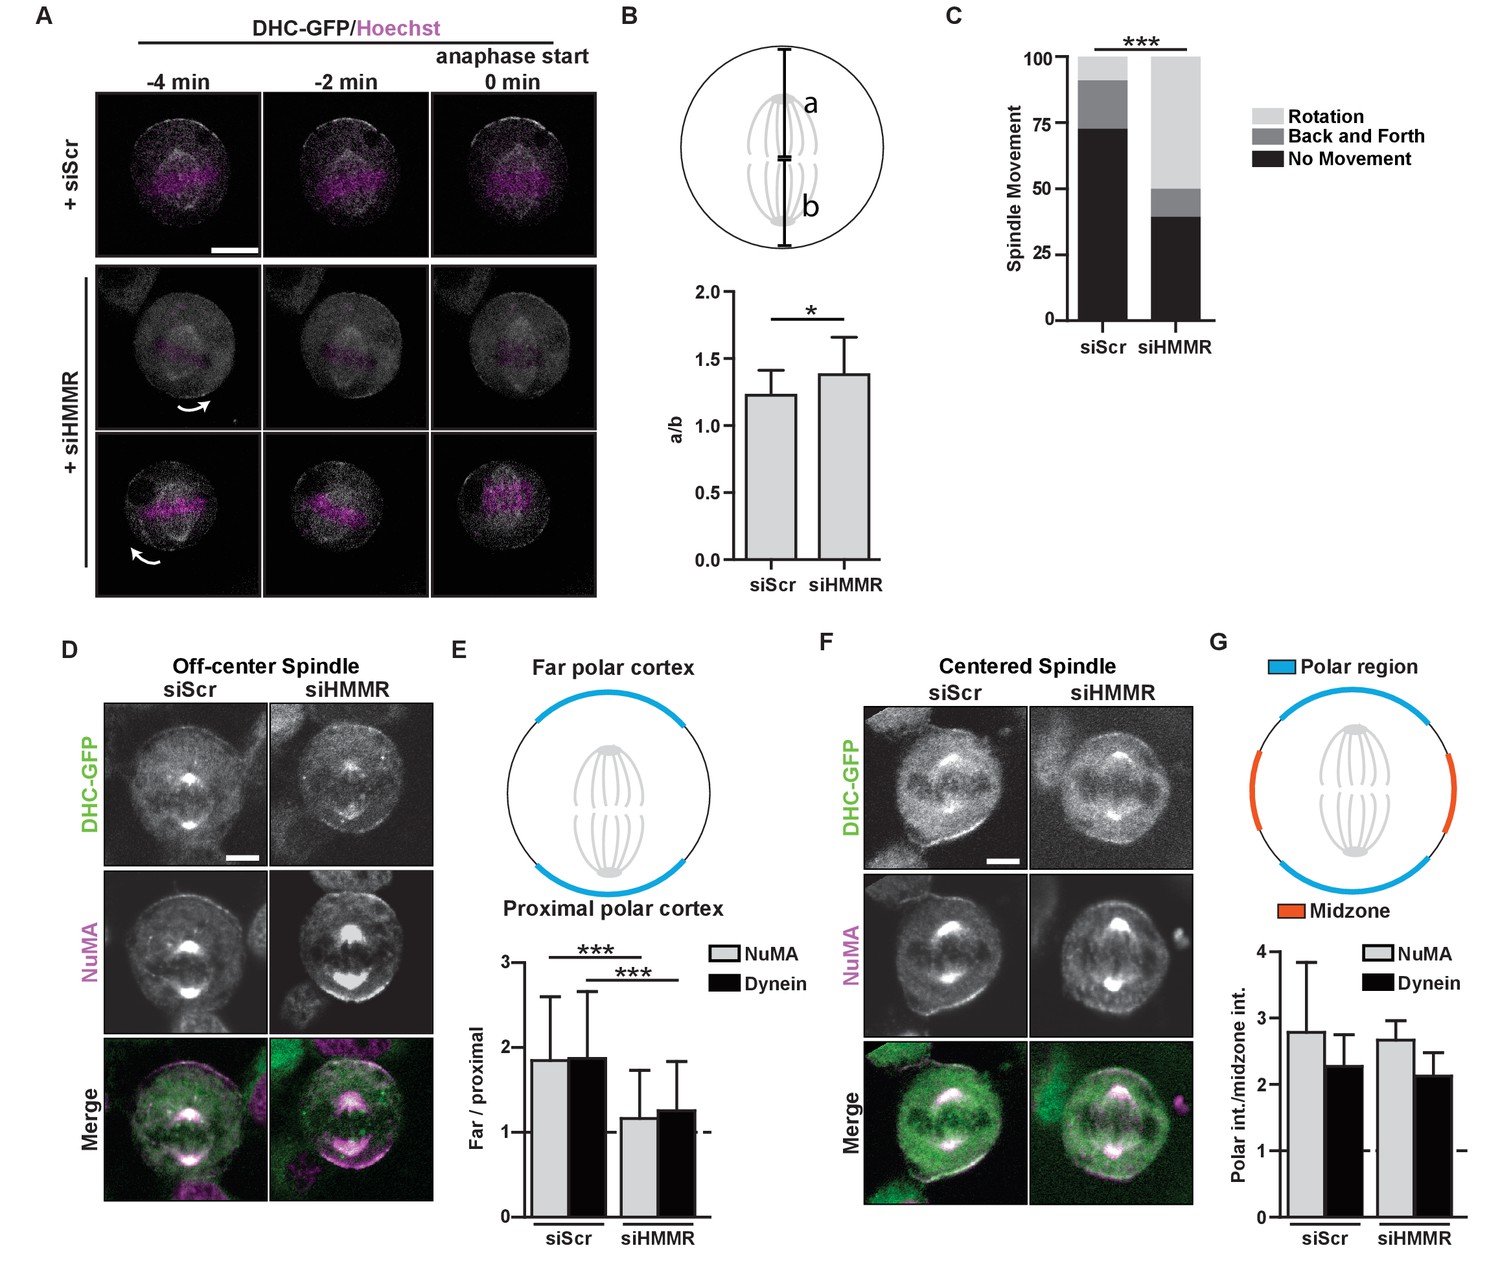
HMMR regulates cortical NuMA/Dynein localization.
(A) Localization of Dynein heavy chain tagged with GFP (DHC-GFP) stably expressed in HeLa cells treated with scrambled (siScr) or HMMR (siHMMR) siRNA using time-lapse imaging (arrows indicate predicted direction of movement). Scale bar, 10 μm. (B) Quantification of off-center spindles at anaphase start in cells treated with siScr or siHMMR (n = 25 (siScr), 26 (siHMMR)). (C) Quantitation of spindle movement in cells treated with siScr or siHMMR. Back and forth movement is exemplified by Figure 5A (top panels) and rotation is exemplified by Figure 5A (middle and bottom panels) (p<0.001; n = 22 (siScr), 28 (siHMMR)). (D) Localization of NuMA and DHC-GFP in HeLa cells transfected with siScr or siHMMR with mispositioned spindles. Scale bar, 5 μm. (E) Quantification of NuMA and DHC-GFP intensities at the farthest polar cortex compared to the proximal polar cortex in HeLa cells transfected with siScr or siHMMR. Cells are pooled from experiments in panels 1E,F. (***p<0.0001; n = 39 (untreated), 32 (siScr), 53 (siHMMR)). (F) Localization of DHC-GFP and NuMA in HeLa cells transfected with siScr or siHMMR. Scale bar, 5 μm. (G) Quantification of NuMA and DHC-GFP at the poles compared to the midzone in HeLa cells transfected with siScr or siHMMR. All data are represented as mean ±SD (p<0.001; 3 replicates of ≥25 cells).
Figure 4—figure supplement 1
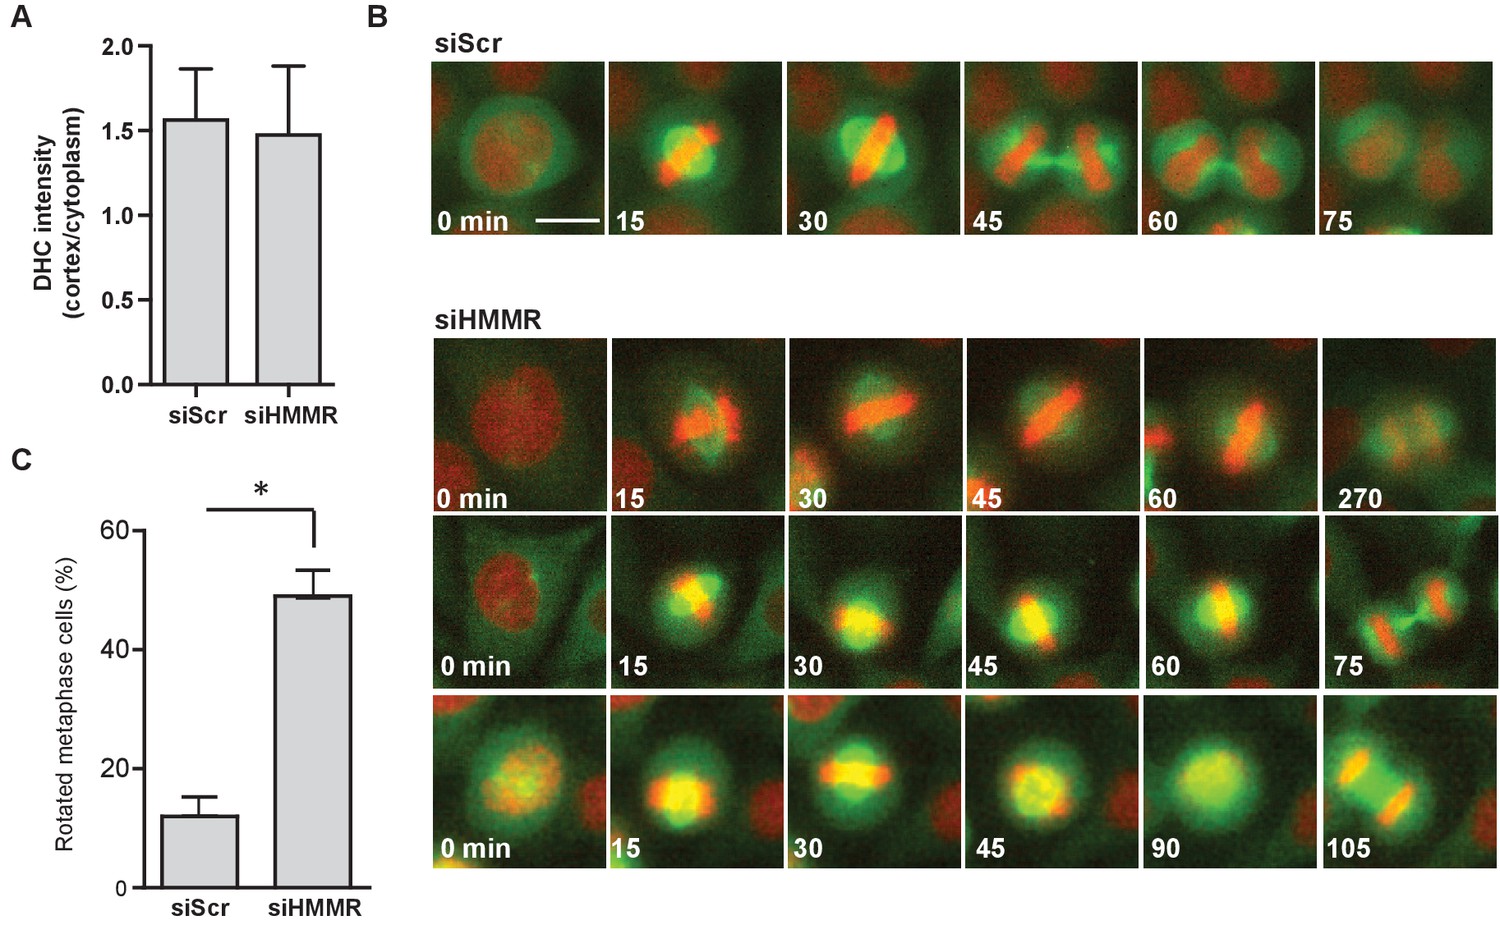
HMMR regulates spindle movement.
(A) Dynein recruitment to cortical crescents in DHC-GFP HeLa cells treated with scrambled (siScr) and HMMR (siHMMR) siRNA. Data are represented as mean ±SD (n = 25 (siScr), 20 (siHMMR)). (B) Mitotic spindle movement tracked by eGFP-TUBA stably expressed in HeLa cells treated with scrambled (siScr) or HMMR (siHMMR) siRNA using time-lapse imaging. Scale bar, 10 μm. (C) Quantitation of spindle rotation in cells treated with siScr or siHMMR. (p<0.05; n = 145 (siScr), 145 (siHMMR) from two experiments).
Figure 5
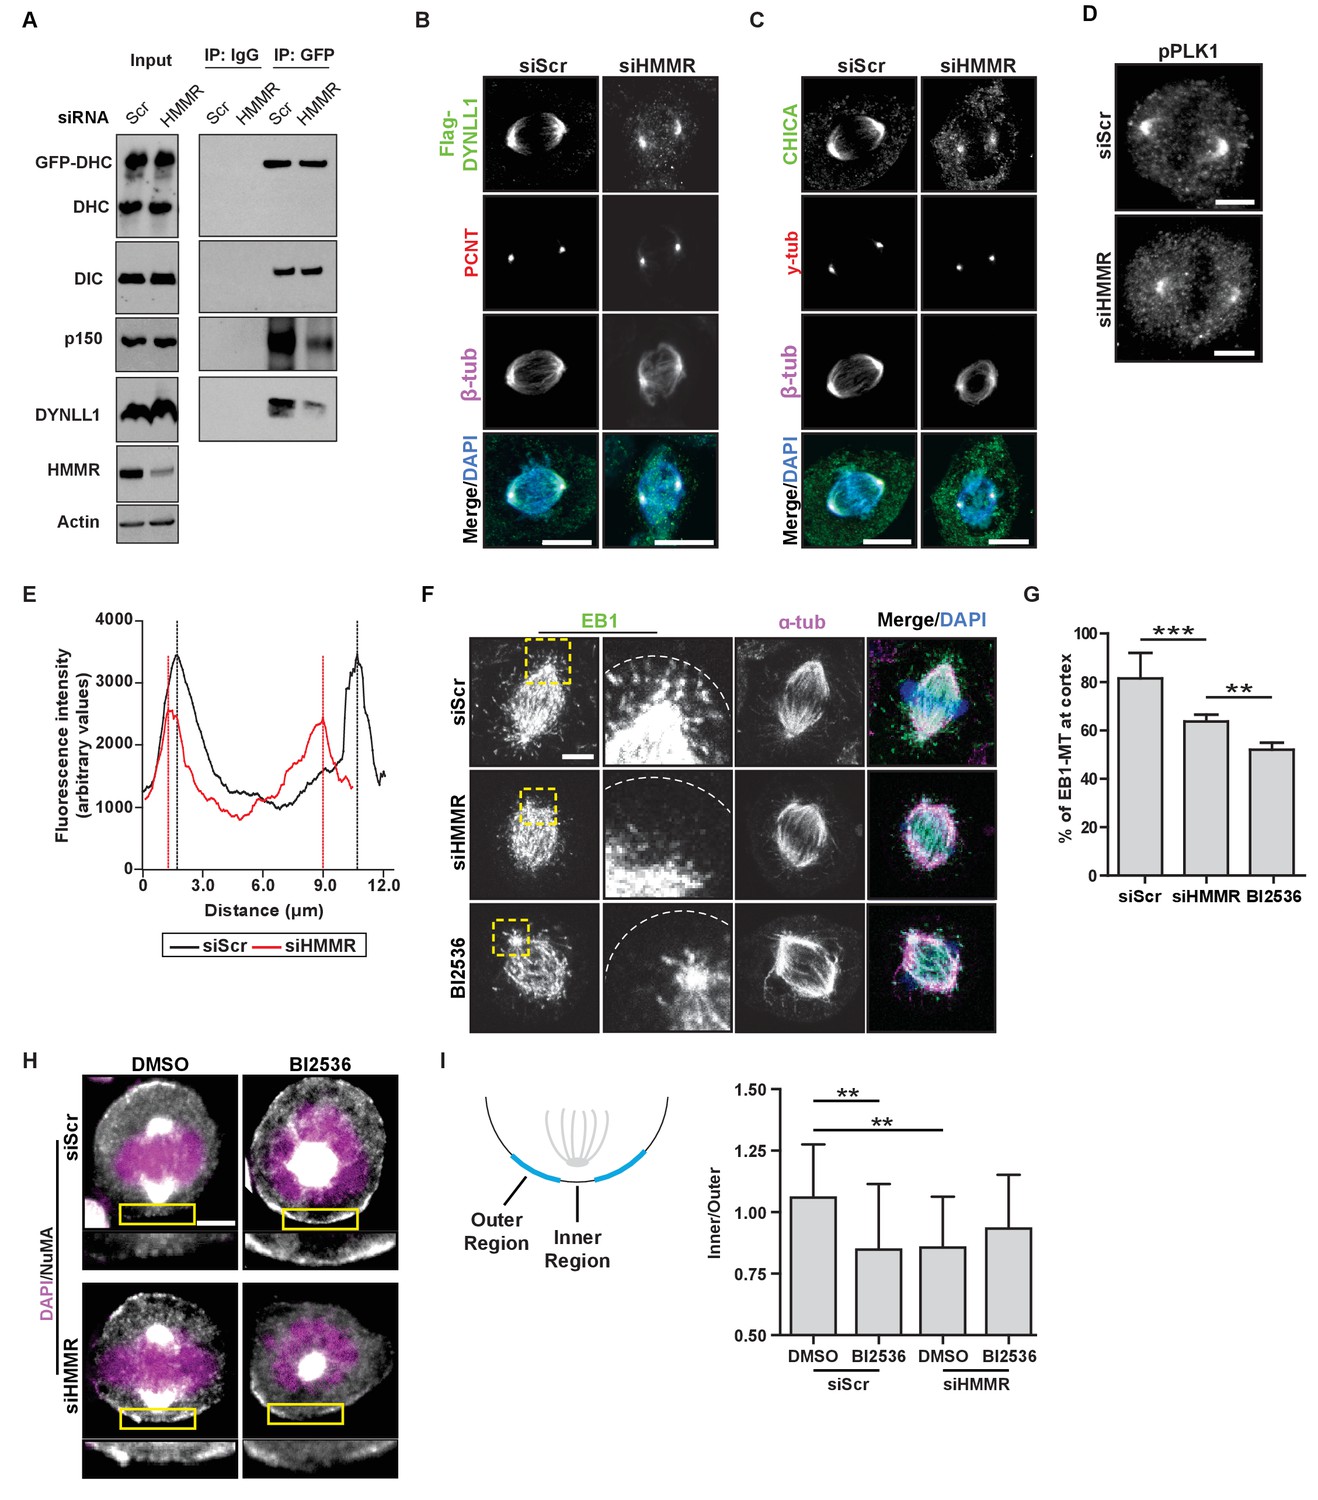
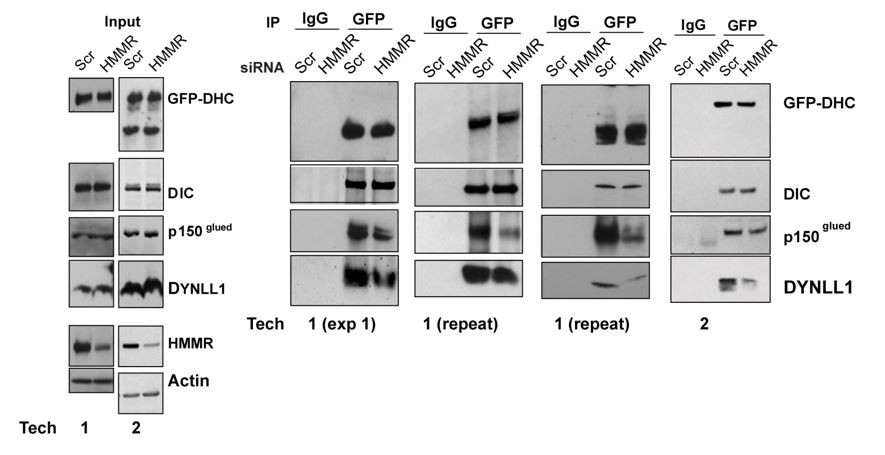
HMMR enables the PLK1-dependent spindle pole positioning pathway.
(A) Western blot analysis of mitotic HeLa extracts stably expressing DHC-GFP treated with scrambled (siScr) siRNA or siRNA targeting HMMR (siHMMR) subjected to immunoprecipitation with GFP antibody or control IgG and blotted with the indicated antibodies, including GFP (GFP-DHC), dynein intermediate chain (DIC), p150glued, DYNLL1, HMMR or Actin (four replicates). (B) Localization of Flag-Dynein light chain (DYNLL1) in HeLa cells treated with siScr or siHMMR (three replicates). Scale bars, 10 μm. (C) Localization of CHICA in cells treated with siScr and siHMMR (three replicates). Scale bars, 10 μm. (D) Localization of phospho-PLK1 (pPLK1) in HeLa cells expressing siScr or siHMMR. Scale bars, 5 μm. (E) Quantification of pPLK1 intensity from pole to pole. Data represents mean (50 cells from three experiments). (F) Astral microtubules contact the cortex in cells treated with siScr, siHMMR, or BI2536 (Plk1 inhibitor). Yellow box indicates EB1 inset and white dotted line indicates region of quantification. Scale bar, 5 μm. (G) Quantification of EB1 at the cortex in cells treated with siScr, siHMMR, or BI2536. Data are represented as mean ±SD (***p<0.001; 2 replicates of >40 cells per treatment). (H) NuMA localization in HeLa cells treated with siScr or siHMMR and DMSO or BI2536 (PLK1 inhibitor, 20 nM). Yellow box indicates magnified region. Scale bar, 5 μm. (I) Quantification of NuMA localization at the cortex near to the centrosome at the region nearest the centrosome compared to those farther away. Data are represented as mean ±SD (**p<0.01; n = 29 (siScr + DMSO), 39 (siScr + BI2536), 25 (siHMMR + DMSO), 39 (siHMMR + BI2536) from three experiments).
Figure 6 with 1 supplement
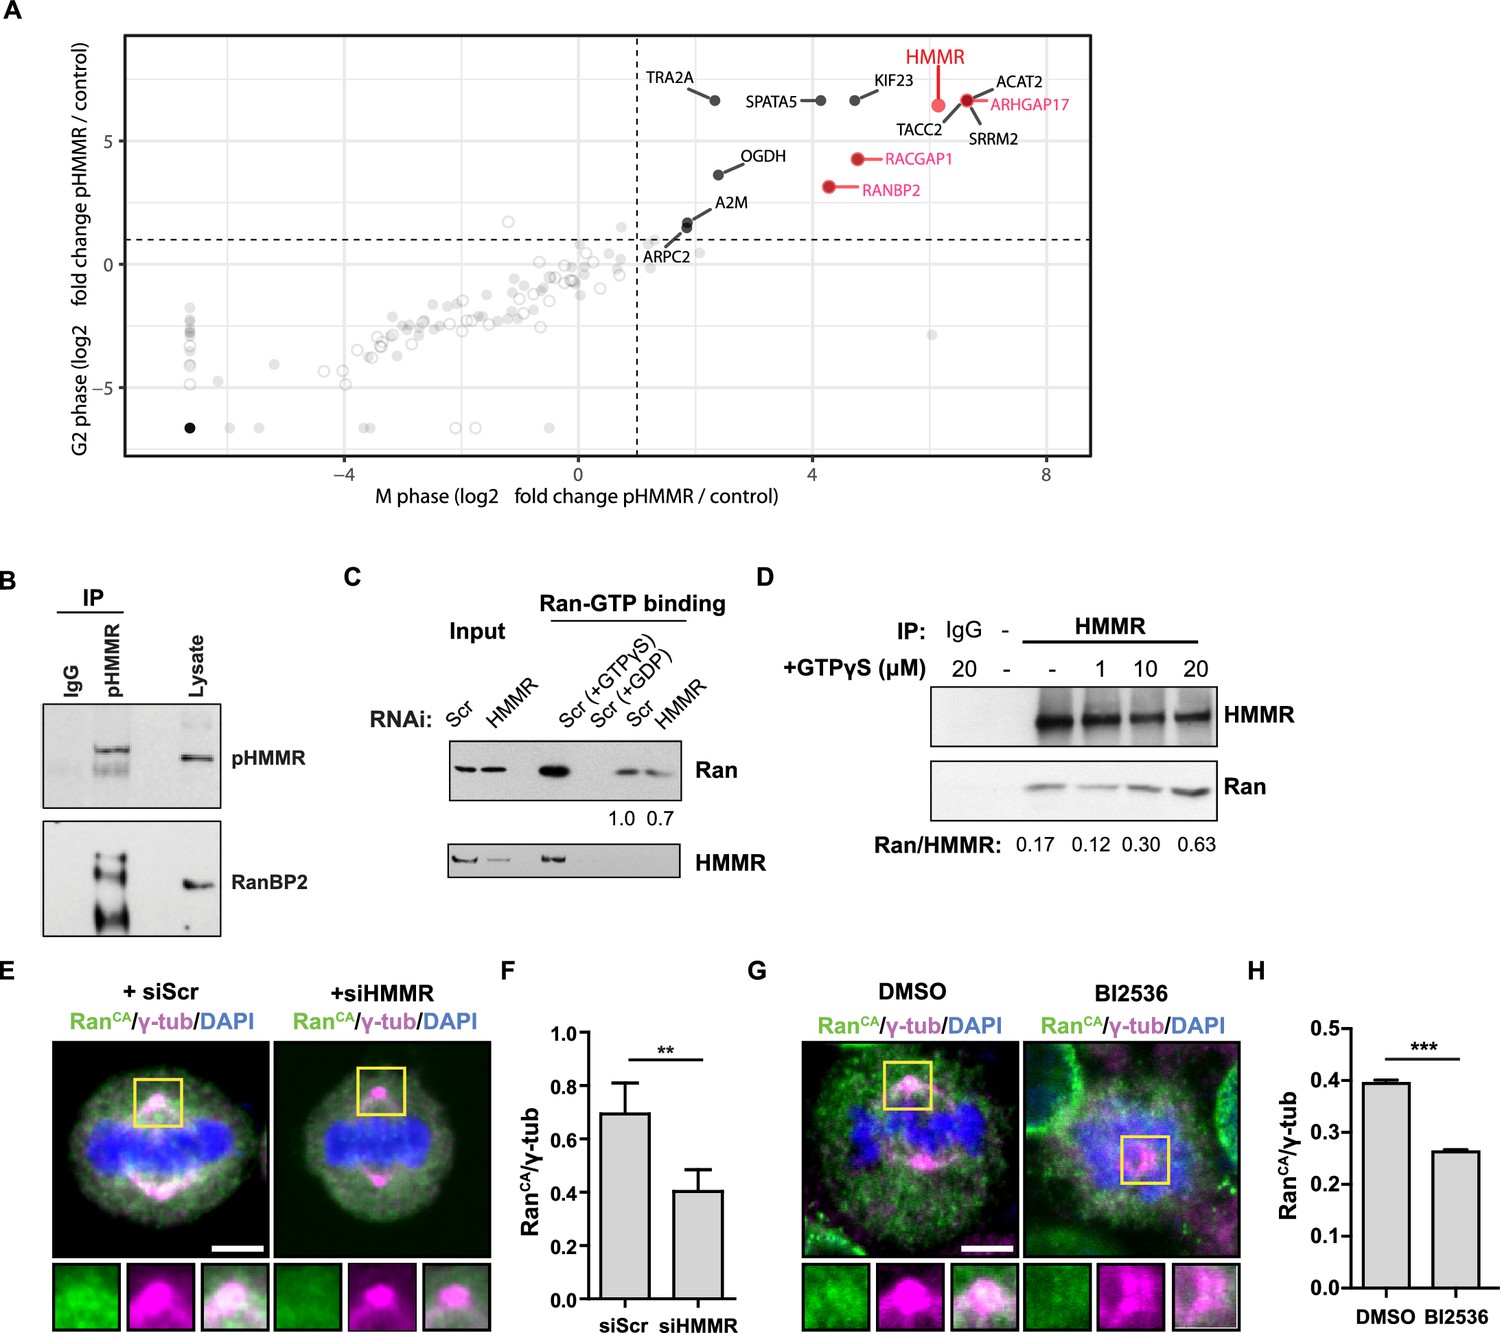
Phosphorylated HMMR interacts with RanBP2 and regulates the centrosome localization of Ran.
(A) Mass spectrometry analysis of proteins co-precipitated from HeLa cell lysates with antibodies targeting HMMR phosphorylated at threonine 703 (pHMMR). Proteins, other than HMMR, co-precipitated with antibodies targeting non-phosphorylated HMMR have been removed. (B) Immunoblots of mitotic HeLa extracts subjected to immunoprecipitation with pHMMR antibody or control IgG and blotted with the indicated antibodies. (C) Ran activity assay (GTP-bound Ran is immunoprecipitated) in mitotic HeLa cells transfected with scrambled (Scr) or siRNA targeting HMMR (two replicates). (D) Immunoblots of mitotic HeLa extracts treated with the indicated concentration of non-hydrolysable GTP (GTPγS) and immunoprecipitated with HMMR antibody or control IgG and blotted with the indicated antibodies (three replicates). (E) Localization of constitutively-active Ran (RanQ69L; RanCA) in mitotic HeLa cells transfected with scrambled (Scr) or siRNA targeting HMMR. Yellow boxes indicate magnified region. Scale bar, 5 μm. (F) Quantification of the ratio of intensities for RanCA relative to γ-tubulin in mitotic HeLa cells transfected with scrambled (Scr) or siRNA targeting HMMR. Data are represented as mean ±SD (**p<0.01; 3 replicates of ≥50 cells). (G) Localization of constitutively-active Ran (RanQ69L; RanCA) in cells treated with DMSO or BI2536 (Plk1 inhibitor, 20 nM). Yellow boxes indicate magnified region. Scale bar, 5 μm. (H) Quantification of RanCA localization at the centrosome in cells treated with DMSO or BI2536 (20 nM). Data are represented as mean ±SD (***p=0.0006; 2 replicates of >30 cells).
-
Figure 6—source data 1
Data set for mass spectrometry analysis of proteins that interact with pHMMR.
- https://doi.org/10.7554/eLife.28672.018
Figure 6—figure supplement 1

Total population of proteins complexed with pHMMR.
Mass spectrometry analysis of proteins co-precipitated from HeLa cell lysates with antibodies targeting HMMR phosphorylated at threonine 703 (pHMMR) including proteins co-precipitating with non-phosphorylated HMMR.
Figure 7 with 2 supplements

HMMR regulates centrosomal Ran and spindle centering in neural tissues.
(A) Spindle position, density, and length in neuroepithelial progenitor (NP) cells in Hmmr+/+ (WT) or Hmmrtm1a/tm1a (KO) E14.5 mice. Yellow dotted line indicates cell border and white dotted line indicates the ventricle edge. Scale bar, 5 μm. (B) Quantification of spindle position and length in WT and KO E14.5 mice. Data are represented as mean ±SD (**p=0.003 (a/b),***p=5.4e-7 (c); n = 57 (WT- a/b), 56 (KO- a/b), 56 (WT- c), 51 (KO- c)). (C) Quantification of spindle density in WT and KO E14.5 mice. Data are represented as mean ±SD (**p=0.003; n = 25 (WT), 20 (KO)). (D) Localization of Ran in NP cells in WT and KO E14.5 mice. Scale bar, 5 μm. (E) Quantification of Ran localization in WT and KO E14.5 brains. Data are represented as mean ±SD (**p=0.002; n = 29 (WT), 49 (KO)).
Figure 7—figure supplement 1

Centrosome localized HMMR localizes Ran and positions metaphase spindles in neural cells and rosettes derived from ES cells.
(A) Immunofluorescence detection of HMMR in SHSY5Y neuroblastoma cells treated with non-short hairpin (NHP) or HMMR shRNA (shHMMR). Scale bar, 5 μm. (B) Localization of Ran in SHSY5Y neuroblastoma cells treated with NHP or shHMMR. Scale bar, 5 μm. (C) Quantification of Ran localization in SHSY5Y cells. Data are represented as mean ±SD (**p<0.006; n = 39 (NHP), 35 (shHMMR)). (D) HMMR protein levels were reduced in HmmrBB0166/+ (BB0166) ES cells, which express a β-Geo fusion from one allele. E14Tg2 (WT) ES cells were used as the wild-type line. Actin was used as a loading control. (E) The Hmmr promoter was active, as indicated by β-Geo activity, in apical cells within rosettes. Scale bars, 50 μm (ES cells and Day 3); 1 mm (Day 11). (F) HMMR-positive cells are Cyclin B1(CCNB1)-positive in neural rosettes. Scale bar, 10 μm. (G) Spindle position in WT and BB0166 neural rosettes. Dotted line indicates cell border. Scale bar, 5 μm. (H) Quantification of spindle position in WT and BB0166 rosettes. Data are represented as mean ±SD (***; n = 31 (WT); 23 (BB0166)).
Figure 7—figure supplement 2

Model of HMMR regulation of spindle positioning via Ran regulation of NuMA-Dynein complexes.
(A) Proposed pathway through which PLK1/HMMR/Ran regulate cortical NuMA dynein. PLK1 activity controls astral microtubule density, which strips cortical NuMA localization. Silencing HMMR dampens PLK1, potentially through Aurora A. pHMMR, a proposed Aurora A and PLK1 substrate, locates RanBP2-RanGTP at spindle poles although the relative contribution to cortical NuMA localization remains unclear (grey). (B) Wild-type cells reposition mitotic spindles through force produced by asymmetric dynein motor localization. The asymmetric force is produced by stripping of cortical NuMA/Dynein by centrosomal PLK1/HMMR/Ran. Loss of HMMR reduces the stripping effect regulated by the centrosome and leads to misoriented and mispositioned mitotic spindles. Overexpression of HMMR strips NuMA completely from the cortex during metaphase. Mispositioned spindles are not able to correctly center.
Figure 8
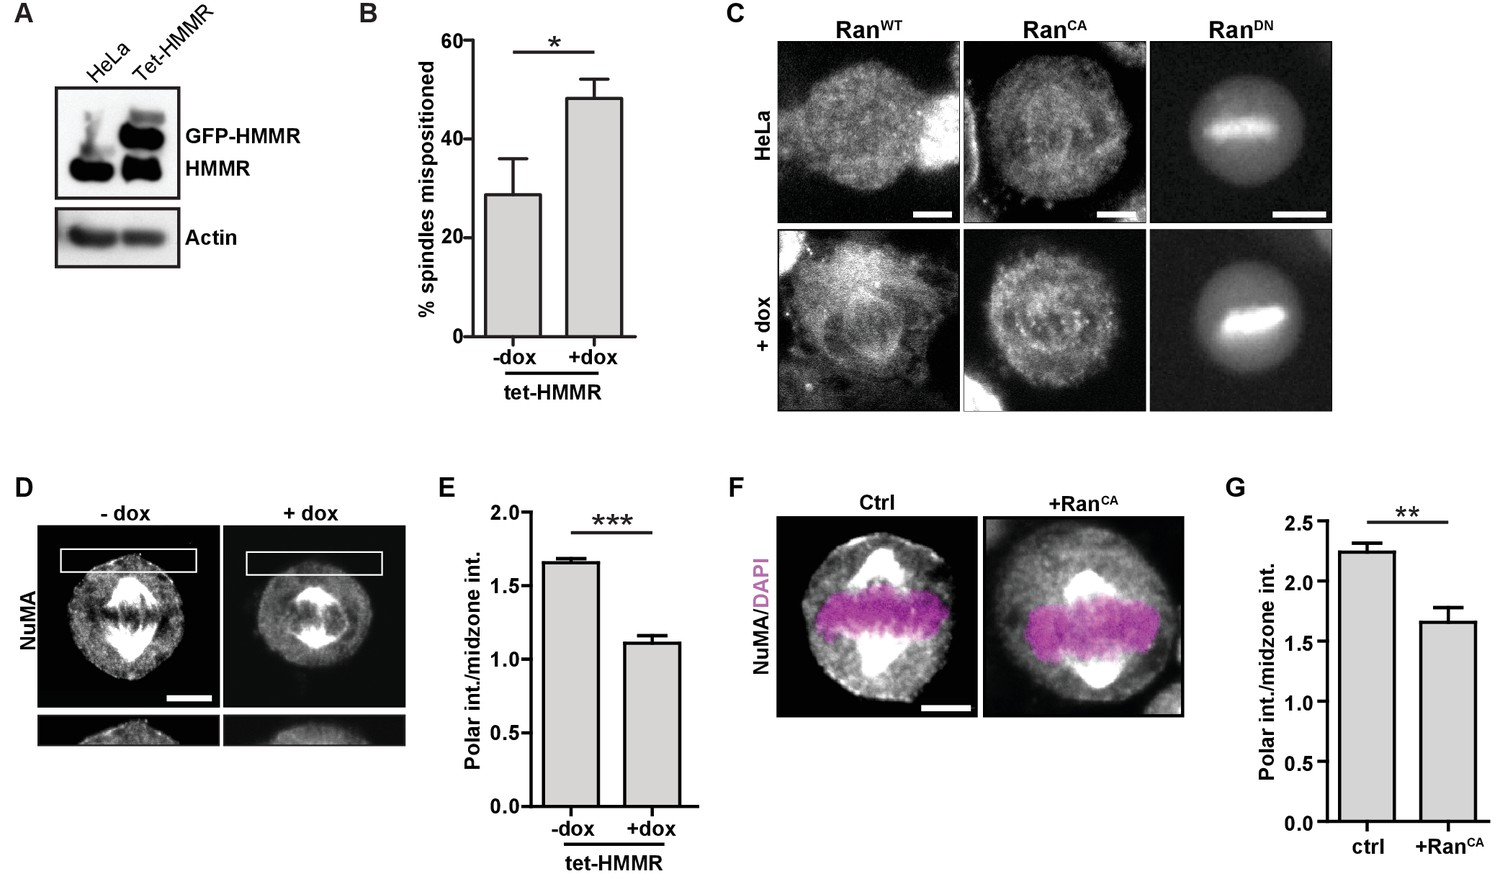
HMMR over-expression affects spindle positioning through Ran activation.
(A) HMMR over-expression in induced tet-HMMR cells. HMMR is over-expressed under the control of a tet-inducible promoter (+dox). (B) HMMR over-expression leads to mispositioned mitotic spindles. Data are represented as mean ±SD (p=0.015; 3 replicates of ≥30 cells). (C) Localization of RanWT, RanCA, and RanDN constructs in tet-HMMR cells. Scale bars, 5 μm. (D) NuMA localization in induced and uninduced tet-HMMR cells. Lower panel shows magnified view of cortex near spindle pole. Scale bars, 5 μm. (E) Quantification of NuMA localization in induced and uninduced tet-HMMR cells. Data are represented as mean ±SD (***p=0.0004; 3 replicates of ≥30 cells). (F) Localization of NuMA in HeLa cells expressing RanCA constructs. Scale bar, 5 μm. (G) Quantification of NuMA localization in HeLa cells expressing RanCA constructs. Data are represented as mean ±SD (p=0.002; 3 replicates of ≥25 cells).
Author response image 1

Author response image 2
Videos
Video 1
Dynein localization in HeLa DHC-GFP cells treated with scrambled siRNA that possess off-center spindles.
Images were captured every 1 min.
Video 2
Dynein localization in HeLa DHC-GFP cells treated with siRNA targeting HMMR that possess off-center spindles.
Images were captured every 1 min.
Video 3
Spindle movement in HeLa cells expressing mCherry-histone H2B, eGFP-TUBA treated with scrambled siRNA.
Images were captured every 15 min.
Video 4
Spindle movement in HeLa cells expressing mCherry-histone H2B, eGFP-TUBA treated with siRNA targeting HMMR.
Images were captured every 15 min.
Tables
Key resources table
| Reagent type (species) or resource | Designation | Source or reference | Identifiers |
|---|---|---|---|
| genetic reagent (Mus musculus) | Hmmrtm1a/tm1a | this paper | |
| cell line (Homo sapiens) | HeLa | ATCC (Manassas, VA) | CCL-2 |
| cell line (M. musculus) | Hmmr+/+ | this paper | |
| cell line (M. musculus) | Hmmrtm1a/tm1a | this paper | |
| cell line (H. sapiens) | HeLa DHC-GFP | Mitocheck, PMID: 20360068 | |
| cell line (H. sapiens) | HeLa tet-HMMR | PMCID: PMC5464802 | |
| cell line (H. sapiens) | HeLa eGFP-TUBA, mCherry-histone H2B | Gruneberg lab, PMID: 21187329 | |
| cell line (H. sapiens) | SH-SY5Y | Sigma (St. Louis, MO) | 94030304-1VL |
| cell line (M. musculus) | ES cells Hmmr+/+ | Mutant Mouse Resource Regional Cente (MMRC)r | E14TG2a |
| cell line (M. musculus) | ES cells HmmrBB0166/+ | MMRC | 026467-UCD |
| cell line (M. musculus) | ES cells Hmmrtm1a(EUCOMM)Hmgu | European Conditional Mouse Mutagenesis Program | |
| transfected construct | HMMR siRNA 5'A | Dharmacon (Lafayette, CO), PMID 24875404 | |
| transfected construct | HMMR siRNA 5'B | Dharmacon, PMID 24875404 | |
| transfected construct | HMMR siRNA 3' | Dharmacon, PMID 24875404 | |
| antibody | Actin | Sigma | a5060 |
| antibody | alpha-tubulin | Abcam (United Kingdom) | ab4074 |
| antibody | beta-tubulin | Sigma | T5293 |
| antibody | beta tubulin-647 | Cell Signaling Technology (Danvers, MA) | 3624 |
| antibody | mCherry | Abcam | ab167453 |
| antibody | DIC | Millipore (Burlington, MA) | mab1618 |
| antibody | DynLL1 | Abcam | ab51603 |
| antibody | EB1 | Abcam | ab53358 |
| antibody | gamma-tubulin | Sigma | t6557 |
| antibody | GFP | Abcam | ab1218 |
| antibody | HMMR | Abcam | ab124729 |
| antibody | pHMMR | PMID:22110403 | |
| antibody | NuMA | Abcam | ab36999 |
| antibody | NuMA | Cell Signaling Technology | 3888 |
| antibody | p150 glued | Abcam | ab151184 |
| antibody | Par3 | Millipore | 1330 |
| antibody | Pax6 | Covance (Princeton, NJ) | prb278p10 |
| antibody | Pericentrin | Covance | prb432c |
| antibody | pPLK1 | Abcam | ab189139 |
| antibody | PLZF | EMD Chemical | op128 |
| antibody | Ran | Cell Biolabs Inc (San Diego, CA) | in STA-409 kit |
| antibody | Ran | Abcam | ab53775 |
| antibody | RanBP2 | Abcam | ab197044 |
| antibody | Tbr2 | Abcam | ab183991 |
| antibody | TPX2 | Novus Biologicals (Littleton, CO) | mb500179 |
| antibody | ZO-1 | Invitrogen (Carlsbad, CA) | 339100 |
| antibody | ZO-1 | Invitrogen | 402200 |
| recombinant DNA reagent | pmCherry-C1-RanQ69L | Addgene (Cambridge, MA), PMID: 20685962 | Addgene #30309 |
| recombinant DNA reagent | pcDNA-RanWT-mRFP1-polyA | Addgene, PMID: 24908396 | Addgene #59750 |
| recombinant DNA reagent | mCherry-RanDN | PMID: 23870127 | |
| recombinant DNA reagent | HMMR-FL | PMID: 12808028 | |
| recombinant DNA reagent | HMMR 1–623 | PMID: 12808028 | |
| recombinant DNA reagent | HMMR 1–679 | PMID: 12808028 | |
| commercial assay or kit | Ran Activation Assay kit | Cell Biolabs, Inc | STA-409 |
| chemical compound, drug | BI2536 | Selleck Chemicals (Houston, TX) | S1109 |
Additional files
-
Transparent reporting form
- https://doi.org/10.7554/eLife.28672.023
Download links
A two-part list of links to download the article, or parts of the article, in various formats.
Downloads (link to download the article as PDF)
Open citations (links to open the citations from this article in various online reference manager services)
Cite this article (links to download the citations from this article in formats compatible with various reference manager tools)
HMMR acts in the PLK1-dependent spindle positioning pathway and supports neural development
eLife 6:e28672.
https://doi.org/10.7554/eLife.28672


