Efficient protein targeting to the inner nuclear membrane requires Atlastin-dependent maintenance of ER topology
- Institute of Biochemistry, ETH Zurich, Switzerland
- Institute of Pharmaceutical Sciences, ETH Zurich, Switzerland
Figures
Figure 1
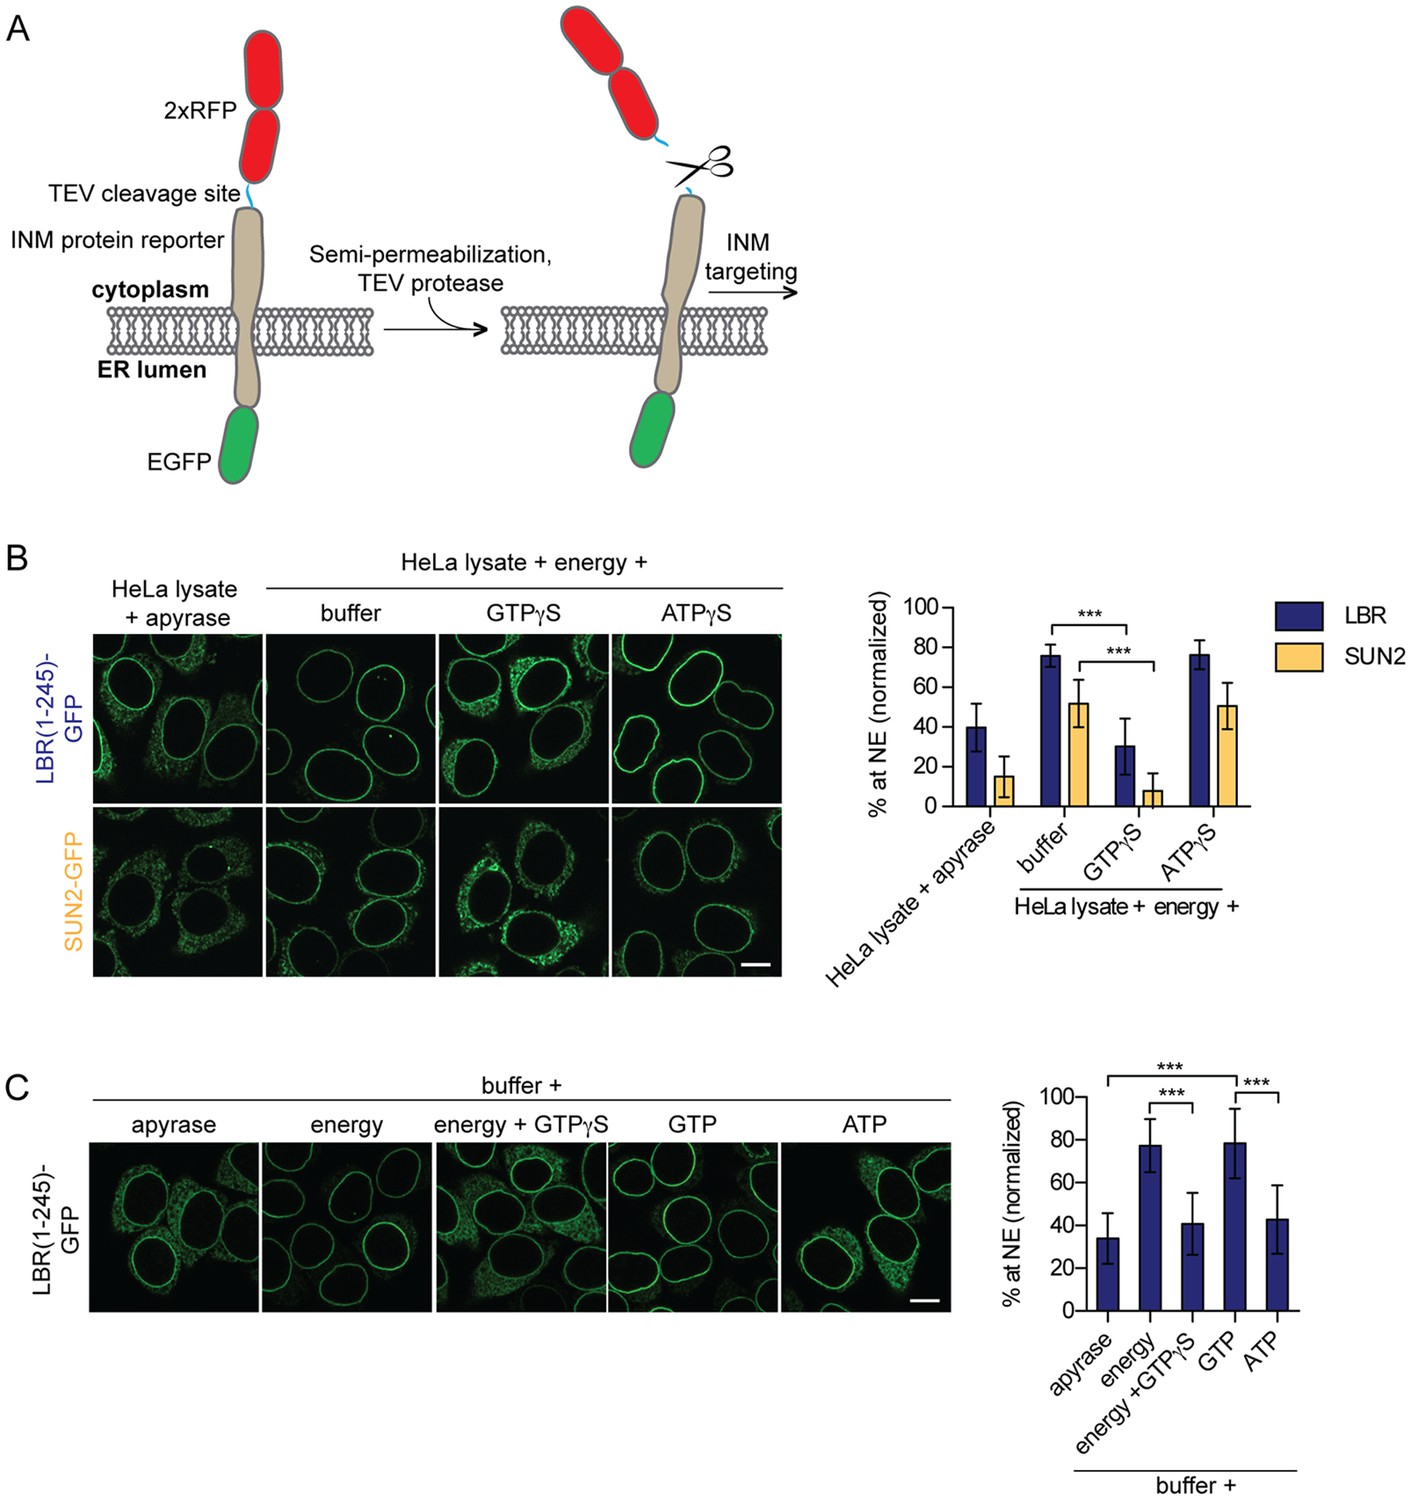
Targeting of membrane proteins to the INM in vitro is dependent on GTP hydrolysis.
(A) Schematic representation of the in vitro transport assay for INM proteins (Ungricht et al., 2015). (B) Targeting of LBR(1-245)-GFP and SUN2-GFP was reconstituted in semi-permeabilized HeLa cells. INM targeting reactions were performed in presence of HeLa cell extract that was either depleted of NTPs by apyrase treatment or supplemented with an energy-regenerating system, and 0.3 mM GTPγS or ATPγS, as indicated. After incubation of cells at 37°C for 45 min, cells were fixed and imaged by confocal microscopy. NE enrichment was quantified as the ratio of the integrated fluorescence intensity at the NE to the total fluorescence intensity (in the ER and the NE), normalized relative to the fraction at the NE before release by TEV. Mean ±SD; n ≥ 63; ***p<0.0001. (C) Reconstitution of LBR(1-245)-GFP targeting for 45 min in the presence of buffer supplemented with either apyrase, buffer with an energy regenerating system in absence or presence of 0.3 mM GTPγS, or buffer supplemented with 0.75 mM GTP or ATP. Mean ±SD; n ≥ 139; ***p<0.0001. Scale bars: 10 μm.
Figure 2
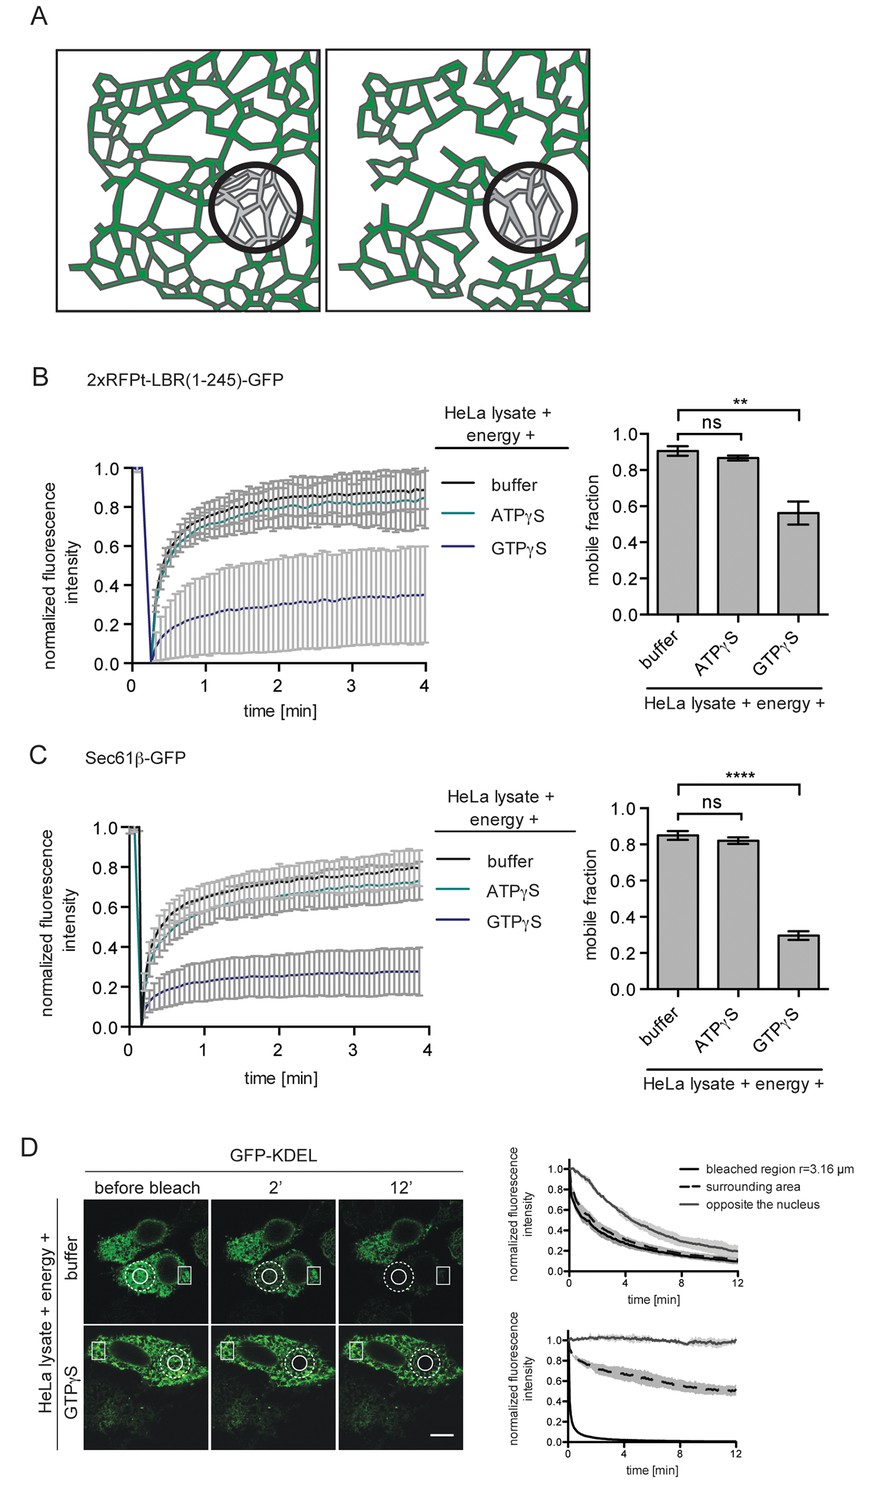
ER protein mobility is reduced in the presence of GTPγS.
(A) Model illustrating the hypothetical differences in ER organization of cells with either a highly interconnected polygonal ER (left) or a more sparsely connected network of polygons and tubules (right). Upon bleaching the fluorescence of labeled proteins in the indicated circle, diffusion of fluorescent proteins from the surrounding ER network into the bleached area may occur with different kinetics due to the differences in ER organization. (B) FRAP on 2xRFP-tev-LBR(1-245)-GFP in the ER of semi-permeabilized cells in presence of HeLa cell lysate and energy, and further supplemented with buffer, 0.3 mM ATPγS or GTPγS. Recovery curves and mobile fractions derived from FRAP experiments. Mean ±SD (left curves); Mean ±SD (bar graphs); N ≥ 2; n ≥ 16; **p<0.01. (C) FRAP on Sec61β-GFP in the ER performed with semi-permeabilized cells as in (B). Recovery curves and mobile fractions derived from FRAP experiments. Mean ±SD (left curves); Mean ±SEM (bar graphs); N ≥ 4; n ≥ 32; ****p<0.0001. (D) FLIP performed on semi-permeabilized cells expressing GFP-KDEL in presence of HeLa cell lysate and energy, in absence and presence of 0.3 mM GTPγS. Mean ±SD; N = 3; n ≥ 9. Scale bars, 10 μm.
Figure 3
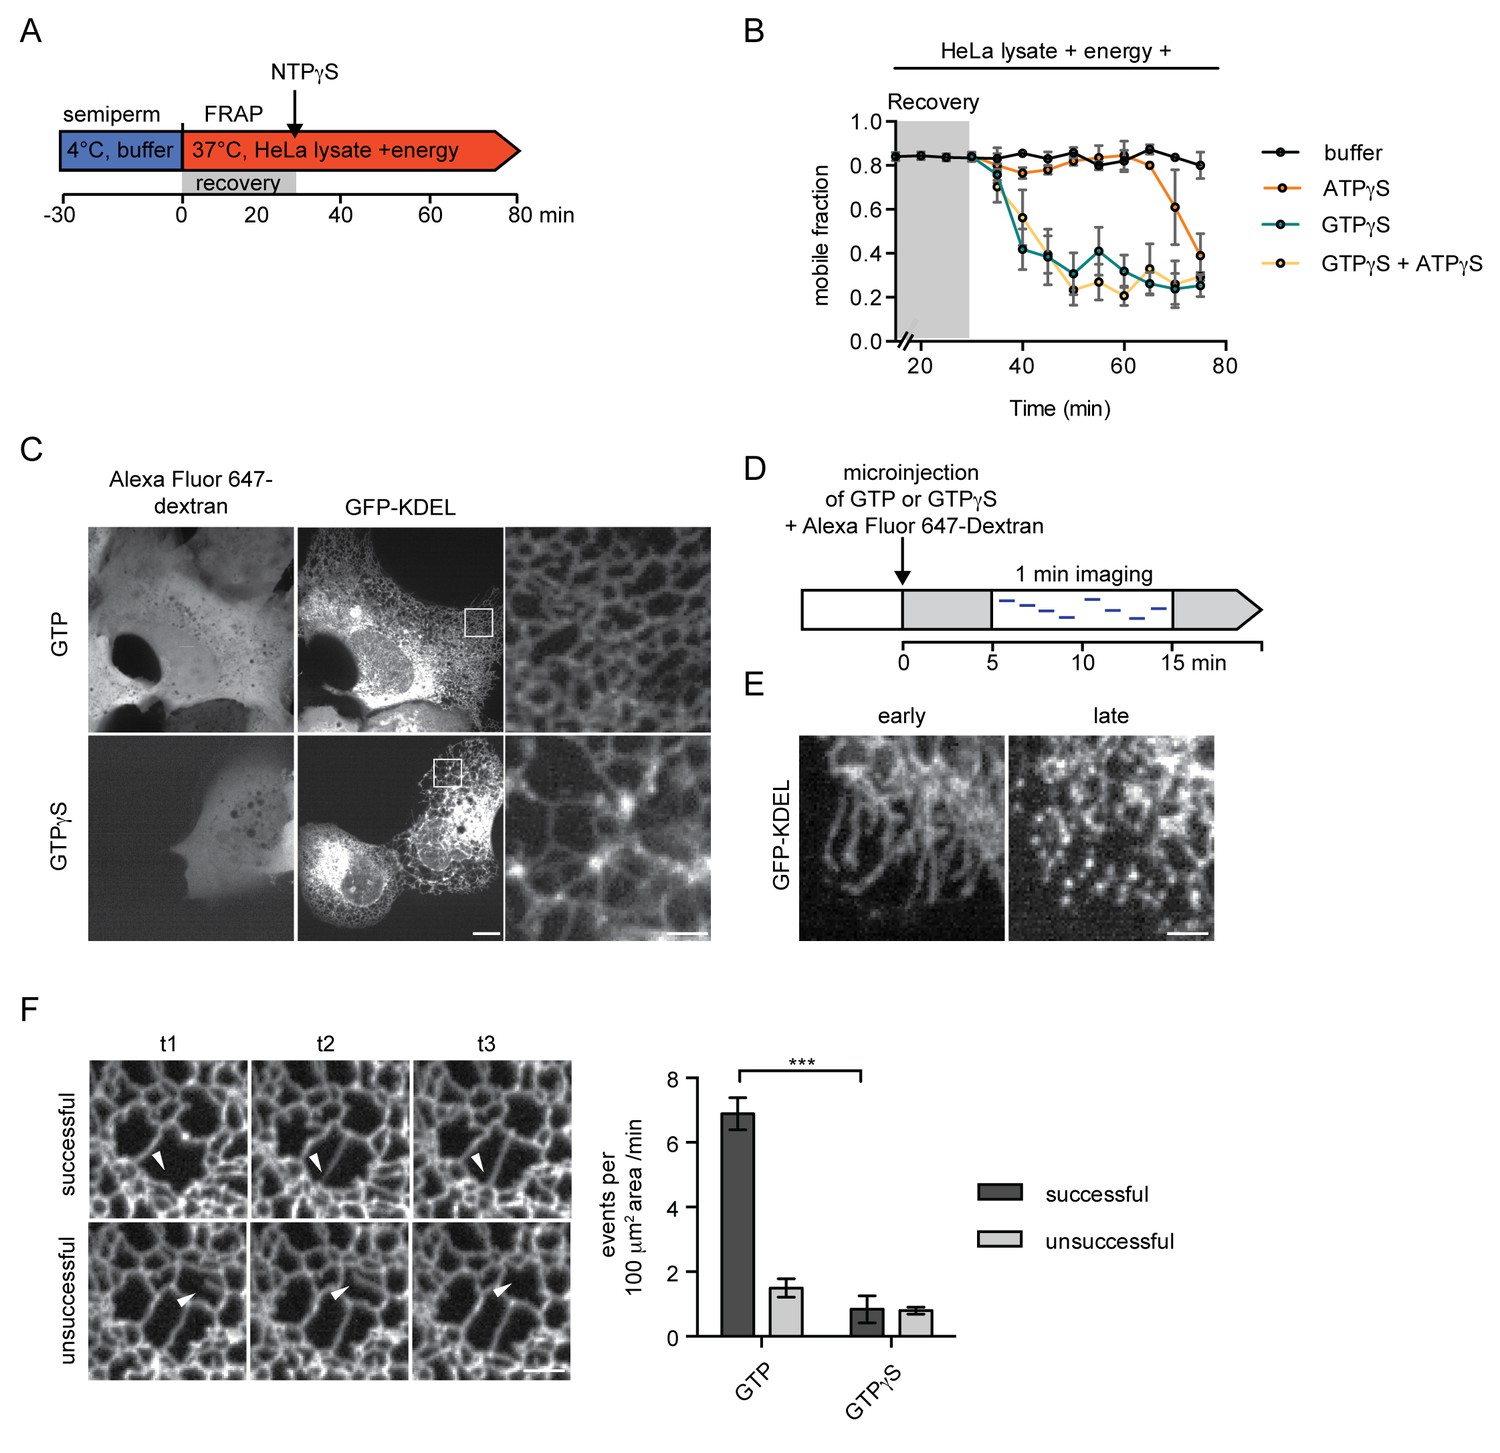
Inhibition of GTP hydrolysis affects ER morphology.
(A) Schematic of experimental set-up in B. (B) 2xRFP-tev-LBR(1-245)-GFP expressing reporter cells were semi-permeabilized and allowed to recover in HeLa cell lysate and energy at 37°C. After 30 min, non-hydrolyzable ATP or GTP analogs were added to a final concentration of 0.3 mM. FRAP was performed every 5 min, starting during the recovery phase and continued after the addition of the nucleotide analogs. Mobile fractions over time. Mean ±SEM, N ≥ 3; n ≥ 20. (C) Morphology of the peripheral ER network of U2OS cells expressing GFP-KDEL after microinjection of either GTP or GTPγS. Alexa Fluor 647-labeled dextran served as injection marker. Scale bars, 10 μm, 2 μm for zoomed panels. (D) Schematic representation of the experiment in E and F. (E) U2OS cells expressing EGFP-KDEL were microinjected with a solution containing 10 mM GTP or GTPγS and a fluorescent dextran. 5 to 15 min after injection, cells were imaged over a time course of 1 min (1 frame/s) to visualize membrane dynamics in the peripheral ER network. Representative images of cells microinjected with GTPγS. Cells imaged early (after ~5 min) after microinjection displayed long unconnected tubules, cells imaged later (after ~15 min) showed fragmentation of the peripheral ER. Scale bar, 2 μm. (F) ER dynamics in the movies of (E) was quantified by scoring the number of successful (example in top panel) or unsuccessful membrane tubule attachments (example in bottom panel) in a 100 μm2 area of cells injected with either GTP or GTPγS (Videos 1 and 2). Mean ±SEM; N ≥ 3; n ≥ 13; two 100 μm2 squares for each cell; ***p<0.0005. Scale bar, 2 μm.
Figure 4 with 3 supplements
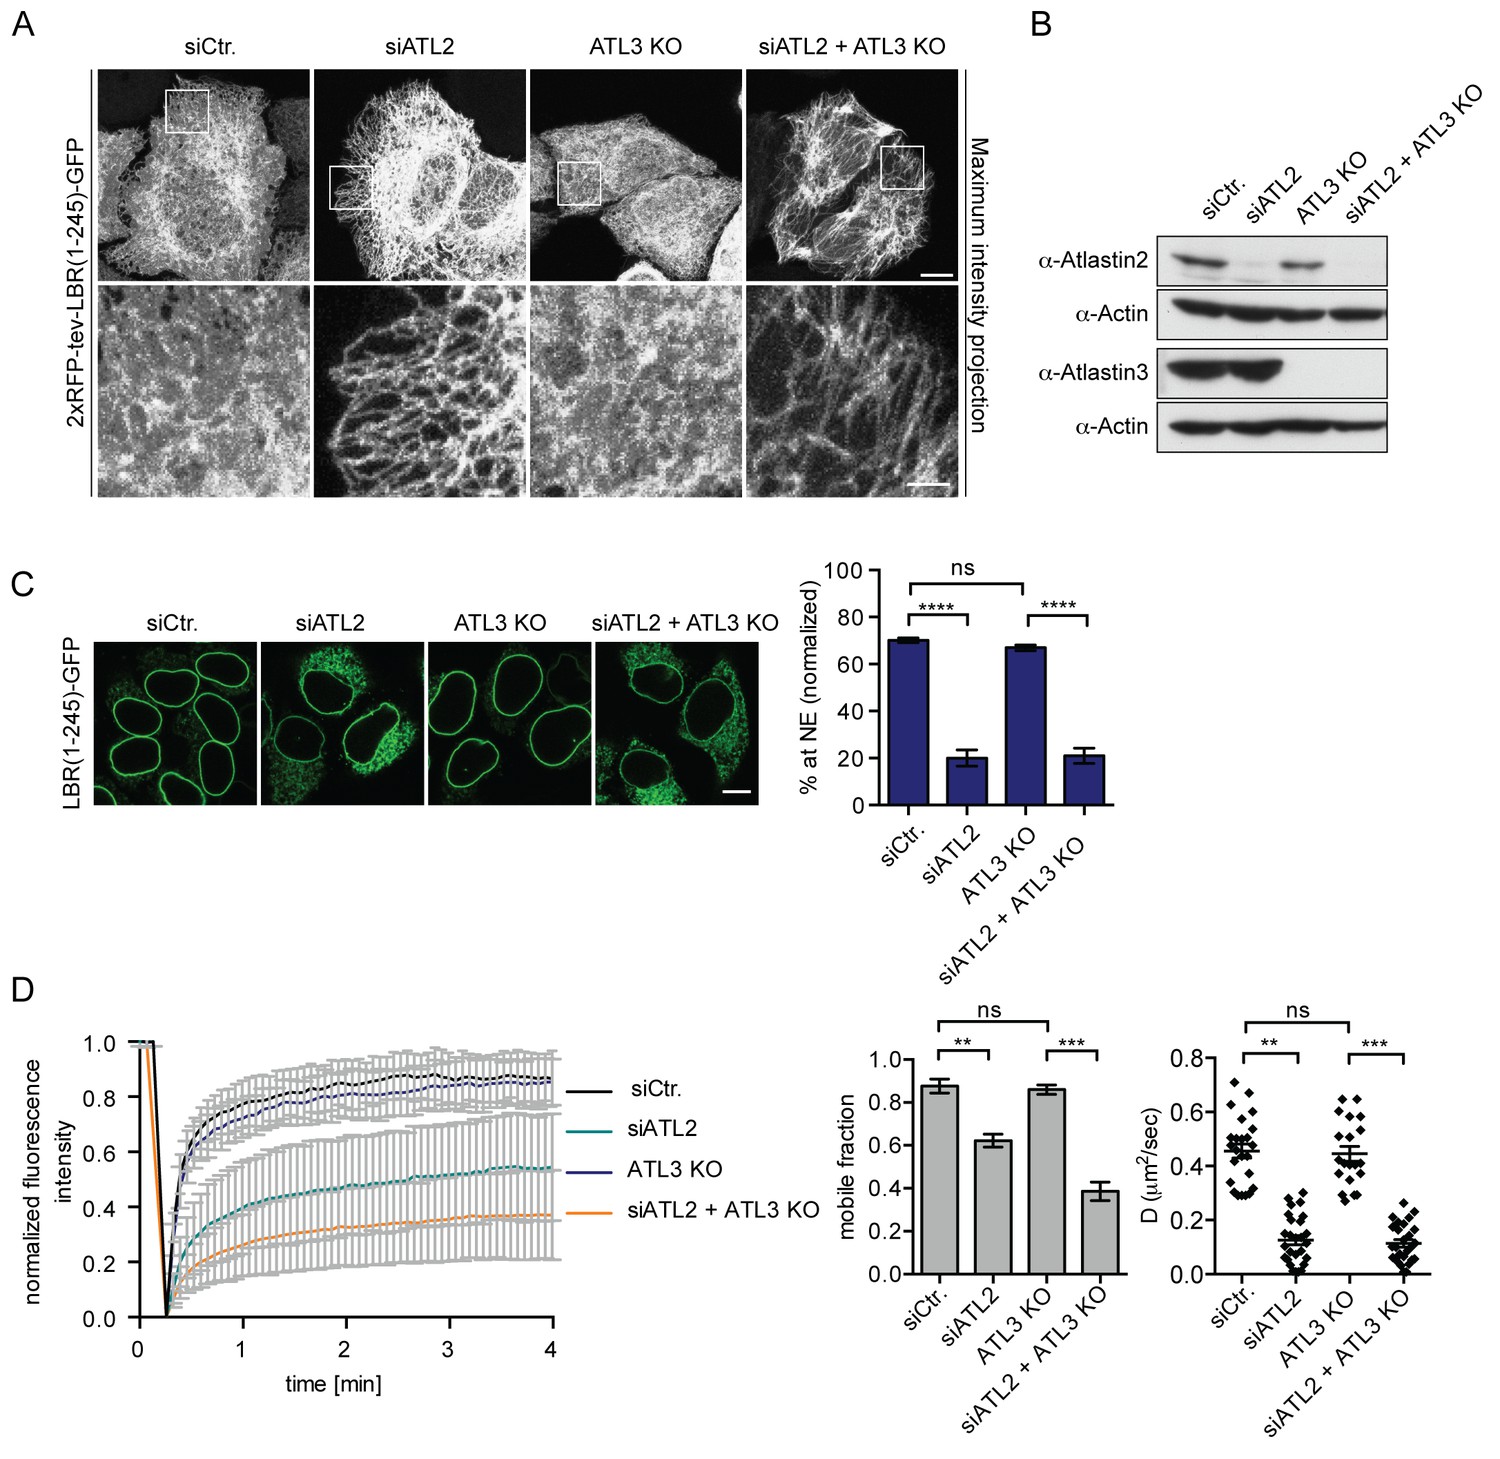
Atlastin 2 depletion impairs INM targeting in vitro.
(A) Representative images of 2xRFP-tev-LBR(1-245)-GFP expressing reporter cells and ATL3 knockout (KO) reporter cells that were depleted for ATL2 by RNAi as indicated. Maximum intensity projection of 6 images taken at 0.37 μm steps from the bottom of the cell up to the equator of the nucleus. Scale bars: 10 μm (upper panels); 2 μm (lower panels). (B) Western blot confirming the depletion of ATL2 and the knockout of ATL3. (C) Accumulation of LBR(1-245)-GFP at the NE in a panel of control or Atlastin-depleted semi-permeabilized cells 45 min after TEV cleavage and addition of HeLa cell lysate and energy. Mean ±SEM; N = 4; n ≥ 239; ****p<0.0001. Scale bar, 10 μm. (D) FRAP in the ER of semi-permeabilized parental or ATL3 KO cells expressing the 2xRFP-tev-LBR(1-245)-GFP reporter. Cells were treated with control or ATL2 siRNAs as indicated and supplemented with HeLa cell lysate and energy after semi-permebilization. Mean ±SD (left graph). Mobile fractions and apparent diffusion coefficients derived from FRAP experiments; Mean ±SEM; N = 3; n ≥ 21; **p<0.005.
Figure 4—figure supplement 1
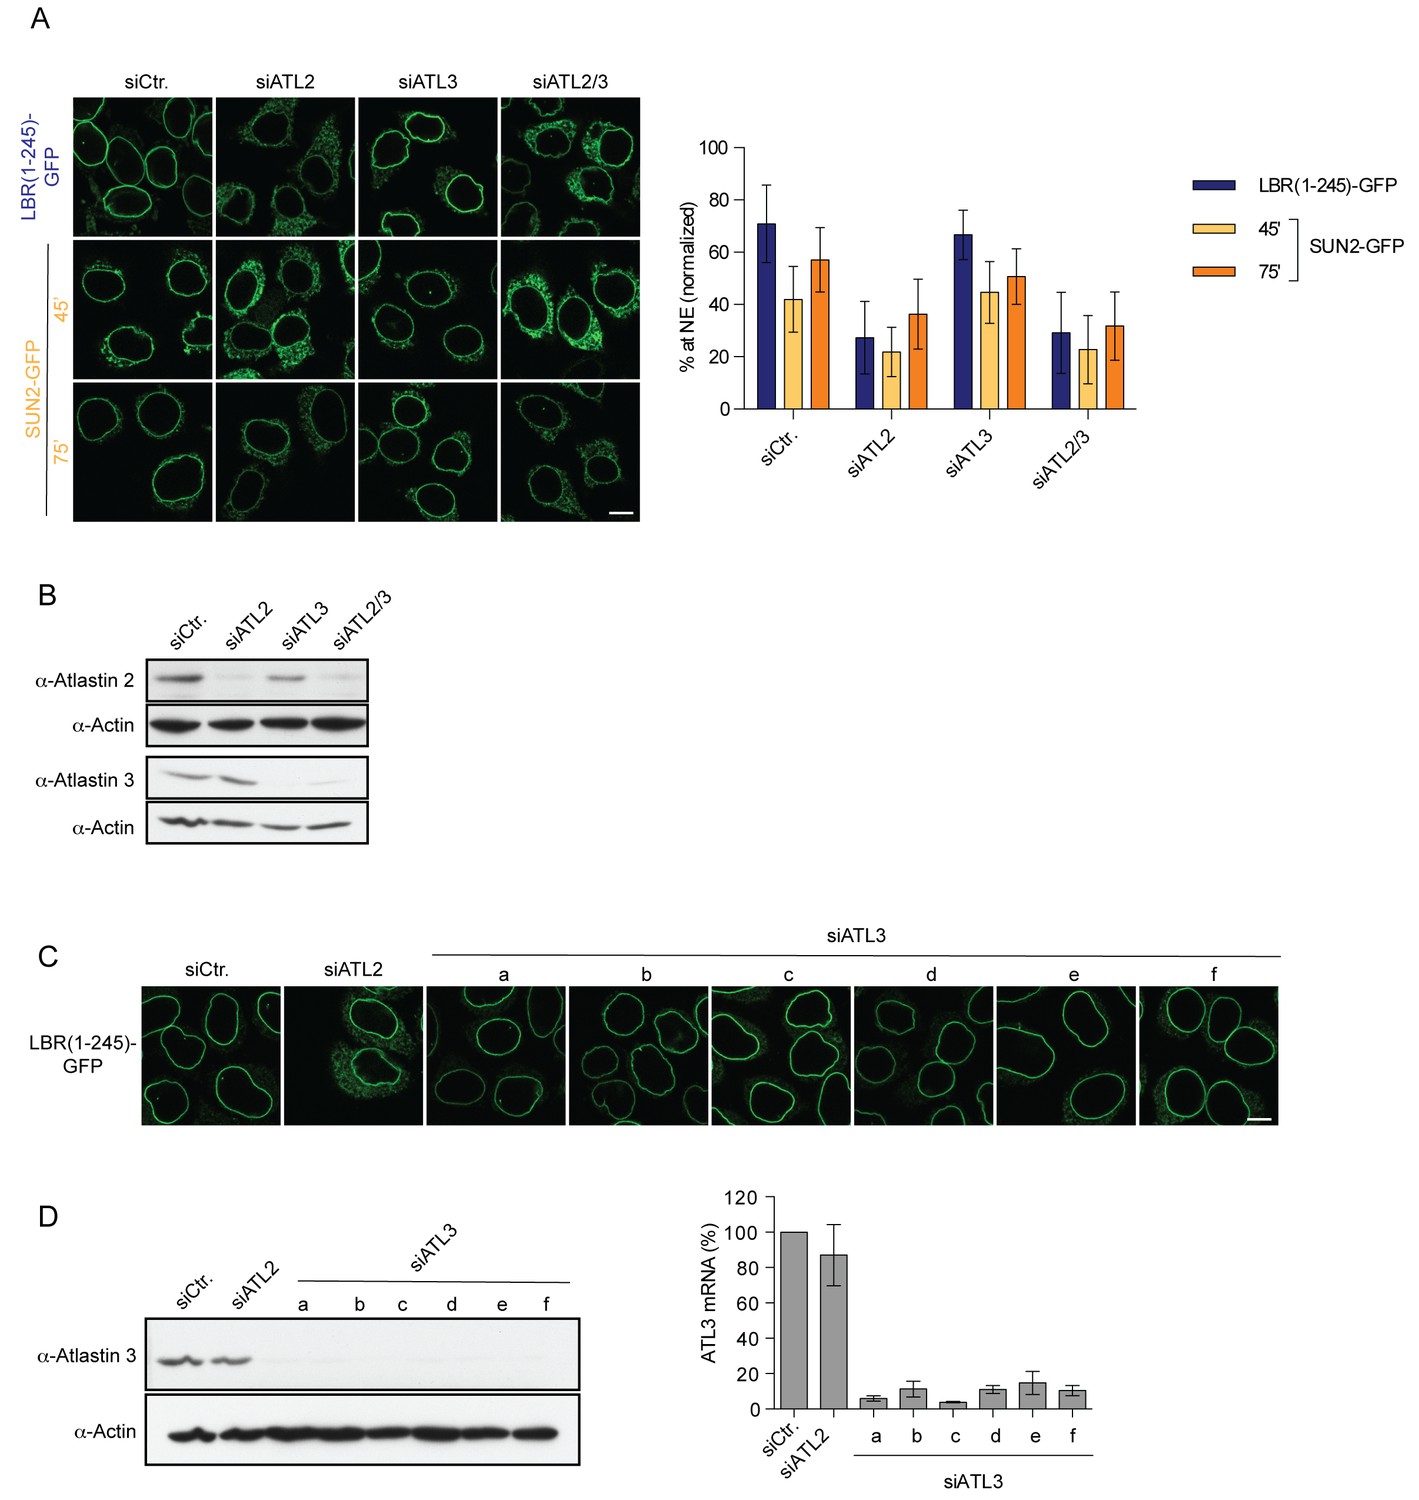
Targeting of LBR and SUN2 to the INM is ATL2-dependent.
(A) INM targeting of LBR(1-245)-GFP and SUN2-GFP in control cells and cells depleted of ATL2, ATL3, or co-depleted of ATL2 and ATL3 by siRNAs at the indicated time points after TEV cleavage and incubation in HeLa cell lysate and energy. Mean ±SD; n ≥ 84. Scale bar: 10 μm. (B) Western blot confirming siRNA-mediated knockdown of ATL2 and ATL3 in the experiment in A. (C) Targeting of LBR(1-245)-GFP to the NE in vitro after depletion of ATL3 with six distinct siRNAs. (D) Confirmation of siRNA-mediated knockdown of ATL3 for the experiment in C by Western blotting (left) and qRT-PCR (right).
Figure 4—figure supplement 2
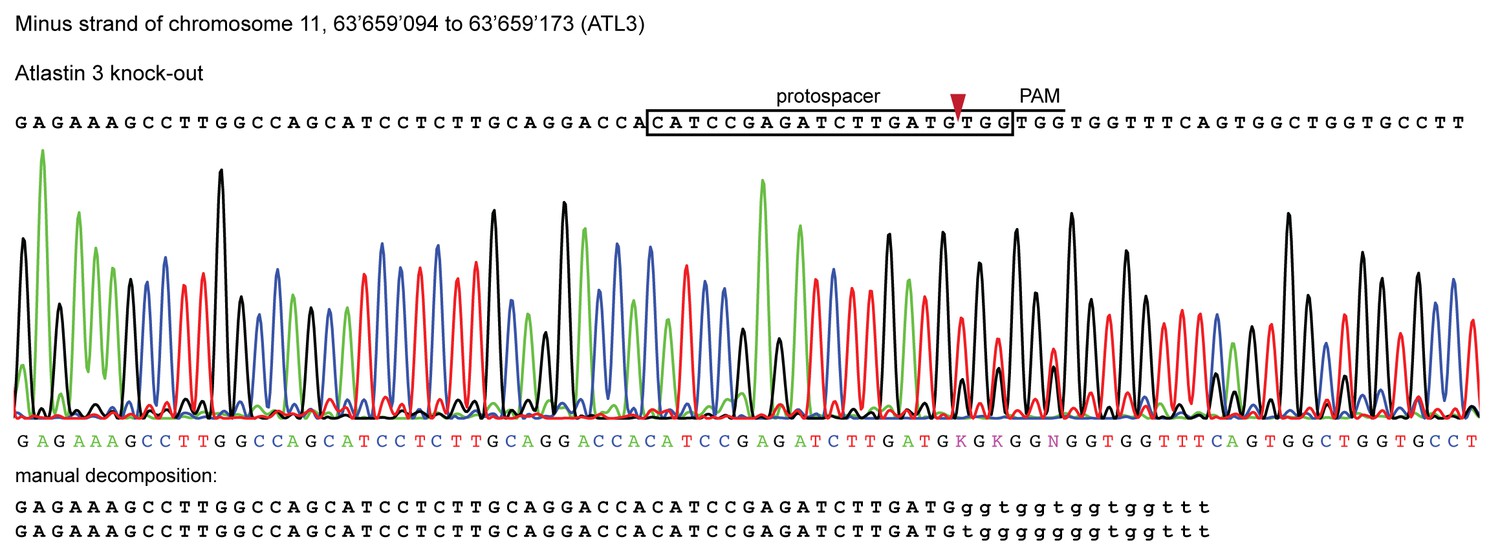
Validation of CRISPR/Cas9 knockout of ATL3 in HeLa cells.
Genomic sequence of the ATL3-/- isogenic clone used in this study. Sanger sequencing chromatograms show indel mutations in the ATL3 gene targeted by CRISPR. The top sequence (black) indicates the wild-type sequence of the target region and the location of the protospacer, protospacer adjacent motif (PAM) and the expected cleavage site (red arrow head). The overlapping peaks in the chromatogram of the sequenced clone indicate the presence of two different indel mutations in the two copies of the ATL3 gene. Manual decomposition of the chromatogram confirms frame-shift inducing indels in both alleles.
Figure 4—figure supplement 3

NE accumulation of the LBR-derived reporter proteins in the Atlastin depletion experiment reflects INM targeting.
Cells expressing 2xRFP-tev-LBR(1-245)-GFP were semi-permeabilized with digitonin. After TEV protease treatment, in vitro INM targeting reactions were allowed to proceed for 45 min. Then, semi-permeabilized cells were either directly immunostained (digitonin) or fully permeabilized with Triton X-100. Immunostaining was performed using antibodies against the N-terminal domain of LBR and against Lamin A/C, which served as a control for permeabilization of the NE. In control cells, LBR staining is only observed upon permeabilization of the NE with Triton X-100 but not in digitonin-treated cells, indicating INM localization of the reporter. NE permeabilization with Triton X-100 reveals the fraction of the reporter has reached the INM, evident by its accessibility to antibody. Scale bar, 10 µm.
Figure 5 with 1 supplement

Dominant-negative Atlastins (cytATL) cause defects in ER structure, dynamics and INM targeting.
(A) Representative images of the ER in U2OS cells overexpressing GFP-KDEL together with either RFP, cytATL2-RFP or cytATL2(R244Q)-RFP. The number of polygons within a 100 μm2 area was quantified as a measure for ER connectivity. Mean ±SEM; N ≥ 3; n ≥ 13; one to two 100 μm2 squares for each cell. Scale bars: 10 μm (upper panels); 2 μm (magnified lower panels). (B) ER dynamics was analyzed by live cell imaging in U2OS cells overexpressing RFP, cytATL2-RFP, or cytATL2(R244Q)-RFP (Videos 3, 4 and 5). The number of successful or unsuccessful membrane tubule attachments was quantified as in Figure 3F. Mean ±SEM; N = 4; n ≥ 16; two 100 μm2 squares for each cell; **p=0.005. (C) Targeting of LBR(1-245)-GFP to the NE in vitro in the presence of dominant-negative Atlastins. 2xRFP-tev-LBR(1-245)-GFP expressing reporter cells were semi-permeabilized. Then, the semi-permeabilized cells were pre-incubated with either buffer or 5 μM cytATL2, cytATL2(R244Q), cytATL3, cytATL3(R213Q) for 20 min at 37°C in buffer. After TEV cleavage of the reporter protein, energy and HeLa cell lysates supplemented with either buffer or 5 μM cytATL2, cytATL2(R244Q), cytATL3 or cytATL3(R213Q) were added. Reactions were allowed to proceed for 45 min, samples were fixed and NE targeting analyzed by confocal microscopy. Mean ±SEM; N ≥ 3; n ≥ 294; ***p<0.0005. Scale bar, 10 μm.
Figure 5—figure supplement 1
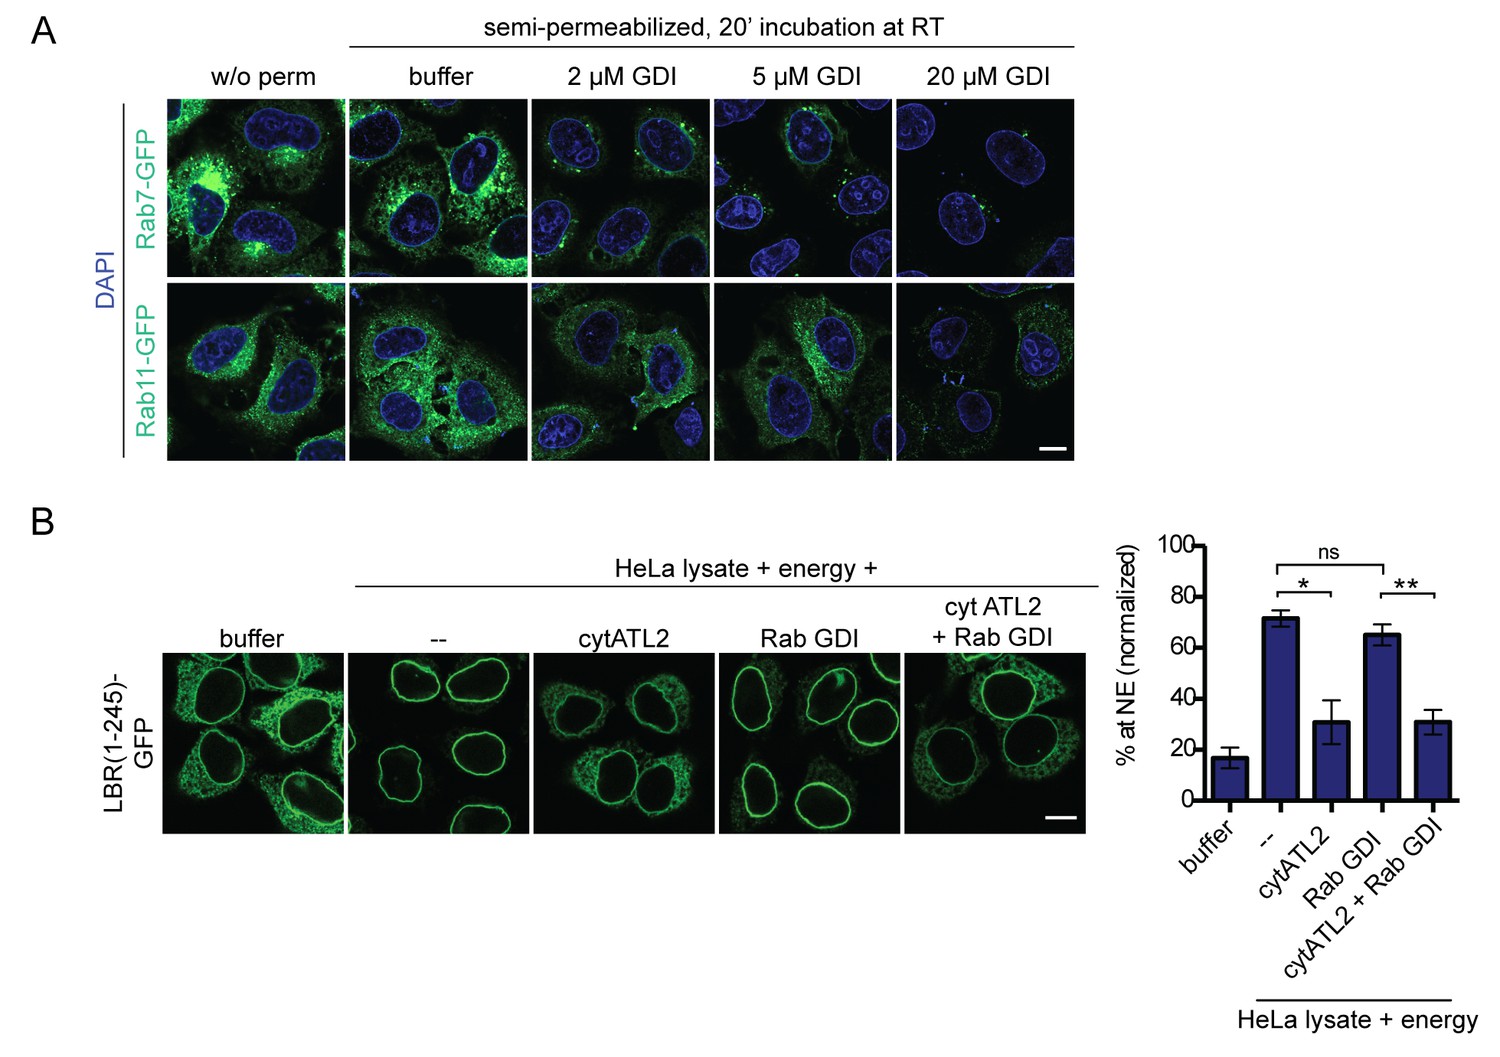
Addition of RabGDI does not impair INM targeting in vitro.
(A) HeLa cells were transfected with Rab7-GFP or Rab11-GFP (kind gifts of Ari Helenius). After 24 hr, cells were semi-permeabilized and incubated with the indicated concentrations of recombinant, purified RabGDI for 20 min at 37°C. After a washing step, cells were fixed and analyzed by confocal microscopy. Representative images illustrate the efficient release of Rabs from ER membranes upon incubation with 20 μM RabGDI. (B) Semi-permeabilized 2xRFP-tev-LBR(1-245)-GFP expressing reporter cells, were either mock treated or pre-incubated with 20 μM RabGDI and/or 5 μM cytATL2 for 20 min at 37°C as indicated. Then, the reporter was cleaved by TEV protease. INM targeting reactions were allowed to proceed in presence of HeLa cell lysate and energy for 45 min, in presence of 20 μM RabGDI and/or 5 μM cytATL2 as indicated. Mean ±SEM; N = 3; n ≥ 169. *p<0. 05; **p<0.005. Scale bar, 10 μm.
Figure 6 with 2 supplements
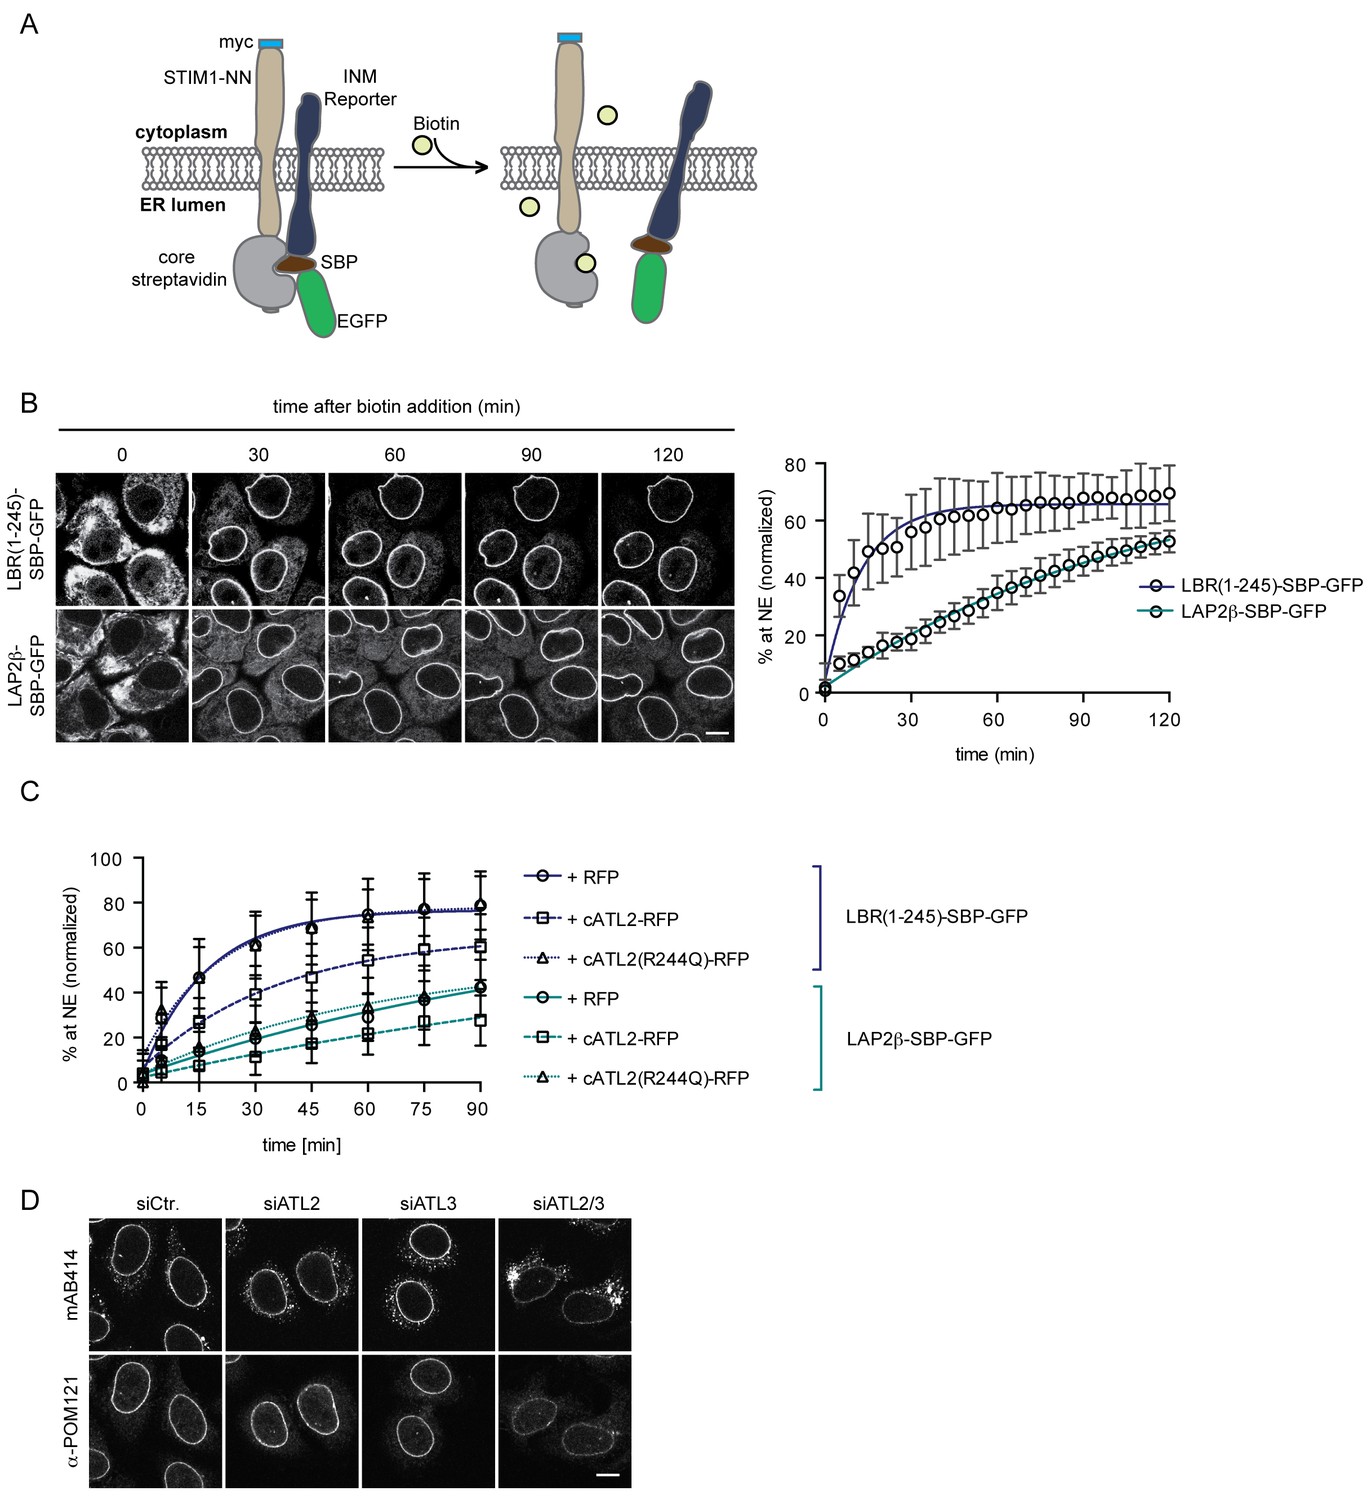
Loss of Atlastin function causes a kinetic delay in targeting of membrane proteins to the INM.
(A) Cartoon representation of the Retention Using Selective Hooks (RUSH) system (Boncompain et al., 2012), adapted here for the analysis of INM targeting in living cells. (B) HeLa cells stably expressing STIM1-NN-Strep as hook and the LBR(1-245)-SBP-GFP or LAP2β-SBP-GFP INM targeting reporters were imaged by confocal live cell microscopy in 5 min intervals after release of the reporters from the hook by addition of 250 μM biotin. Accumulation of the reporters at the NE over time was measured using ImageJ. Mean ±SEM; N = 3; n > 76. Scale bar, 10 μm. (C) INM-RUSH reporter cells were transfected with cytATL2-RFP, cytATL2(R244Q)-RFP or RFP alone. After 24 hr, INM-destined reporters were released with biotin and their accumulation at the NE was followed by time-lapse microscopy and quantified as in B. Mean ±SD; N ≥ 2; n ≥ 24. (D) Immunofluorescence staining of cells depleted of Atlastins as indicated using mAB414 and POM121 antibodies. Note that co-depletion of ATL2 and ATL3 causes an NPC biogenesis defect, manifesting by reduced staining of the NE and accumulation of nucleoporins in cytoplasmic structures.
Figure 6—figure supplement 1

INM-RUSH reporters reach the INM after biotin-mediated release from the ER.
Cells expressing STIM1-NN-Strep and LBR(1-245)-SBP-GFP or LAP2β-SBP-GFP were incubated with biotin for 90 min or overnight and then semi-permeabilized with digitonin. To discriminate between antibody epitopes in the cytoplasm or the nuclear interior, cells were either immunostained directly or fully permeabilized with 0.2% Triton X-100. Antibodies used in the assay were directed against the N-terminus of LBR or LAP2β, which are facing the nuclear interior if proteins reached the INM and should thus not be detectable in digitonin permeabilized cells. Co-staining with Lamin A/C or Lamin B1 served as a control for NE permeabilization. Scale bars, 10 µm.
Figure 6—figure supplement 2
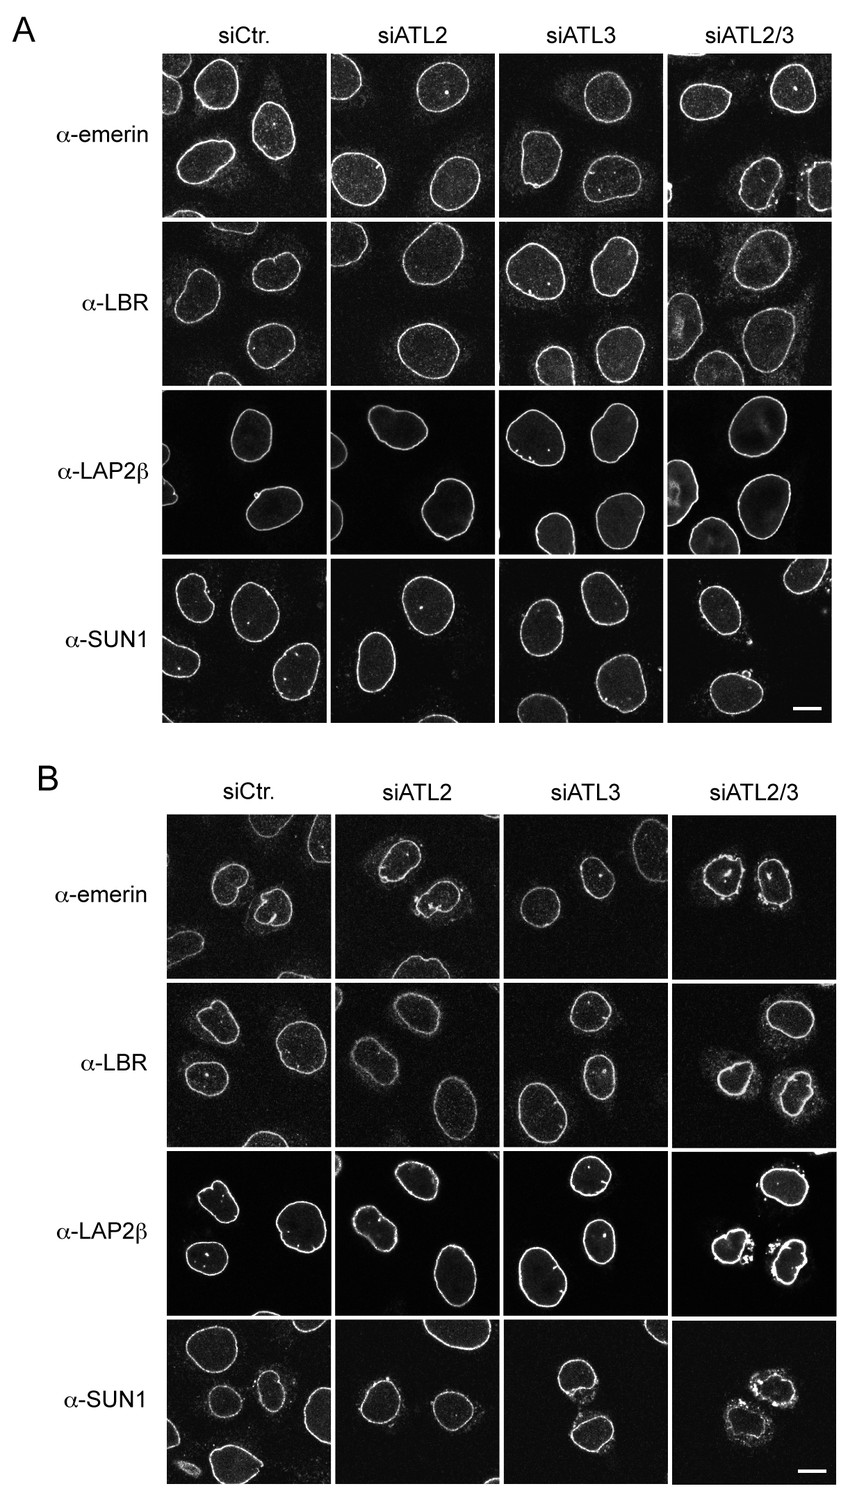
Localization of INM proteins after Atlastin depletion.
(A) Steady state levels of INM proteins at the NE are unaffected by Atlastin depletion in most unsynchronized interphase cells. Immunofluorescence staining with emerin, LAP2β, LBR, and SUN1 antibodies in control cells, and in cells depleted of ATL2, ATL3, or both ATL2 and 3. Scale bar, 10 μm. (B) Inefficient NE targeting of INM proteins in early G1 upon co-depletion of ATL2 and ATL3 in HeLa cells. Cells were synchronized with thymidine and released to progress through mitosis. 12 hr after release, cells were fixed and analyzed by immunofluorescence using antibodies directed against emerin, LBR, LAP2β and SUN1. Note that LBR and LAP2β. Scale bar, 10 μm..
Figure 7 with 1 supplement
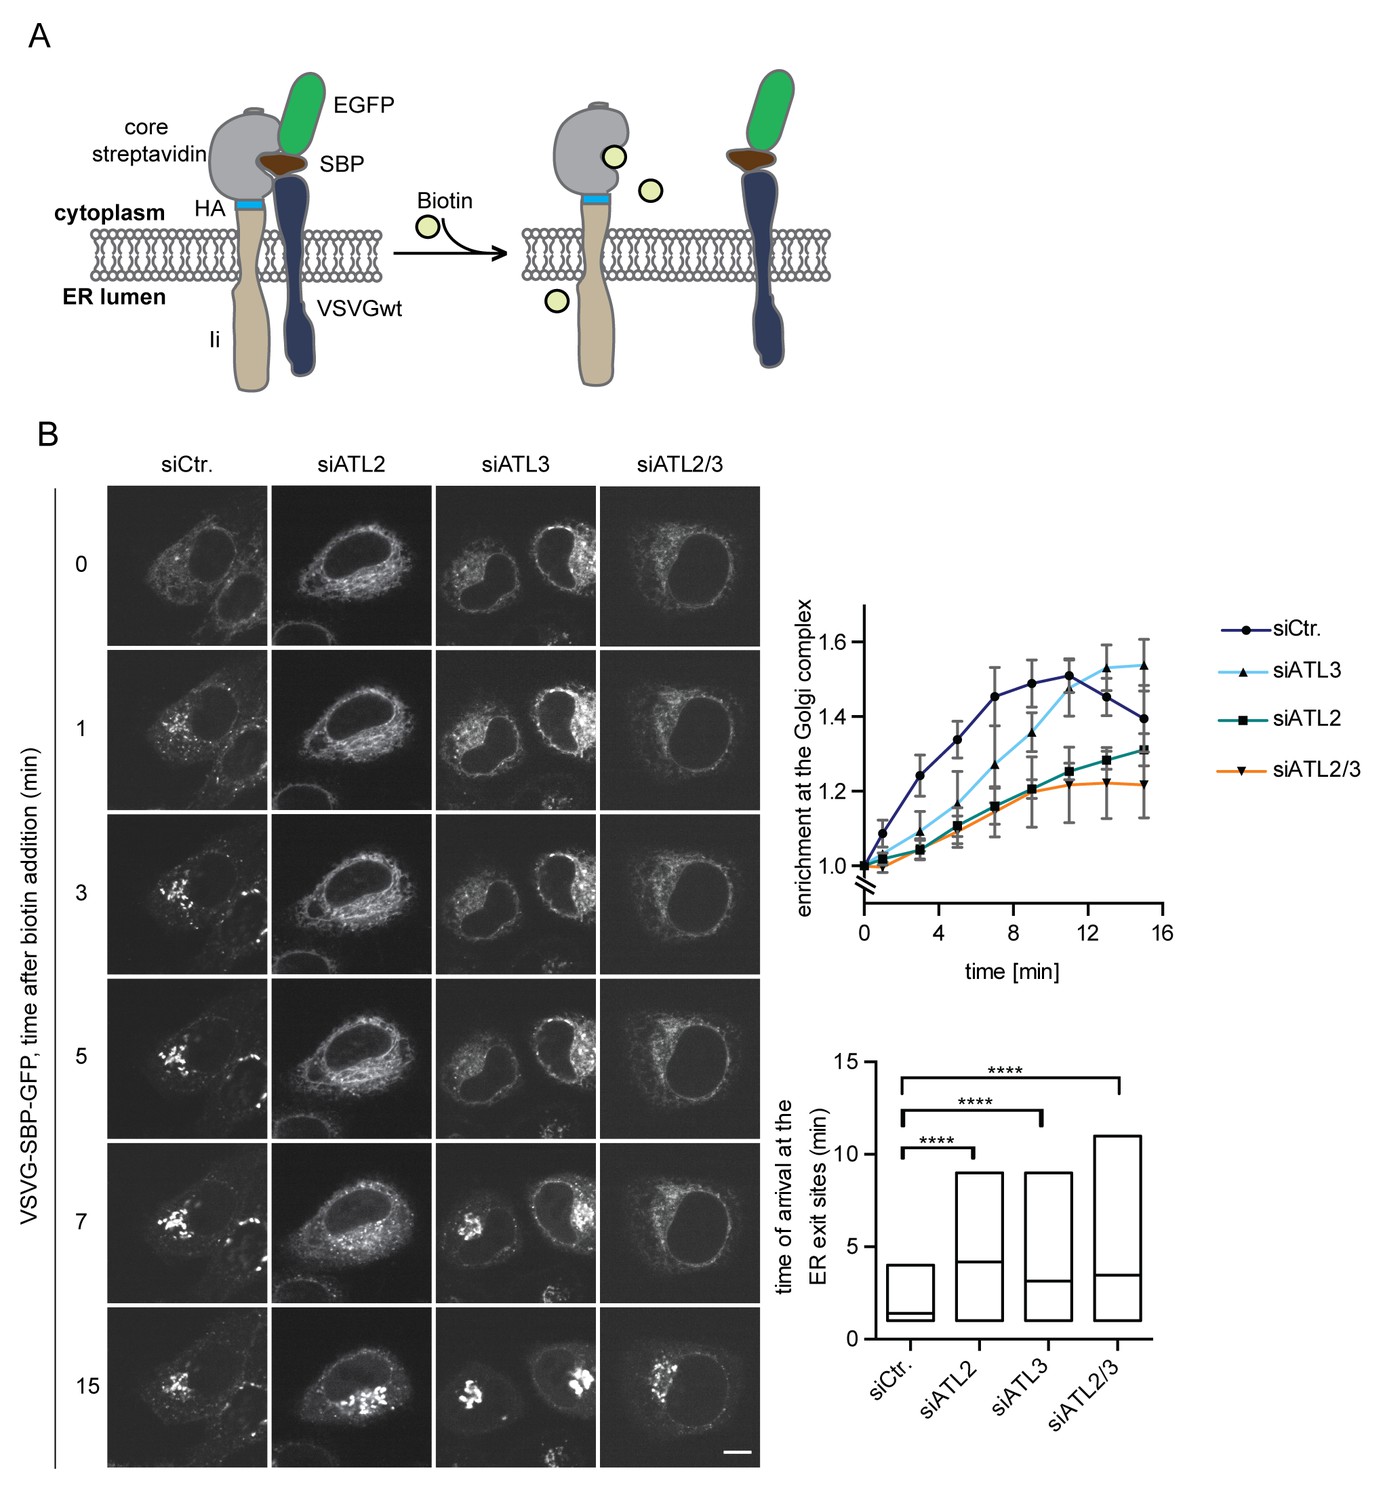
Atlastin depletion affects secretory trafficking.
(A) Cartoon representation of the RUSH system to allow for synchronized secretory trafficking of membrane proteins out of the ER in live cells (Boncompain et al., 2012). (B) HeLa cells expressing Strep-Ii as hook and VSVG-SBP-GFP reporter were imaged by live cell microscopy in 1 min intervals after release of the reporters from the hook upon addition of 250 μM biotin. Enrichment of the reporter at the Golgi complex over time in control or Atlastin-depleted cells was measured using ImageJ (upper graph). Mean ±SEM; N = 3, n ≥ 21. Box plots representing the range of observed time points at which the reporter got enriched in bright puncta (lower graph). N = 3, n ≥ 21, ****p<0.0001. Scale bars, 10 µm.
Figure 7—figure supplement 1
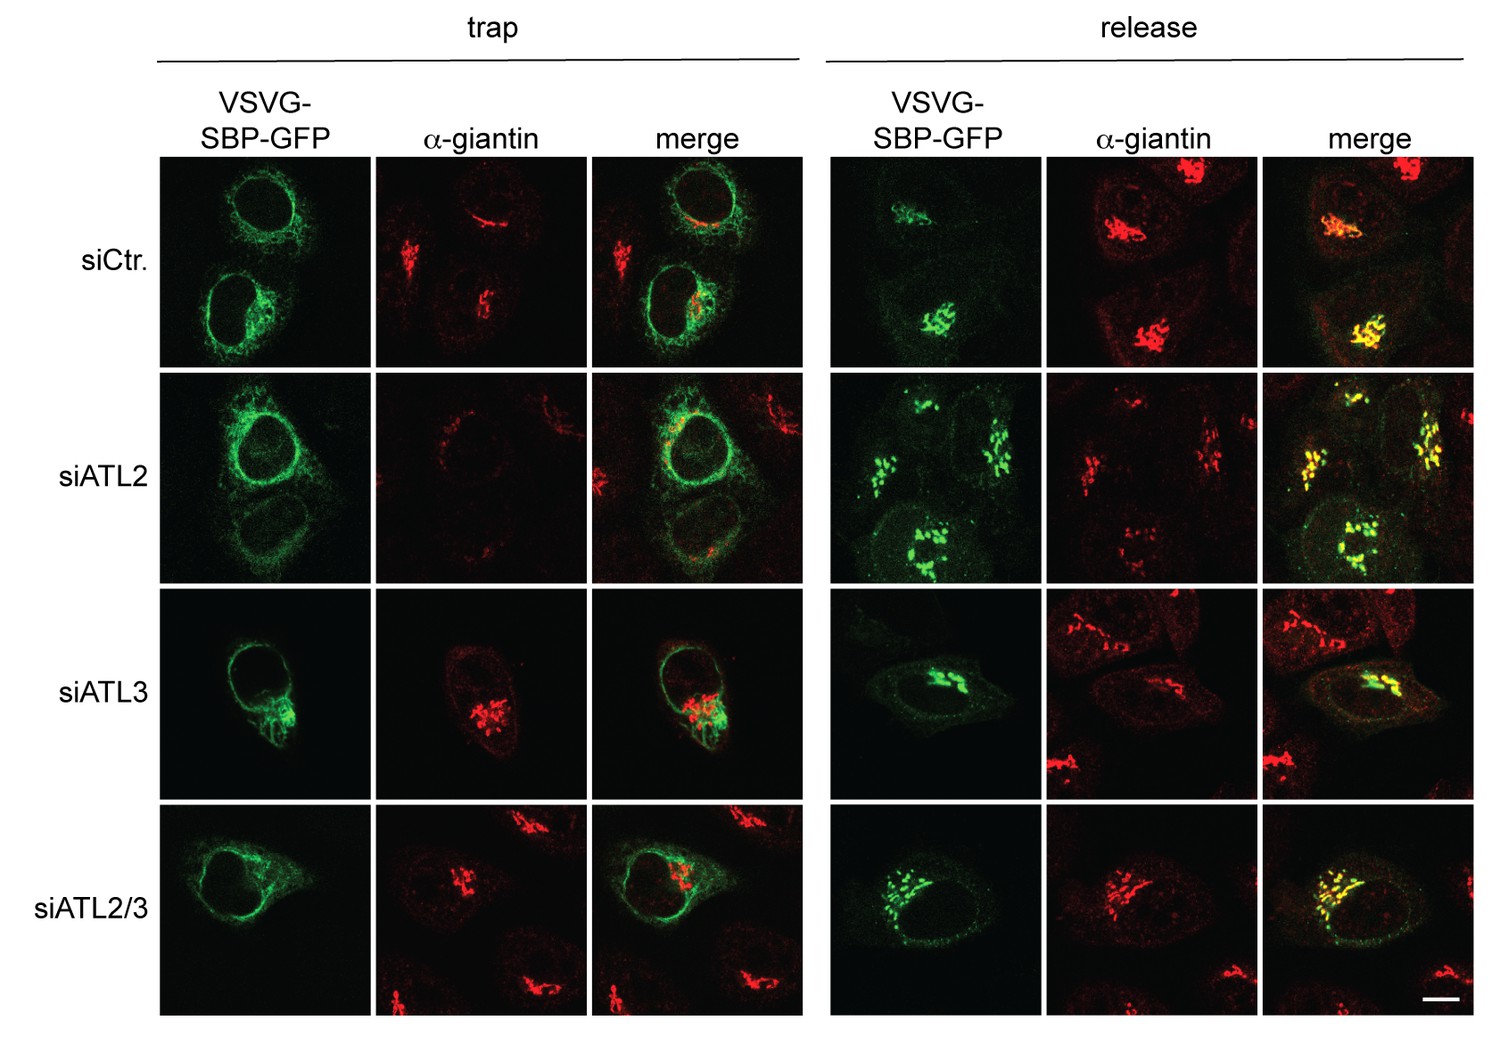
The VSVG(wt)-SBP-GFP reporter protein is transported to the Golgi complex after biotin-mediated release from the ER in Atlastin-depleted cells.
HeLa cells transfected with Strep-Ii as a hook and VSVG(wt)-SBP-GFP as a reporter were either left untreated or incubated in presence of 250 μM biotin for 15 min and then fixed with 4% PFA. To stain the Golgi complex, cells were permeabilized with 0.2% Triton X-100 and immunostained with an antibody directed against giantin. Scale bar, 10 µm.
Videos
Video 1
ER remodeling in cells injected with GTP.
ER dynamics in U2OS cells expressing GFP-KDEL microinjected with a solution containing 10 mM GTP and fluorescent dextran. Images were acquired with a spinning disk microscope at 1 s intervals for 1 min. The video is displayed at 4 frames/s. Image scale: 10 × 10 μm.
Video 2
Cells injected with GTPγS show drastically reduced remodeling events in the ER.
ER dynamics in U2OS cells expressing GFP-KDEL shortly (>5 min) after microinjection with a solution containing 10 mM GTPγS and fluorescent dextran. Images were acquired with a spinning disk microscope at 1 s intervals for 1 min. The video is displayed at 4 frames/s. Image scale: 10 × 10 μm.
Video 3
ER undergoes extensive remodeling in control cells expressing RFP.
ER dynamics in U2OS cells co-expressing GFP-KDEL and RFP. Images were acquired with a spinning disk microscope at 1 s intervals for 1 min. The video is displayed at 4 frames/s. Image scale: 10 × 10 μm.
Video 4
ER dynamics in cells over-expressing dominant-negative ATL2 (cytATL2-RFP) is compromised, similar to cells injected with GTPγS (Video 2).
ER dynamics in U2OS cells co-expressing GFP-KDEL and cytATL2-RFP. Images were acquired with a spinning disk microscope at 1 s intervals for 1 min. The video is displayed at 4 frames/s. Image scale: 10 × 10 μm.
Video 5
ER remodeling is unaffected in cells expressing cytATL2(R244Q)-RFP.
ER dynamics in U2OS cells co-expressing GFP-KDEL and cytATL2(R244Q)-RFP. Images were acquired with a spinning disk microscope at 1 s intervals for 1 min. The video is displayed at 4 frames/s. Image scale: 10 × 10 μm.
Additional files
-
Transparent reporting form
- https://doi.org/10.7554/eLife.28202.021
Download links
A two-part list of links to download the article, or parts of the article, in various formats.
Downloads (link to download the article as PDF)
Open citations (links to open the citations from this article in various online reference manager services)
Cite this article (links to download the citations from this article in formats compatible with various reference manager tools)
Efficient protein targeting to the inner nuclear membrane requires Atlastin-dependent maintenance of ER topology
eLife 6:e28202.
https://doi.org/10.7554/eLife.28202


