Deep transcriptome annotation enables the discovery and functional characterization of cryptic small proteins
- Université de Sherbrooke, Canada
- Québec Network for Research on Protein Function, Structure and Engineering, Canada
- Université de Lille, France
- Université Laval, Canada
Figures
Figure 1 with 2 supplements
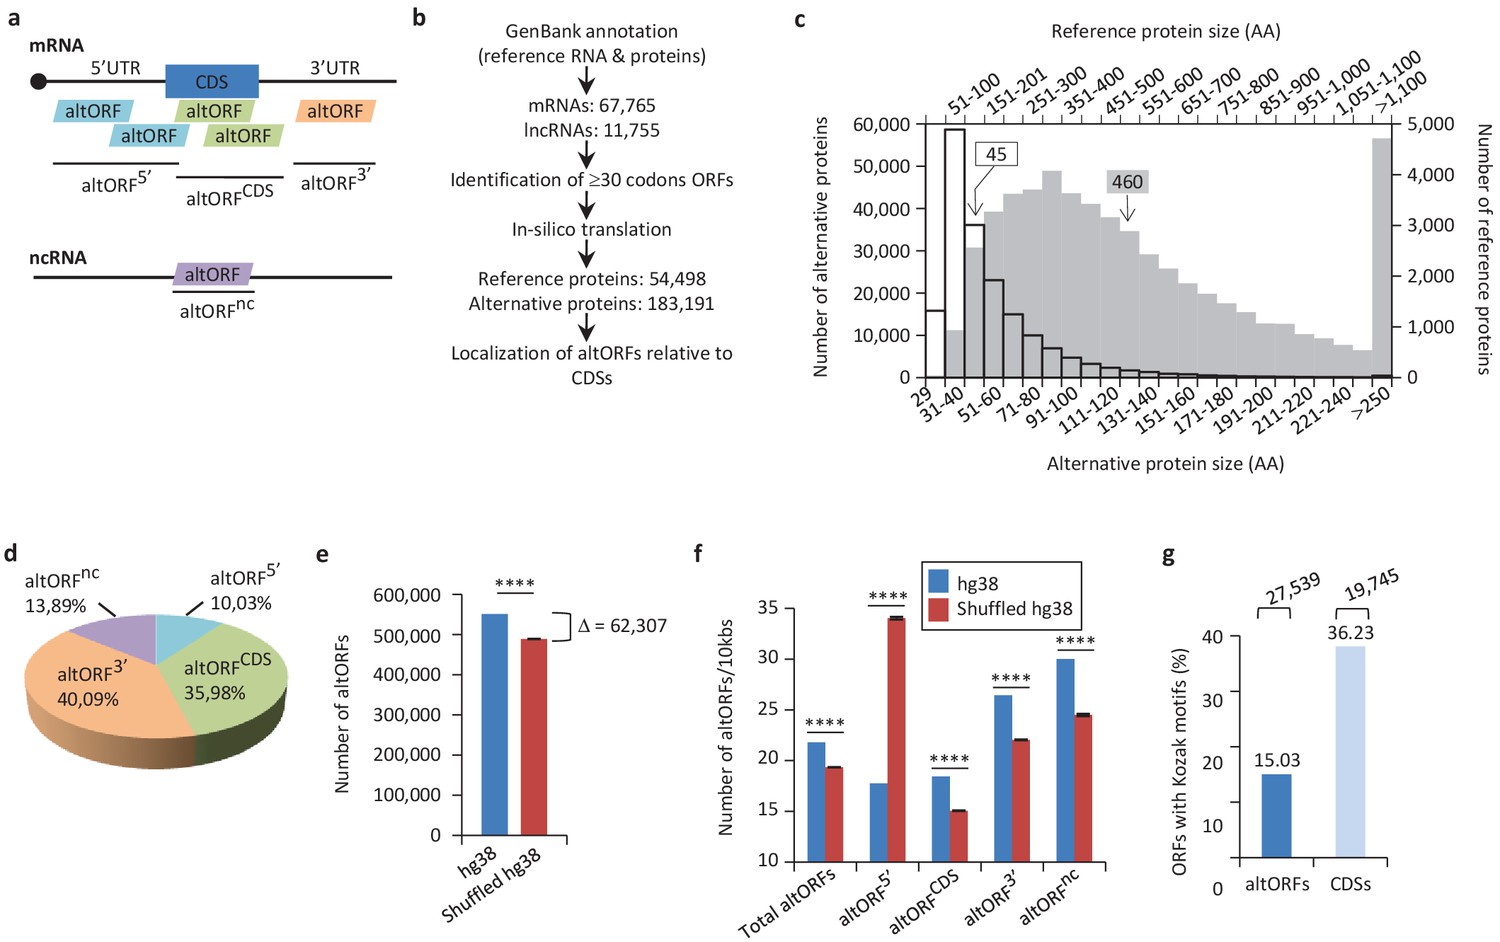
Annotation of human altORFs.
(a) AltORF nomenclature. AltORFs partially overlapping the CDS must be in a different reading frame. (b) Pipeline for the identification of altORFs. (c) Size distribution of alternative (empty bars, vertical and horizontal axes) and reference (grey bars, secondary horizontal and vertical axes) proteins. Arrows indicate the median size. The median alternative protein length is 45 amino acids (AA) compared to 460 for the reference proteins. (d) Distribution of altORFs in the human hg38 transcriptome. (e, f) Number of total altORFs (e) or number of altORFs/10kbs (f) in hg38 compared to shuffled hg38. Means and standard deviations for 100 replicates obtained by sequence shuffling are shown. Statistical significance was determined by using one sample t-test with two-tailed p-values. ****p<0.0001. (g) Percentage of altORFs with an optimal Kozak motif. The total number of altORFs with an optimal Kozak motif is also indicated at the top.
-
Figure 1—source data 1
Annotation of human altORFs.
- https://doi.org/10.7554/eLife.27860.008
Figure 1—figure supplement 1
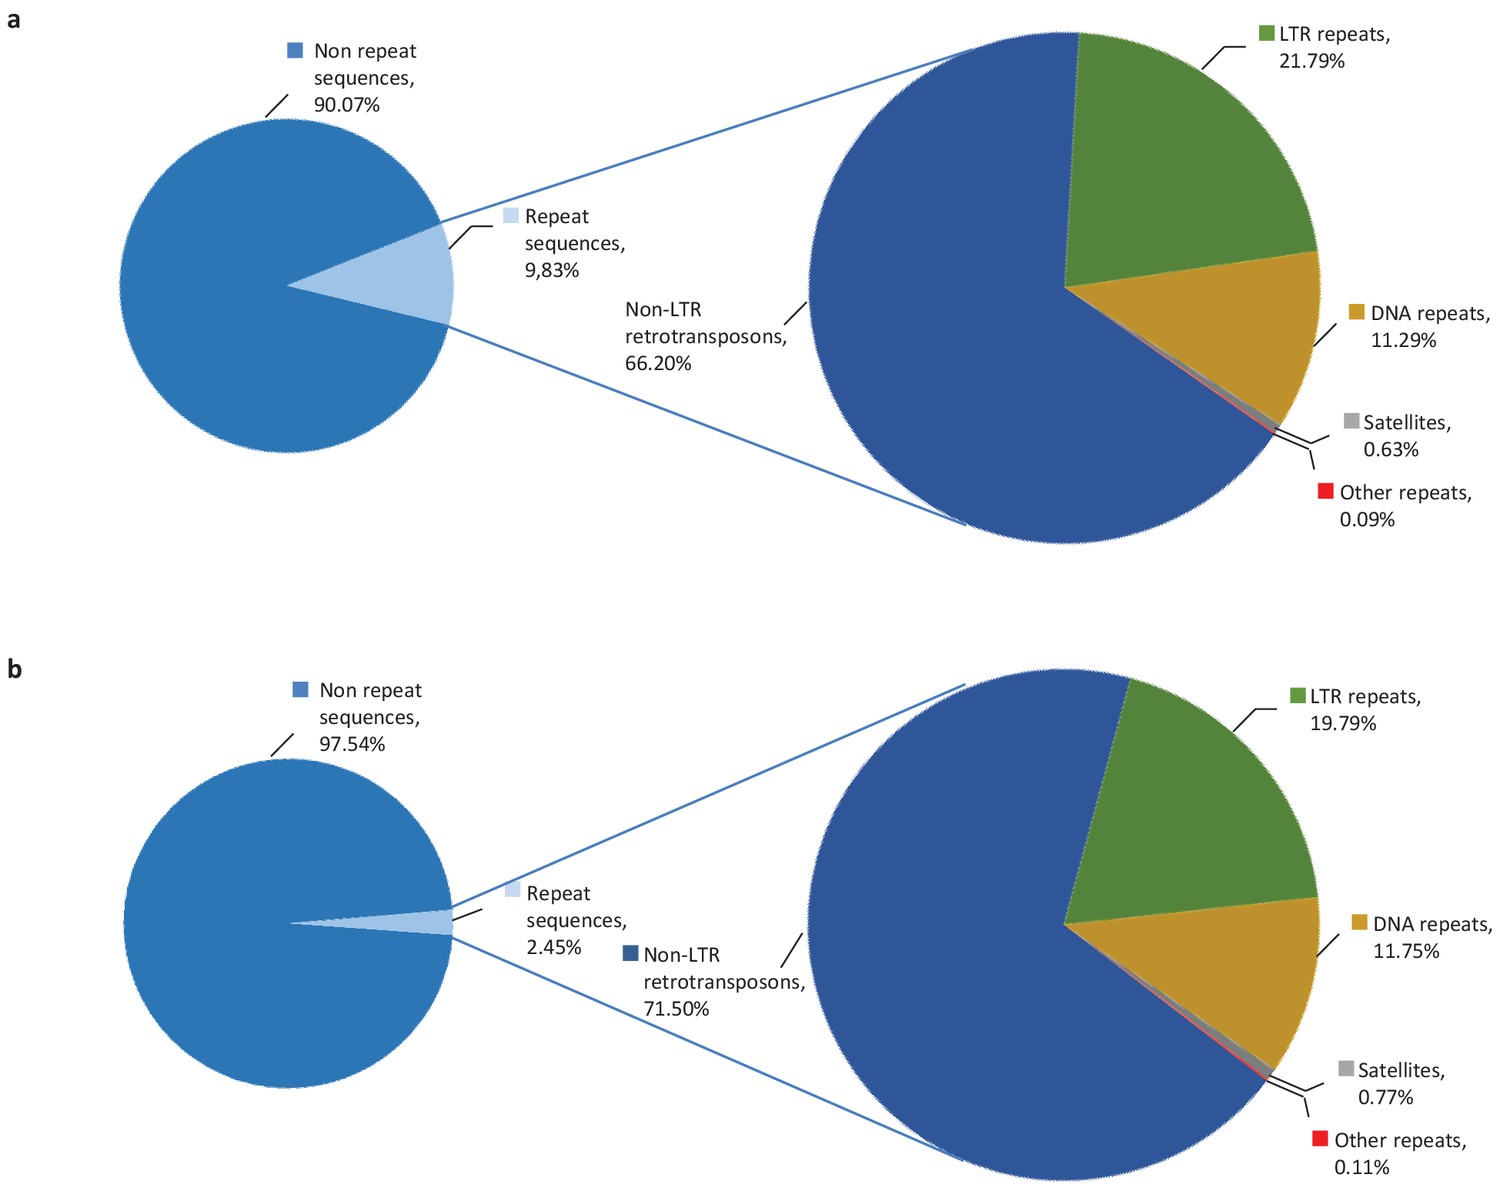
10% of altORFs are present in different classes of repeats.
While more than half of the human genome is composed of repeated sequences, only 9.83% or 18,003 altORFs are located inside these repeats (a), compared to 2,45% or 1,677 CDSs (b). AltORFs and CDSs are detected in non-LTR retrotransposons (LINEs, SINEs, SINE-VNTR-Alus), LTR repeats, DNA repeats, satellites and other repeats. Proportions were determined using RepeatMasker (version 3.3.0).
-
Figure 1—figure supplement 1—source data 1
10% altORFs are present in different classes of repeats.
- https://doi.org/10.7554/eLife.27860.005
Figure 1—figure supplement 2

The proportion of altORFs with a translation initiation site (TIS) with a Kozak motif in hg38 is significantly different from 100 shuffled hg38 transcriptomes.
Percentage of altORFs with a TIS within an optimal Kozak sequence in hg38 (dark blue) compared to 100 shuffled hg38 (light blue). Mean and standard deviations for sequence shuffling are displayed, and significant difference was defined by using one sample t-test. ****p<0.0001. Note that shuffling all transcripts in the hg38 transcriptome generates a total of 489,073 altORFs on average, compared to 539,134 altORFs in hg38. Most transcripts result from alternative splicing and there are 183,191 unique altORFs in the hg38 transcriptome, while the 489,073 altORFs in shuffled transcriptomes are all unique. Figure 1g shows the percentage of unique altORFs with a kozak motif (15%), while the current figure shows the percentage of altORFs with a kozak motif relative to the total number of altORFs (14%).
-
Figure 1—figure supplement 2—source data 1
Proportion of altORFs with a Kozak motif in hg38 and shuffled hg38.
- https://doi.org/10.7554/eLife.27860.007
Figure 2
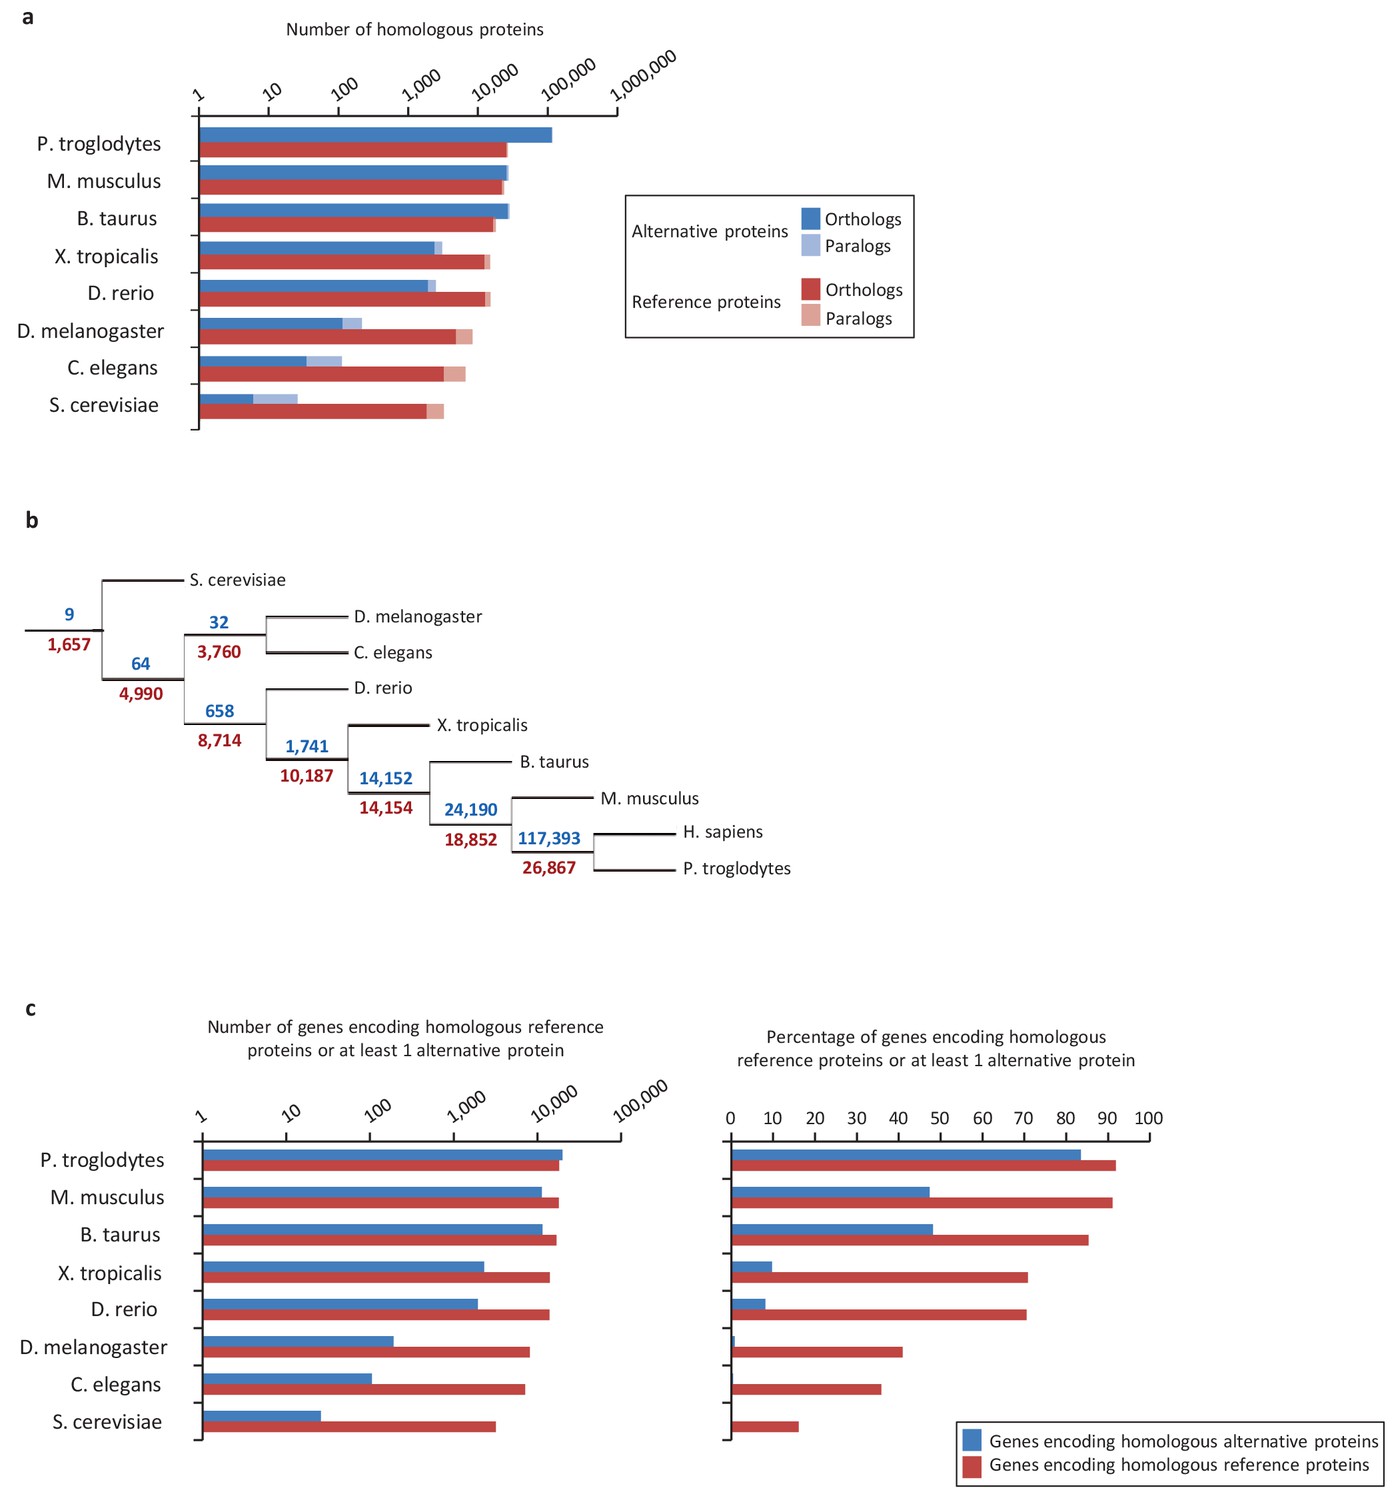
Conservation of alternative and reference proteins across different species.
(a) Number of orthologous and paralogous alternative and reference proteins between H. sapiens and other species (pairwise study). (b) Phylogenetic tree: conservation of alternative (blue) and reference (red) proteins across various eukaryotic species. (c) Number and fraction of genes encoding homologous reference proteins or at least one homologous alternative protein between H. sapiens and other species (pairwise study).
-
Figure 2—source data 1
Conservation of alternative and reference proteins across different species.
- https://doi.org/10.7554/eLife.27860.011
Figure 3
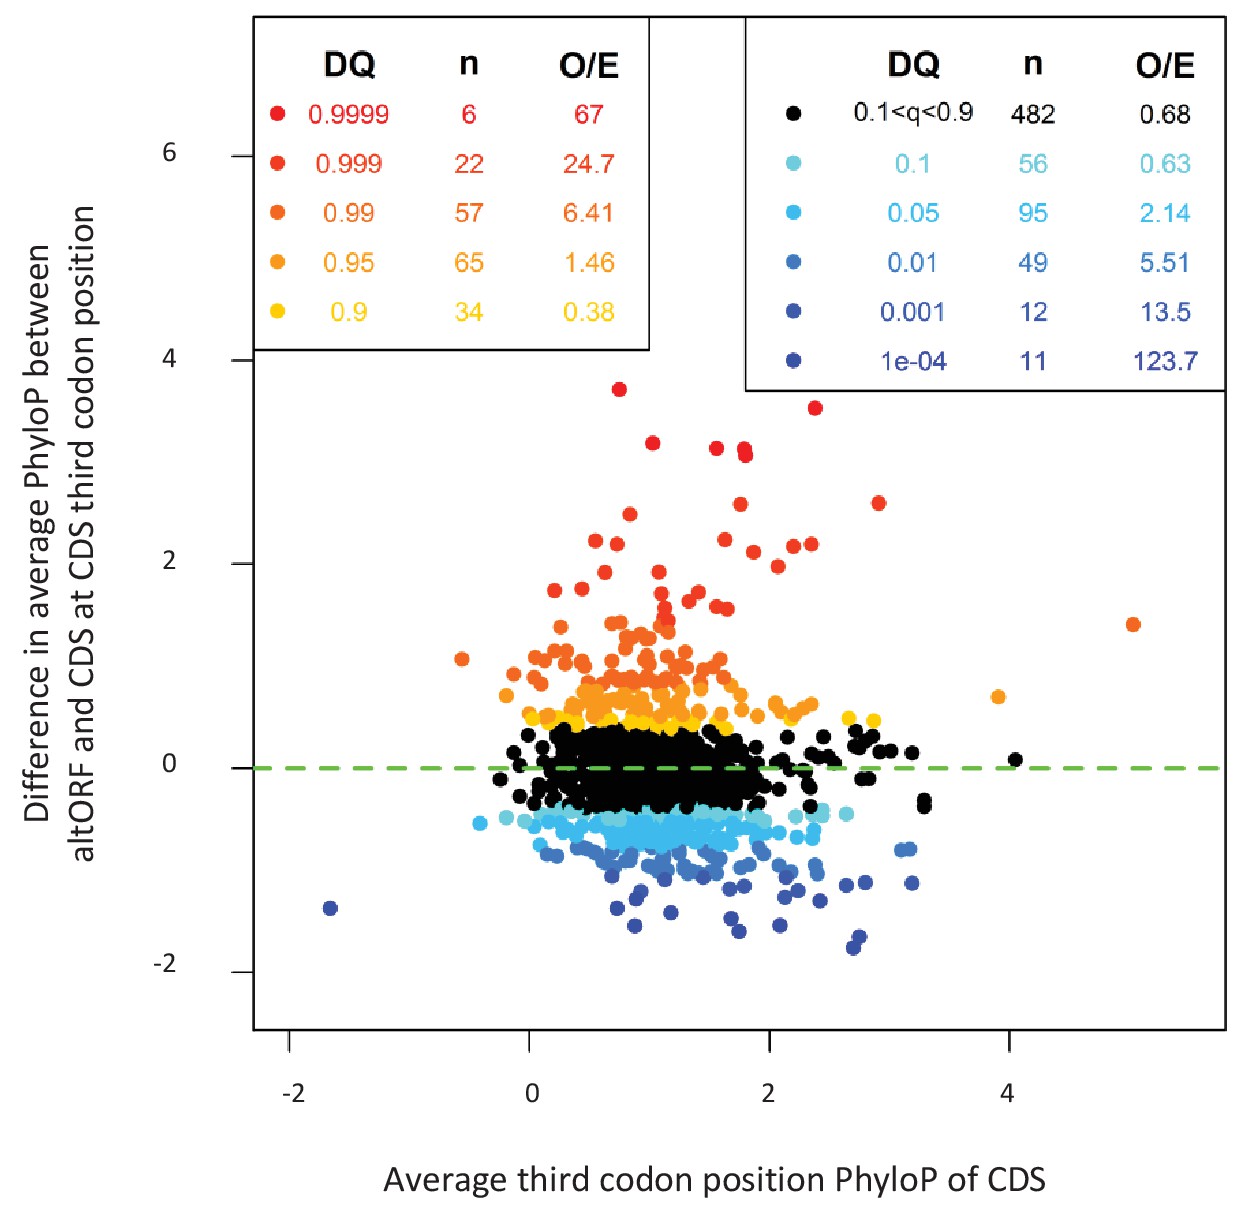
AltORFs completely nested within CDSs show more extreme PhyloP values (more conserved or faster evolving) than their CDSs.
Differences between altORF and CDS PhyloP scores (altORF PhyloP – CDS PhyloP, y-axis) are plotted against PhyloPs for their respective CDSs (x-axis). We restricted the analysis to altORF-CDS pairs that were conserved from humans to zebrafish. The plot contains 889 CDSs containing at least one fully nested altORF, paired with one of its altORFs selected at random (to avoid problems with statistical non-independence). PhyloPs for both altORFs and CDSs are based on third codons in the CDS reading frame, calculated across 100 vertebrate species. We compared these differences to those generated based on five random regions in CDSs with a similar length as altORFs. Expected quantiles of the differences (‘DQ’ columns) were identified and compared to the observed differences. We show the absolute numbers (‘n’) and observed-to-expected ratios (‘O/E’) for each quantile. There are clearly substantial over-representations of extreme values (red signaling conservation DQ 0.95, and blue signaling accelerated evolution DQ 0.05) with 317 of 889 altORFs (35.7%). A random distribution would have implied a total of 10% (or 89) of altORFs in the extreme values. This suggests that 25.7% (35.7delete–10%) of these 889 altORFs undergo specific selection different from random regions in their CDSs with a similar length distribution.
-
Figure 3—source data 1
Number of orthologous and co-conserved alternative and reference proteins between H. sapiens and other species (pairwise).
- https://doi.org/10.7554/eLife.27860.013
Figure 4
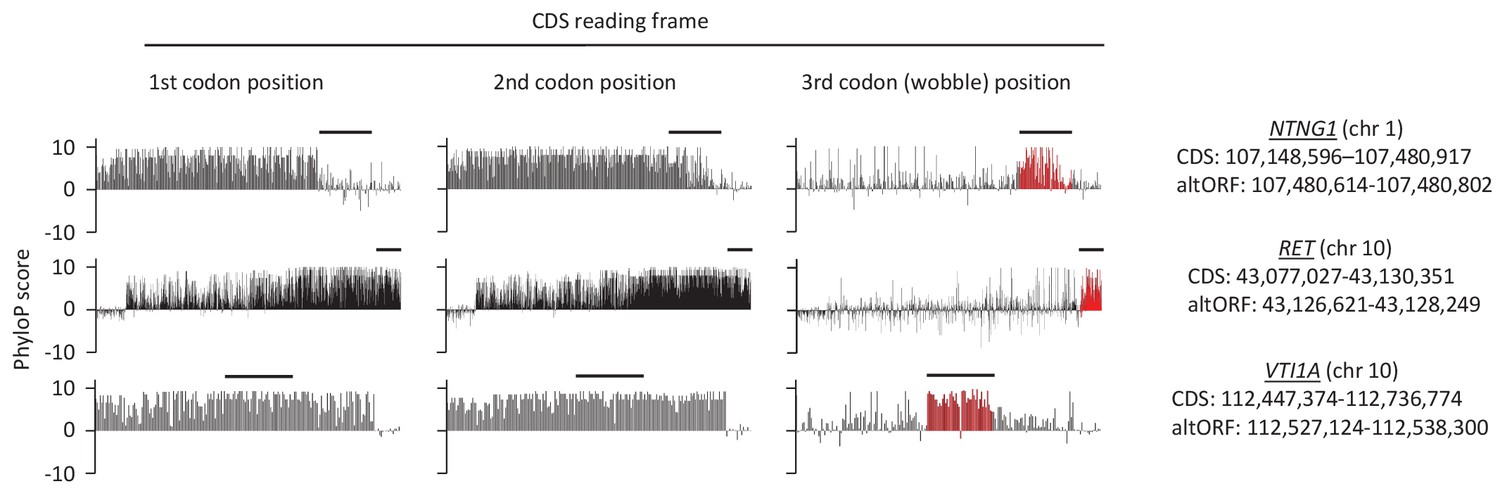
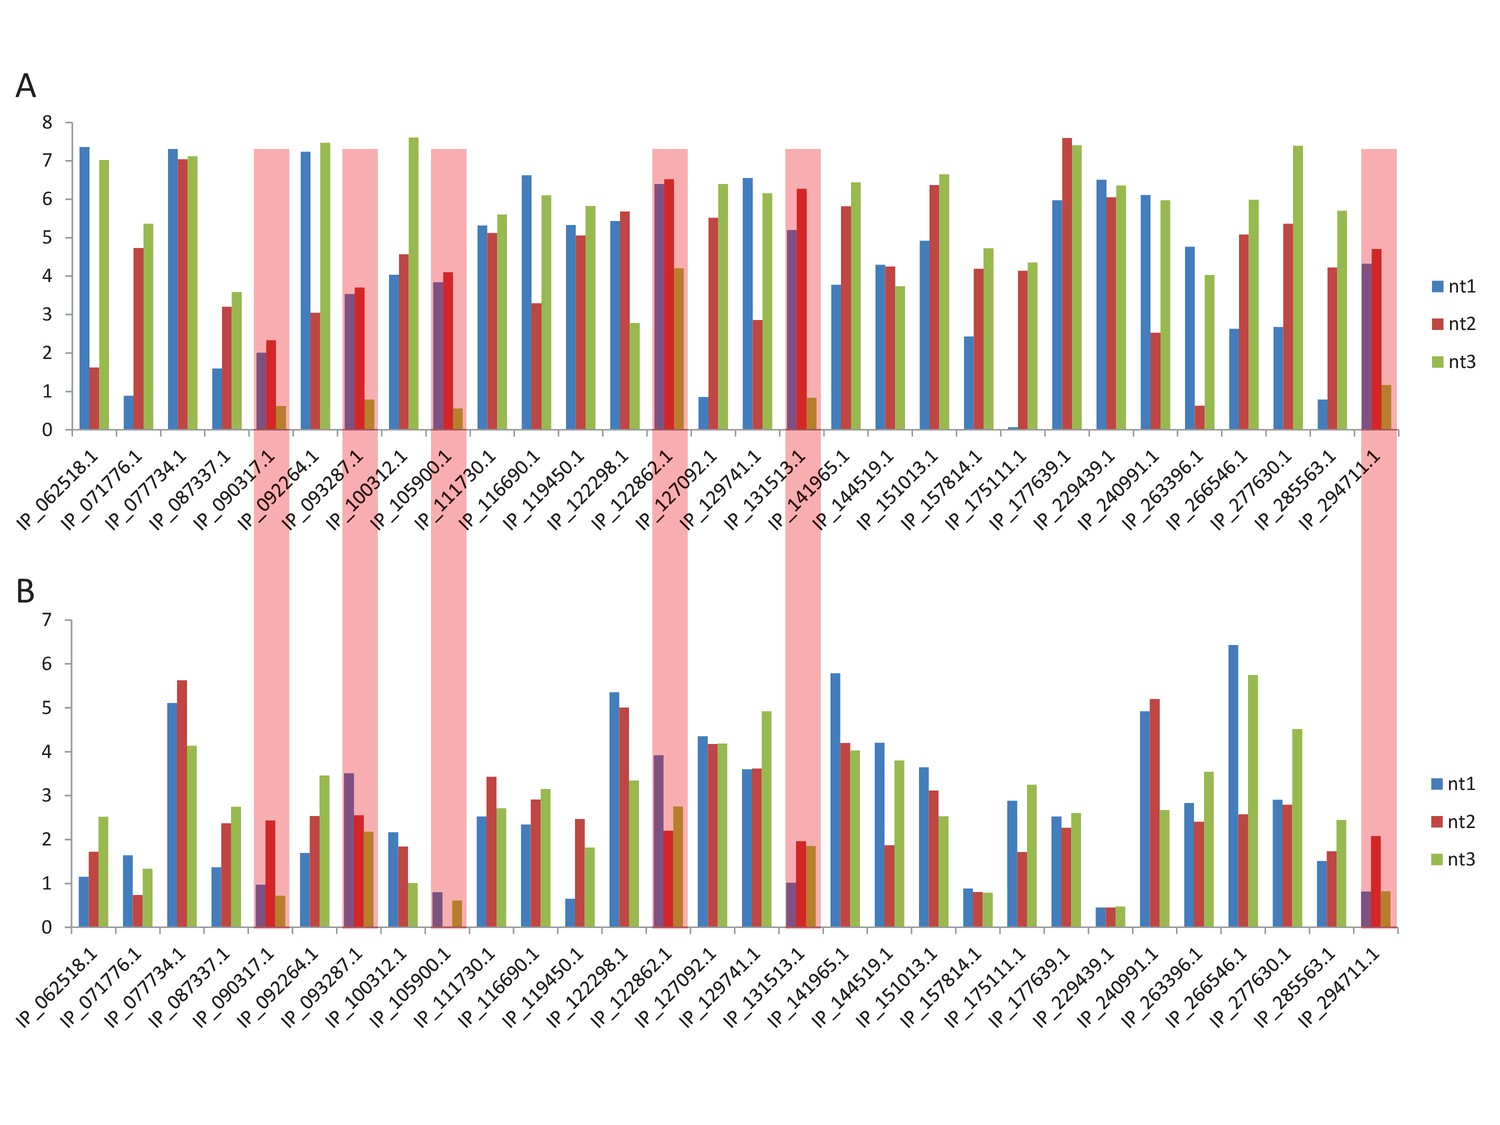
First, second, and third codon nucleotide PhyloP scores for 100 vertebrate species for the CDSs of the NTNG1, RET and VTI1A genes.
Chromosomal coordinates for the different CDSs and altORFs are indicated on the right. The regions highlighted in red indicate the presence of an altORF characterized by a region with elevated PhyloP scores for wobble nucleotides. The region of the altORF is indicated by a black bar above each graph.
-
Figure 4—source data 1
AltORFs completely nested within CDSs show more extreme PhyloP values (more conserved or faster evolving) than their CDSs.
- https://doi.org/10.7554/eLife.27860.015
Figure 5 with 4 supplements
Expression of human altORFs.
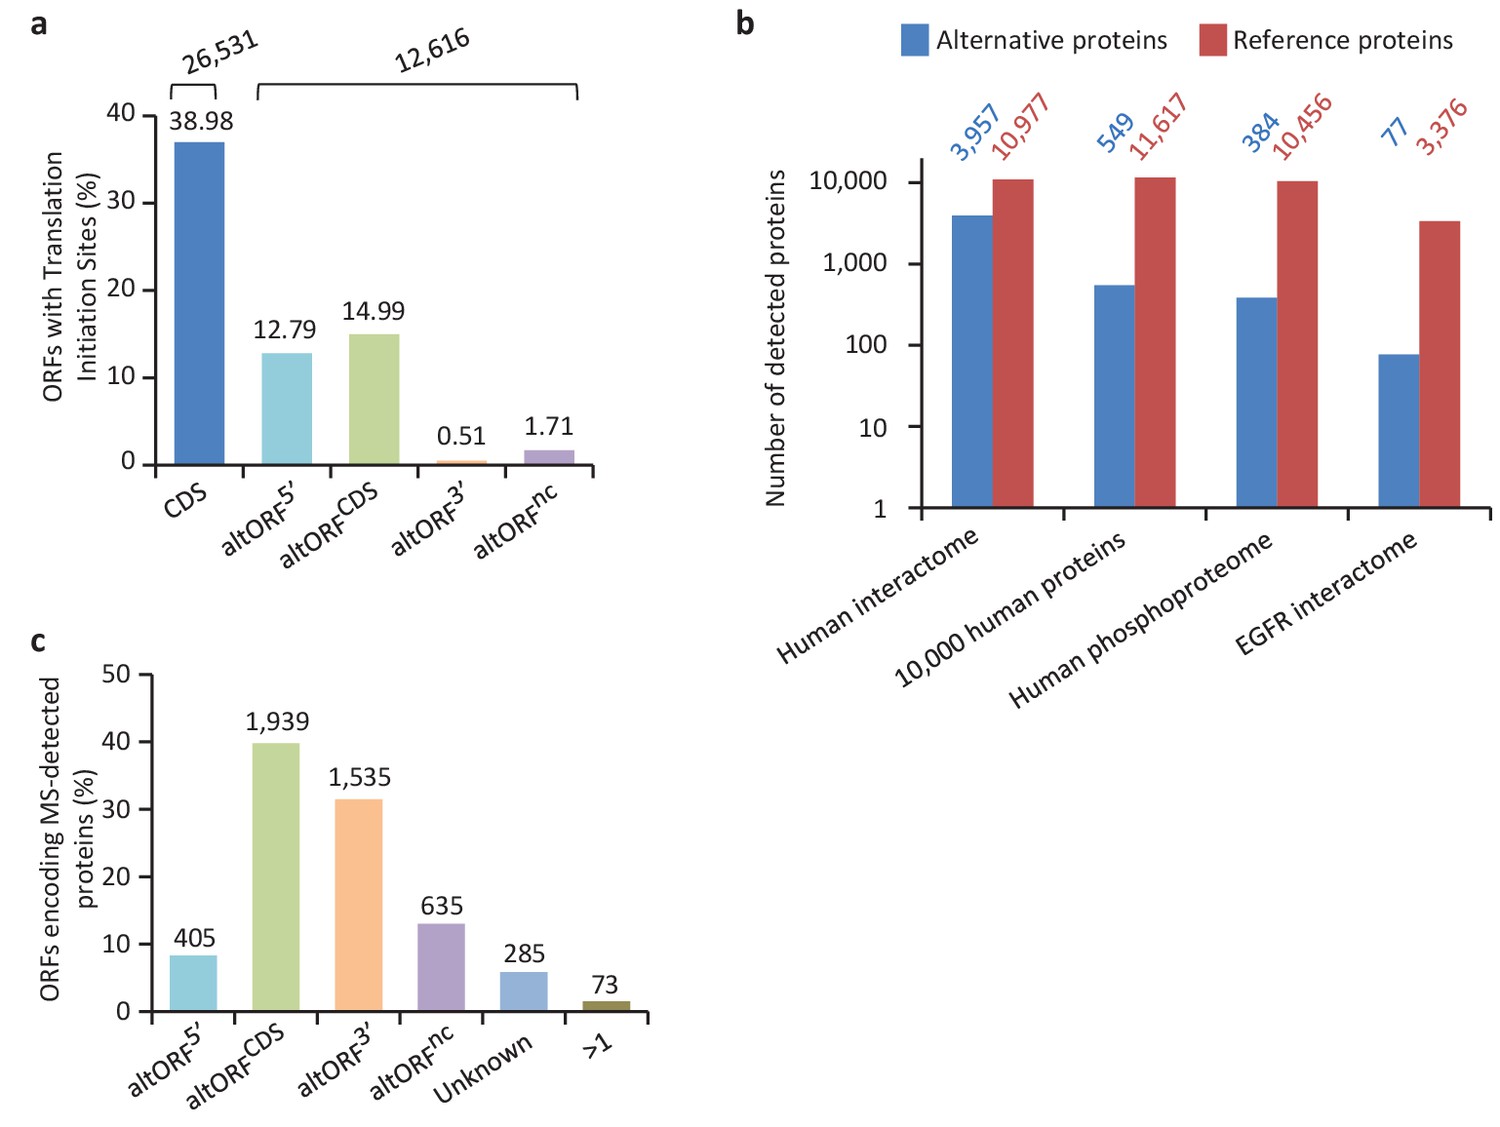
(a) Percentage of CDSs and altORFs with detected TISs by ribosomal profiling and footprinting of human cells (Iacono et al., 2005). The total number of CDSs and altORFs with a detected TIS is indicated at the top. (b) Alternative and reference proteins detected in three large proteomic datasets: human interactome (Hein et al., 2015), 10,000 human proteins (Rosenberger et al., 2014), human phosphoproteome (Sharma et al., 2014), EGFR interactome (Tong et al., 2014). Numbers are indicates above each column. (c) Percentage of altORFs encoding alternative proteins detected by MS-based proteomics. The total number of altORFs is indicated at the top. Localization ‘Unknown’ indicates that the detected peptides can match more than one alternative protein. Localization ‘>1’ indicates that the altORF can have more than one localization in different RNA isoforms.
-
Figure 5—source data 1
Expression of human altORFs.
- https://doi.org/10.7554/eLife.27860.021
Figure 5—figure supplement 1
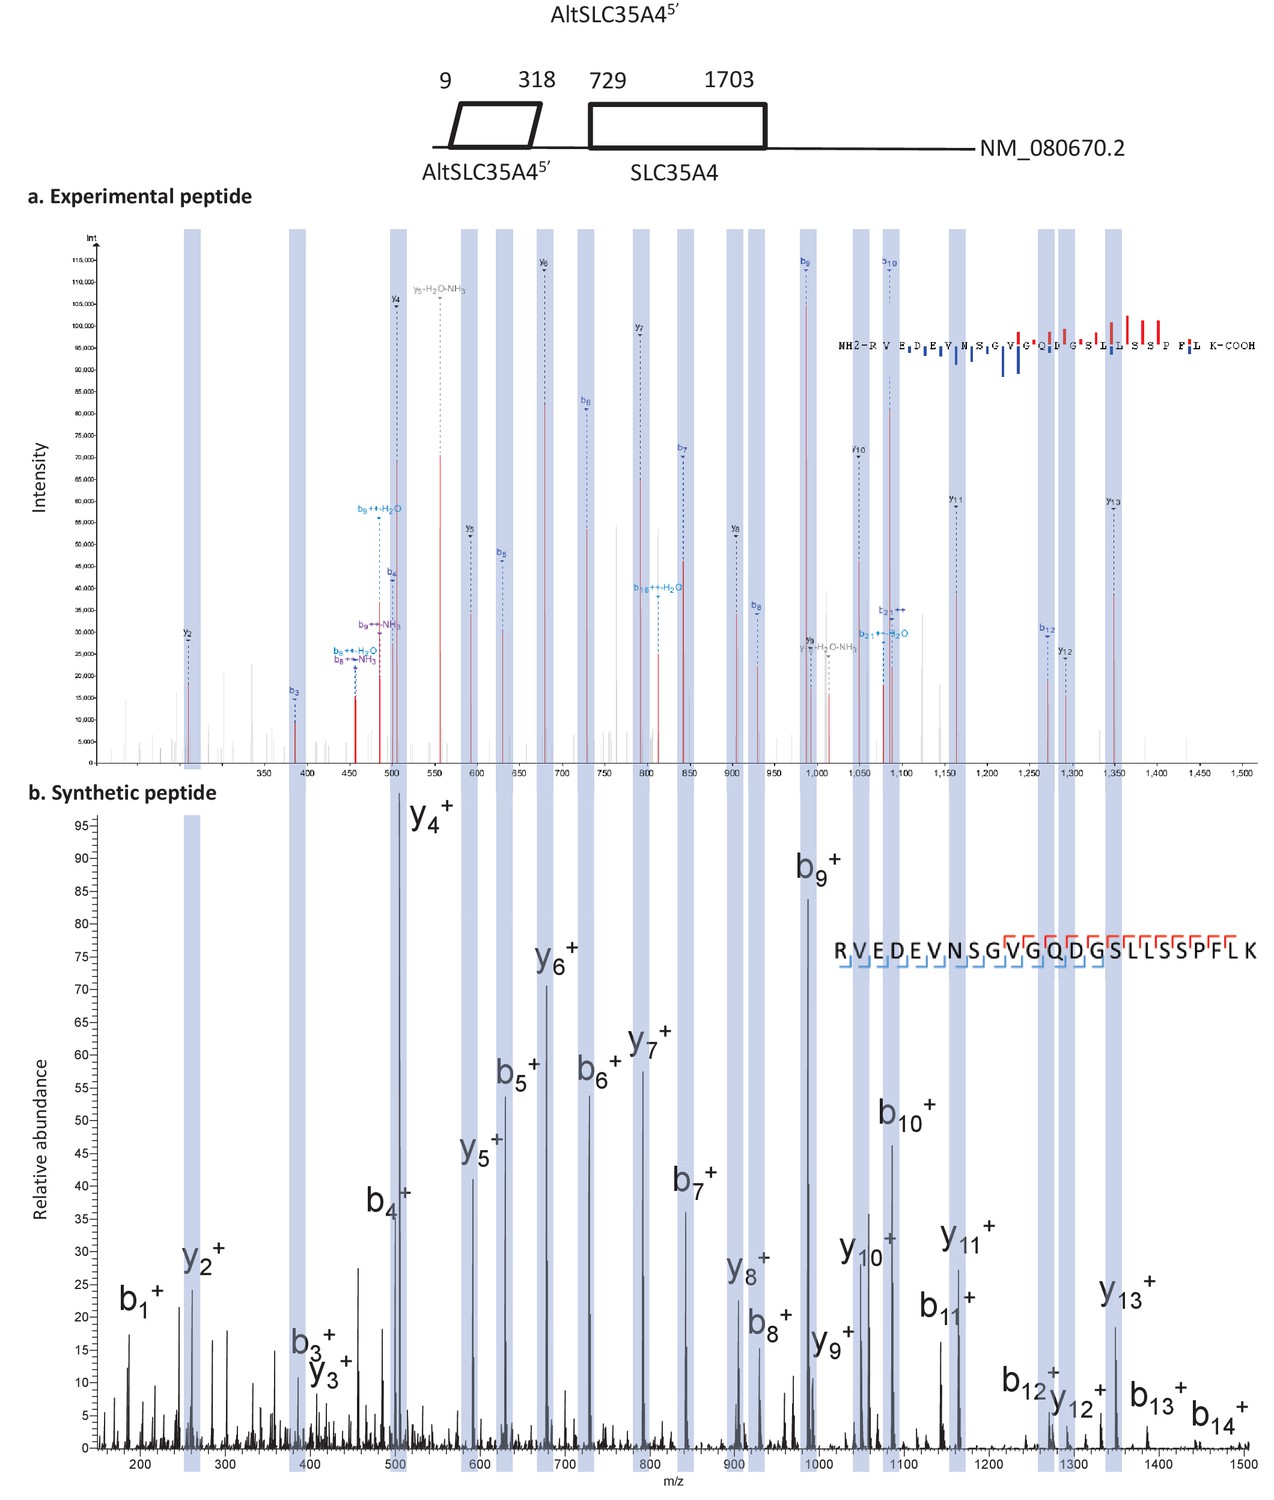
Spectra validation for altSLC35A45’.
Example of validation for altSLC35A45’ specific peptide RVEDEVNSGVGQDGSLLSSPFLK. (a) Experimental MS/MS spectra (PeptideShaker graphic interface output). (b) MS/MS spectra of the synthetic peptide. Matching peaks are shown with blue masks. A diagram of the transcript with its accession number and the localization of the altORF and the CDS is shown at the top.
Figure 5—figure supplement 2
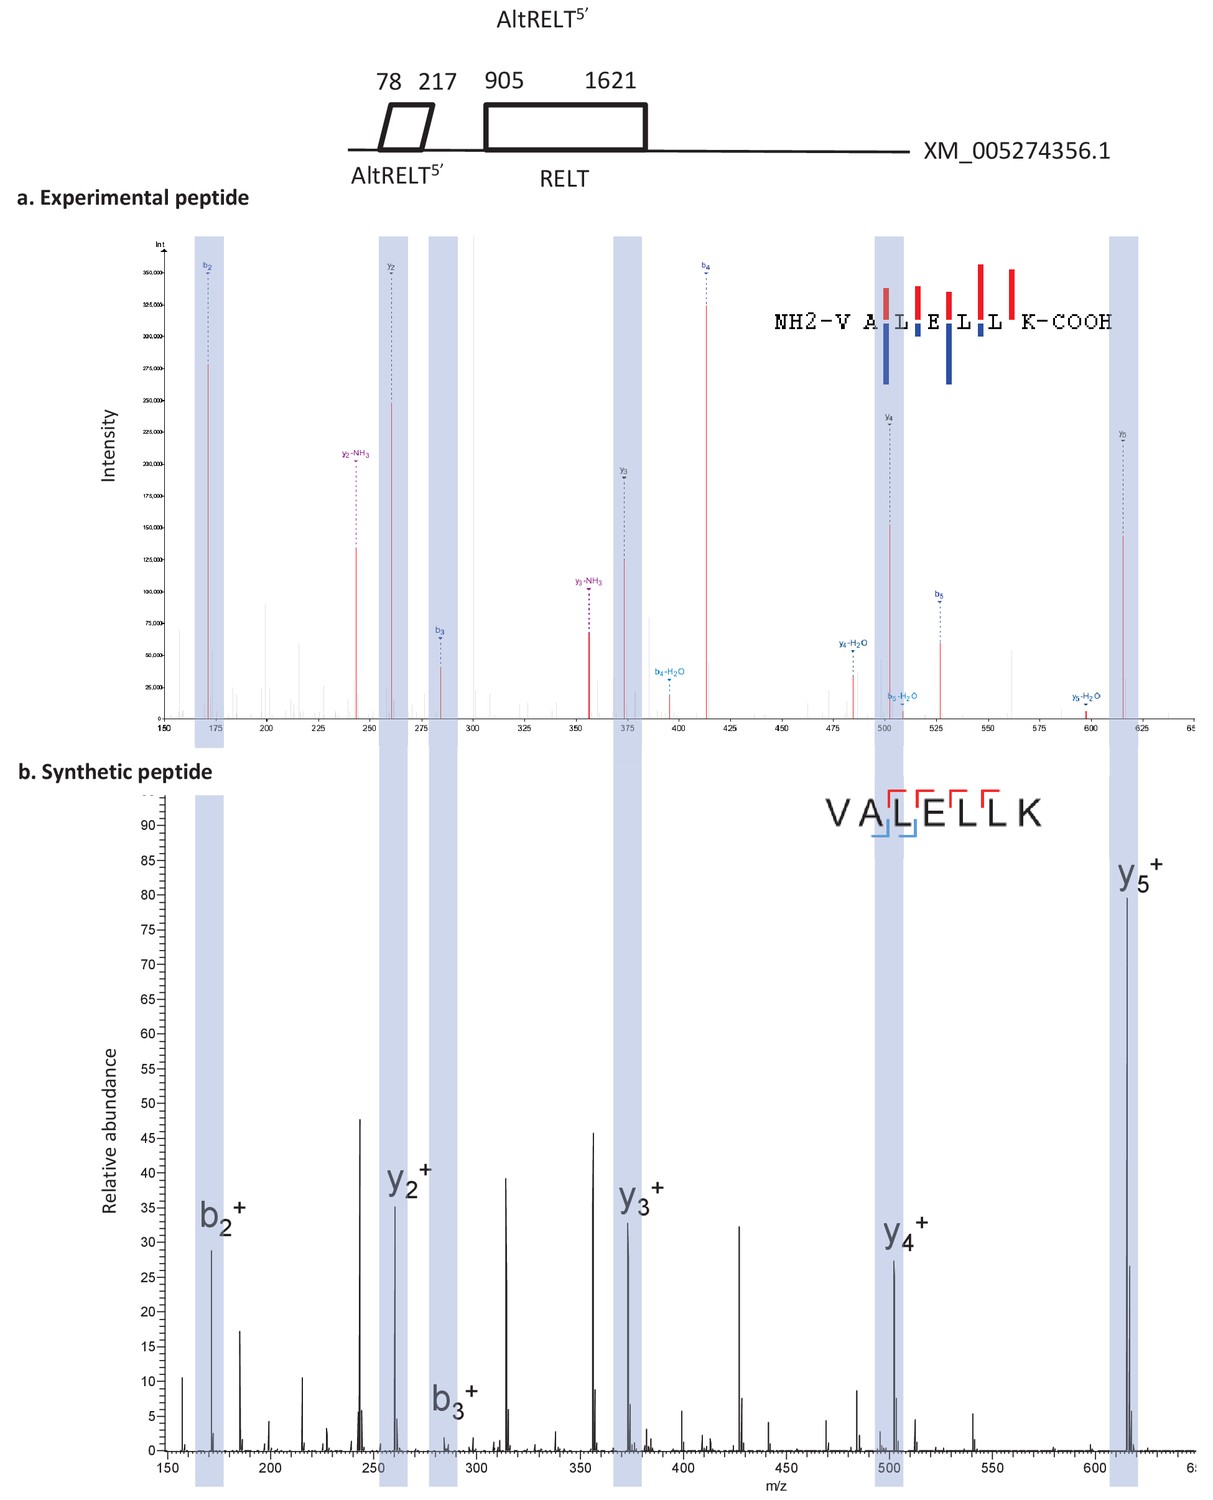
Spectra validation for altRELT5’.
Example of validation for altRELT5’-specific peptide VALELLK. (a) Experimental MS/MS spectra (PeptideShaker graphic interface output). (b) MS/MS spectra of the synthetic peptide. Matching peaks are shown with blue masks. A diagram of the transcript with its accession number and the localization of the altORF and the CDS is shown at the top.
Figure 5—figure supplement 3
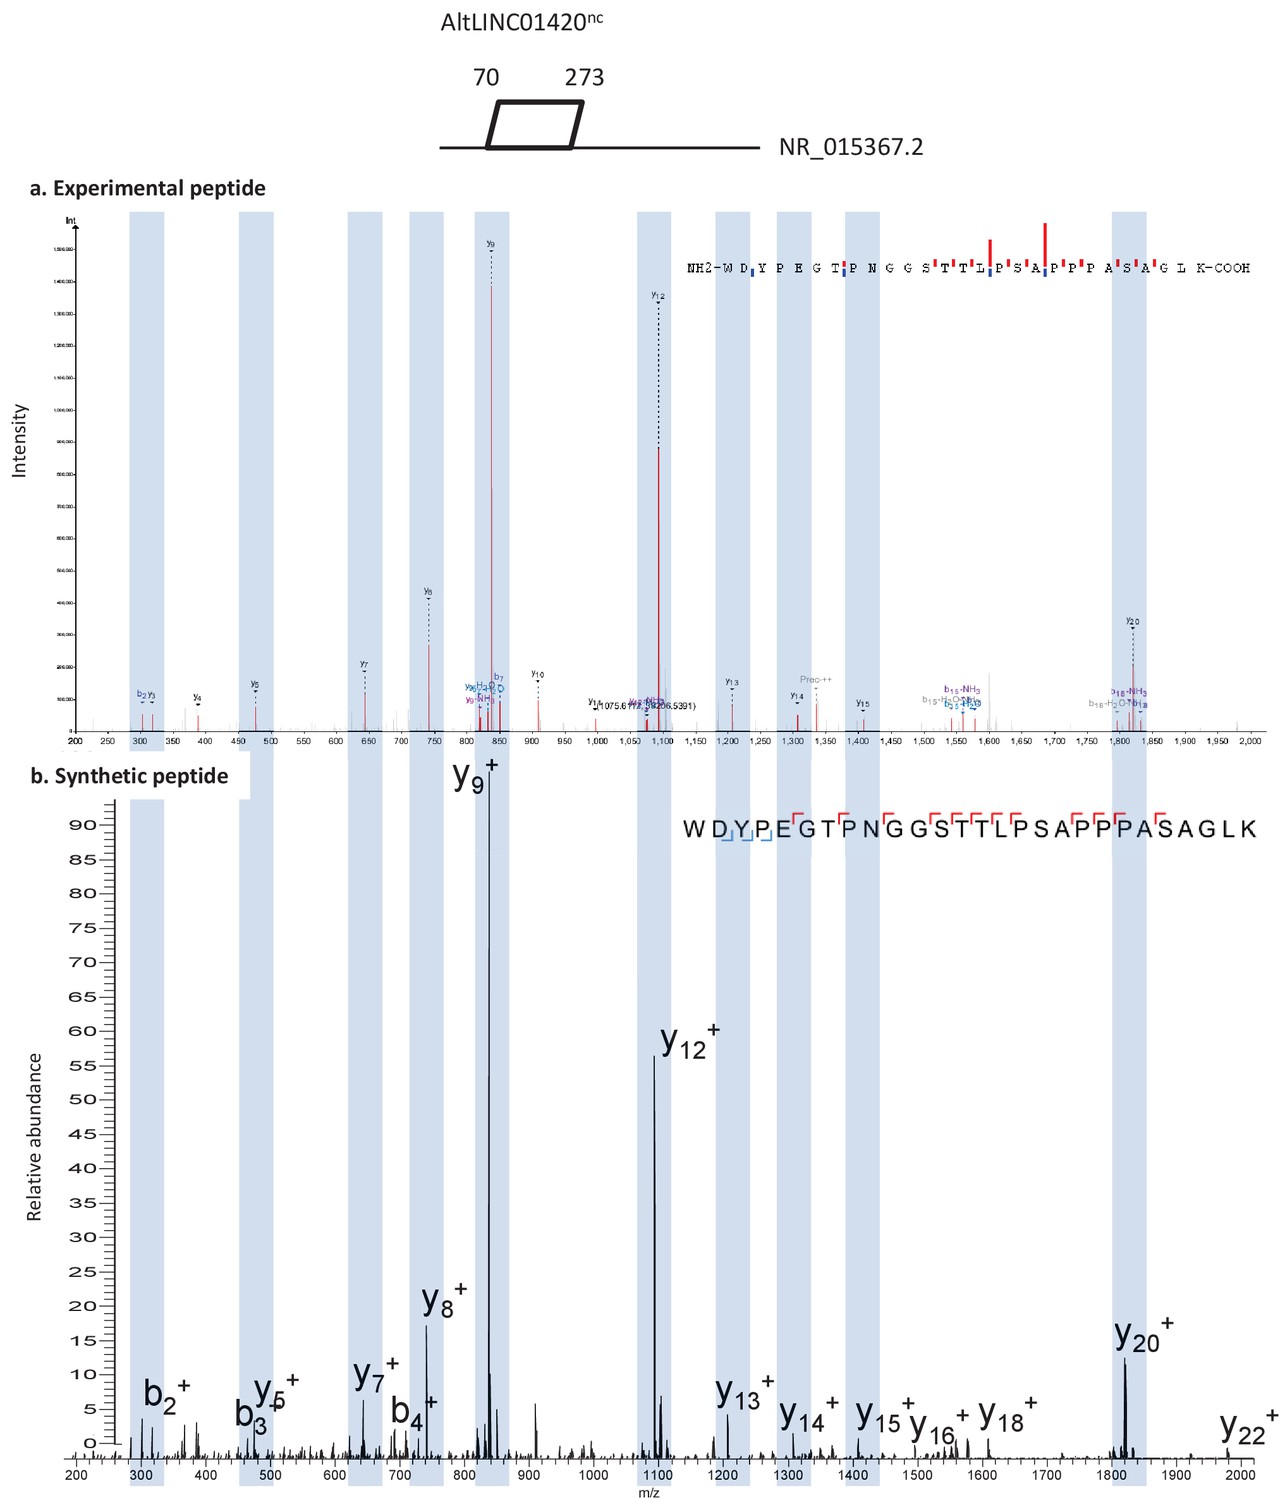
Spectra validation for altLINC01420nc.
Example of validation for altLINC01420nc-specific peptide WDYPEGTPNGGSTTLPSAPPPASAGLK. (a) Experimental MS/MS spectra (PeptideShaker graphic interface output). (b) MS/MS spectra of the synthetic peptide. Matching peaks are shown with blue masks. A diagram of the transcript with its accession number and the localization of the altORF is shown at the top.
Figure 5—figure supplement 4
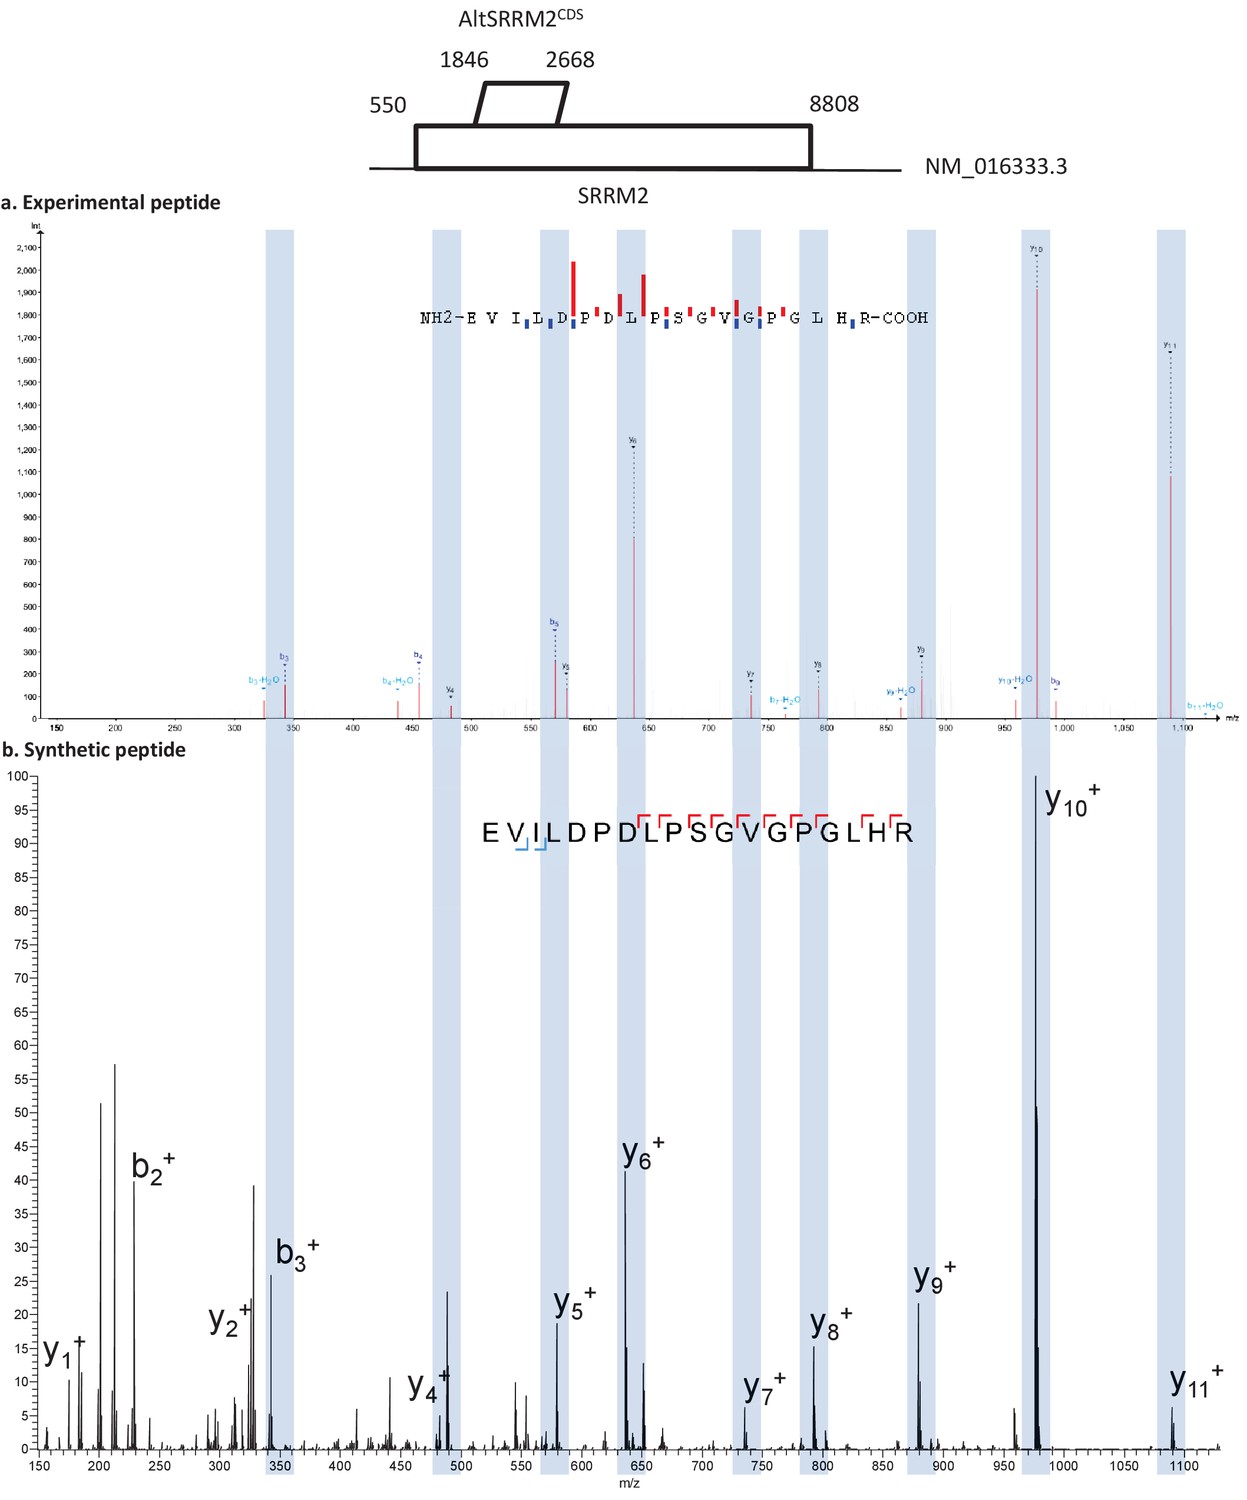
Spectra validation for altSRRM2CDS.
Example of validation for altSRRM2CDS-specific peptide EVILDPDLPSGVGPGLHR. (a) Experimental MS/MS spectra (PeptideShaker graphic interface output). (b) MS/MS spectra of the synthetic peptide. Matching peaks are shown with blue masks. A diagram of the transcript with its accession number and the localization of the altORF and the CDS is shown at the top.
Figure 6 with 1 supplement
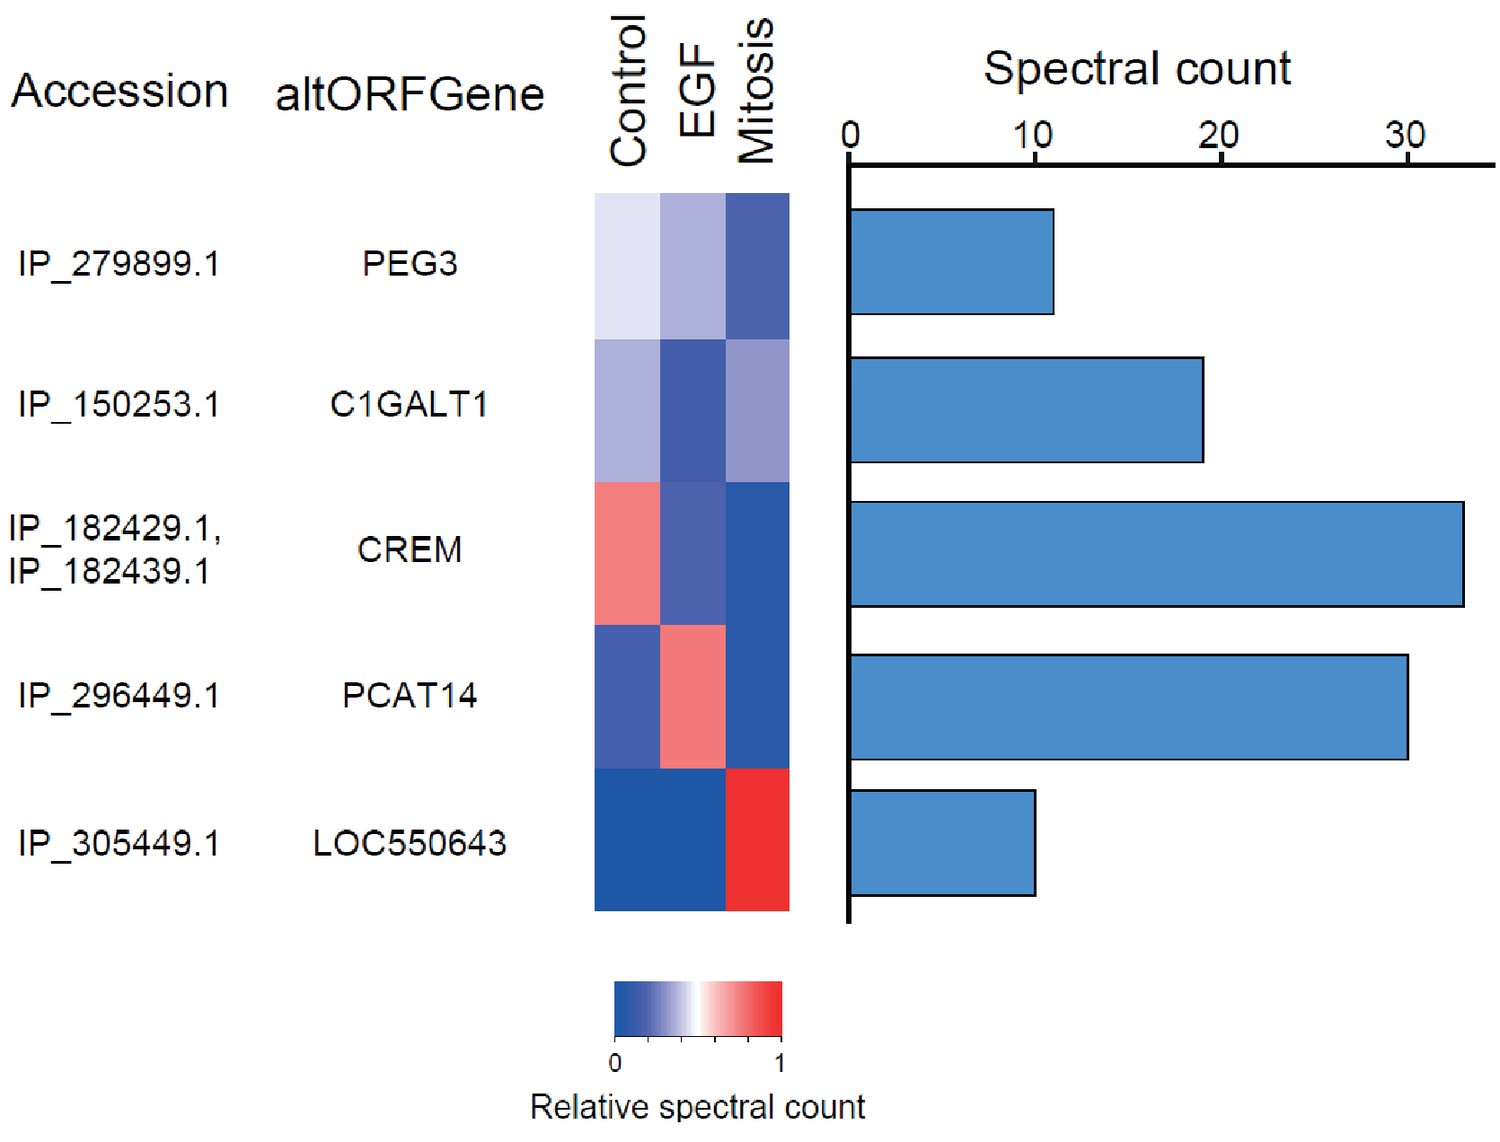
The alternative phosphoproteome in mitosis and EGF-treated cells.
Heatmap showing relative levels of spectral counts for phosphorylated peptides following the indicated treatment (Sharma et al., 2014). For each condition, heatmap colors show the percentage of spectral count on total MS/MS phosphopeptide spectra. Blue bars on the right represent the number of MS/MS spectra; only proteins with spectral counts above 10 are shown.
Figure 6—figure supplement 1
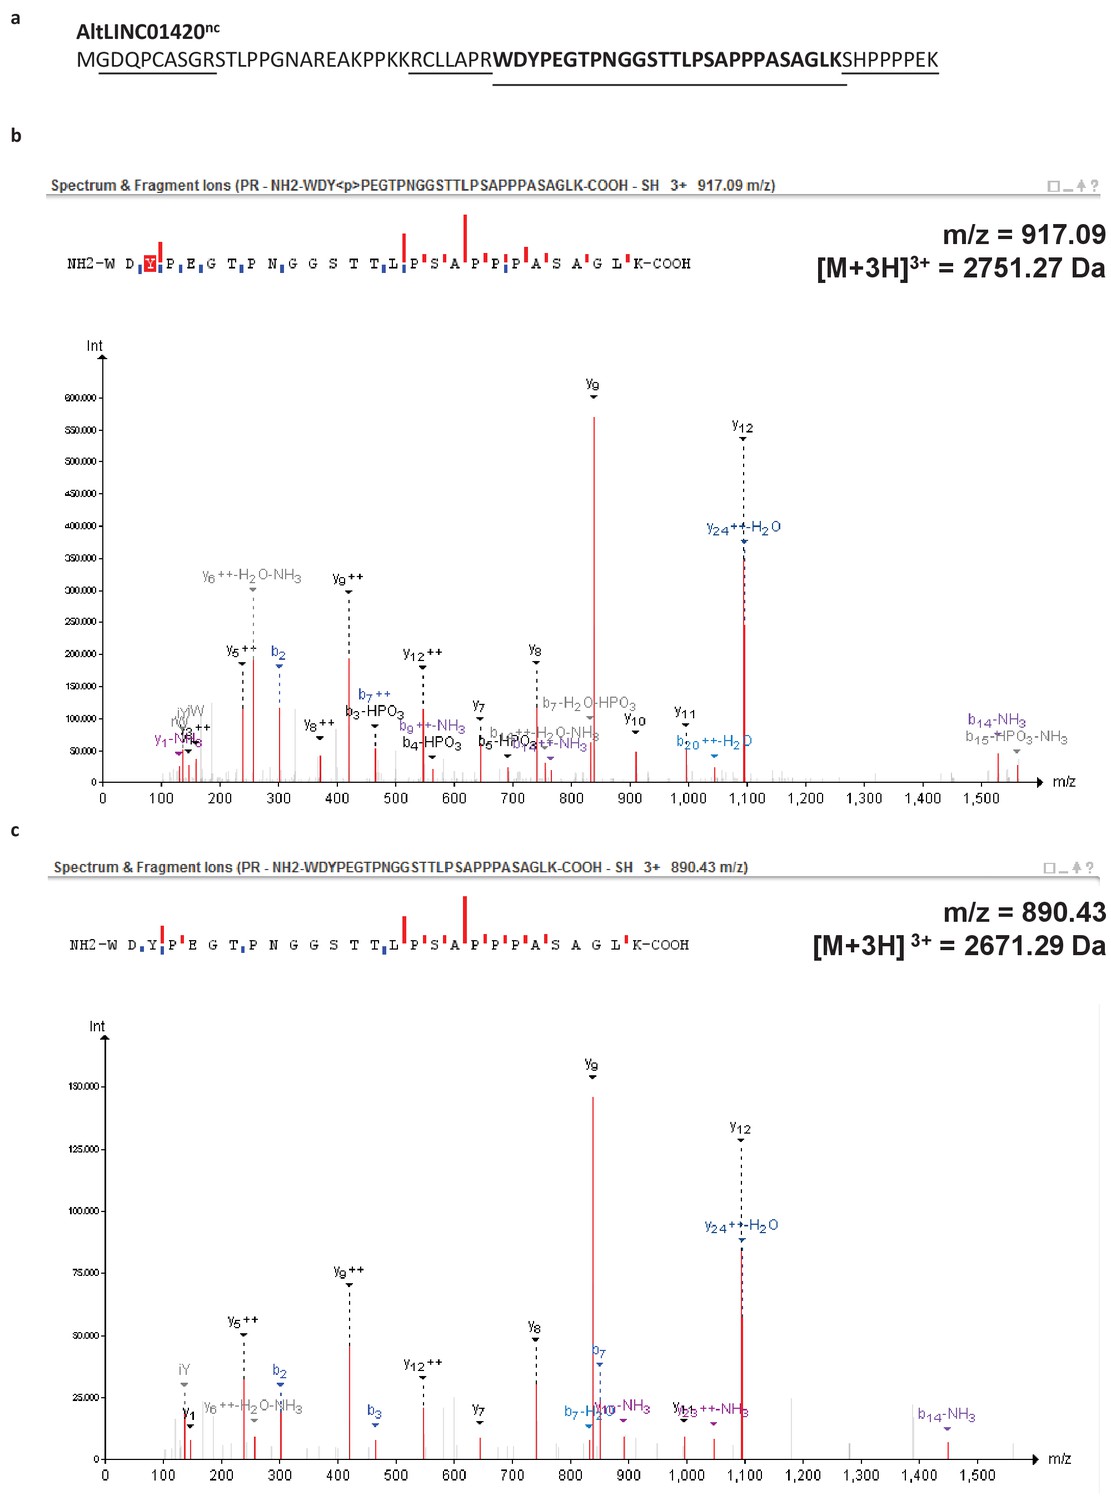
Example of a phosphorylated peptide in mitosis - alternative protein AltLINC01420nc (LOC550643, IP_305449.1).
(a) AltLINC01420nc amino acid sequence with detected peptides underlined and phosphorylated peptide in bold (73,9% sequence coverage). (b) MS/MS spectrum for the phosphorylated peptide (PeptideShaker graphic interface output). The phosphorylation site is the tyrosine residue, position 2. (c) MS/MS spectrum for the non-phosphorylated peptide. The mass difference between the precursor ions between both spectra corresponds to that of a phosphorylation, confirming the specific phosphorylation of this residue in mitosis.
Figure 7

Number of alternative proteins detected by ribosome profiling and mass spectrometry.
The expression of 467 alternative proteins was detected by both ribosome profiling (translation initiation sites, TIS) and mass spectrometry (MS).
-
Figure 7—source data 1
Number of alternative proteins detected by ribosome profiling and mass spectrometry.
- https://doi.org/10.7554/eLife.27860.025
Figure 8 with 1 supplement
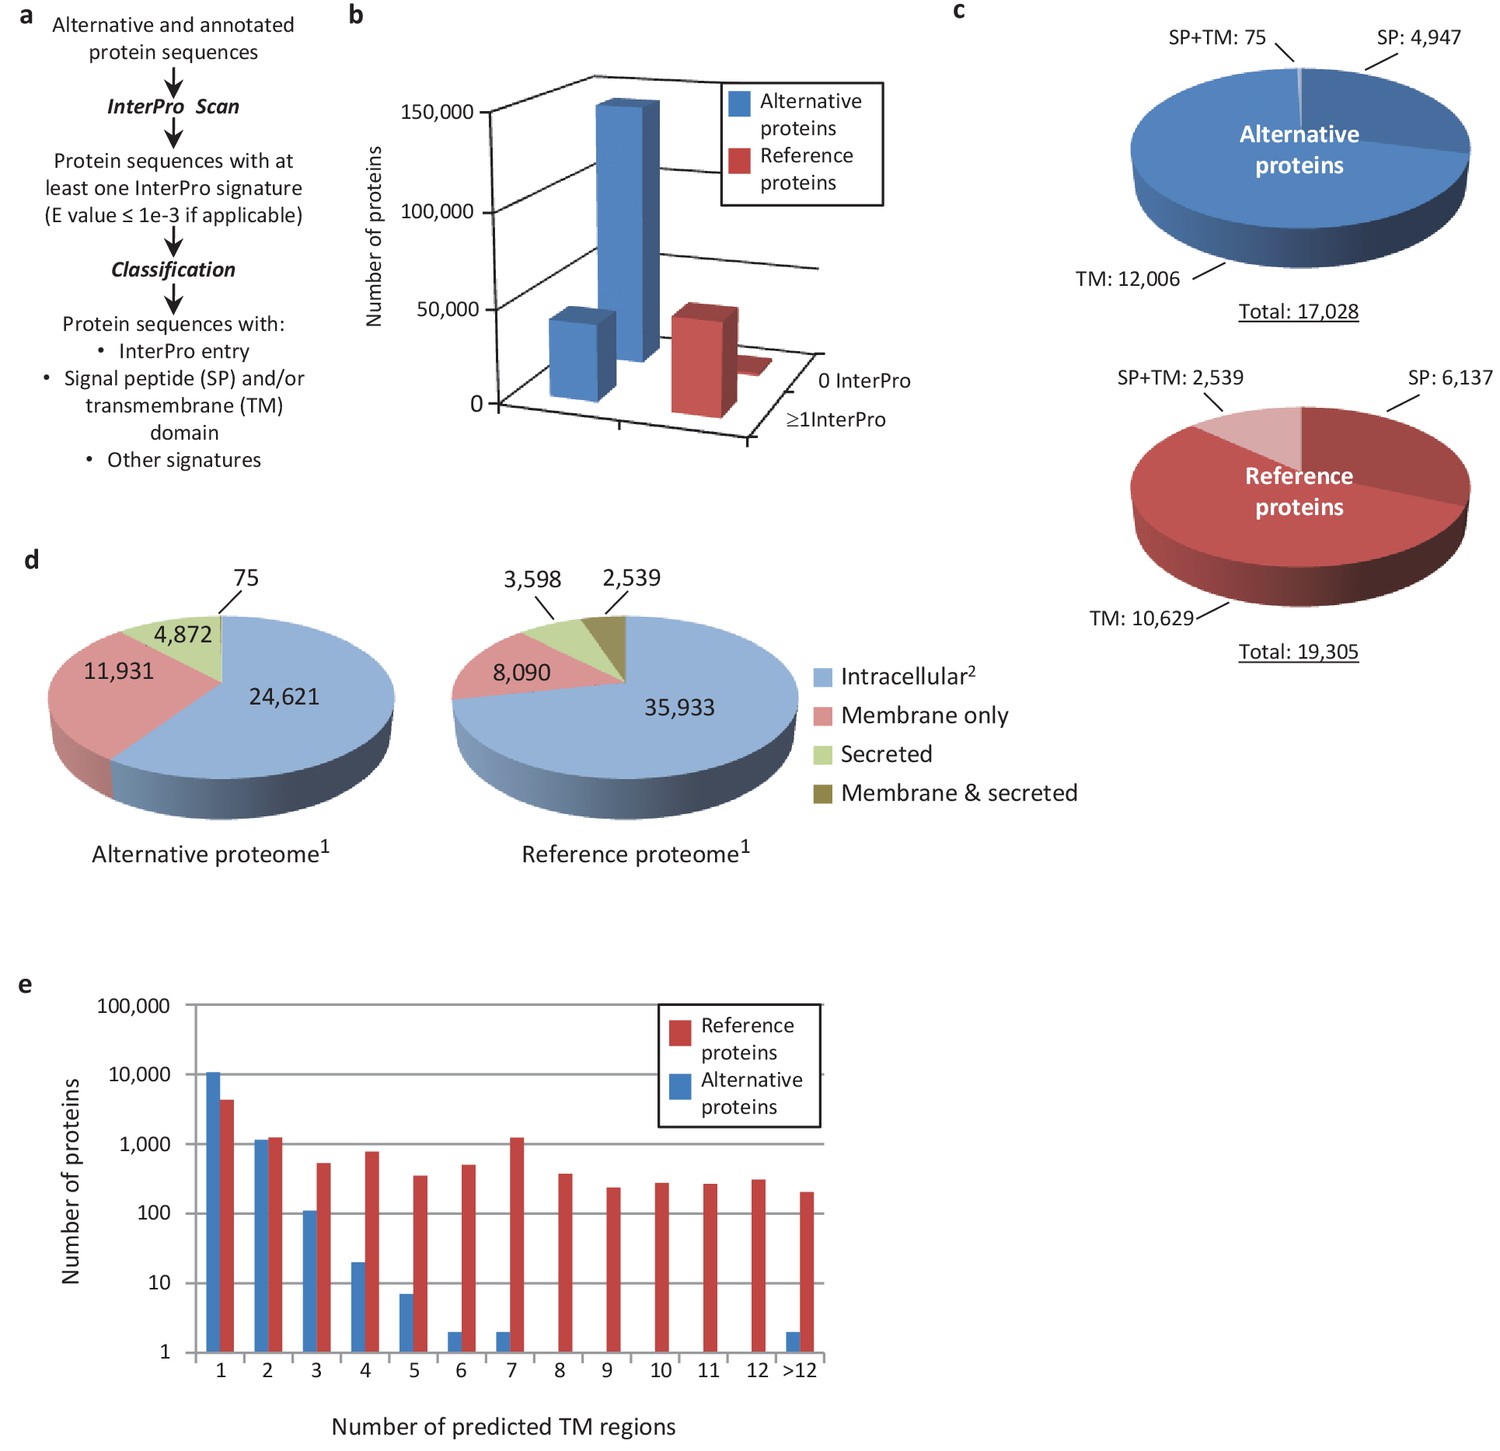
Human alternative proteome sequence analysis and classification using InterProScan.
(a) InterPro annotation pipeline. (b) Alternative and reference proteins with InterPro signatures. (c) Number of alternative and reference proteins with transmembrane domains (TM), signal peptides (S) and both TM and SP. (d) Number of all alternative and reference proteins predicted to be intracellular, membrane, secreted and membrane-spanning and secreted (Ingolia et al., 2011). Proteins with at least one InterPro signature (Lee et al., 2012); proteins with no predicted signal peptide or transmembrane features. (e) Number of predicted TM regions for alternative and reference proteins.
Figure 8—figure supplement 1
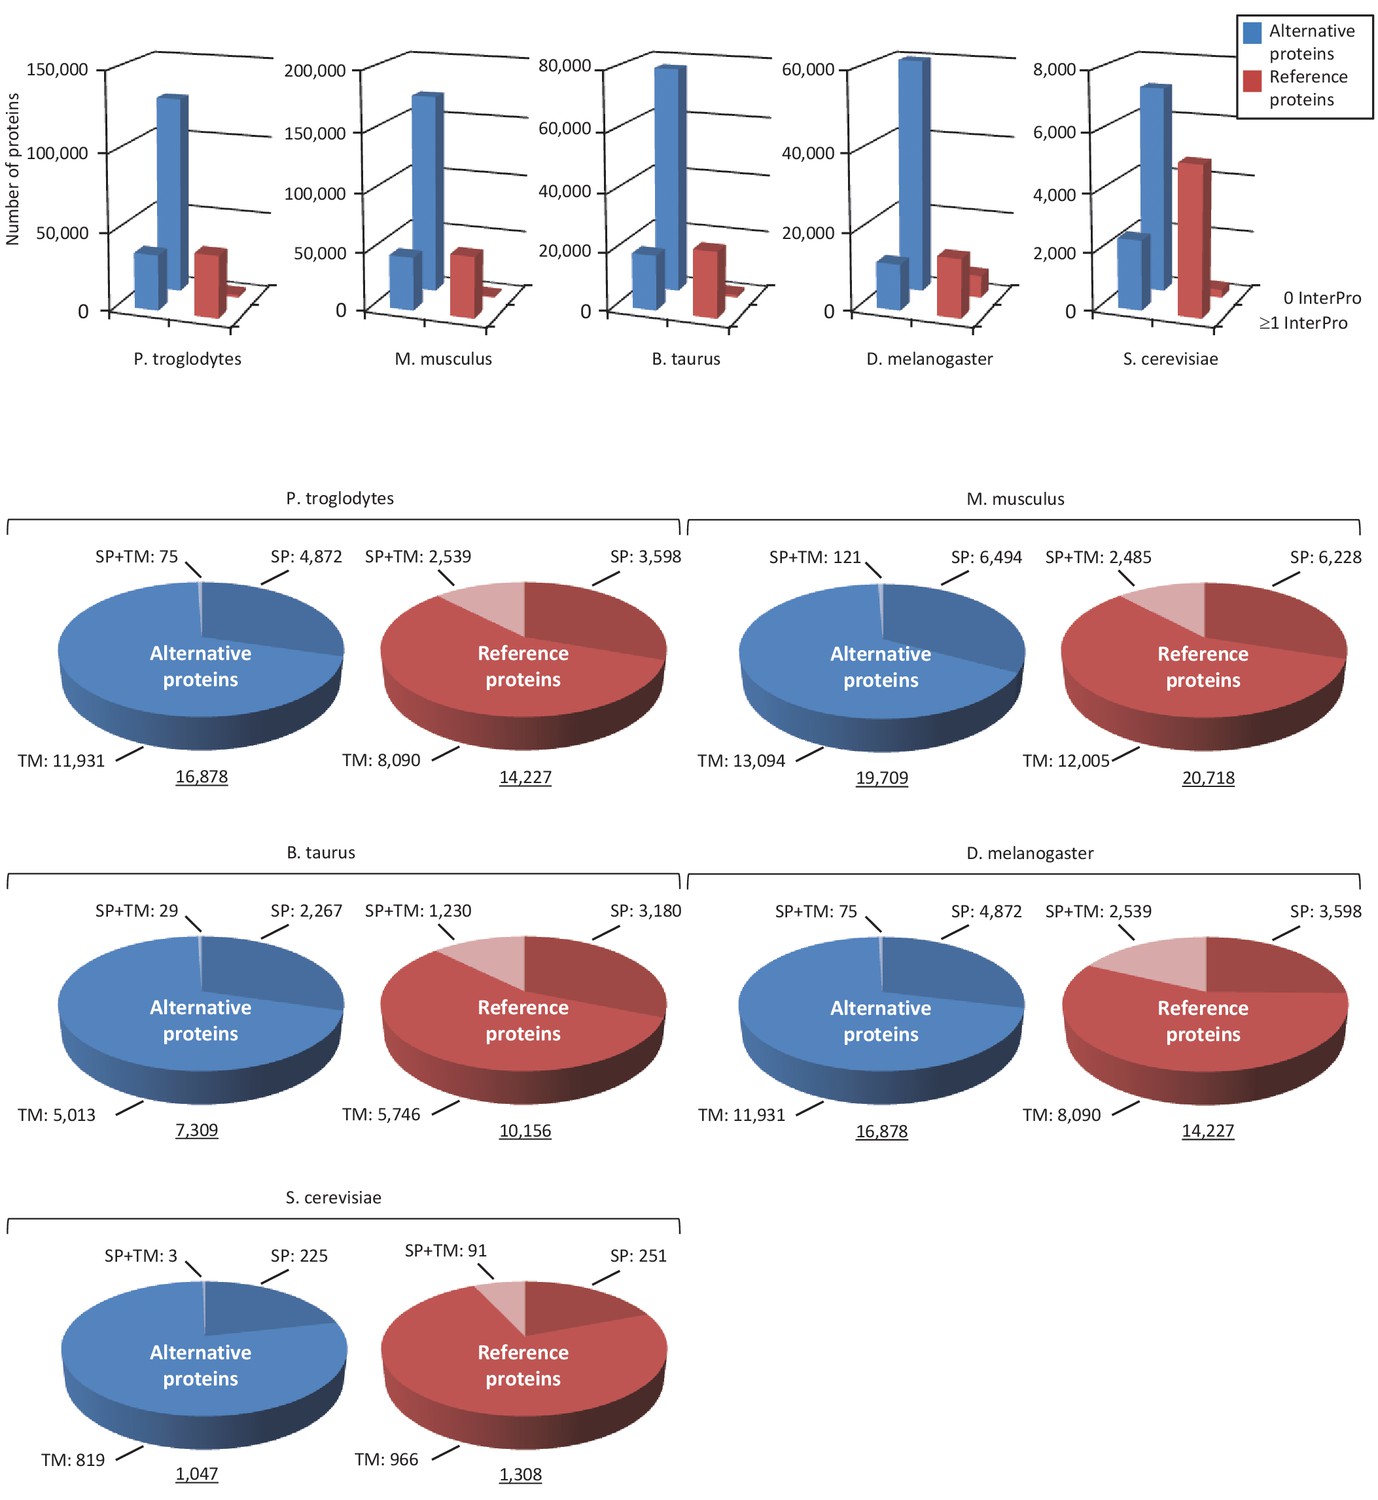
Alternative proteome sequence analysis and classification in P. troglodytes, M. musculus, B. Taurus, D. melanogaster and S. cerevisiae.
For each organism, the number of InterPro signatures (top graphs) and proteins with transmembrane (TM), signal peptide (SP), or TM +SP features (bottom pie charts) is indicated for alternative and reference proteins.
-
Figure 8—figure supplement 1—source data 1
Alternative proteome sequence analysis and classification in P. troglodytes, M. musculus, B. Taurus, D. melanogaster and S. cerevisiae.
- https://doi.org/10.7554/eLife.27860.028
Figure 9
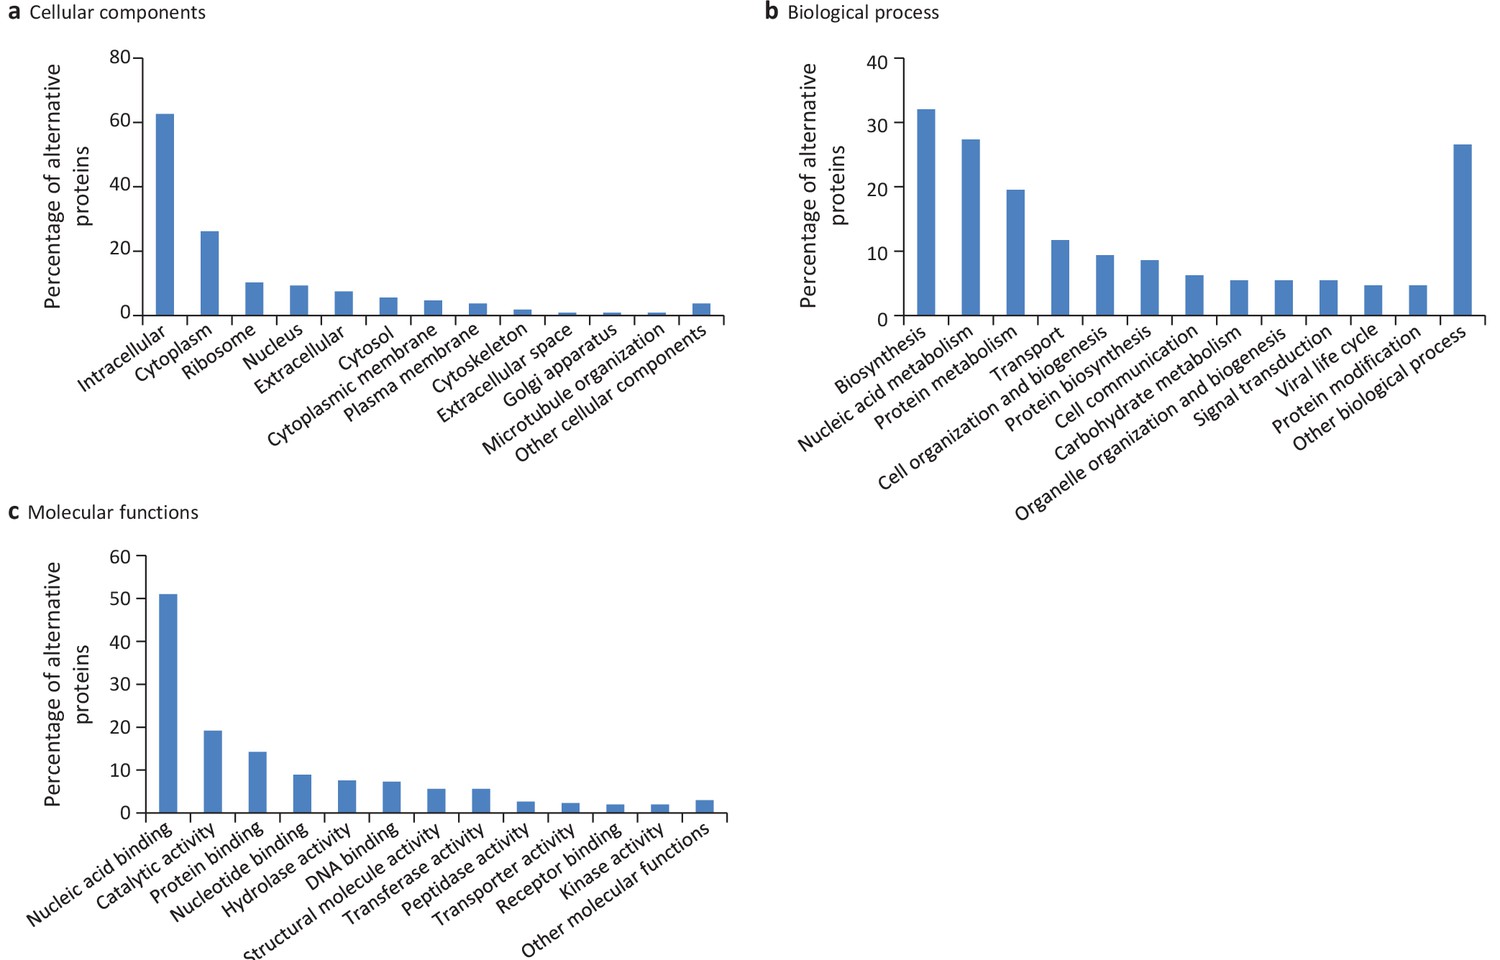
Gene ontology (GO) annotations for human alternative proteins.
GO terms assigned to InterPro entries are grouped into 13 categories for each of the three ontologies. (a) 34 GO terms were categorized into cellular component for 107 alternative proteins. (b) 64 GO terms were categorized into biological process for 128 alternative proteins. (c) 94 GO terms were categorized into molecular function for 302 alternative proteins. The majority of alternative proteins with GO terms are predicted to be intracellular, to function in nucleic acid-binding, catalytic activity and protein binding and to be involved in biosynthesis and nucleic acid metabolism processes.
-
Figure 9—source data 1
Gene ontology(GO) annotations for human alternative proteins.
- https://doi.org/10.7554/eLife.27860.030
Figure 10

Main InterPro entries in human alternative proteins.
(a) The top 10 InterPro families in the human alternative proteome. (b) A total of 110 alternative proteins have between 1 and 23 zinc finger domains.
-
Figure 10—source data 1
Main InterPro entries in human alternative proteins.
- https://doi.org/10.7554/eLife.27860.032
Figure 11 with 3 supplements
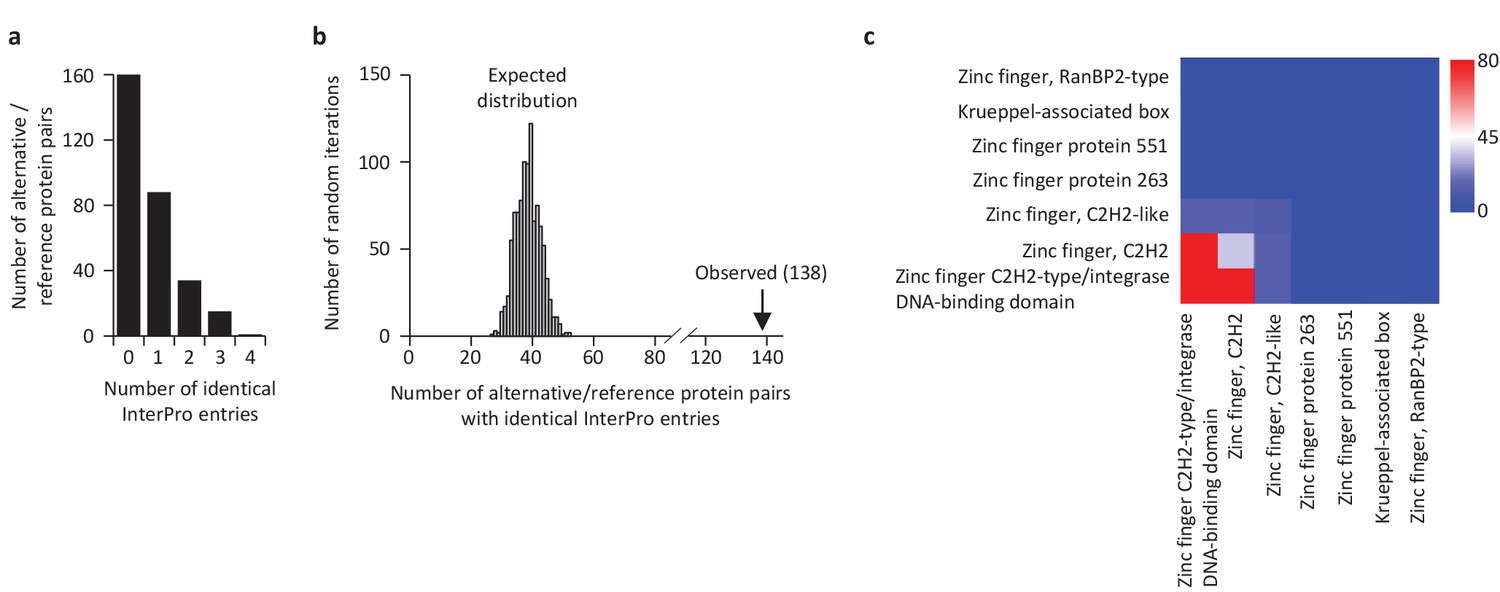
Some reference and alternative proteins have identical functional domains.
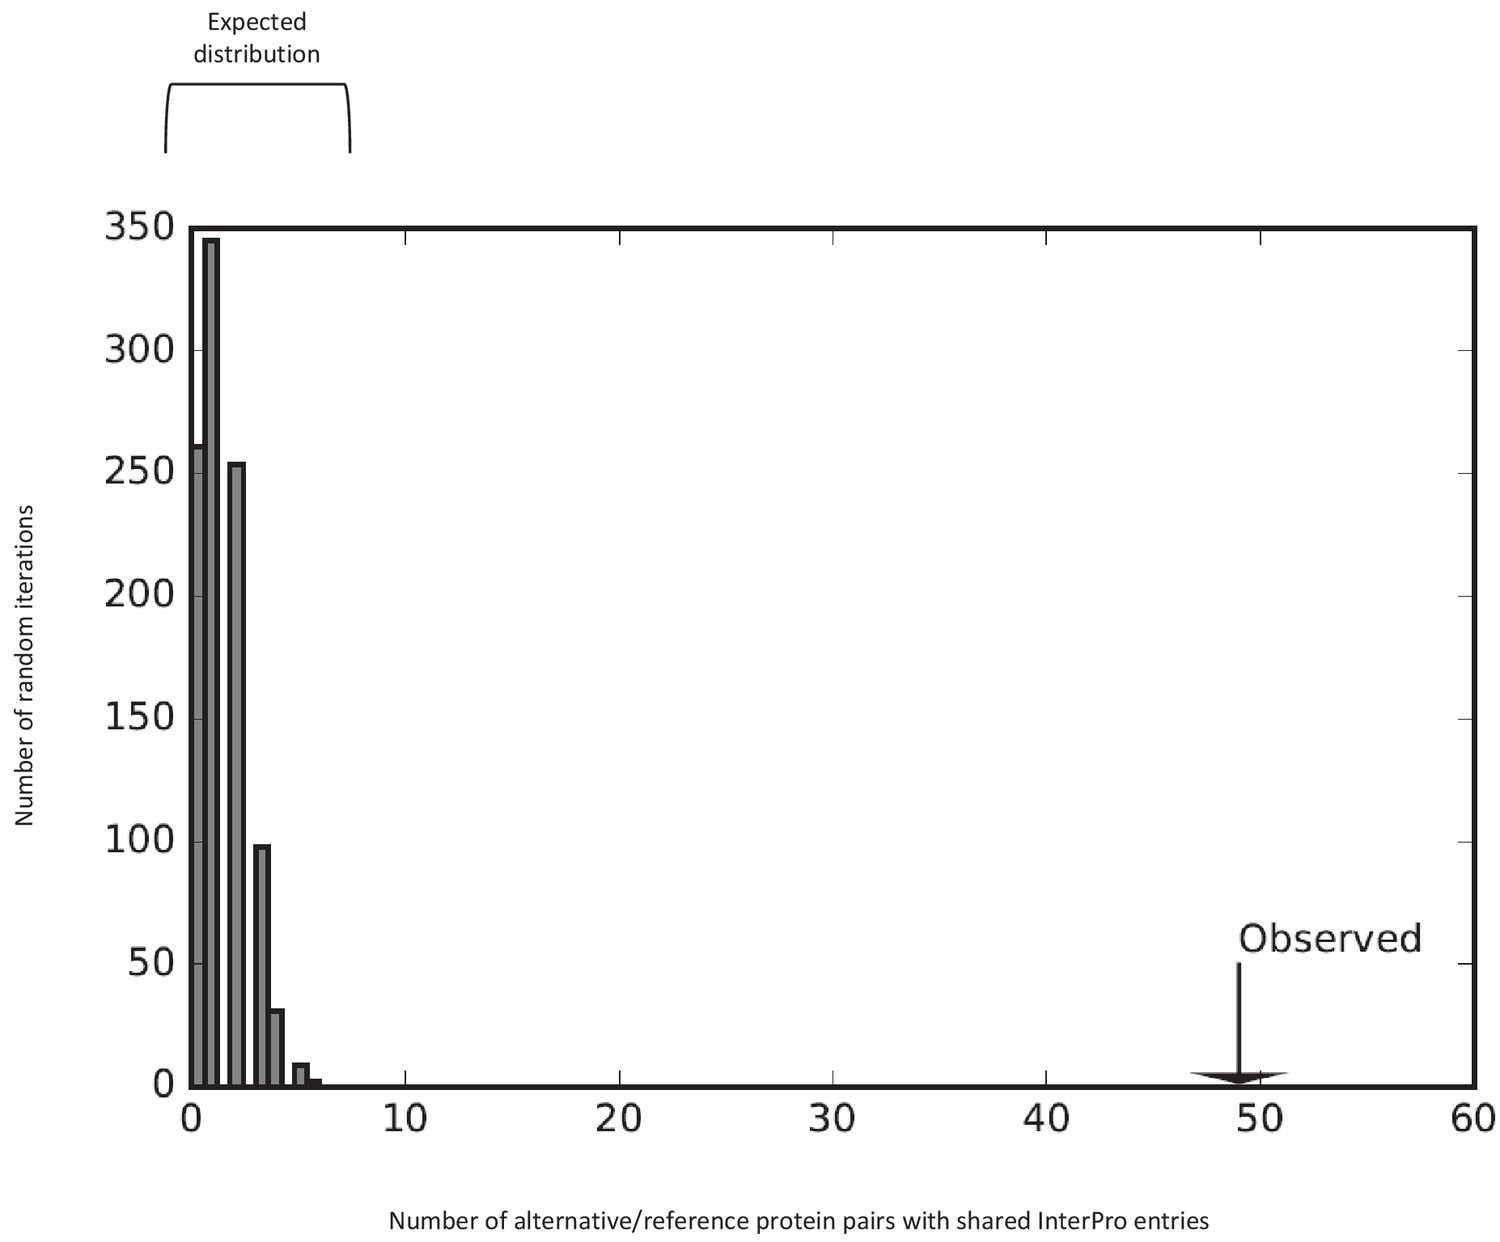
(a) Distribution of the number of identical InterPro entries co-ocurring between alternative and reference proteins coded by the same transcripts. 138 pairs of alternative and reference proteins have between 1 and 4 identical protein domains (InterPro entries). Only alternative/reference protein pairs that have at least one identical domain are considered (n = 298). (b) The number of reference/alternative protein pairs with identical domains (n = 138) is higher than expected by chance alone. The distribution of expected pairs having identical domains and the observed number are shown. (c) Matrix of co-occurrence of domains related to zinc fingers. The entries correspond to the number of times entries co-occur in reference and alternative proteins. The full matrix is available in Figure 11—figure supplement 1.
-
Figure 11—source data 1
Distribution of the percentage of sequence identity and overlap between alternative-reference protein pairs with (20) or without (80) identical Interpro signature.
- https://doi.org/10.7554/eLife.27860.038
Figure 11—figure supplement 1
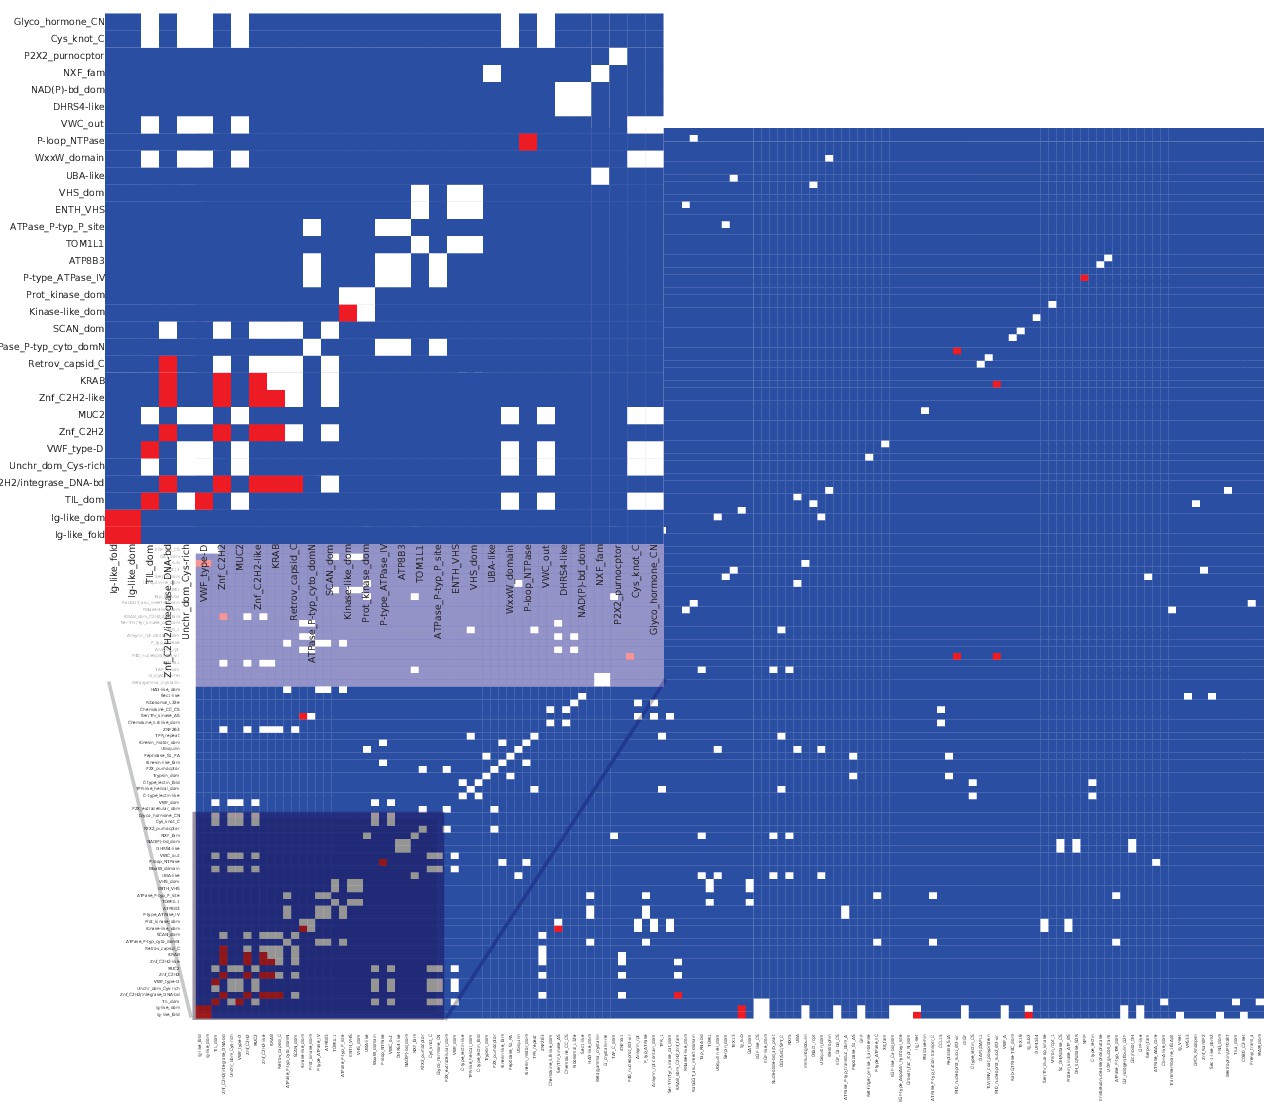
Matrix of co-occurrence of InterPro entries between alternative/reference protein pairs coded by the same transcript.
Pixels show the number of times entries co-occur in reference and alternative proteins. Blue pixels indicate that these domains do not co-occur, white pixels indicate that they co-occur once, and red that they co-occur twice or more.
Figure 11—figure supplement 2
Some reference and alternative proteins have identical functional domains.
The number of reference/alternative protein pairs with identical domains (n = 49) is higher than expected by chance alone (p<0.001). The distribution of expected pairs with identical domains and the observed number are shown. This is the same analysis as the one presented in Figure 11b, with the zinc finger domains taken out.
Figure 11—figure supplement 3
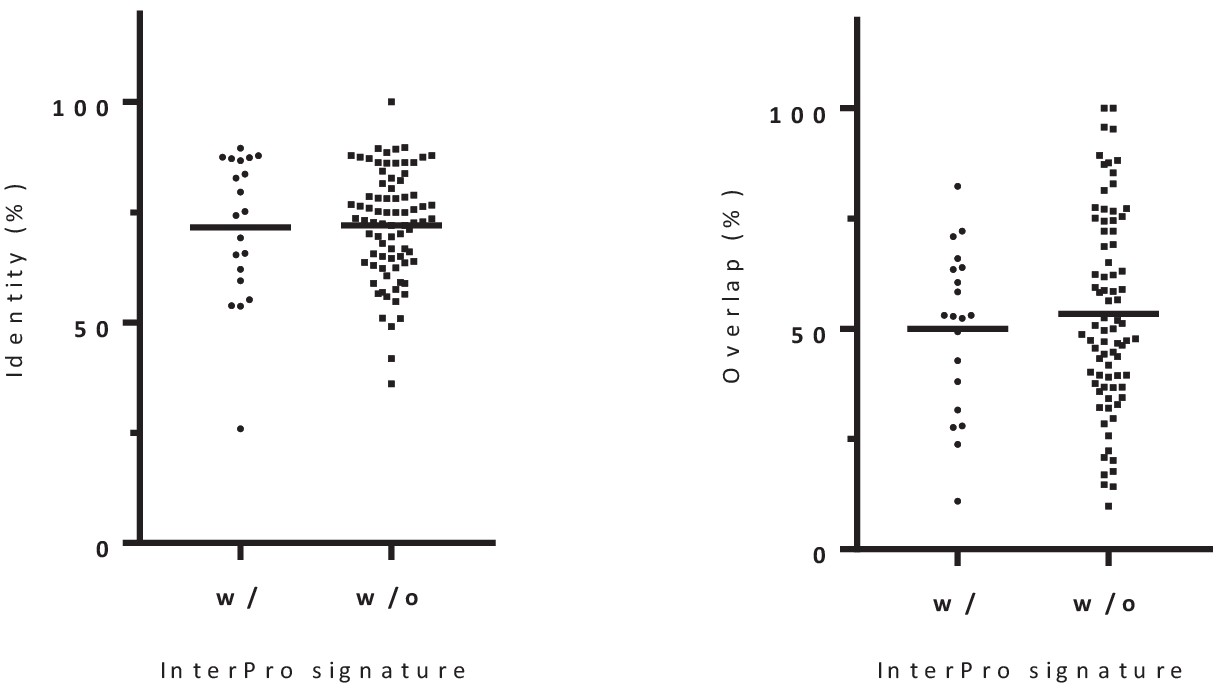
Distribution of the percentage of sequence identity and overlap between alternative-reference protein pairs with (20) or without (80) identical Interpro signature.
There is no significant differences between both groups (p-value=0.6272; Kolmogorov Smirnov test). We conclude that there is no significant association between identity/overlap and functional relationship.
Figure 12 with 6 supplements
AltMiD515’ expression induces mitochondrial fission.
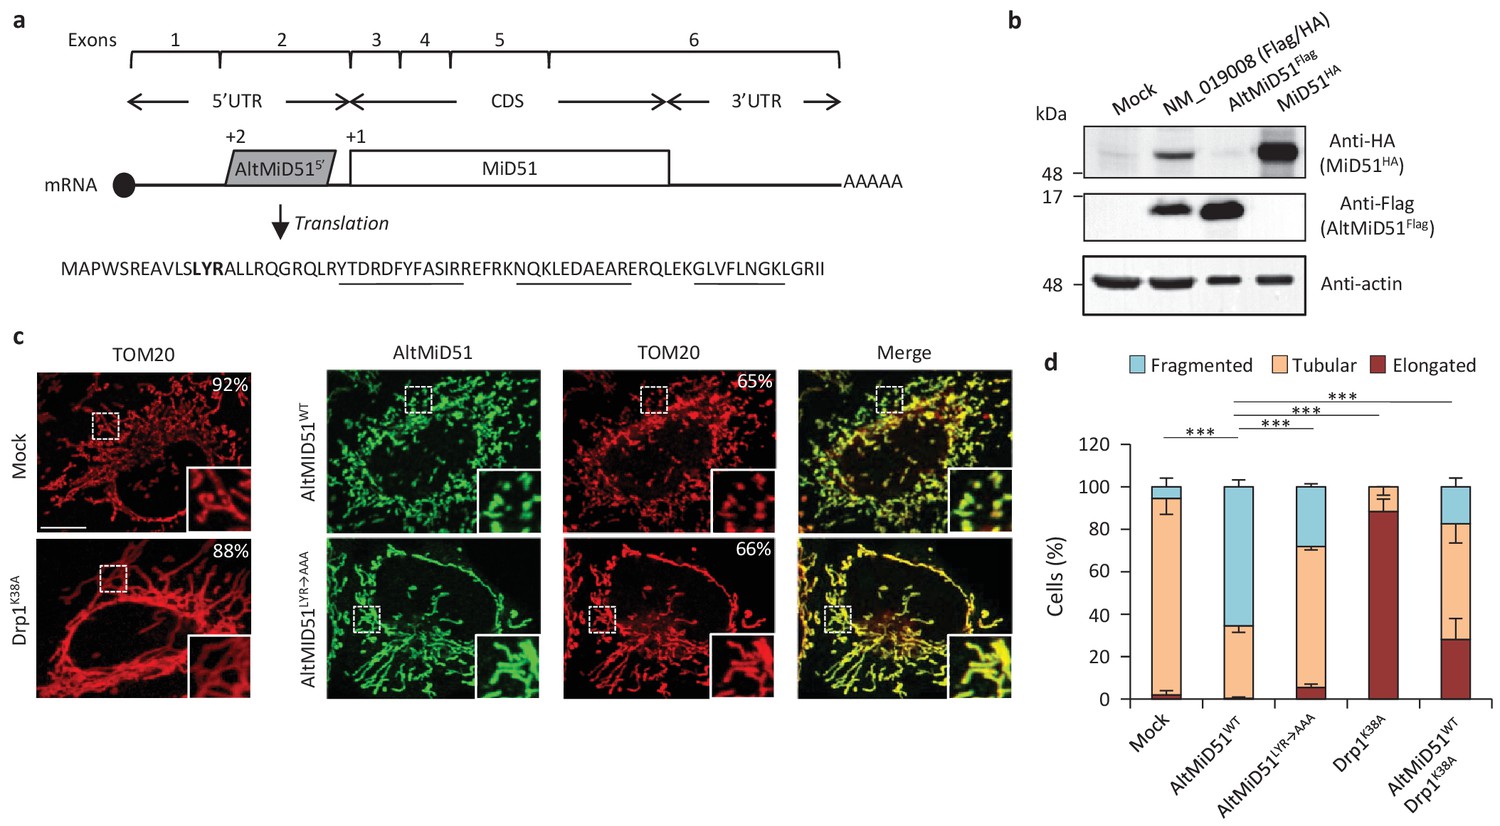
(a) AltMiD515’ coding sequence is located in exon two or the MiD51/MIEF1/SMCR7L gene and in the 5’UTR of the canonical mRNA (RefSeq NM_019008).+2 and+1 indicate reading frames. AltMiD51 amino acid sequence is shown with the LYR tripeptide shown in bold. Underlined peptides were detected by MS. (b) Human HeLa cells transfected with empty vector (mock), a cDNA corresponding to the canonical MiD51 transcript with a Flag tag in frame with altMiD51 and an HA tag in frame with MiD51, altMiD51Flag cDNA or MiD51HA cDNA were lysed and analyzed by western blot with antibodies against Flag, HA or actin, as indicated. (c) Confocal microscopy of mock-transfected cells, cells transfected with altMiD51WT, altMiD51LYR→AAA or Drp1K38A immunostained with anti-TOM20 (red channel) and anti-Flag (green channel) monoclonal antibodies. In each image, boxed areas are shown at higher magnification in the bottom right corner. % of cells with the most frequent morphology is indicated: mock (tubular), altMiD51WT (fragmented), altMiD51(LYR→AAA) (tubular), Drp1(K38A) (elongated). Scale bar, 10 mm. (d) Bar graphs show mitochondrial morphologies in HeLa cells. Means of three independent experiments per condition are shown (100 cells for each independent experiment). ***p<0.0005 (Fisher’s exact test) for the three morphologies between altMiD51(WT) and the other experimental conditions.
-
Figure 12—source data 1
Mitochondrial morphologies in HeLa cells.
- https://doi.org/10.7554/eLife.27860.046
Figure 12—figure supplement 1
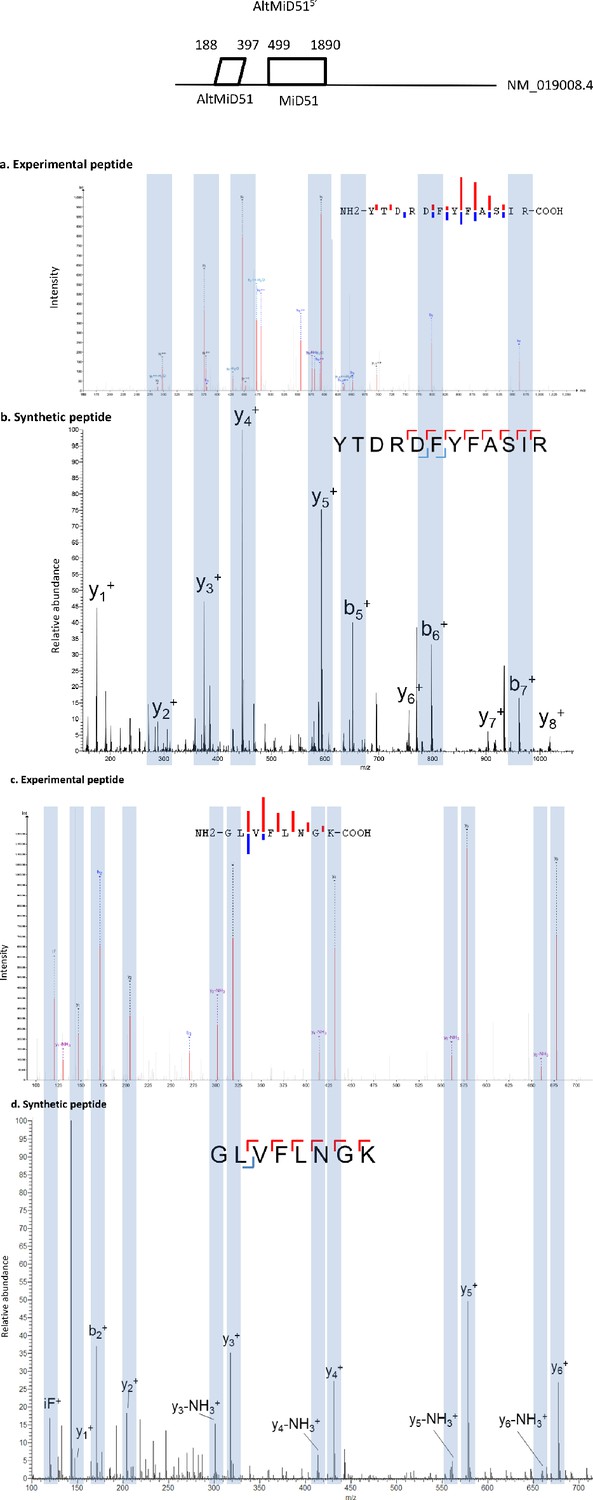
Spectra validation for altMiD51.
Example of validation for altMiD51 specific peptides YTDRDFYFASIR and GLVFLNGK. (a,c) Experimental MS/MS spectra (PeptideShaker graphic interface output). (b,d) MS/MS spectra of the synthetic peptides. Matching peaks are shown with blue masks. A diagram of the transcript with its accession number and the localization of the altORF and the CDS is shown at the top.
Figure 12—figure supplement 2
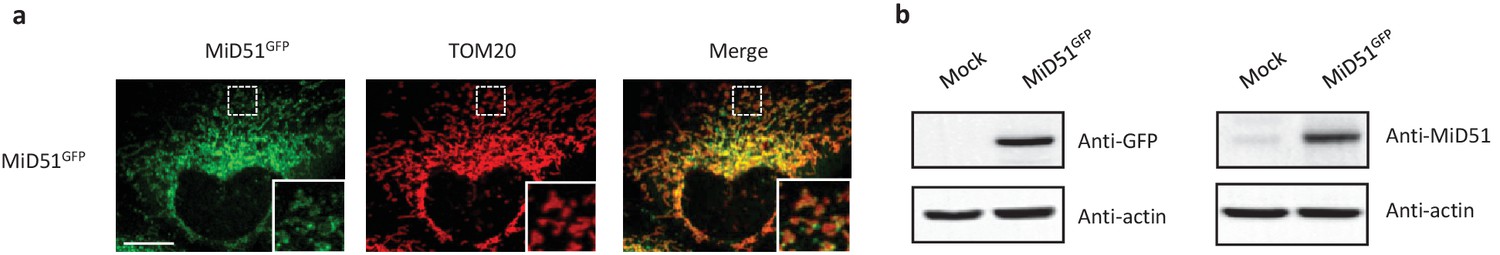
MiD51 expression results in mitochondrial fission.
(a) Confocal microscopy of HeLa cells transfected with MiD51GFP immunostained with anti-TOM20 (red channel) monoclonal antibodies. In each image, boxed areas are shown at higher magnification in the bottom right corner. The localization of MiD51 in fission sites is shown in merged higher magnification inset. Scale bar, 10 mm. (b) Human HeLa cells transfected with empty vector (mock) or MiD51GFP were lysed and analyzed by western blot to confirm MiD51GFP expression.
Figure 12—figure supplement 3

AltMiD51 is localized in the mitochondrial matrix.
Trypan blue quenching experiment performed on HeLa cells stably expressing the indicated constructs: Matrix-Venus (Mx-Venus) and Intermembrane space-Venus (IMS-Venus). The fluorescence remaining after quenching by trypan blue is shown relative to Matrix-Venus (Mx-Venus) indicated by the dashed line. (****p<0,0001, one-way ANOVA). The absence of quenching of the fluorescence compared to IMS-Venus indicates the matricial localization of altMiD51. n ≥ 3 cells were quantified per experiment, and results are from six independent experiments. Data are mean ±SEM.
Figure 12—figure supplement 4
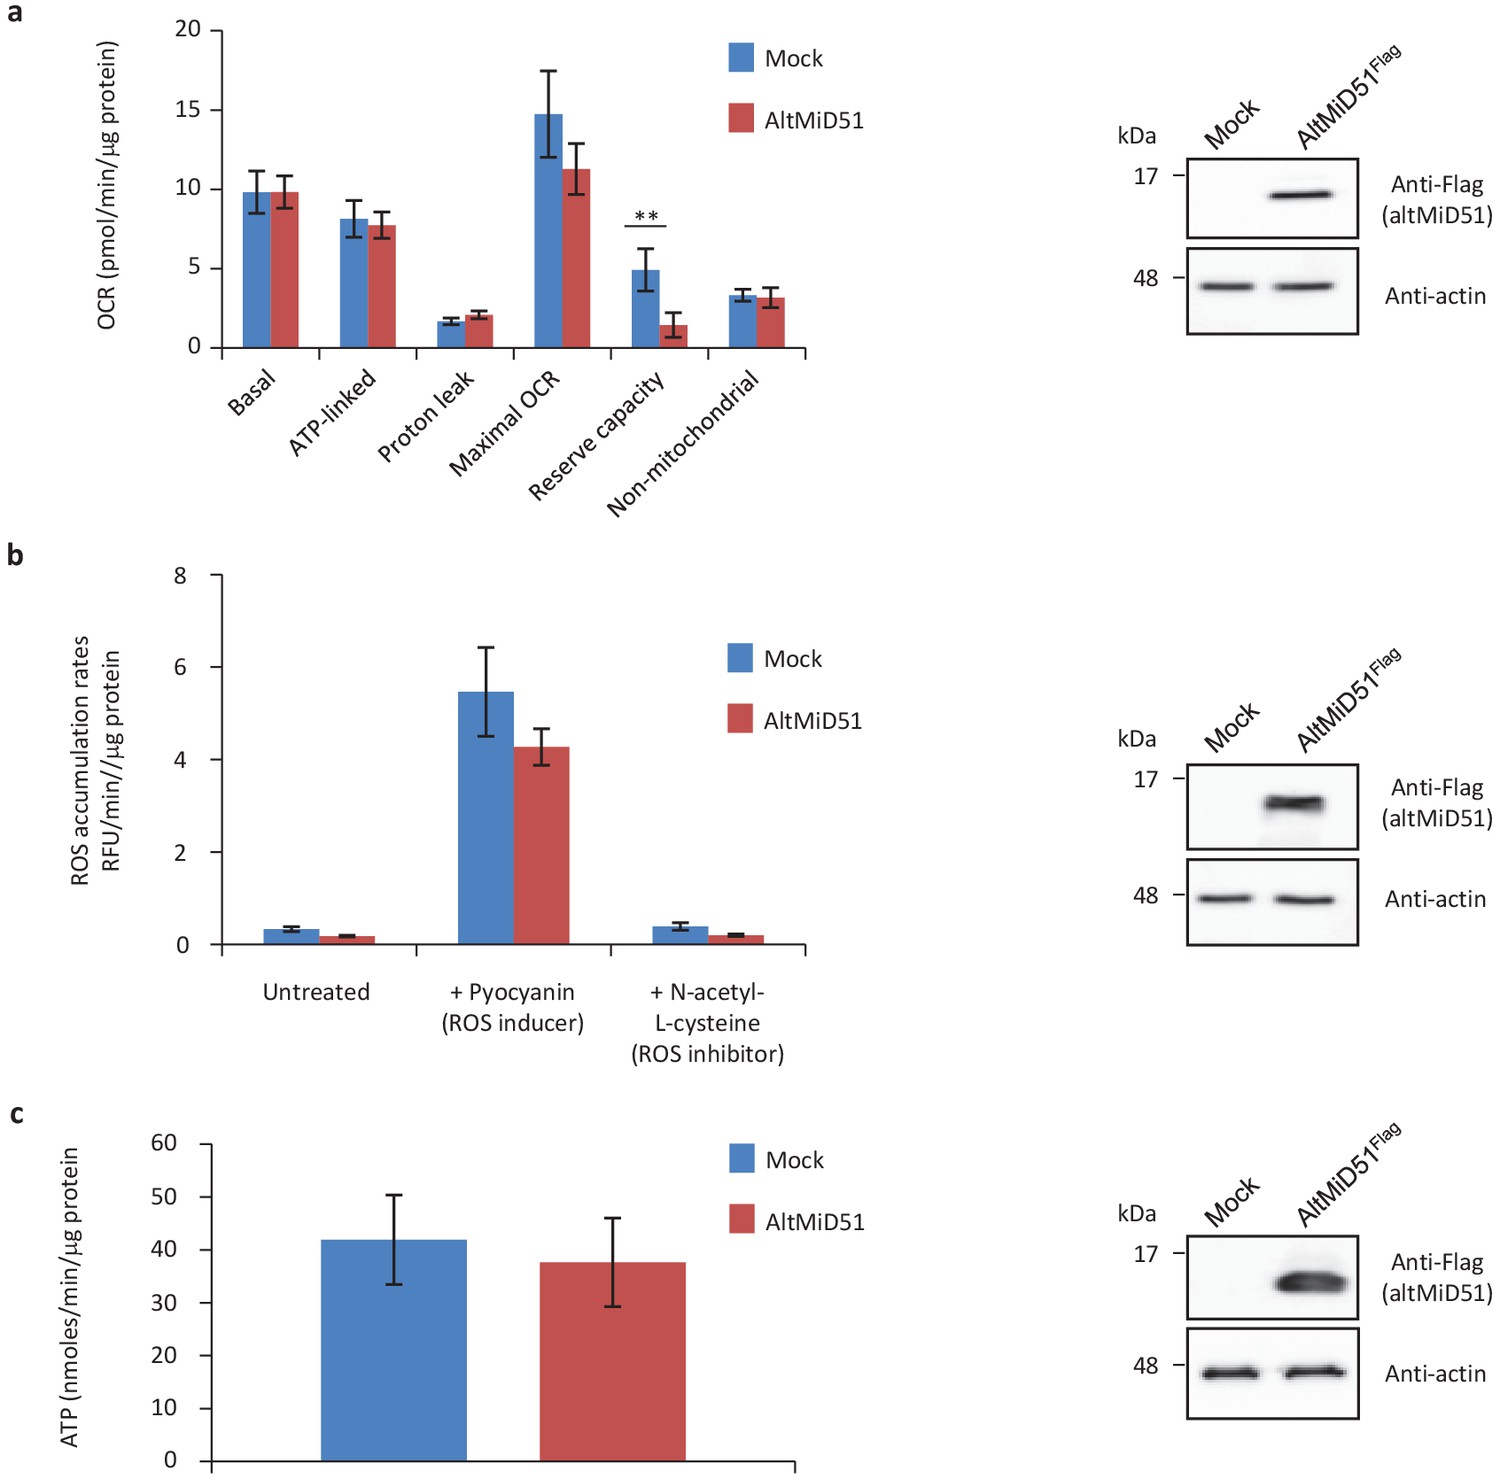
Mitochondrial function parameters.
(a) Oxygen consumption rates (OCR) in HeLa cells transfected with empty vector (mock) or altMiD51Flag. Mitochondrial function parameters were assessed in basal conditions (basal), in the presence of oligomycin to inhibit the ATP synthase (oxygen consumption that is ATP-linked), FCCP to uncouple the mitochondrial inner membrane and allow for maximum electron flux through the respiratory chain (maximal OCR), and antimycin A/rotenone to inhibit complex III (non-mitochondrial). The balance of the basal OCR comprises oxygen consumption due to proton leak and nonmitochondrial sources. The mitochondrial reserve capacity (maximal OCR- basal OCR) is an indicator of rapid adaptation to stress and metabolic changes. Mean values of replicates are plotted with error bars corresponding to the 95% confidence intervals. Statistical significance was estimated using a two-way ANOVA with Tukey's post-hoc test (**p=0,004). (b) ROS production in mock and altMiD51-expressing cells. Cells were untreated, treated with a ROS inducer or a ROS inhibitor. Results represent the mean value out of three independent experiments, with error bars corresponding to the standard error of the mean (s.e.m.). Statistical significance was estimated using unpaired T-test. (c) ATP synthesis rate in mock and altMiD51-expressing cells. No significant differences in ATP production were observed between mock and altMiD51 transfected cells. Results represent the mean of three independent experiments (eight technical replicates each). Error bars represent the standard error of the mean. At the end of the experiments, cells were collected and proteins analyzed by western blot with antibodies against the Flag tag (altMiD51) or actin, as indicated, to verify the expression of altMiD51. A representative western blot is shown on the right. Molecular weight markers are shown on the left (kDa).
Figure 12—figure supplement 5
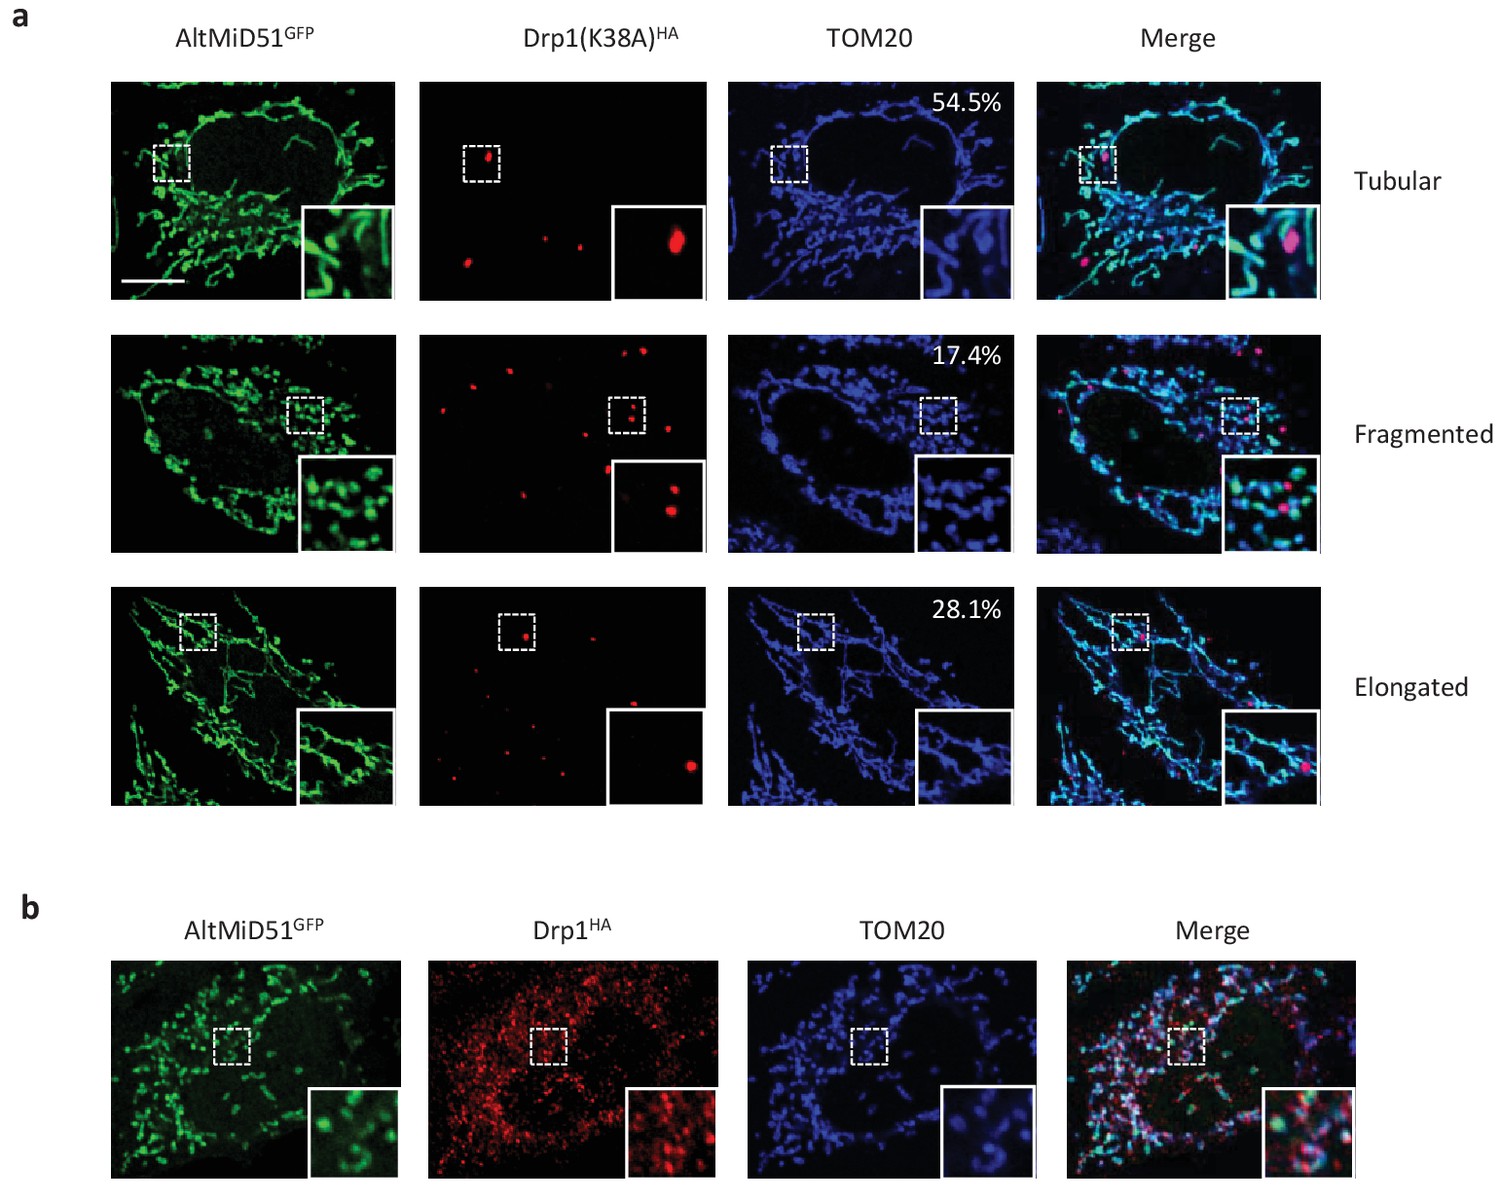
Representative confocal images of cells co-expressing altMiD51GFP and Drp1(K38A)HA.
(a) Confocal microscopy of HeLa cells co-transfected with altMiD51GFP and Drp1(K38A)HA immunostained with anti-TOM20 (blue channel) and anti-HA (red channel) monoclonal antibodies. In each image, boxed areas are shown at higher magnification in the bottom right corner. % of cells with the indicated morphology is indicated on the TOM20 panels. (b) Confocal microscopy of HeLa cells co-transfected with altMiD51GFP and Drp1(wt)HA immunostained with anti-TOM20 (blue channel) and anti-HA (red channel) monoclonal antibodies. In each image, boxed areas are shown at higher magnification in the bottom right corner. Scale bar, 10 mm.
Figure 12—figure supplement 6
Protein immunoblot showing the expression of different constructs in HeLa cells.
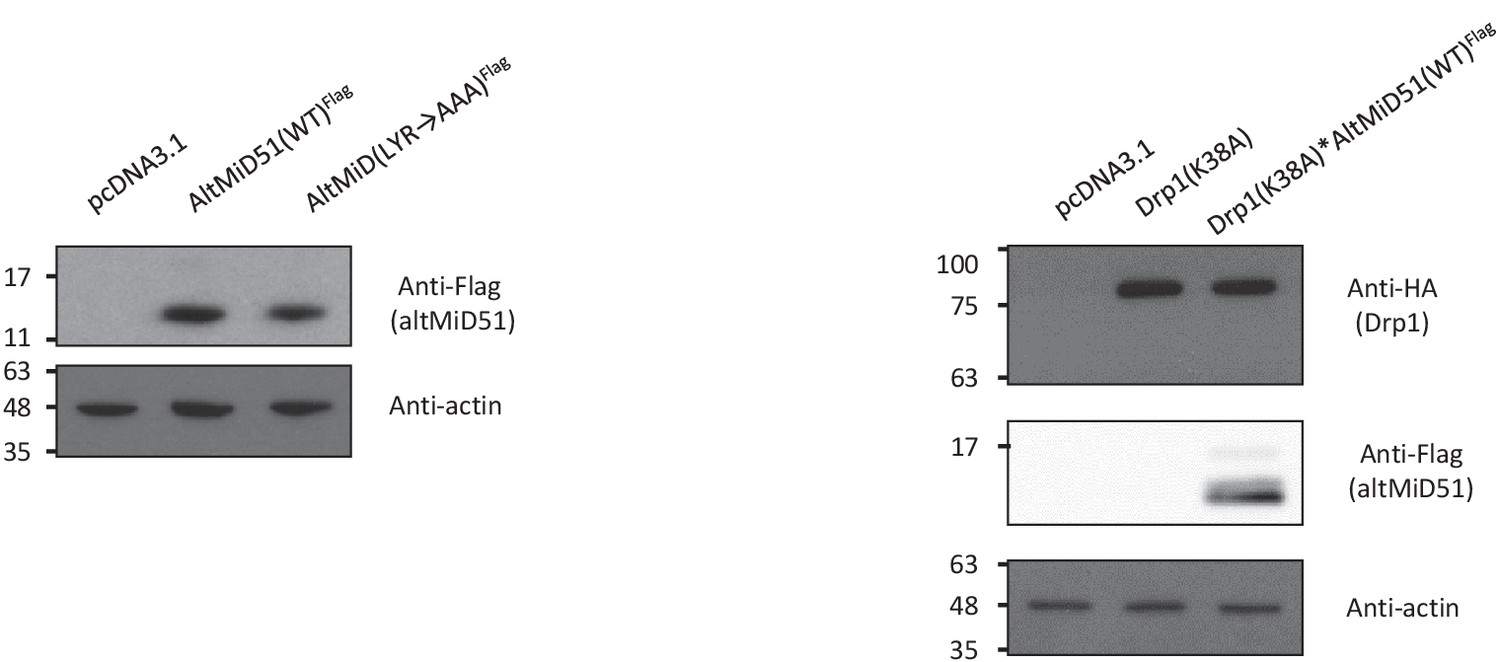
HeLa cells were transfected with empty vector (pcDNA3.1), altMiD51(WT)Flag, altMID51(LYR→AAA)Flag, Drp1(K38A)HA, or Drp1(K38A)HA and altMiD51(WT)Flag, as indicated. Proteins were extracted and analyzed by western blot with antibodies against the Flag tag (altMiD51), the HA tag (Drp1K38A) or actin, as indicated. Molecular weight markers are shown on the left (kDa). Representative experiment of three independent biological replicates.
Figure 13
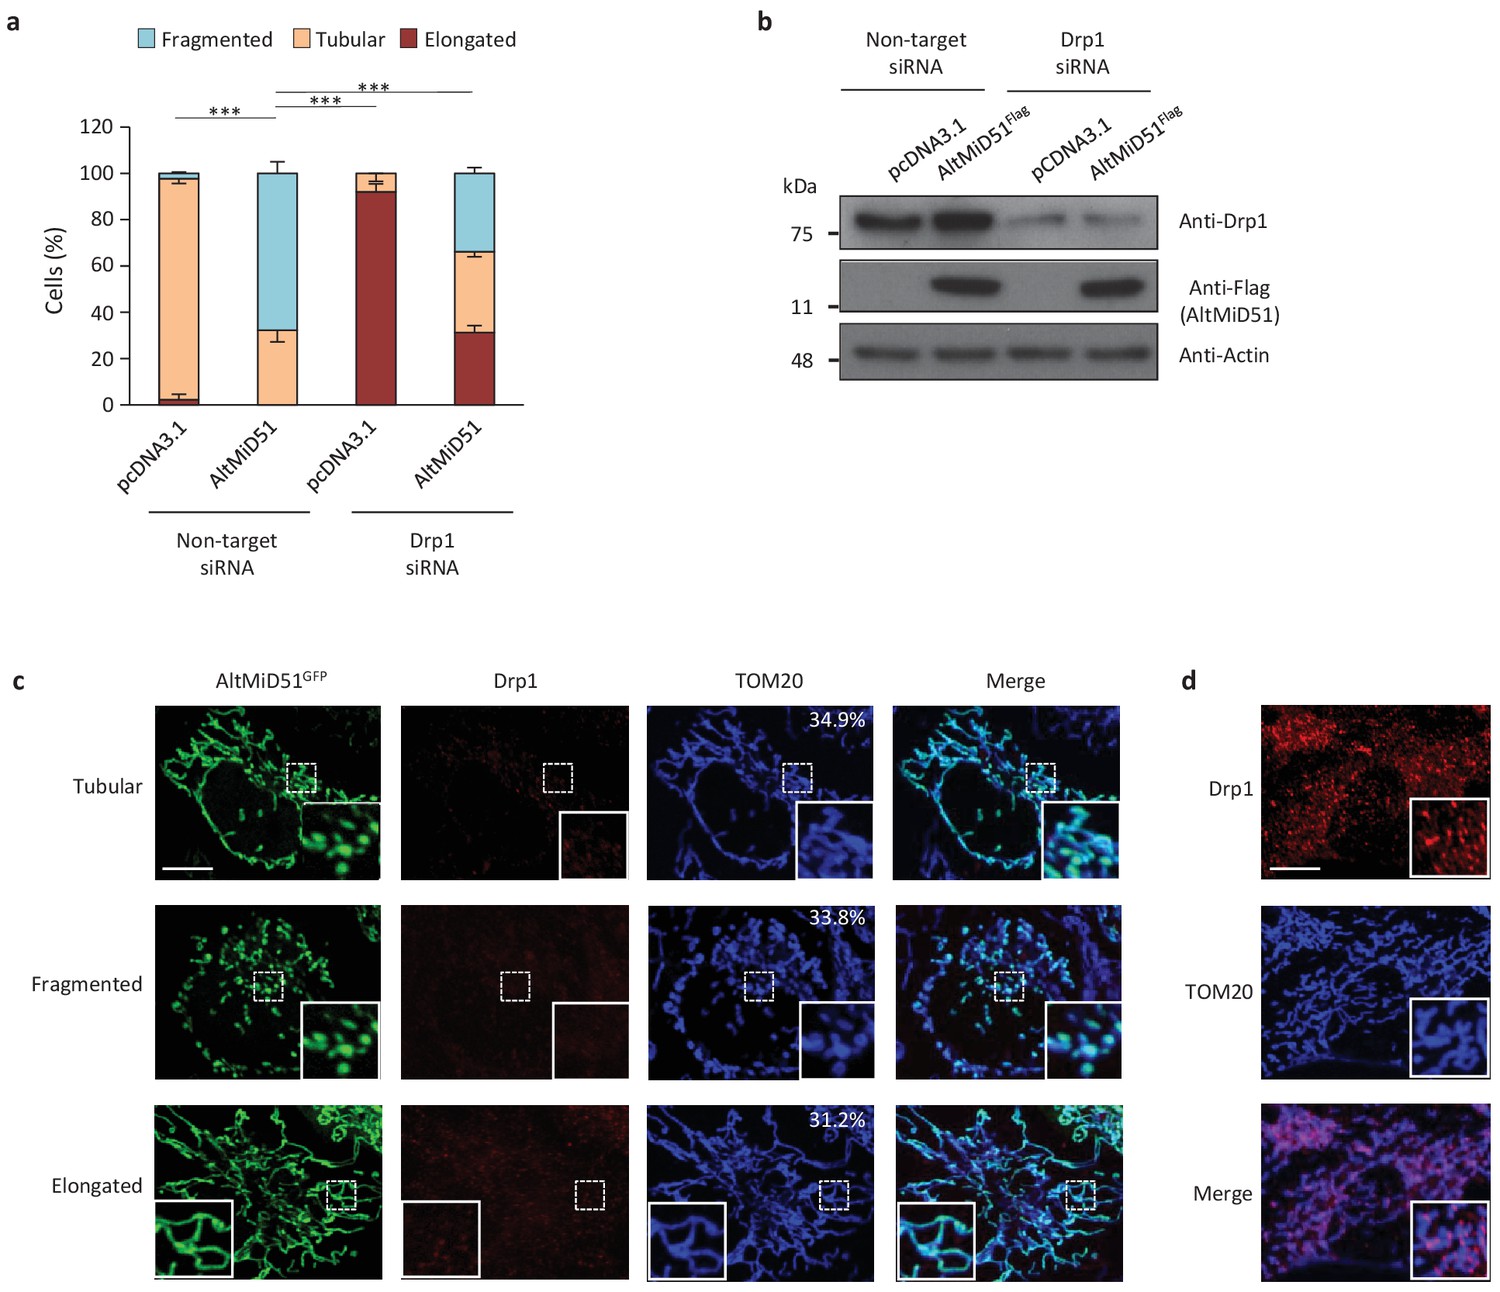
AltMiD51-induced mitochondrial fragmentation is dependent on Drp1.
(a) Bar graphs show mitochondrial morphologies in HeLa cells treated with non-target or Drp1 siRNAs. Cells were mock-transfected (pcDNA3.1) or transfected with altMiD51Flag. Means of three independent experiments per condition are shown (100 cells for each independent experiment). ***p<0.0005 (Fisher’s exact test) for the three morphologies between altMiD51 and the other experimental conditions. (b) HeLa cells treated with non-target or Drp1 siRNA were transfected with empty vector (pcDNA3.1) or altMiD51Flag, as indicated. Proteins were extracted and analyzed by western blot with antibodies against the Flag tag (altMiD51), Drp1 or actin, as indicated. (c) Confocal microscopy of Drp1 knockdown cells transfected with altMiD51GFP immunostained with anti-TOM20 (blue channel) and anti-Drp1 (red channel) monoclonal antibodies. In each image, boxed areas are shown at higher magnification in the bottom right corner. % of cells with the indicated morphology is indicated on the TOM20 panels. Scale bar, 10 mm. (d) Control Drp1 immunostaining in HeLa cells treated with a non-target siRNA. For (c) and (d), laser parameters for Drp1 and TOM20 immunostaining were identical.
-
Figure 13—source data 1
Mitochondrial morphologies in HeLa cells treated with non-target or Drp1 siRNAs.
- https://doi.org/10.7554/eLife.27860.048
Figure 14 with 2 supplements
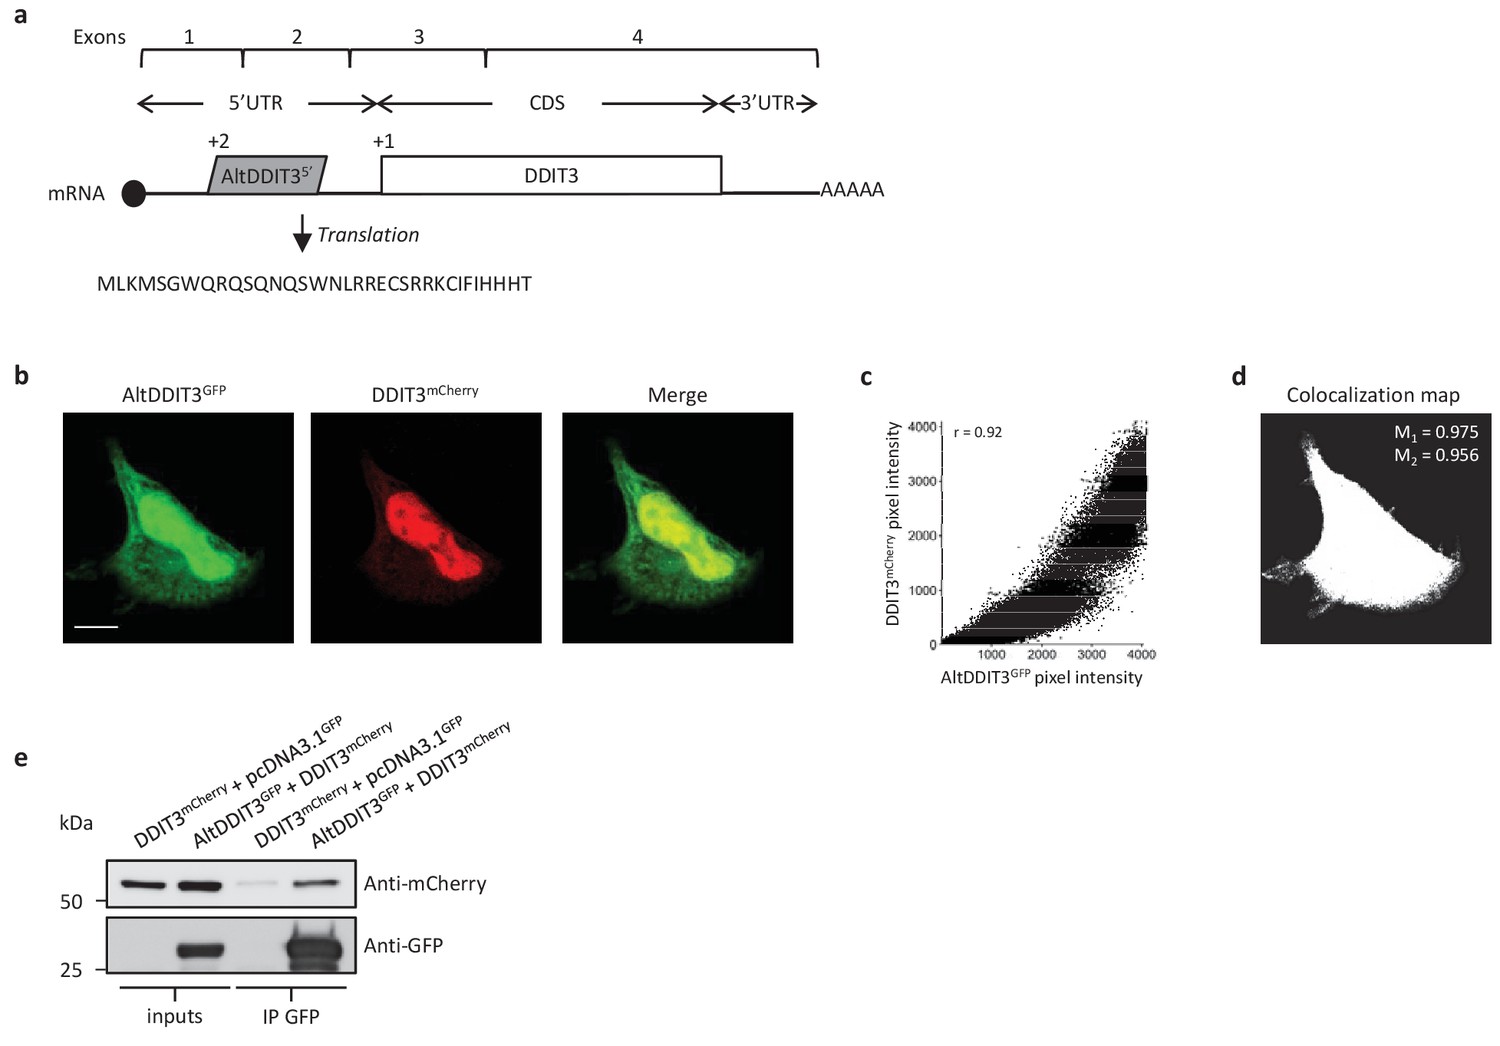
AltDDIT35’ co-localizes and interacts with DDIT3.
(a) AltDDIT35’ coding sequence is located in exons 1 and 2 or the DDIT3/CHOP/GADD153 gene and in the 5’UTR of the canonical mRNA (RefSeq NM_004083.5).+2 and+1 indicate reading frames. AltDDIT3 amino acid sequence is also shown. (b) Confocal microscopy analyses of HeLa cells co-transfected with altDDIT3GFP (green channel) and DDIT3mCherry (red channel). Scale bar, 10 µm. (c, d) Colocalization analysis of the images shown in (b) performed using the JACoP plugin (Just Another Co-localization Plugin) implemented in Image J software (two independent biological replicates). (c) Scatterplot representing 50% of green and red pixel intensities showing that altDDIT3GFP and DDIT3mCherry signal highly correlate (with Pearson correlation coefficient of 0.92 [p-value<0.0001]). (d) Binary version of the image shown in (b) after Costes’ automatic threshold. White pixels represent colocalization events (p-value<0.001, based on 1000 rounds of Costes’ randomization colocalization analysis). The associated Manders Correlation Coefficient, M1 and M2, are shown in the right upper corner. M1 is the proportion of altDDIT3GFP signal overlapping DDIT3mCherry signal and M2 is the proportion of DDIT3mCherry signal overlapping altDDIT3GFP. (e) Representative immunoblot of co-immunoprecipitation with GFP-Trap agarose beads performed on HeLa lysates co-expressing DDIT3mcherry and altDDIT3GFP or DDIT3mcherry with pcDNA3.1GFP empty vector (two independent experiments).
Figure 14—figure supplement 1
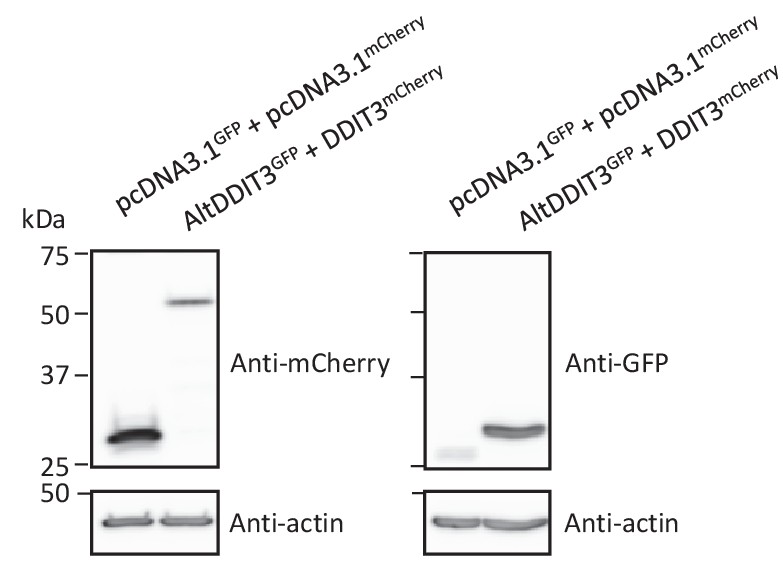
Protein immunoblot showing the expression of different constructs in HeLa cells.
HeLa cells were co-transfected with GFP and mCherry, or altDDIT3GFP and DDIT3mCherry, as indicated. Proteins were extracted and analyzed by western blot with antibodies, as indicated. Molecular weight markers are shown on the left (kDa). AltDDIT3 has a predicted molecular weight of 4.28 kDa and thus migrates at its expected molecular weight when tagged with GFP (~32 kDa). Representative experiment of two independent biological replicates.
Figure 14—figure supplement 2

Colocalization of altDDIT3 with DDIT3.
Scatter plots of Pearson’s Correlation Coefficient and Manders’ Correlation Coefficient after Costes’ automatic threshold (p-value<0.001, based on 1000 rounds of Costes’ randomization colocalization analysis). M1 is the proportion of altDDIT3GFP signal overlapping DDIT3mCherry signal and M2 is the proportion of DDIT3mCherry signal overlapping altDDIT3GFP. Error bars represent the mean ±SD of three independent experiments (28 cells).
Author response image 1

Author response image 2
Tables
Table 1
AltORF and alternative protein annotations in different organisms.
https://doi.org/10.7554/eLife.27860.009| Genomes | Features | |||||
|---|---|---|---|---|---|---|
| Transcripts | Current annotations | Annotations of alternative protein coding sequences | ||||
| mRNAs | Others1* | CDSs | Proteins | AltORFs | Alternative proteins | |
| H. sapiens GRCh38 RefSeq GCF_000001405.26 | 67,765 | 11,755 | 68,264 | 54,498 | 539,134 | 183,191 |
| P. troglodytes 2.1.4 RefSeq GCF_000001515.6 | 55,034 | 7527 | 55,243 | 41,774 | 416,515 | 161,663 |
| M. musculus GRCm38p2, RefSeq GCF_000001635.22 | 73,450 | 18,886 | 73,55 1 | 53,573 | 642,203 | 215,472 |
| B. Taurus UMD3.1.86 | 22,089 | 838 | 22,089 | 21,915 | 79,906 | 73,603 |
| X. tropicalis Ensembl JGI_4.2 | 28,462 | 4644 | 28,462 | 22,614 | 141,894 | 69,917 |
| D. rerio Ensembl ZV10.84 | 44,198 | 8196 | 44,198 | 41,460 | 214,628 | 150,510 |
| D. melanogaster RefSeq GCA_000705575.1 | 30,255 | 3474 | 30,715 | 20,995 | 174,771 | 71,705 |
| C. elegans WBcel235, RefSeq GCF_000002985.6 | 28,653 | 25,256 | 26,458 | 25,750 | 131,830 | 45,603 |
| S. cerevisiae YJM993_v1, RefSeq GCA_000662435.1 | 5471 | 1463 | 5463 | 5423 | 12,401 | 9492 |
-
*Other transcripts include miRNAs, rRNAs, ncRNAs, snRNAs, snoRNAs, tRNAs.
†Annotated retained-intron and processed transcripts were classified as mRNAs.
Table 2
Alternative zinc finger proteins detected by mass spectrometry (MS) and ribosome profiling (RP)
https://doi.org/10.7554/eLife.27860.033| Alternative protein accession | Detection method* | Gene | Amino acid sequence | AltORF localization |
|---|---|---|---|---|
| IP_238718.1 | MS | RP11 | MLVEVACSSCRSLLHKGAGASEDGAALEPAHTGGKENGATT | nc |
| IP_278905.1 | RP | ZNF761 | MSVARPLVGSHILYAIIDFILERNLISVMSVARTLVRSHPLYATIDFILERNLTSVMSVARPLVRSQTLHAIVDFILEKNKCNECGEVFNQQAHLAGHHRIHTGEKP | CDS |
| IP_278745.1 | MS and RP | ZNF816 | MSVARPSVRNHPFNAIIYFTLERNLTNVKNVTMFTFADHTLKDIGRFILERDHTNVRFVTRFSGVIHTLQNIREFILERNHTSVINVAGVSVGSHPFNTIIHFTLERNLTHVMNVARFLVEEKTLHVIIDFMLERNLTNVKNVTKFSVADHTLKDIGEFILGKNHTNVRFVTRLSGVIHALQTIREFILERNLTSVINVRRFLIKKESLHNIREFILERNLTSVMNVARFLIKKQALQNIREFILQRNLTSVMSVAKPLLDSQHLFTIKQSMGVGKLYKCNDCHKVFSNATTIANHYRIHIEERSTSVINVANFSDVIHNL | CDS |
| IP_138289.1 | MS | ZSCAN31 | MNIGGATLERNPINVRSVGKPSVPAMASLDTEESTQGKNHMNAKCVGRLSSSAHALFSIRGYTLERSAISVVSVAKPSFRMQGFSSISESTLVRNPISAVSAVNSLVSGHFLRNIRKSTLERDHKGDEFGKAFSHHCNLIRHFRIHTVPAELD | CDS |
| IP_278564.1 | MS | ZNF808 | MIVTKSSVTLQQLQIIGESMMKRNLLSVINVACFSDIVHTLQFIGNLILERNLTNVMIEARSSVKLHPMQNRRIHTGEKPHKCDDCGKAFTSHSHLVGHQRIHTGQKSCKCHQCGKVFSPRSLLAEHEKIHF | 3’UTR |
| IP_275012.1 | MS | ZNF780A | MKPCECTECGKTFSCSSNIVQHVKIHTGEKRYNVRNMGKHLLWMISCLNIRKFRIVRNFVTIRSVDKPSLCTKNLLNTRELILMRNLVNIKECVKNFHHGLGFAQLLSIHTSEKSLSVRNVGRFIATLNTLEFGEDNSCEKVFE | 3’UTR |
| IP_270595.1† | MS | ZNF440 | MHSVERPYKCKICGRGFYSAKSFQIHEKSYTGEKPYECKQCGKAFVSFTSFRYHERTHTGENPYECKQFGKAFRSVKNLRFHKRTHTGEKPCECKKCRKAFHNFSSLQIHERMHRGEKLCECKHCGKAFISAKIL | CDS |
| IP_270643.1† | MS | ZNF763 | MKKLTLERNPINACHVVKPSIFPVPFSIMKGLTLERNPMSVSVGKPSDVPHTFEGMVGLTGEKPYECKECGKAFRSASHLQIHERTQTHIRIHSGERPYKCKTCGKGFYSPTSFQRHEKTHTAEKPYECKQCGKAFSSSSSFWYHERTHTGEKPYECKQCGKAFRSASIQMHAGTHPEEKPYECKQCGKAFRSAPHLRIHGRTHTGEKPYECKECGKAFRSAKNLRIHERTQTHVRMHSVERPYKCKICGKGFYSAKSFQIPEKSYTGEKPYECKQCGKAFISFTSFR | 3’UTR |
| IP_270597.1‡ | MS | ZNF440 | MKNLTLERNPMSVSNVGKPLFPSLPFDIMKGLTLERTPMSVSNLGKPSDLSKIFDFIKGHTLERNPVNVRNVEKHSIISLLCKYMKGCTEERSSVNVSIVGKHSYLPRSFEYMQEHTMERNPMNVKNAEKHSACLLPFIDMKRLTLEGNTMNASNVAKLSLLPVLFNIMKEHTREKPYQCKQCAKAFISSTSFQYHERTHMGEKPYECMPSGKAFISSSSLQYHERTHTGEKPYEYKQCGKAFRSASHLQMHGRTHTGEKPYECKQYGKAFRPDKIL | 3’UTR |
| IP_270609.1‡ | MS | ZNF439 | MNVSNVAKAFTSSSSFQYHERTHTGEKPYQCKQCGKAVRSASRLQMHGSTHTWQKLYECKQYGKAFRSARIL | 3’UTR |
| IP_270663.1‡ | MS | ZNF844 | MHGRTHTQEKPYECKQCGKAFIFSTSFRYHERTHTGEKPYECKQCGKAFRSATQLQMHRKIHTGEKPYECKQCGKAYRSVSQLLVHERTHTVEQPYEYKQYGKAFRFAKNLQIQTMNVNN | CDS |
| IP_270665.1‡ | MS | ZNF844 | MHRKIHTGEKPYECKQCGKAYRSVSQLLVHERTHTVEQPYEYKQYGKAFRFAKNLQIQTMNVNN | CDS |
| IP_270668.1‡ | MS | ZNF844 | MSSTAFQYHEKTHTREKHYECKQCGKAFISSGSLRYHERTHTGEKPYECKQCGKAFRSATQLQMHRKIHTGEKPYECKQCGKAYRSVSQLLVHERTHTVEQPYEYKQYGKAFRFAKNLQIQTMNVNN | 3’UTR |
| IP_138139.1 | MS | ZNF322 | MLSPSRCKRIHTGEQLFKCLQCQLCCRQYEHLIGPQKTHPGEKPQQV | 3’UTR |
| IP_204754.1 | RP | ZFP91-CNTF | MPGETEEPRPPEQQDQEGGEAAKAAPEEPQQRPPEAVAAAPAGTTSSRVLRGGRDRGRAAAAAAAAAVSRRRKAEYPRRRRSSPSARPPDVPGQQPQAAKSPSPVQGKKSPRLLCIEKVTTDKDPKEEKEEEDDSALPQEVSIAASRPSRGWRSSRTSVSRHRDTENTRSSRSKTGSLQLICKSEPNTDQLDYDVGEEHQSPGGISSEEEEEEEEEMLISEEEIPFKDDPRDETYKPHLERETPKPRRKSGKVKEEKEKKEIKVEVEVEVKEEENEIREDEEPPRKRGRRRKDDKSPRLPKRRKKPPIQYVRCEMEGCGTVLAHPRYLQHHIKYQHLLKKKYVCPHPSCGRLFRLQKQLLRHAKHHTDQRDYICEYCARAFKSSHNLAVHRMIHTGEKPLQCEICGFTCRQKASLNWHMKKHDADSFYQFSCNICGKKFEKKDSVVAHKAKSHPEVLIAEALAANAGALITSTDILGTNPESLTQPSDGQGLPLLPEPLGNSTSGECLLLEAEGMSKSYCSGTERSIHR | nc |
| IP_098649.1 | RP | INO80B-WBP1 | MSKLWRRGSTSGAMEAPEPGEALELSLAGAHGHGVHKKKHKKHKKKHKKKHHQEEDAGPTQPSPAKPQLKLKIKLGGQVLGTKSVPTFTVIPEGPRSPSPLMVVDNEEEPMEGVPLEQYRAWLDEDSNLSPSPLRDLSGGLGGQEEEEEQRWLDALEKGELDDNGDLKKEINERLLTARQRALLQKARSQPSPMLPLPVAEGCPPPALTEEMLLKREERARKRRLQAARRAEEHKNQTIERLTKTAATSGRGGRGGARGERRGGRAAAPAPMVRYCSGAQGSTLSFPPGVPAPTAVSQRPSPSGPPPRCSVPGCPHPRRYACSRTGQALCSLQCYRINLQMRLGGPEGPGSPLLATFESCAQE | nc |
| IP_115174.1 | RP | ZNF721 | MYIGEFILERNPTHVENVAKPLDSLQIFMRIRKFILERNPTRVETVAKPLDSLQIFMHIRKFILEIKPYKCKECGKAFKSYYSILKHKRTHTRGMSYEGDECRGL | CDS |
| IP_275016.1 | RP | ZNF780A | MNVRSVGKALIVVHTLFSIRKFIPMRNLLYVGNVRWPLDIIANLLNILEFILVTSHLNVKTVGRPSIVAQALFNIRVFTLVRSPMNVRSVGRLLDFTYNFPNIRKLTQVKNHLNVRNVGNSFVVVQILINIEVFILERNPLNVRNVGKPFDFICTLFDIRNCILVRNPLNVRSVGKPFDFICNLFDIRNCILVRNPLNVRNVERFLVFPPSLIAIRTFTQVRRHLECKECGKSFNRVSNHVQHQSIRAGVKPCECKGCGKGFICGSNVIQHQKIHSSEKLFVCKEWRTTFRYHYHLFNITKFTLVKNPLNVKNVERPSVF | CDS or 3’UTR |
| IP_278870.1 | RP | ZNF845 | MNVARFLIEKQNLHVIIEFILERNIRNMKNVTKFTVVNQVLKDRRIHTGEKAYKCKSL | CDS |
| IP_278888.1 | RP | ZNF765 | MSVARPSAGRHPLHTIIDFILDRNLTNVKIVMKLSVSNQTLKDIGEFILERNYTCNECGKTFNQELTLTCHRRLHSGEKPYKYEELDKAYNFKSNLEIHQKIRTEENLTSVMSVARP | CDS |
| IP_278918.1 | RP | ZNF813 | MNVARVLIGKHTLHVIIDFILERNLTSVMNVARFLIEKHTLHIIIDFILEINLTSVMNVARFLIKKHTLHVTIDFILERNLTSVMNVARFLIKKQTLHVIIDFILERNLTSLMSVAKLLIEKQSLHIIIQFILERNKCNECGKTFCHNSVLVIHKNSYWRETSVMNVAKFLINKHTFHVIIDFIVERNLRNVKHVTKFTVANRASKDRRIHTGEKAYKGEEYHRVFSHKSNLERHKINHTAEKP | CDS |
| IP_280349.1 | RP | ZNF587 | MNAVNVGNHFFPALRFMFIKEFILDKSLISAVNVENPFLNVPVSLNTGEFTLEKGLMNAPNVEKHFSEALPSFIIRVHTGERPYECSEYGKSFAEASRLVKHRRVHTGERPYECCQCGKHQNVCCPRS | CDS |
| IP_280385.1 | RP | ZNF417 | MNAMNVGNHFFPALRFMFIKEFILDKSLISAVNVENPLLNVPVSLNTGEFTLEKGLMNVPNVEKHFSEALPSFIIRVHTGERPYECSEYGKSFAETSRLIKHRRVHTGERPYECCQSGKHQNVCSPWS | CDS |
-
*MS, mass spectrometry; RP, ribosome profiling.
† These two proteins were not detected with unique peptides but with shared peptides. One protein only was counted in subsequent analyses.
-
These five proteins were not detected with unique peptides but with shared peptides. One protein only was counted in subsequent analyses.
Table 3
Examples of proteins encoded in the same gene and functionally interacting
https://doi.org/10.7554/eLife.27860.052| Gene | Polypeptides* | Reference | altORF localization | altORF size aa | Conservation | Summary of functional relationship with the annotated protein |
|---|---|---|---|---|---|---|
| CDKN2A, INK4 | Cyclin-dependent kinase inhibitor 2A or p16-INK4 (P42771), and p19ARF (Q8N726) | (61) | 5'UTR | 169 | Human, mouse | the unitary inheritance of p16INK4a and p19ARF may underlie their dual requirement in cell cycle control. |
| GNAS, XLalphas | Guanine nucleotide-binding protein G(s) subunit alpha isoforms XLαs (Q5JWF2) and Alex (P84996) | (62) | 5'UTR | +700 | Human, mouse, rat | Both subunits transduce receptor signals into stimulation of adenylyl cyclase. |
| ATXN1 | Ataxin-1 (P54253) and altAtaxin-1 | (63) | CDS | 185 | Human, chimpanzee, cow | Direct interaction |
| Adora2A | A2A adenosine receptor (P30543) and uORF5 | (64) | 5'UTR | 134 | Human, chimpanzee, rat, mouse | A2AR stimulation increases the level of the uORF5 protein via post-transcriptional regulation. |
| AGTR1 | Angiotensin type 1a receptor (P25095) and PEP7 | (65) | 5'UTR | 7 | Highly conserved across mammalian species | Inhibits non-G protein-coupled signalling of angiotensin II, without altering the classical G protein-coupled pathway activated by the ligand. |
-
*The UniProtKB accession is indicated when available.
Additional files
-
Supplementary file 1
12,616 alternative proteins and 26,531 reference proteins with translation initiation sites detected by ribosome profiling after re-analysis of large-scale studies.
Sheet 1: general information. Sheet 2: list of alternative proteins; sheet 3: pie chart of corresponding altORFs localization. Sheet 4: Sheet 2: list of reference proteins
- https://doi.org/10.7554/eLife.27860.053
-
Supplementary file 2
4,872 alternative proteins detected by mass spectrometry (MS) after re-analysis of large proteomic studies.
Sheet 1: MS identification parameters; sheet 2: raw MS output; sheet 3: list of detected alternative proteins; sheet 4: pie chart of corresponding altORFs localization.
- https://doi.org/10.7554/eLife.27860.054
-
Supplementary file 3
List of phosphopeptides.
- https://doi.org/10.7554/eLife.27860.055
-
Supplementary file 4
Linker sequences separating adjacent zinc finger motifs.
- https://doi.org/10.7554/eLife.27860.056
-
Supplementary file 5
100 alternative proteins with 25% to 100% identity and 10% to 100% overlap with their reference protein pairs.
Sheet 1: BlastP output and protein domains.
- https://doi.org/10.7554/eLife.27860.057
-
Supplementary file 6
383 alternative proteins detected by mass spectrometry in the interactome of 118 zinc finger proteins.
Sheet 1: MS identification parameters; sheet 2: raw MS output; sheet 3: list of detected alternative proteins.
- https://doi.org/10.7554/eLife.27860.058
-
Supplementary file 7
High-confidence list of predicted functional alternative proteins based on conservation and expression analyses.
Sheet 1: high-confidence list in mammals; sheet 2: high-confidence list in in vertebrates.
- https://doi.org/10.7554/eLife.27860.059
-
Source code 1
Extraction of PhyloP scores.
- https://doi.org/10.7554/eLife.27860.060
-
Transparent reporting form
- https://doi.org/10.7554/eLife.27860.061
Download links
A two-part list of links to download the article, or parts of the article, in various formats.
Downloads (link to download the article as PDF)
Open citations (links to open the citations from this article in various online reference manager services)
Cite this article (links to download the citations from this article in formats compatible with various reference manager tools)
Deep transcriptome annotation enables the discovery and functional characterization of cryptic small proteins
eLife 6:e27860.
https://doi.org/10.7554/eLife.27860


