Akt regulation of glycolysis mediates bioenergetic stability in epithelial cells
- Harvard Medical School, United States
- Brigham and Women’s Hospital, United States
- University of California, United States
- Massachusetts Institute of Technology, United States
Figures
Figure 1 with 4 supplements
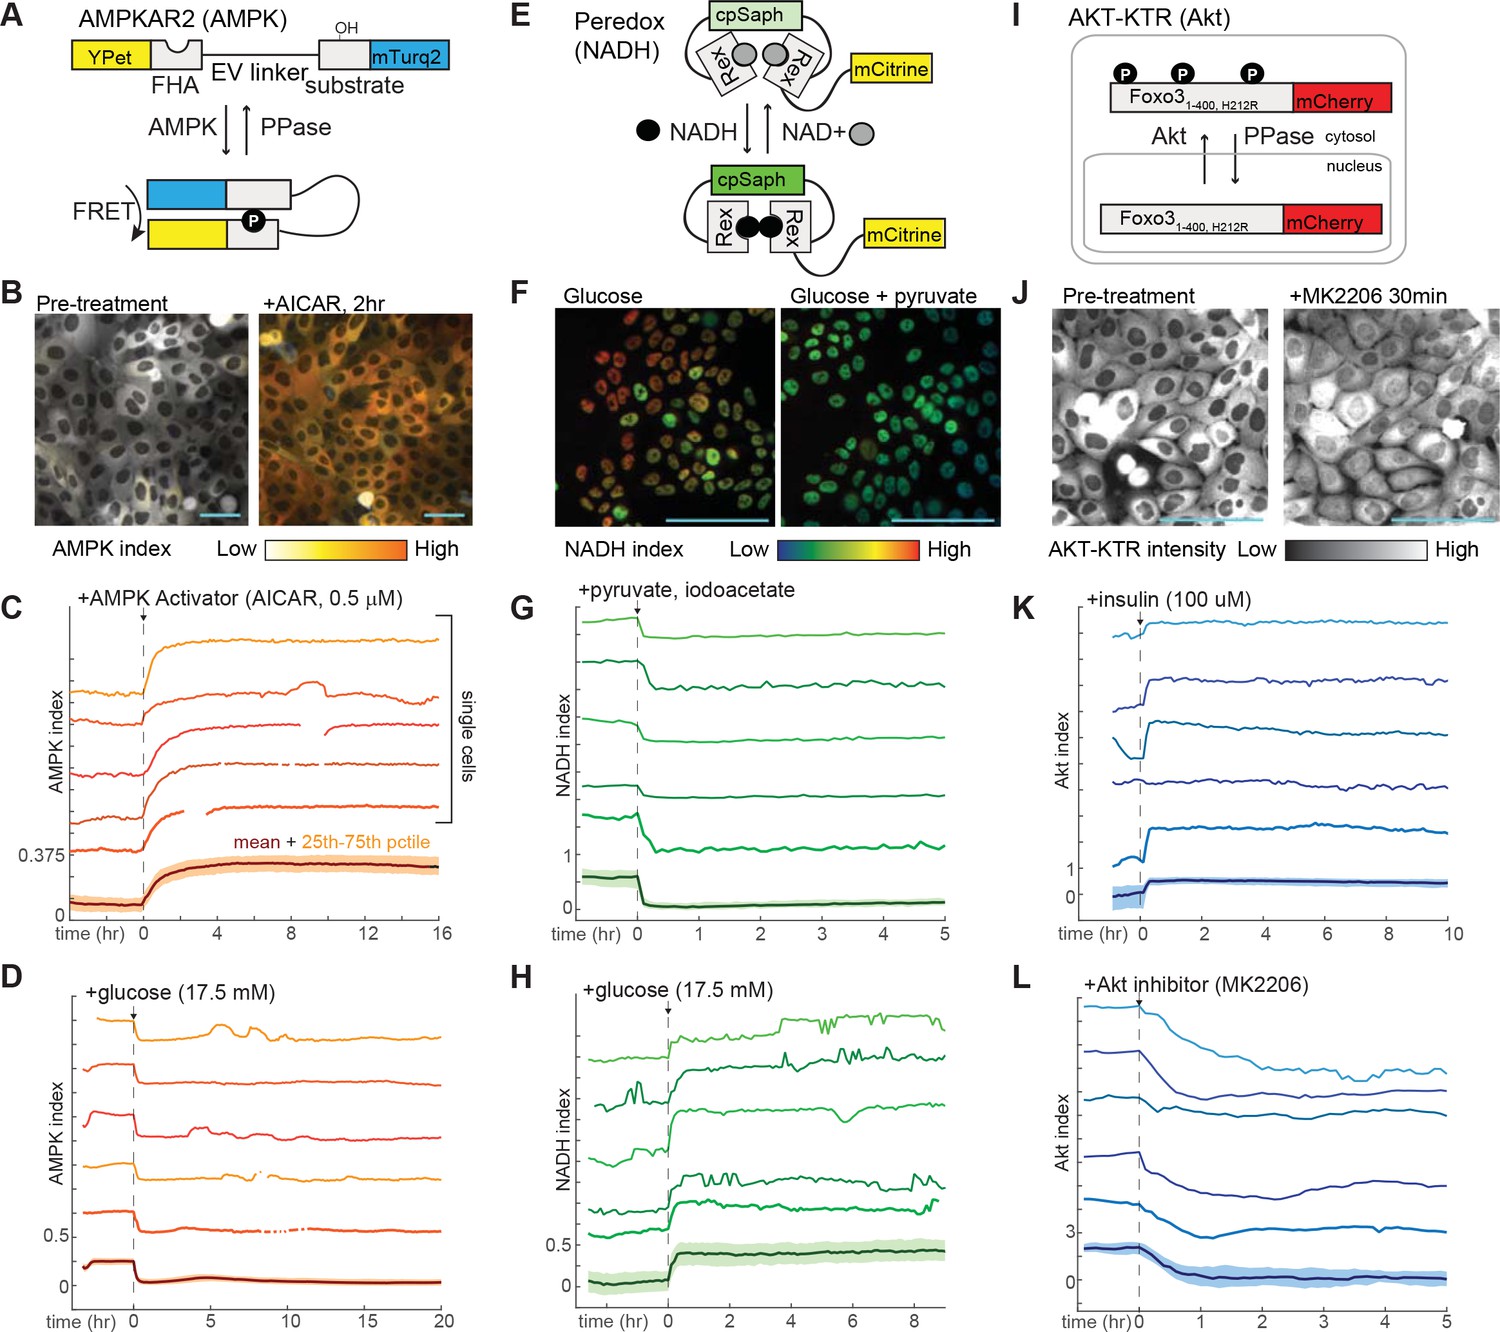
Design and validation of live-cell reporters for AMPK (A–D), cytosolic NADH/NAD+ ratio (E–H), and Akt kinase activity (I–L).
A,E, and I depict schematic diagrams for each of the reporters. B,F, and J show representative microscope images of MCF10A cells stably expressing each reporter. In images in B and F, reporter activity is represented as a pseudocolored image calculated as a ratio of the reporter components (see Materials and methods for details of calculations). C, D, G, H, K, and L display individual and aggregate cell data for the indicated treatments. For each panel, the bottom-most profile represents the mean measurement for a population of >200 cells; the colored region around the mean indicates the 25th to 75th percentile range for the population. The five traces above the mean plot depict five representative individual cells, plotted at the same scaling as the mean. The media used in each experiment (prior to the indicated additions) were as follows: C – iGM (imaging-modified growth medium; see Materials and methods); D – iGM lacking glucose; G – iGM2; H – iGM lacking glucose; K – iGM lacking insulin; L – iGM.
Figure 1—figure supplement 1
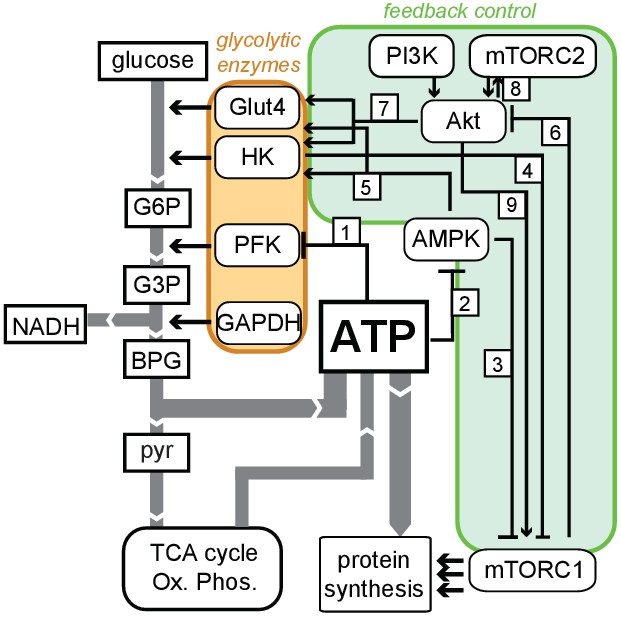
Schematic diagram of feedbacks connecting ATP production with glycolytic regulation.
Flux of metabolites (white rectangles) is indicated by gray arrows, and glycolytic enzymes controlling this flux are grouped in the orange region. Known feedback connections are enclosed in the green region. These connections include: (1) suppression of PFK1 activity by ATP; (2) suppression of AMPK activity by ATP; (3) suppression of mTORC1 activity by AMPK; (4) suppression of mTORC1 by hexokinase (HK) during periods of low-glucose flux; (5) stimulation of HK and Glut4 activity by AMPK; (6) inhibition of Akt by mTORC1; (7) stimulation of Glut4 and HK activity by Akt; (8) reciprocal positive regulation between Akt and mTORC2; and (9) activation of mTORC1 by Akt. The net effect of these feedback connections is to actively increase flux through glycolysis when ATP levels are low, as well as to actively suppress flux through glycolysis when ATP levels are high.
Figure 1—figure supplement 2

Measurements of AMPK and NADH indices under different nutrient conditions.
(A,B) AMPK index measurements in MCF10A cells cultured with various nutrients. Immediately prior to imaging, growth medium was replaced with iGM (see Materials and materials and methods) lacking pyruvate, glucose, and glutamine and supplemented with the indicated carbon sources. While long-term culture in the absence of all three nutrients led to cell death, measurements were possible for at least 5 hr. Mean and representative single cells are shown in (A). An overlay of the mean AMPK index for each condition, with the 25th to 75th percentile range shown only for the minimal condition to allow for clarity (B). (C) NADH index measurements in MCF10A cells cultured in the absence of pyruvate, glutamine, and serum, in the presence of the indicated glucose concentration.
Figure 1—figure supplement 3
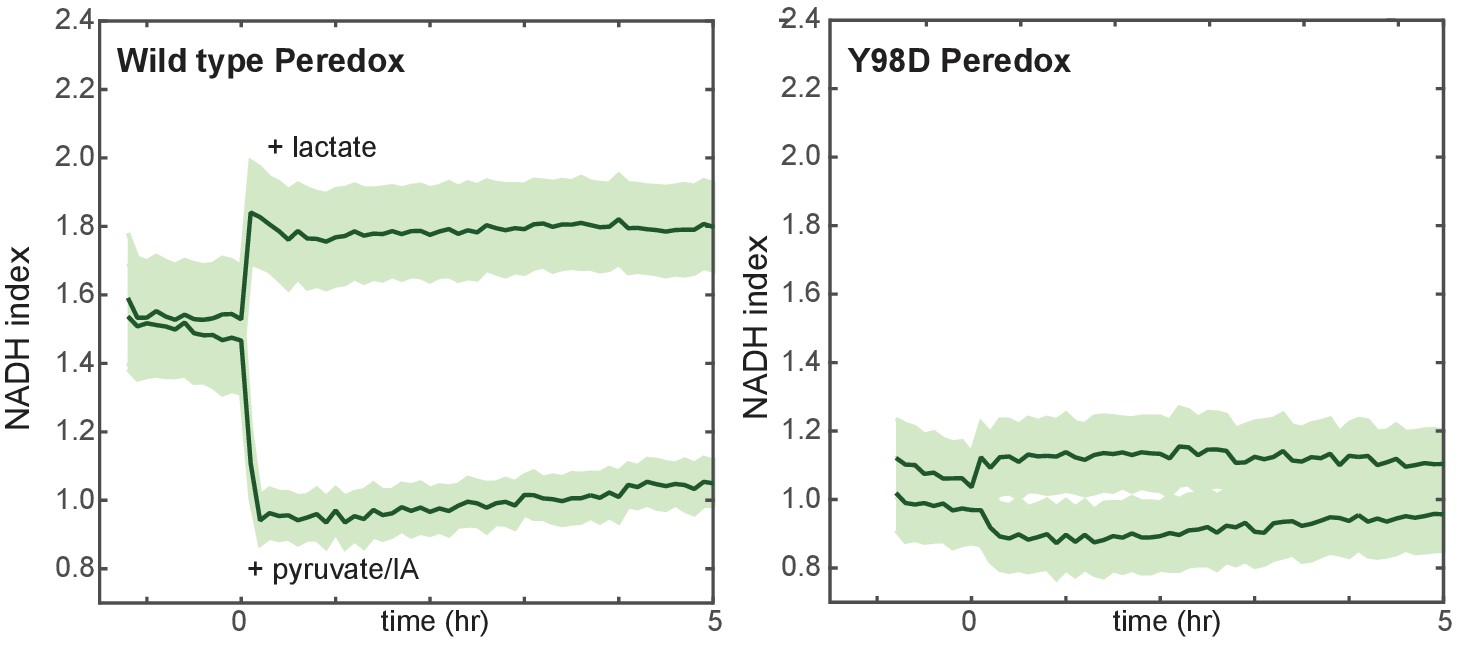
Lack of response of a mutant control NADH reporter to stimuli known to control cellular NADH levels.
MCF10A cells expressing Peredox (left) or mutant Y98D control reporter (right) were cultured in growth medium lacking pyruvate, and either lactate or a combination of pyruvate and IA were added at time 0. While the wild-type reporter signal is rapidly increased by lactate and decreased by pyruvate/IA (left), the control reporter with a Y98D mutation in the NADH-binding site of Peredox responds with greatly reduced magnitude.
Figure 1—figure supplement 4
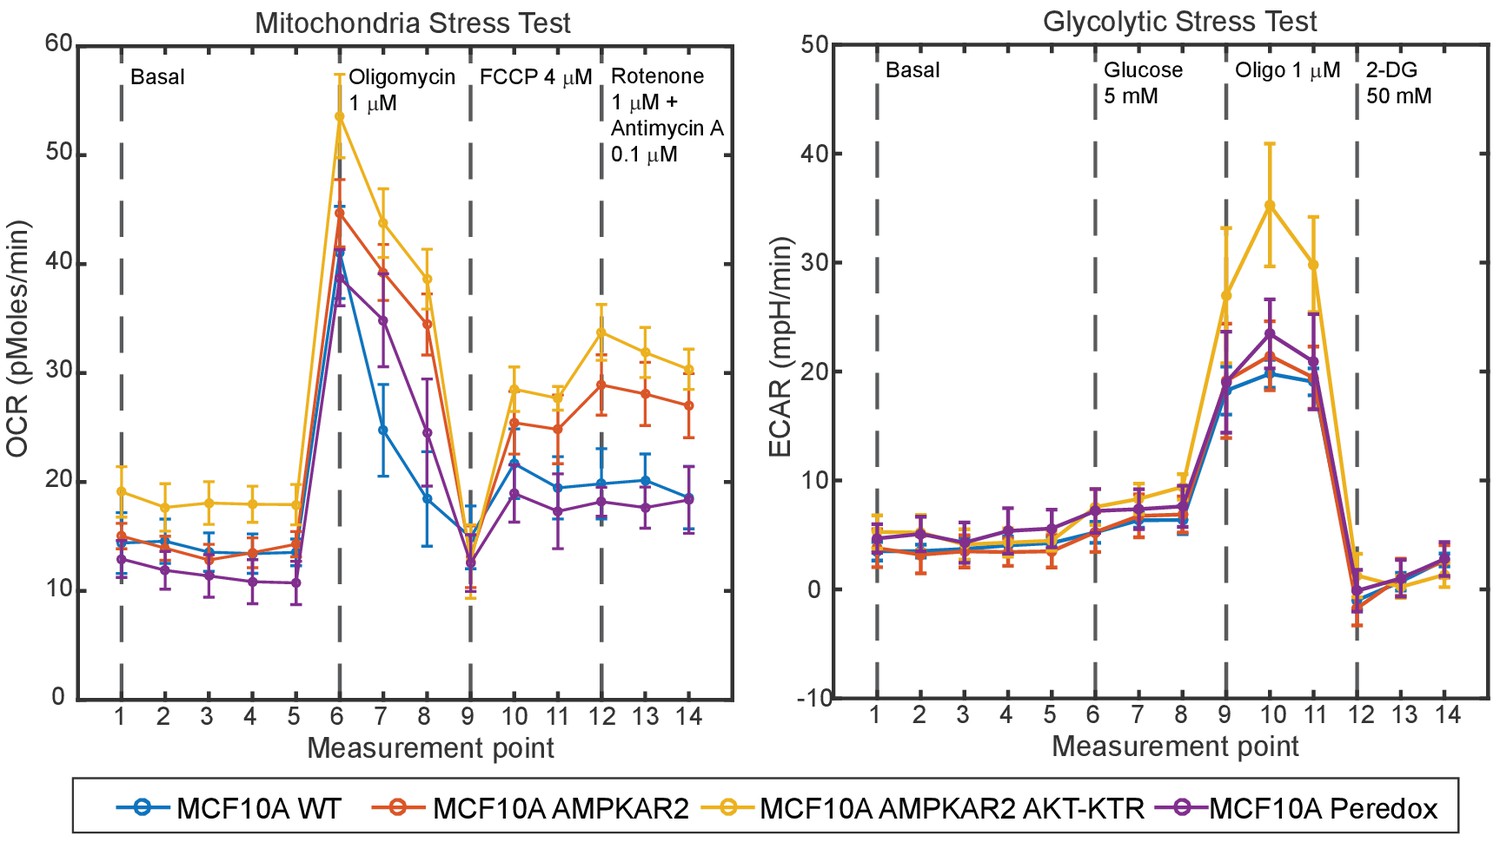
Comparison of metabolic properties of parental and reporter cell lines.
Untransfected MCF10A cells or the indicated reporter cell lines were analyzed by Seahorse XF to measure oxygen consumption rate (OCR) and extracellular acidification rate (ECAR) in response to addition of the indicated compounds (dashed lines). Data points indicate the mean, and error bars the standard deviation of 5 technical replicates. Measurement points occurred at 7 min intervals.
Figure 2 with 2 supplements
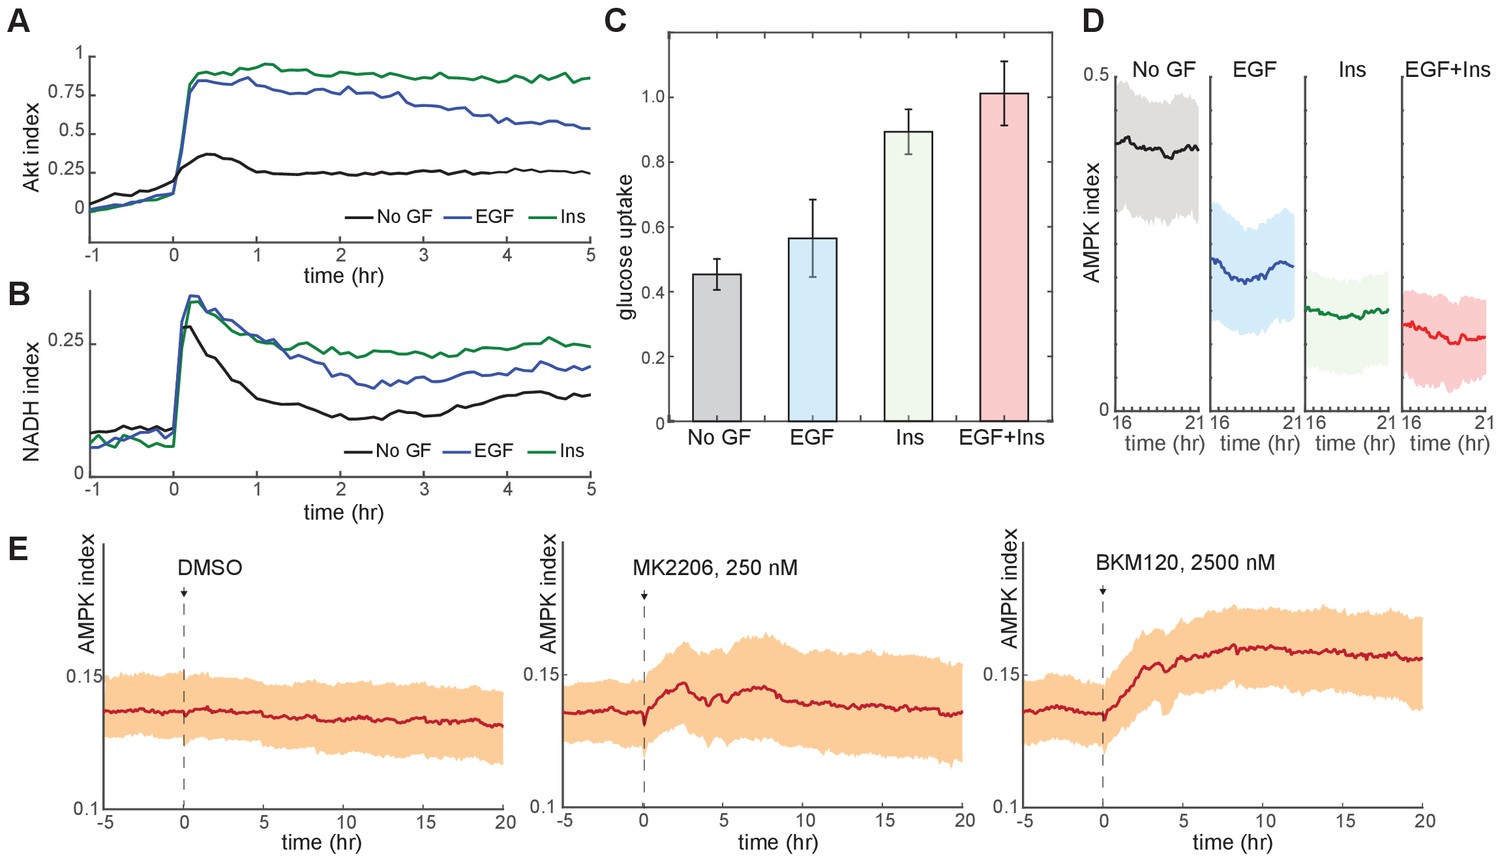
Glucose metabolism drives adaptation to the bioenergetic stress of proliferation.
(A) Mean Akt index, measured by AKT-KTR, following stimulation with EGF or insulin. Prior to imaging, cells were placed in medium lacking EGF or insulin. GFs were added at time 0. N = 4, combined. (B) Mean NADH index, measured by Peredox, following stimulation with EGF or insulin. Prior to imaging, cells were placed in medium lacking EGF or insulin. GFs were added at time 0. N = 4, combined. (C) Glucose uptake from culture medium by MCF10A cells. Glucose depletion from the medium was assayed immediately following a 2-hr period during which the cells were exposed to the indicated conditions. Glucose uptake is shown relative to EGF +insulin treated cells, to which other conditions were normalized. Bars represent the average, and error bars the standard deviation, of four independent clones measured in triplicate in one experiment; results are representative of 3 total experiments run on different days. (D) Mean and 25th-75th percentile AMPK index for cells treated as in (A), recorded between 16 and 21 hr following treatment. N = 5, representative. (E) Mean AMPK index measurements for MCF10A cells cultured in medium containing glucose, glutamine, and insulin and treated at time 0 with either DMSO, 250 nM MK2206, or 2.5 µM BKM120. N = 4, representative.
Figure 2—figure supplement 1

Changes in proliferation and metabolism under conditions affecting PI3K/Akt signaling.
(A) Proliferative index, calculated as the fraction of Geminin-mCherry-positive cells, monitored by live-cell microscopy in MCF10A cells under stimulation by the indicated GFs. Growth medium was iGM containing 3.4 mM glucose and 2.5 mM glutamine, and lacking pyruvate. (B) Decrease in glucose uptake upon PI3K/Akt inhibition. Glucose depletion from the medium was assayed immediately following a 2-hr period during which the cells were exposed to the indicated conditions. All measurements were made in the presence of EGF and insulin and are normalized to the DMSO condition. (C) Mean NADH index, measured by Peredox, following inhibition of the PI3K/Akt pathway. Prior to imaging, cells were placed in medium containing EGF and insulin. Inhibitors were added at time 0.
Figure 2—figure supplement 2
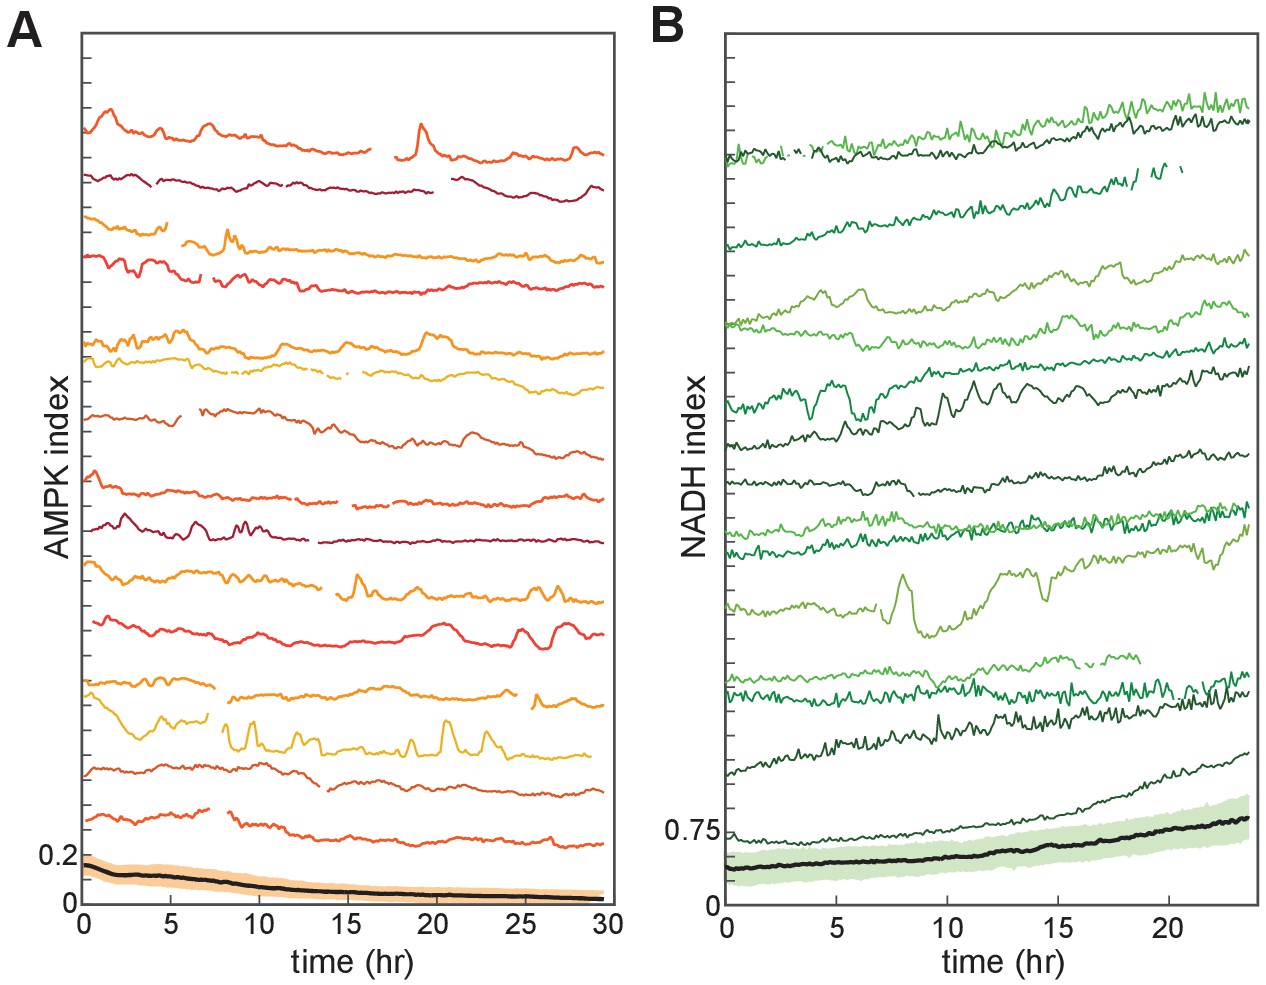
Single-cell variability in NADH and AMPK indices.
(A,B) MCF10A cells growing in iGM containing EGF and lacking insulin. Fifteen randomly selected individual cell traces and the population mean (bottom) are shown for each reporter, displaying sporadic peaks and fluctuations within individual cells.
Figure 3 with 5 supplements
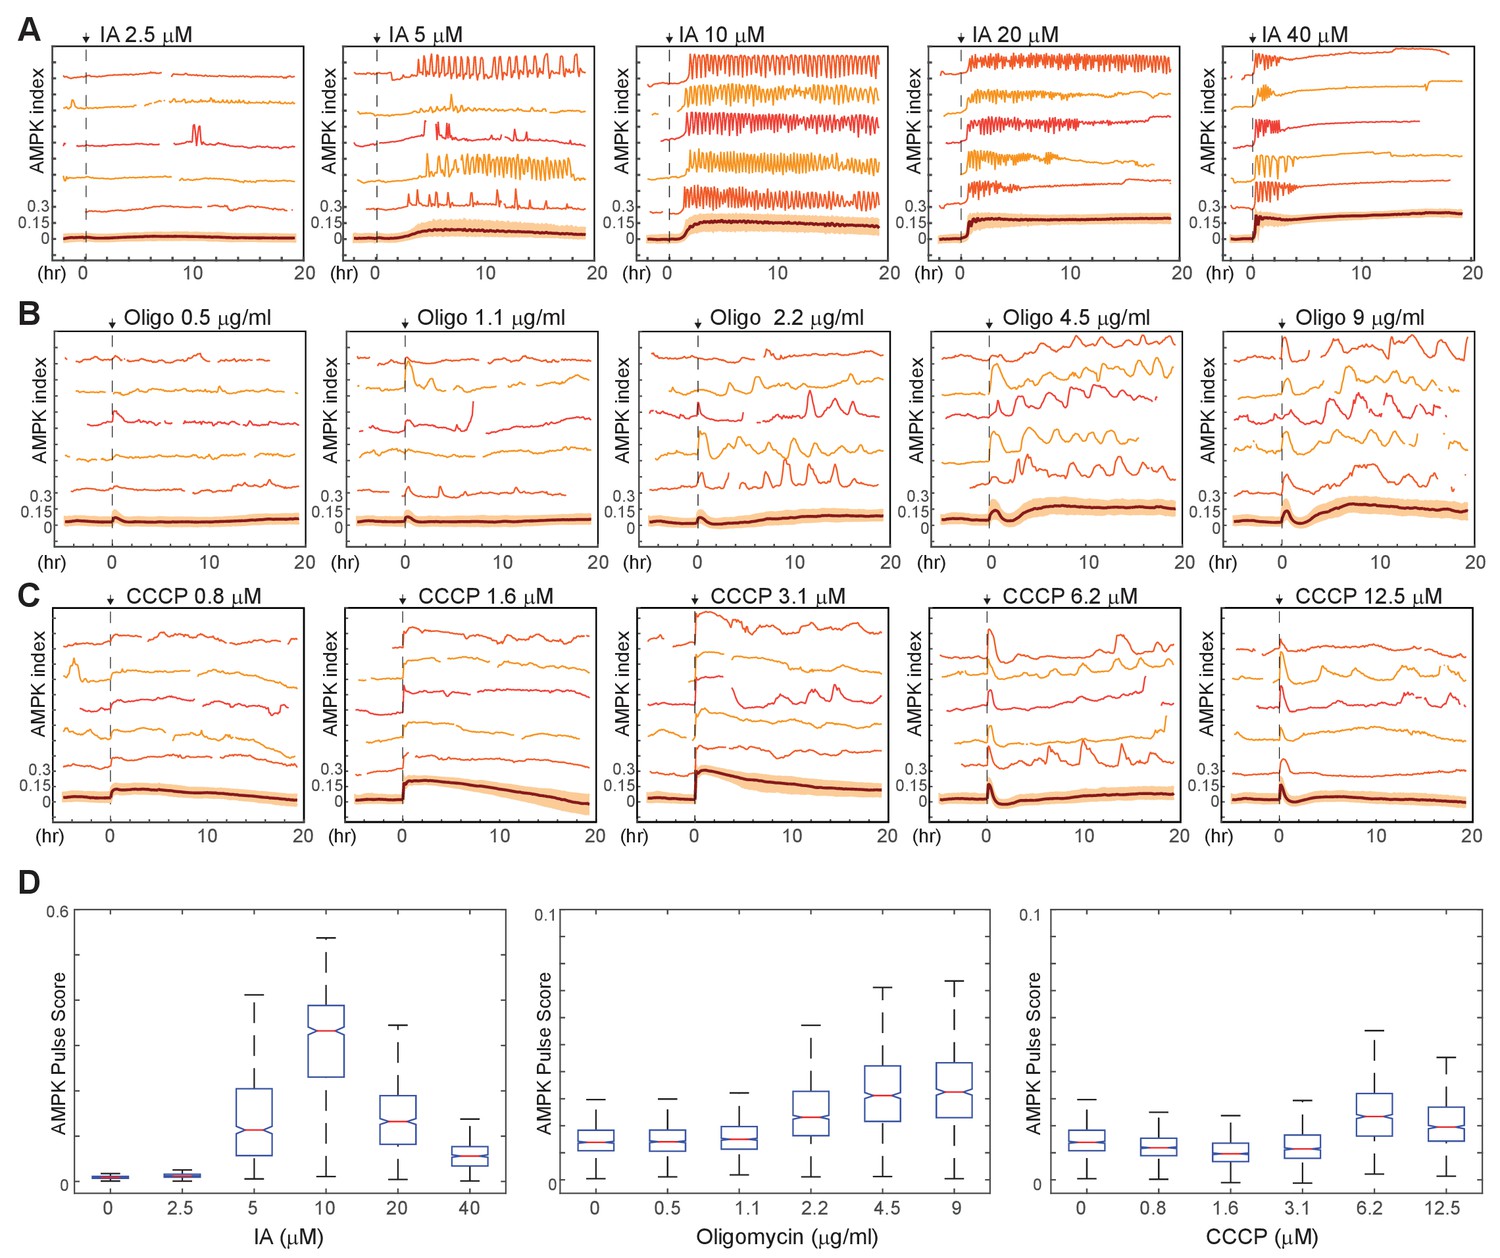
Kinetics of AMPK response to chemically induced metabolic stresses.
(A–C) Prior to imaging, MCF10A-AMPKAR2 cells were placed in iGM, and were then treated during imaging at time 0 with various concentrations of IA (A), oligomycin A (B), or CCCP (C). Mean and representative single-cell traces are shown as in Figure 1. N = 3, representative. (D) Fluctuation scores for each of the conditions shown in (A-C), calculated as described in the Materials and methods section. Scores were calculated for the period beginning 1 hr after treatment (to exclude the initial peak) and continuing through the end of the experiment.
Figure 3—figure supplement 1
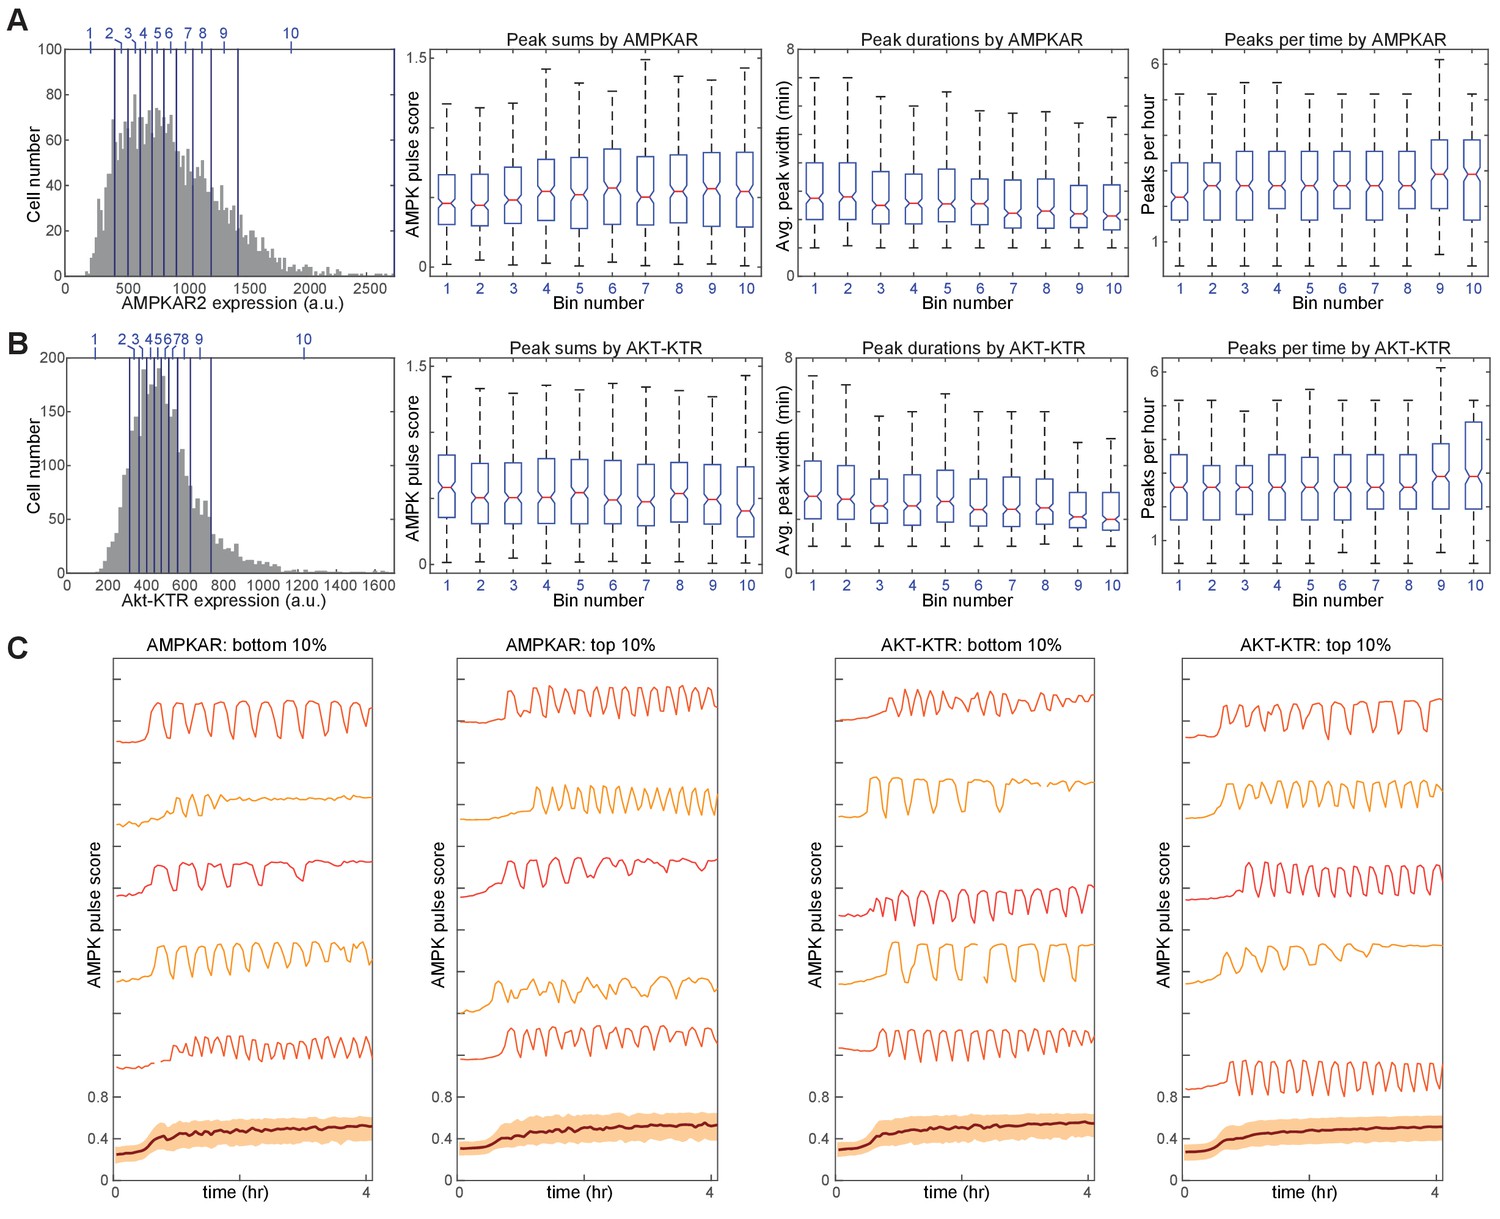
Comparison of drug-induced kinetics as a function of reporter expression.
MCF10A-AMPKAR2-AktKTR cells were treated with 10 μM IA and imaged at 3 min intervals. A-B. Data from 3310 individual cells were sorted by either AMPKAR2 expression level (A) or Akt-KTR expression level (B) and divided into bins representing 10 percentile point ranges (shown by blue vertical lines and numbers on the histograms in the left panels). Pulse parameters, including number of pulses per hour, average pulse duration, and sum of pulse amplitudes, were calculated for each cell, and distributions for these metrics are plotted as box plots for the cells within each bin. C. Representative AMPKAR2 traces of individual cells, within the lowest and highest 10 percentile bins, of reporter expression level for either AMPKAR2 or Akt-KTR following treatment with 10 μM IA.
Figure 3—figure supplement 2
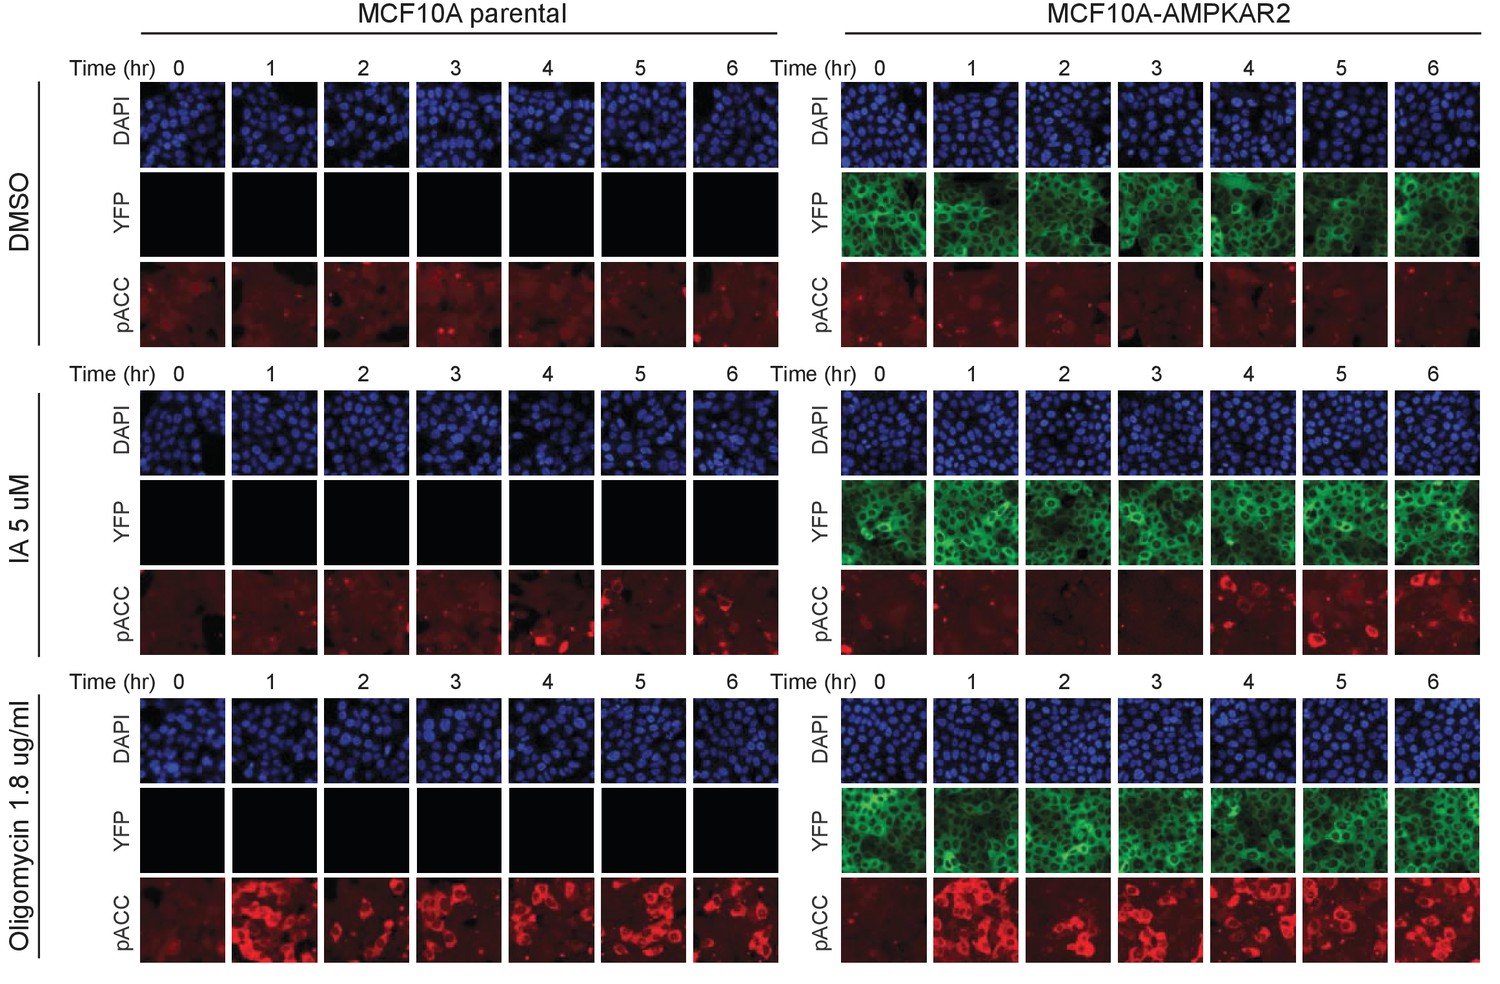
Comparison of drug-induced AMPK signaling in parental and reporter-expressing cells by immunofluorescence.
The indicated treatments were added to cells, and at the indicated times, cells were fixed, permeabilized, and stained using a phospho-ACC antibody. At later time points, we observe cells with both very strong and very weak pACC staining, which is the expected result if cells are undergoing asynchronous high-amplitude oscillations.
Figure 3—figure supplement 3
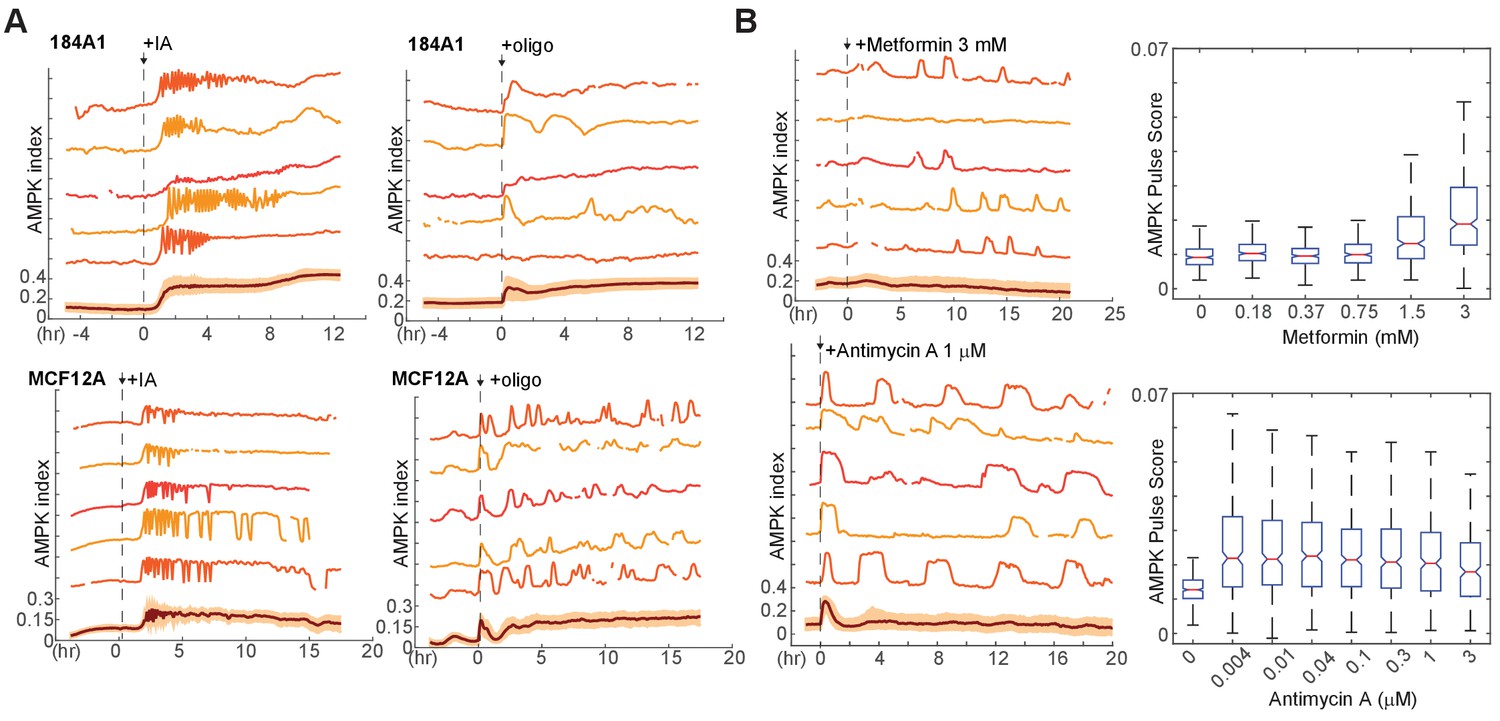
AMPK index responses to other electron transport chain inhibitors and in other cell lines.
(A) Representative single-cell measurements of 184A1 and MCF12A mammary epithelial cells stably expressing AMPKAR2 and treated with 10 μM IA or 9 μg/ml oligomycin at the indicated times. (B) MCF10A-AMPKAR cells were cultured in iGM and treated with metformin or antimycin A at the indicated concentrations. Representative single-cell measurements (left) and pulse analysis for dose curves (right) are shown.
Figure 3—figure supplement 4
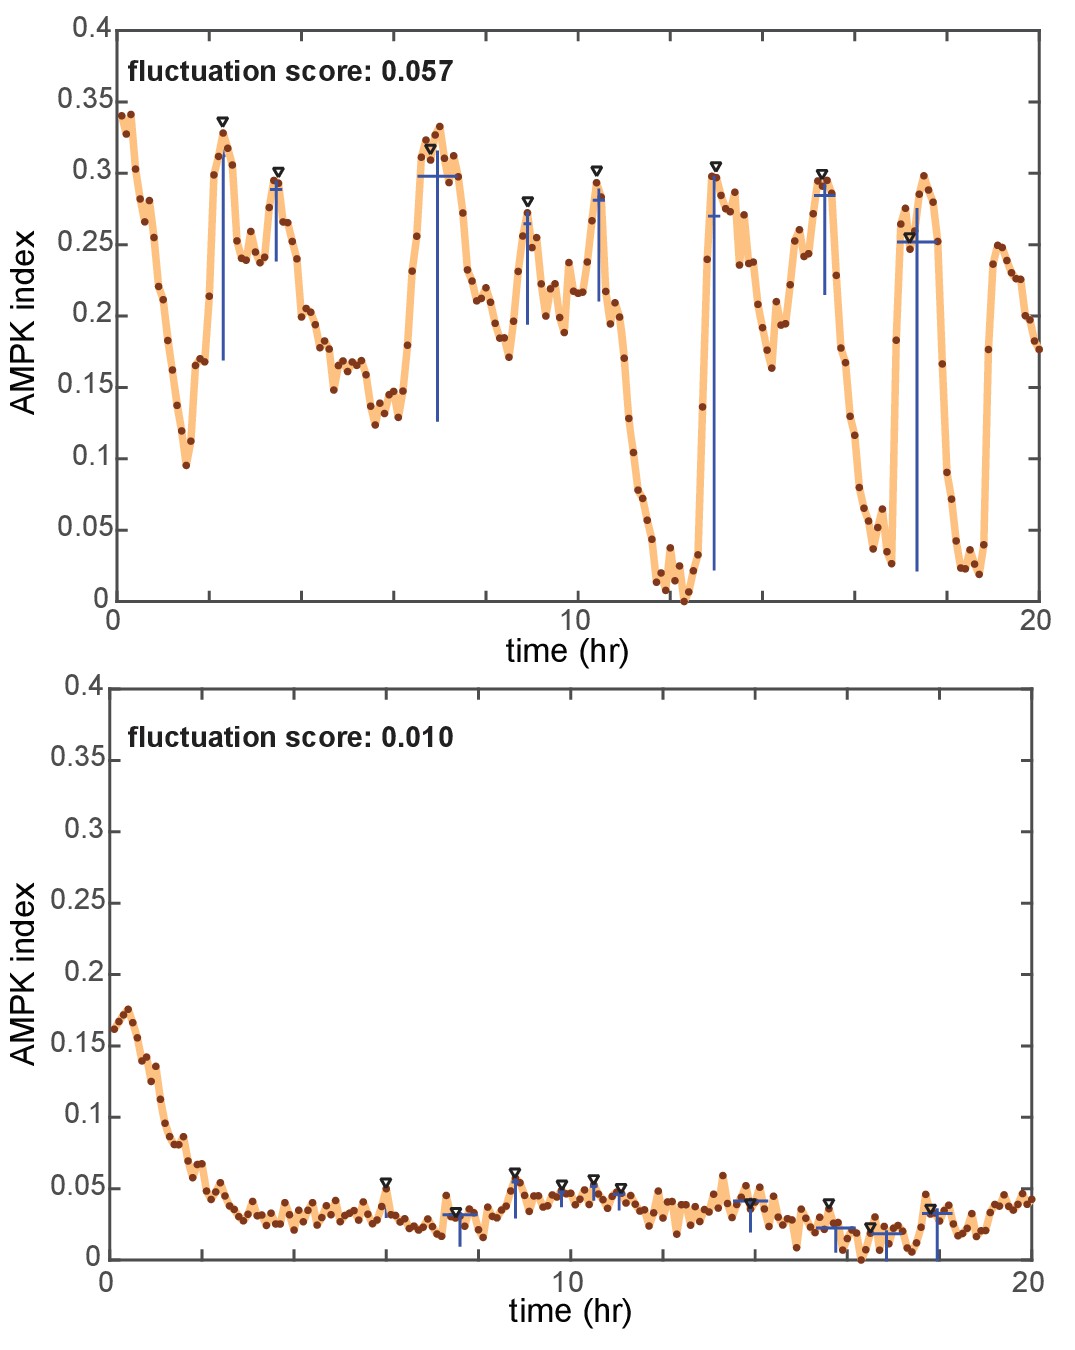
Identification of peaks and quantification of fluctuation trends in time-dependent reporter signals.
AMPK index measurements from two cells are shown as examples (top: a combination of EGF and oligomycin, bottom: insulin). Peaks in each signal identified by an automated peak-finding algorithm (described in detail in the Materials and methods section) are denoted by black triangles. Blue lines below each peak indicate the detected amplitude and duration for each peak. The pulse score for each cell is calculated by summing the amplitude for all peaks during the time period of measurement, and then dividing by the length of the time period in hours.
Figure 3—figure supplement 5
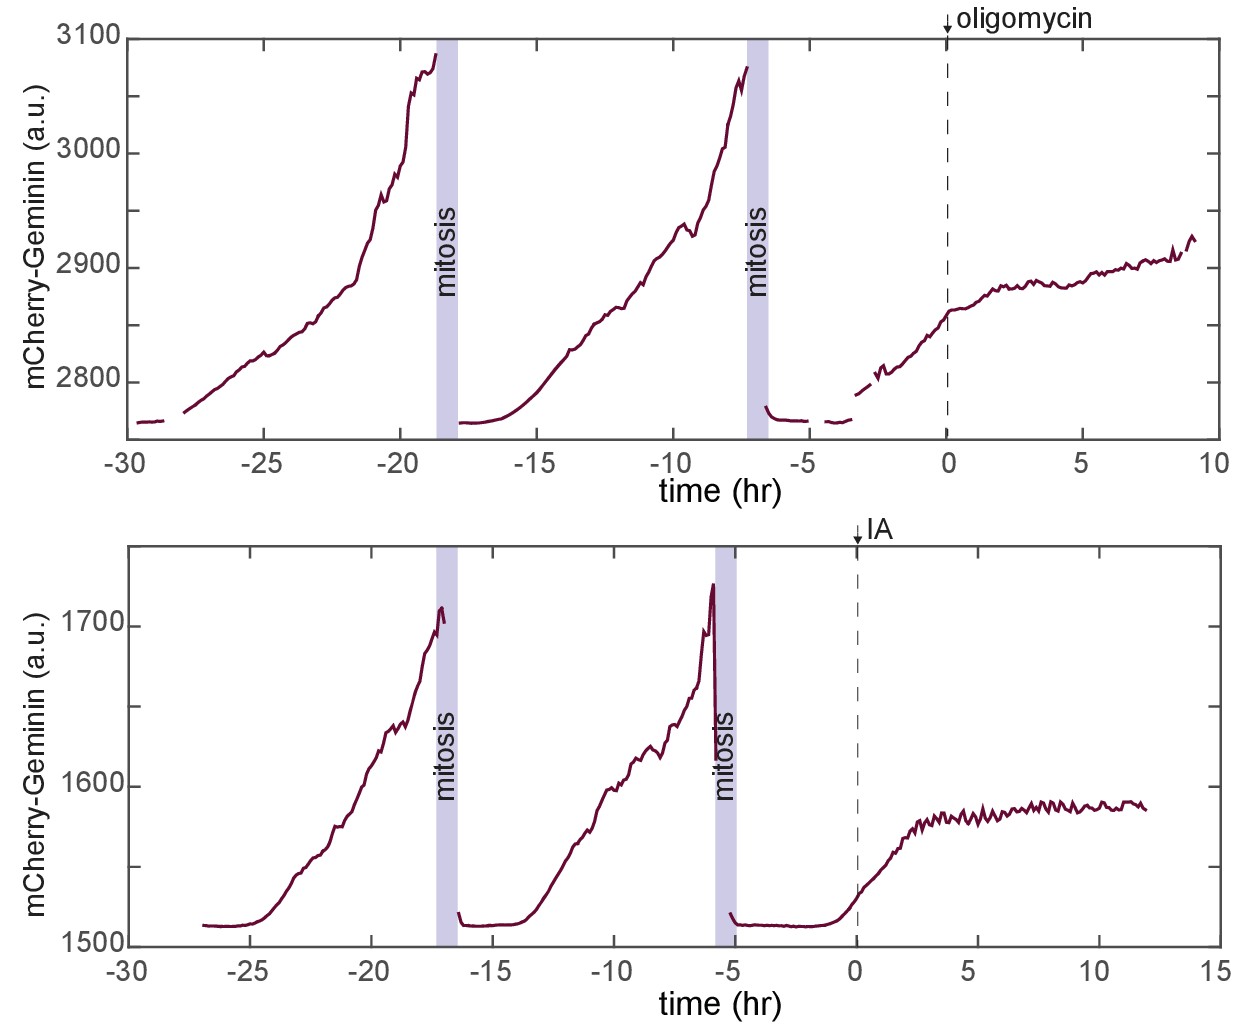
Cell cycle responses during treatment with metabolic challenges.
Representative traces for mCherry-Geminin fluorescence in individual cells first cultured in iGM and then treated either with oligomycin (top) or IA (bottom). In both cases, the imaged cell has progressed through two normal cell cycles prior to the time of treatment and has entered a third cell cycle prior to the time of treatment. In each case, cell cycle progression slows following drug treatment. In IA-treated cells, nearly all cells showing this form of arrest never complete mitosis before dying, while some oligomycin-treated cells do reach mitosis following the delay (Video 4).
Figure 4 with 4 supplements
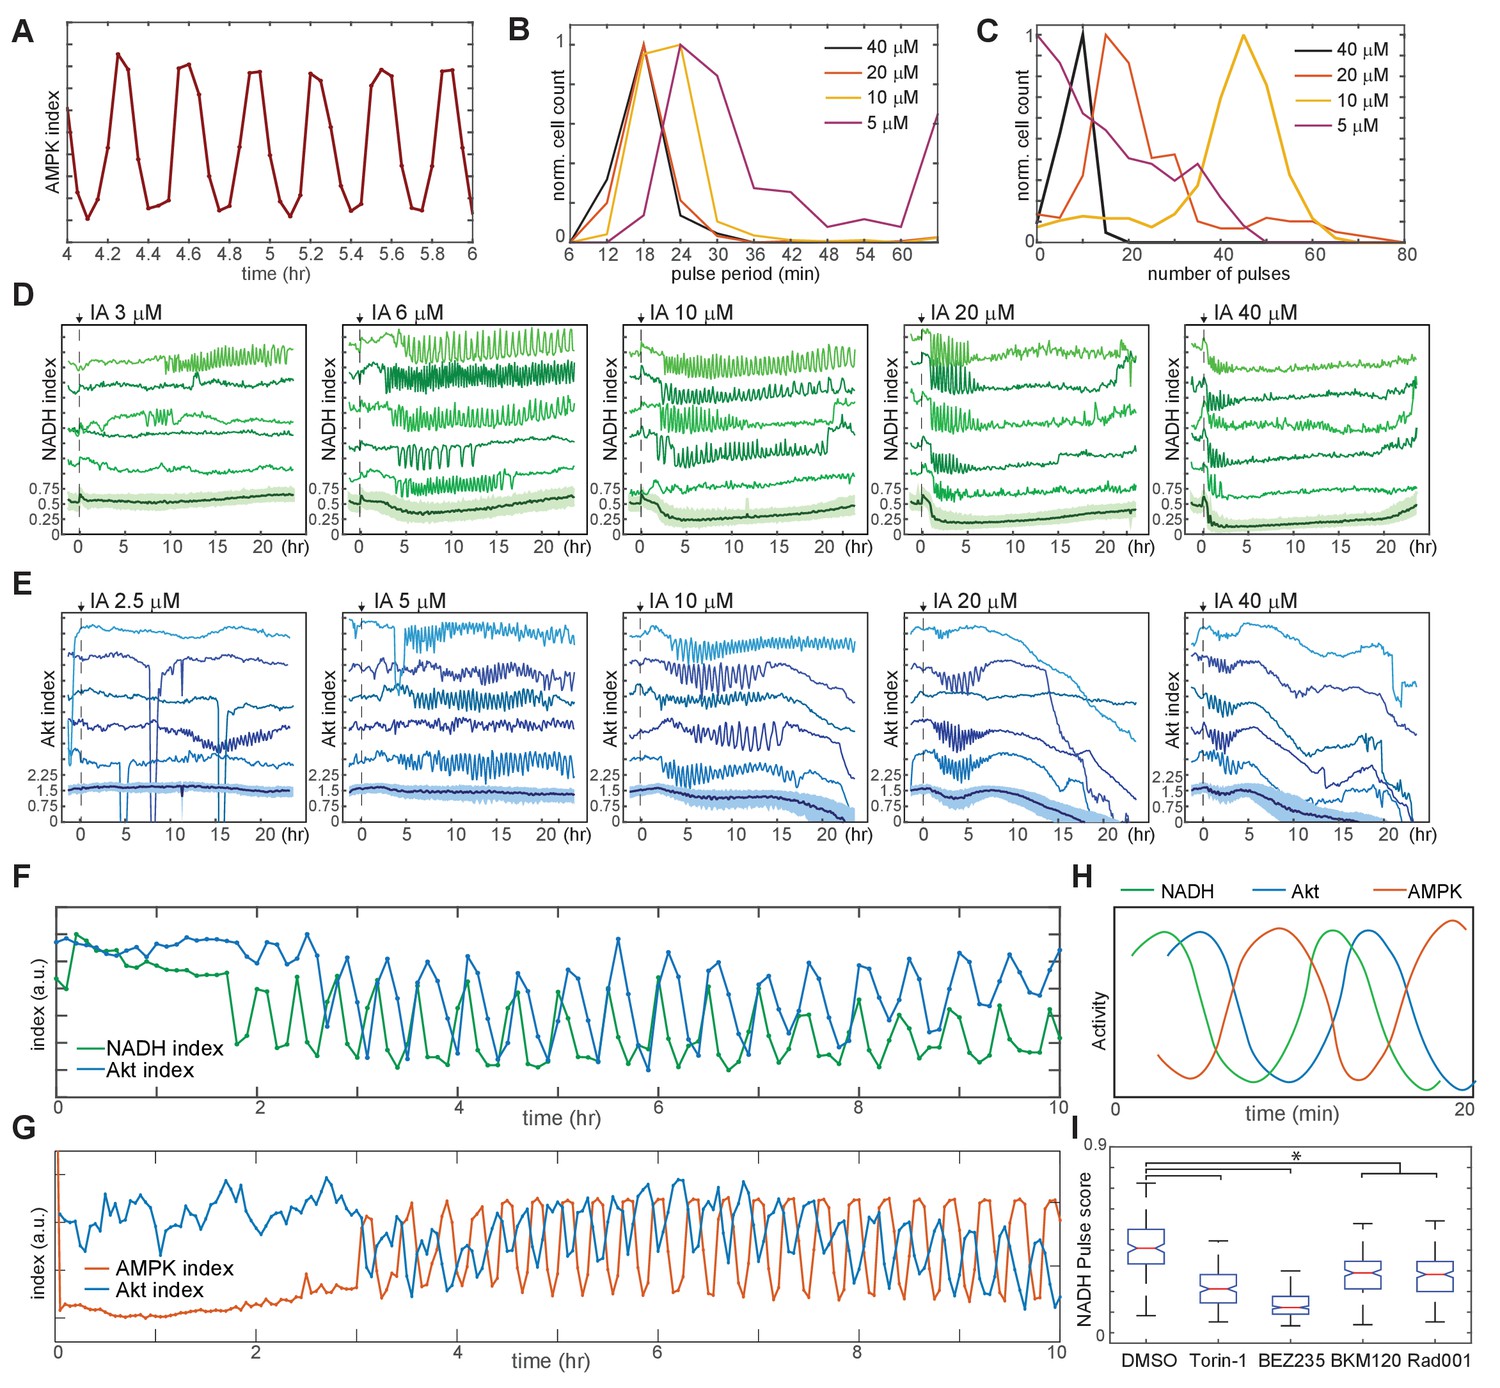
Linked oscillations in AMPK, Akt, and NADH indices triggered by inhibition of glycolysis.
(A) Expanded view of a representative region of oscillatory AMPK index for cells cultured in iGM and treated with 10 µM IA. (B) Distribution of the average period of AMPK pulses for cells with five or more pulses, calculated as average peak-to-peak spacing following IA treatment as shown in Figure 3A. Distributions represent measurements of >500 cells under each condition. (C) Distribution of the number of pulses in AMPK index in each cell following IA treatment, measured as the largest series of detectable pulses spaced by 1 hr or less. (D, E) Single-cell measurements of NADH index (D) and Akt index (E) for the indicated concentrations of IA. Imaging medium was iGM lacking pyruvate, with IA added at time 0. N = 4, combined. (F, G) Simultaneous measurements of NADH and Akt indices (F) or AMPK and Akt indices (G) within the same cell. MCF10A cells expressing dual reporters were cultured and treated with 10 μM IA as in Figures 4D and 3A, respectively. Cells shown were manually selected to best represent the phase relationship visible in the majority of cells. (H) Diagram of approximate phase relationship between NADH, AMPK, and Akt indices derived from the data collected in (F) and (G). (I) Pulse analysis of NADH index in IA-treated cells in response to inhibitors of PI3K/mTOR signaling. N = 3–4, representative. Statistical significance was determined as described in the Materials and methods section; all inhibitor conditions differed significantly from the DMSO condition, while Torin-1 (250 nM), BMK120 (250 nM), and Rad001 (20 nM) were significantly different from BEZ235 (250 nM).
Figure 4—figure supplement 1
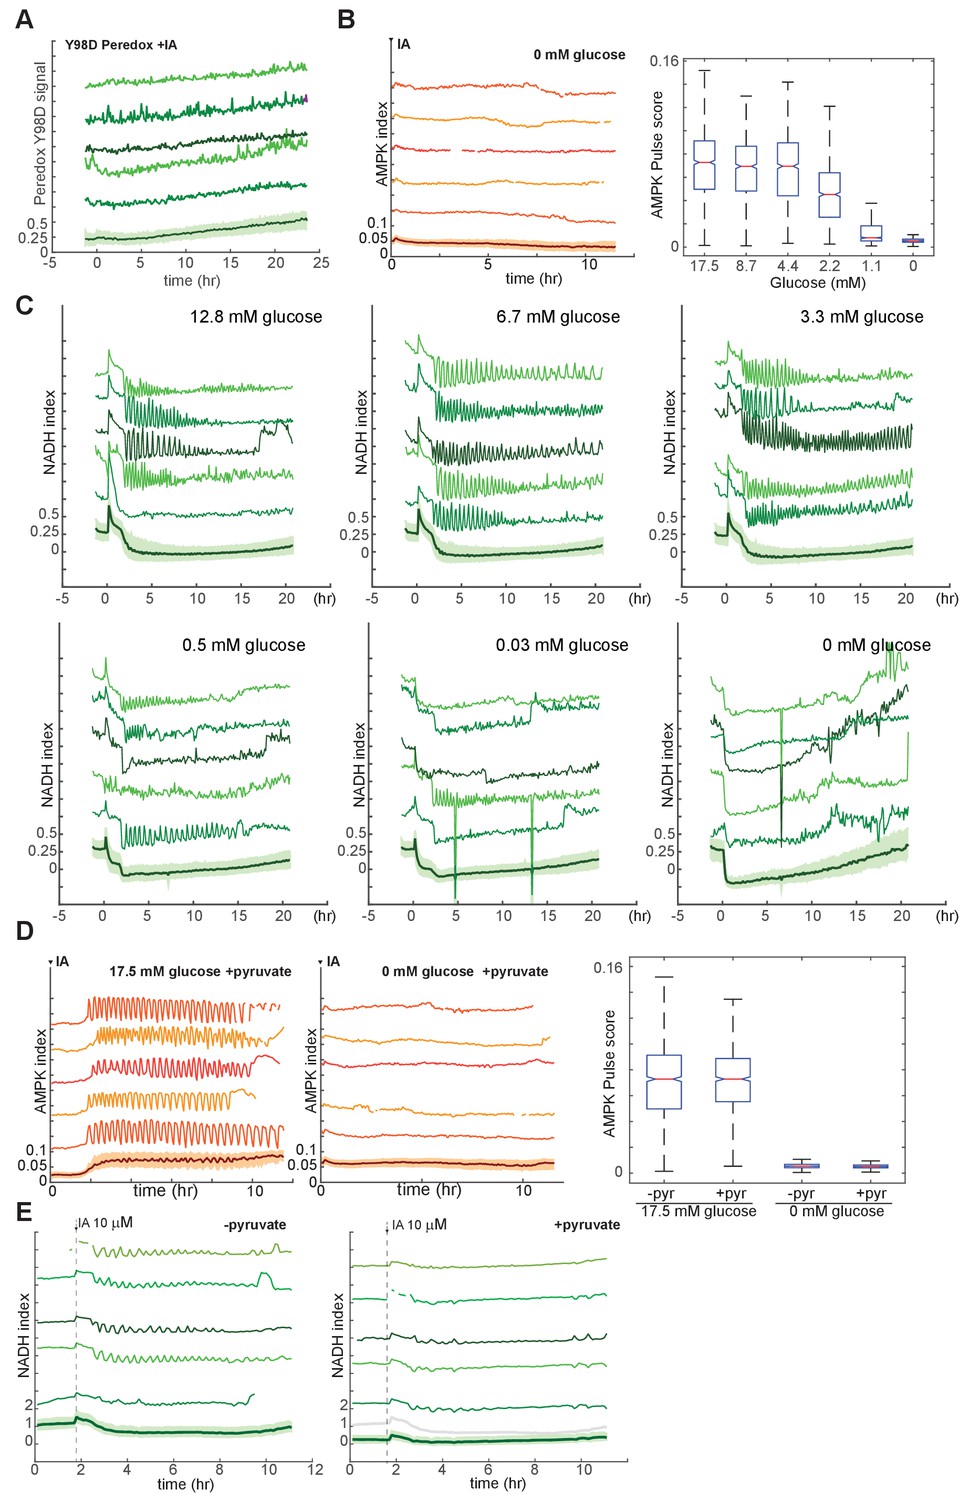
Analysis of conditions required for IA-induced metabolic oscillations.
(A) Lack of IA-induced oscillations in mutant Peredox Y98D control reporter. MCF10A cells expressing the binding site mutant NADH reporter were treated at time 0 with 10 μM IA in the presence of glucose (see Figure 4D for the corresponding response of the wild-type reporter). With the mutant reporter, regular oscillations cannot be detected, indicating that fluctuations in NADH, and not other cellular changes affecting reporter fluorescence, are responsible for the observed oscillations in Peredox signal. (B) Sensitivity of IA-induced AMPK index oscillations to glucose concentration. MCF10A cells expressing the AMPKAR2 reporter were cultured in the presence of glutamine and the indicated concentrations of glucose, treated with 10 µM IA at time 0. Pulse quantification is shown at right. (C) Sensitivity of IA-induced NADH index oscillations to glucose concentration. MCF10A cells expressing the Peredox reporter were cultured in the absence of pyruvate and presence of glutamine and the indicated concentrations of glucose, treated with 10 µM IA at time 0. (D) Insensitivity of IA-induced AMPK index oscillations to pyruvate. MCF10A cells expressing AMPKAR2 were treated with 10 µM IA in the presence of glucose and pyruvate (left) or pyruvate alone (right). Pulse quantification is shown on the right, indicating that pyruvate does not alter oscillation behavior in the presence of glucose and does not provide fuel for oscillations in the absence of glucose. (E) Absence of detectable NADH oscillations in the presence of high pyruvate concentration. MCF10A cells expressing Peredox were treated with 10 µM IA in the absence (left) or presence (right) of 50 mM pyruvate. The baseline NADH index is reduced in pyruvate-exposed cells (gray line in right plot-bottom shows mean NADH index in the absence of pyruvate for comparison), and IA-induced oscillations are not detectable (right).
Figure 4—figure supplement 2
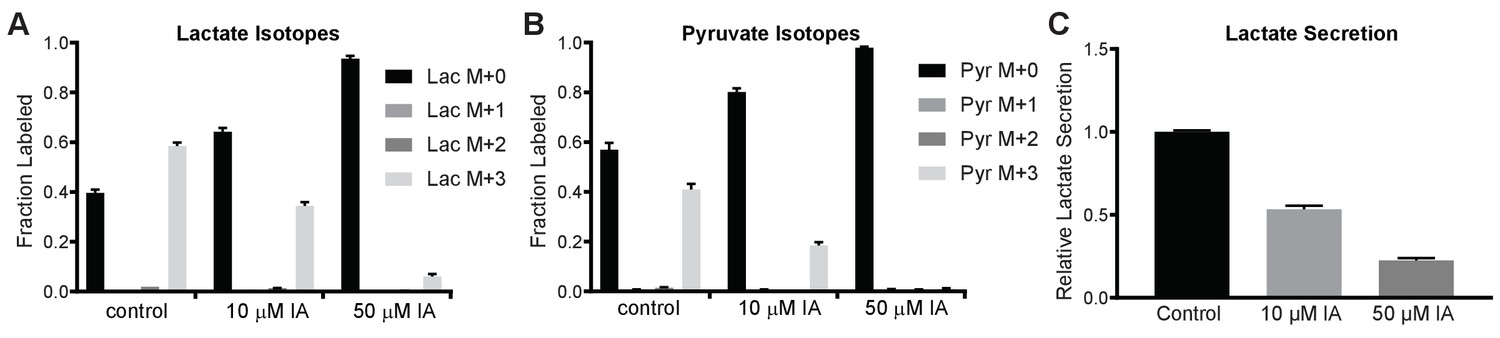
Quantitative analysis of residual glycolytic flux in IA-treated MCF10A cells.
(A, B) MCF10A cells were cultured in the presence of uniformly C13-labeled glucose and treated with the indicated concentrations of IA for 6 hr before metabolite extraction and analysis by GC-MS. Relative amounts of pyruvate and lactate are shown as the average of three technical replicates; results are representative of two independent experiments. (C) MCF10A cells were cultured in the presence of 0, 10, or 50 µM IA for 6 hr, after which the culture medium was analyzed for lactate concentration normalized to total protein content and presented as relative to the control with 0 µM IA treatment.
Figure 4—figure supplement 3

Effects of additional growth factor and fatty acid metabolism perturbations on IA-induced oscillations.
(A) Pulse analysis of AMPK index in cells treated with 10 µM IA in the presence of the indicated GFs. (B) Representative single cell traces from MCF10A-AMPKAR2 cells treated with 10 µM IA in the absence or presence of 80 μM of the fatty acid synthase inhibitor etomoxir. Relative to control, oscillations in etomoxir-treated cells begin sooner but persist for a shorter duration.
Figure 4—figure supplement 4

Proposed model of mechanisms underlying IA-induced oscillations.
(A) Inferred relationship between ATP, NADH, AMPK activity, and Akt activity during oscillations. ATP is shown as the inverse of AMPK signal, indicating a phase shift relative to NADH (as measured by Peredox). This shifted relationship may contribute to the induction of oscillations, which often result from feedback in the presence of a delay. (B) Model for oscillations in glycolysis and signaling upon inhibition of GAPDH by IA. Rectangles indicate pools of metabolites, with the cellular concentration of the pool indicated by the intensity of blue coloring (blue high, white low). Flux between pools is indicated by gray arrows, with rate of flux indicated by the width of the arrow. In state (0), cells in the presence of insulin and glucose operate at a high level of glycolytic flux and ATP levels are high. Upon IA treatment (1), flux from upper glycolysis (UG) to lower glycolysis (LG) is reduced, and ATP levels begin to fall. (2) Low ATP levels stimulate multiple positive feedback regulators of flux to UG (see Figure 1—figure supplement 1). (3) Positive feedback drives an increase in the availability of glucose and UG metabolites; the decrease in Akt activity during this phase may be due to relief of mTOR inhibition by flux through HK (connection #4 in Figure 1—figure supplement 1), leading to negative feedback inhibition of Akt (connection #6 in Figure 1—figure supplement 1). (4) High levels of UG increase the levels of LG metabolites, overcoming the partial inhibition of flux imposed by IA; ATP levels rise, and net feedback switches from positive to negative. (5) Reduction of glycolytic flux leads to a relaxation of the levels of glycolytic metabolites; negative feedback deactivates. In a normal (non-IA-inhibited) state, this level of flux would be sufficient to maintain ATP levels, and the cell would return to a normal state (0). However, since IA remains present, flux from UG to LG is again inhibited and the cell returns to state (1), beginning a new repetition of the cycle.
Figure 5 with 2 supplements
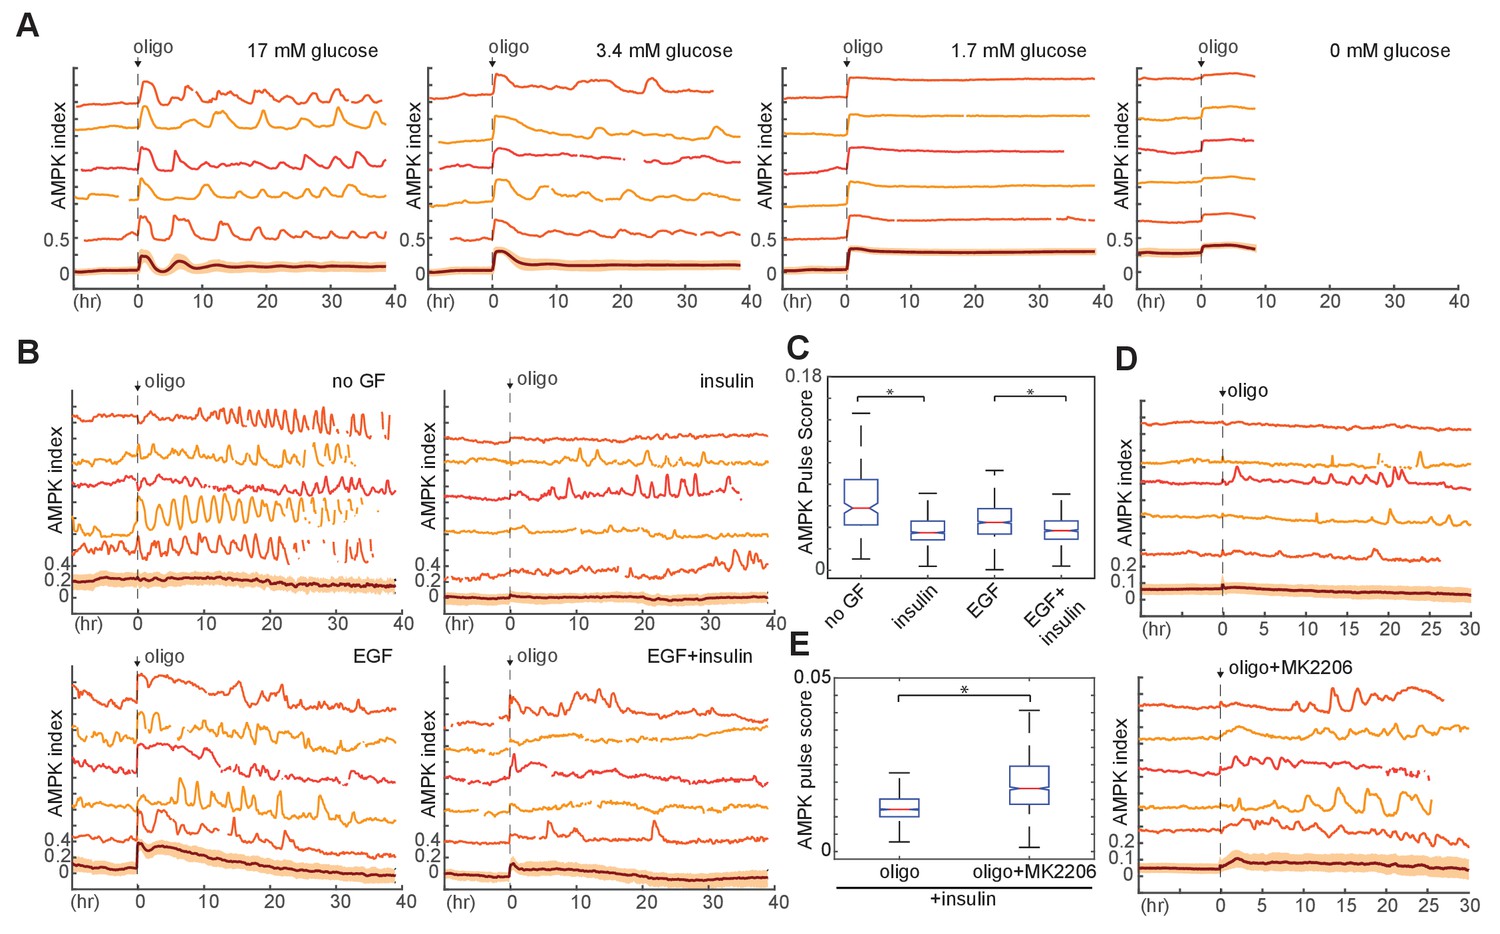
Requirement of glucose and glycolytic metabolism for AMPK fluctuations.
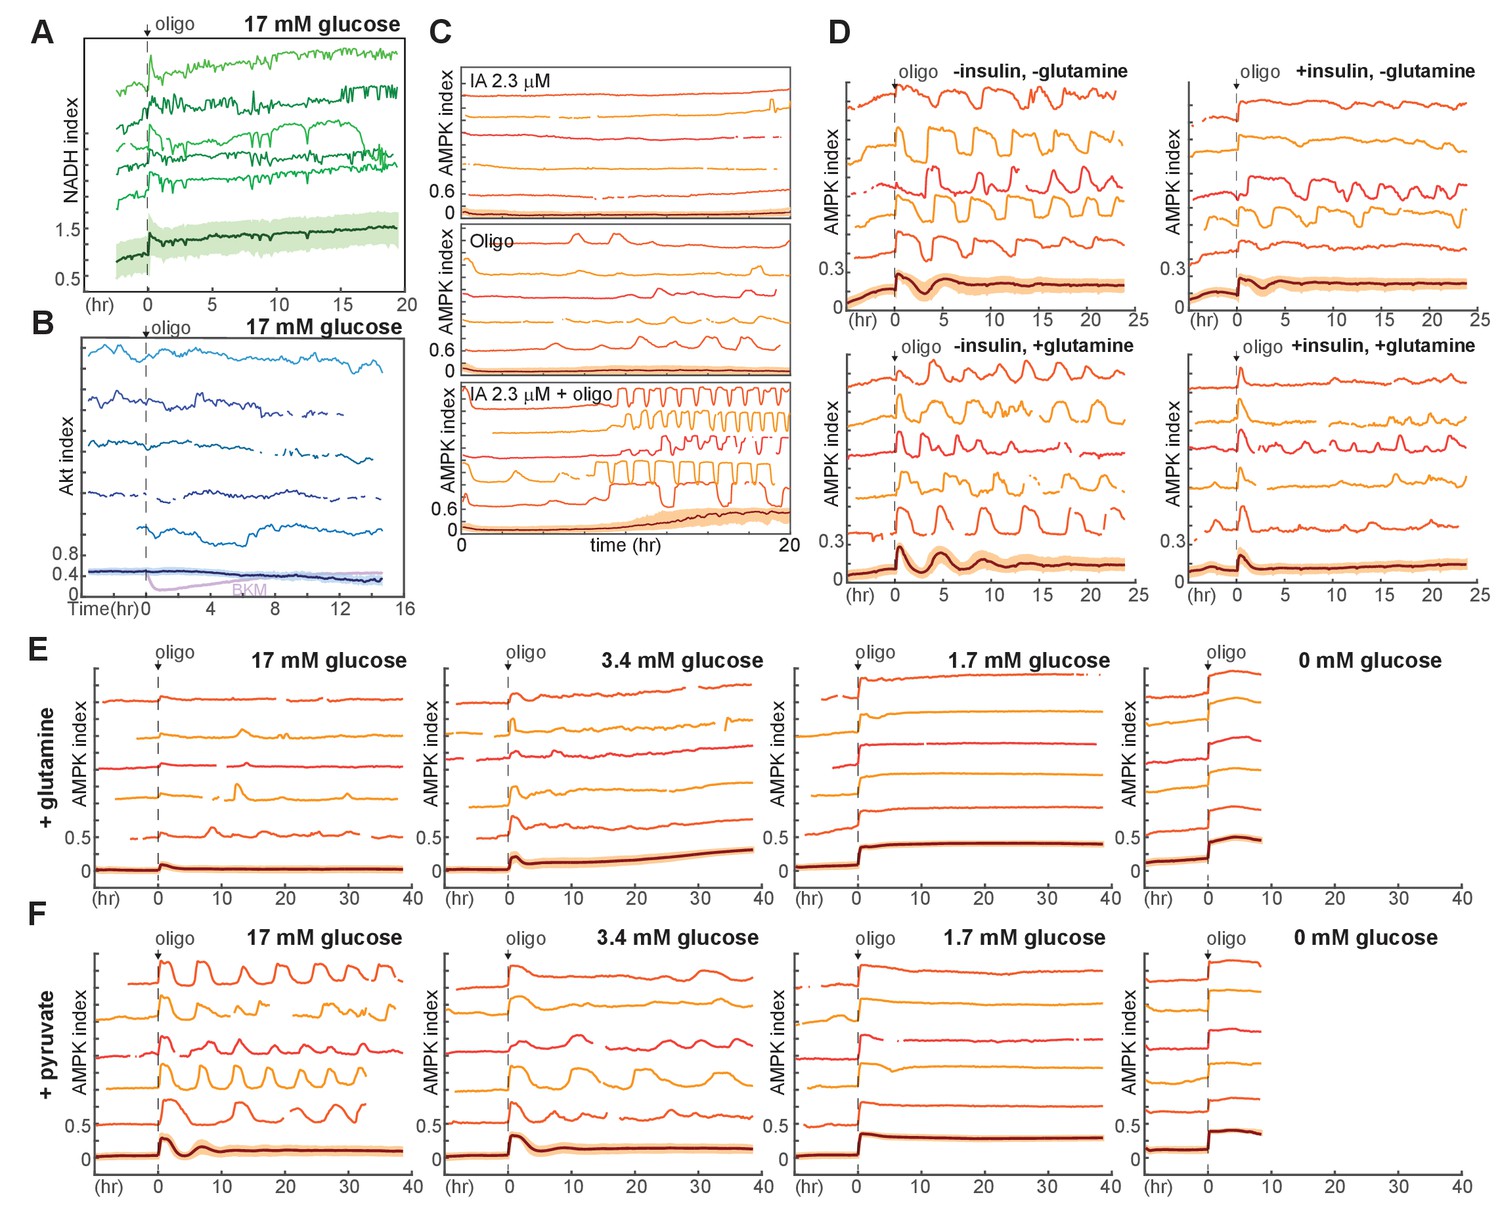
(A) Single-cell measurements of AMPK index in MCF10A cells in response to oligomycin at different glucose concentrations. Prior to imaging, cells were placed in iGM lacking pyruvate and glutamine at different glucose concentrations, and were treated at time 0 with 1.8 µg/ml oligomycin. Measurements under 0 mM glucose are truncated due to cell death that began approximately 5 hr following oligomycin treatment. N = 5, representative. (B) Single-cell measurements of AMPK index in the presence of EGF, insulin, or both, with exposure to 1.8 μg/ml oligomycin at time 0. Prior to imaging, cells were placed in iGM lacking pyruvate, with 2.5 mM glutamine, 3.4 mM glucose, and 20 ng/ml EGF or 10 μg/ml insulin. (C) Quantification of pulse score for each condition shown in (B). N = 5, representative. Statistical significance between no GF and insulin conditions, and between EGF and EGF +insulin conditions, was determined as described in the Materials and methods section. (D) Single-cell measurements of AMPK index in MCF10A cells treated with 1.8 μg/ml oligomycin, with or without 250 nM Akt inhibitor (MK2206) at time 0. Prior to imaging, cells were placed in iGM lacking pyruvate and EGF and containing 2.5 mM glutamine, 3.4 mM glucose, and 10 μg/ml insulin. (E) Quantification of pulse score for each condition shown in (D). N = 3, representative. Statistical significance was determined as described in the Materials and methods section.
Figure 5—figure supplement 1
Additional measurements of metabolic responses to oligomycin.
(A) NADH index measurements in MCF10A cells expressing Peredox, in response to 1.8 µg/ml oligomycin. Cells were maintained in iGM lacking glutamine and pyruvate, containing 17 mM glucose. (B) Akt index measurements in MCF10A cells expressing AKT-KTR, in response to 1.8 μg/ml oligomycin. Akt activity does not respond detectably to oligomycin treatment; inhibition in response to BKM120 is shown in violet in the mean measurement (bottom) for comparison. (C) Single-cell measurements of AMPK index in cells treated with a low concentration of IA, oligomycin, or both. Medium included pyruvate, glutamine, and glucose; inhibitors were added at time 0. (D) Single-cell measurements of AMPK index in the presence of glutamine, insulin, or both. Glucose was present at 17 mM in all conditions. N = 2, representative. (E,F) Dynamics of oligomycin-stimulated AMPK pulses in the presence of pyruvate or glutamine. Measurements of AMPK index were made as in Figure 5A, but in the presence of 2 mM glutamine (E) or 0.5 mM pyruvate (F). Measurements under 0 mM glucose are truncated due to cell death that began approximately 5 hr following oligomycin treatment. While pyruvate does not alter the kinetics of pulsing, glutamine attenuates the pulse behavior. This effect of glutamine is not likely to be mediated by glutaminolysis, since the blockade of mitochondrial ATPase by oligomycin would prevent the majority of ATP production by this pathway. A potential explanation may be acceleration of glycolysis by glutamine, as has been observed in some systems.
Figure 5—figure supplement 2
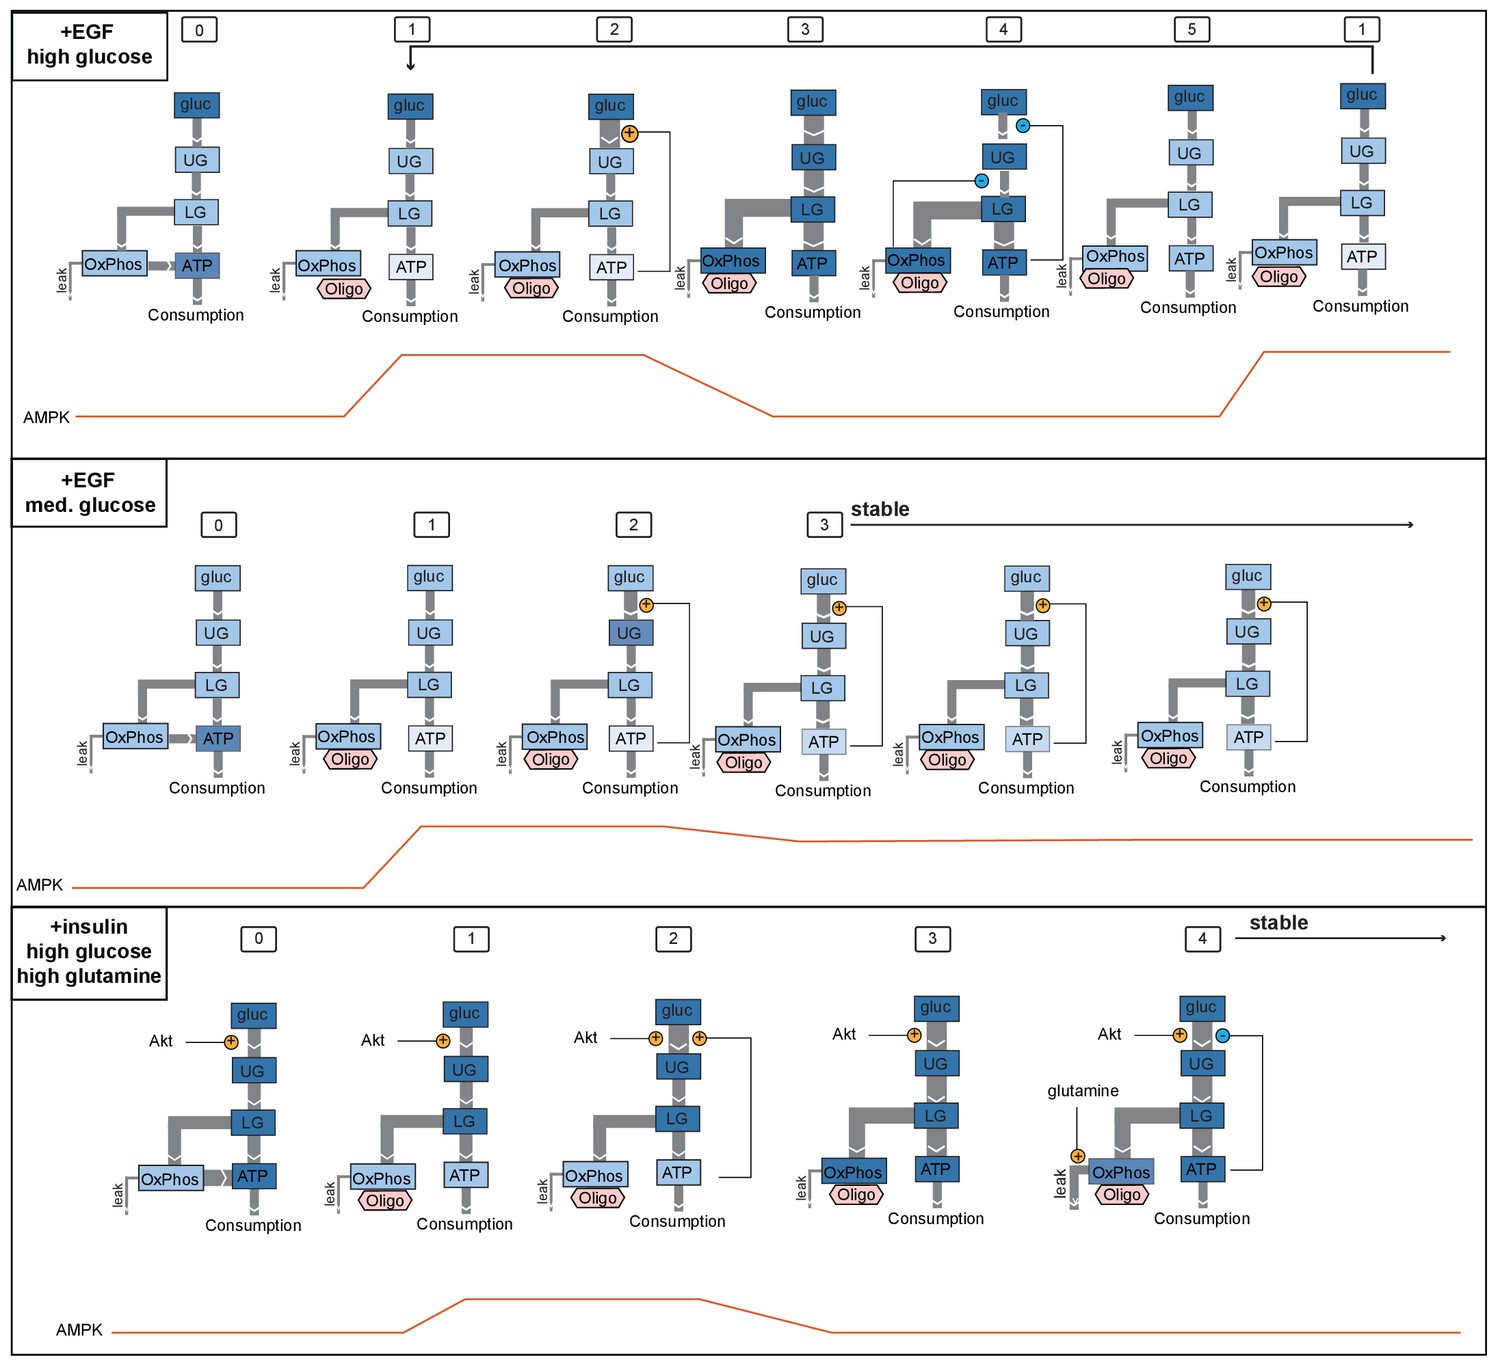
Model for AMPK oscillations induced by oligomycin.
We propose sequences of events that are consistent with three key scenarios found in our experimental data, one in which oligomycin triggers persistent oscillations (top), one in which cells reach stable adaptation at a lower level of ATP (middle), and one in which cells reach stable adaptation at a high level of ATP (bottom). Top panel shows the condition of EGF-stimulated cells in high glucose, which display strong oscillations upon oligomycin treatment (see Figure 5A, first panel). In state (0), glucose metabolism operates at a moderately high level, and ATP levels are high. (1) When oligomycin is added, ATP production by oxidative phosphorylation is blocked, and ATP levels begin to fall; AMPK activity increases. (2) Positive feedback increases the rate of flux into upper glycolysis. (3) Increased glycolytic flux increases ATP production and AMPK activity is reduced; pools of TCA intermediates in the mitochondria become saturated. (4) Negative feedback regulation of glycolysis is triggered both by high ATP levels and by buildup of citrate in the TCA cycle, leading to reduction of glycolytic flux. (5) ATP levels fall as a result of reduced glycolysis; TCA saturation dissipates through usage of TCA intermediates in other pathways and proton gradient leakage (together indicated as ‘leak’ flux). In this state, glycolytic flux is insufficient to maintain ATP levels in the continuing presence of oligomycin, and the cell returns to state (1). The middle panel indicates the condition of EGF stimulation in the presence of intermediate levels of glucose (~2 mM; see Figure 5A, third panel). (0) External glucose levels are not limiting in the basal state, and cells are able to maintain moderately high ATP levels. (1) Oligomycin blocks ATP production by oxidative phosphorylation, and ATP levels fall. (2) Positive feedback regulation increases the rate of flux through glycolysis; however, relative to the top panel, lower available glucose levels limit the extent to which glycolytic flux can increase. (3) Increased glycolytic flux leads to a moderate rise in ATP levels, but this increase is smaller than in the top model, and negative feedback to glycolysis is not triggered. This state persists stably as glycolysis continues to operate at a rate sufficient to supply some ATP in the continuing presence of oligomycin, but not enough to return to initial levels. The bottom panel shows the condition of insulin-treated cells in the presence of high glucose and glutamine (see Figure 5D, lower right panel). In state (0), high Akt activity induced by insulin stimulates a high level of glycolytic flux and high ATP levels. (1) When oligomycin is added, ATP levels drop moderately, but not as far as in the top panels due to the higher glycolytic flux; AMPK activity increases moderately. (2) Positive feedback due to the loss of ATP stimulates further increase in glycolytic flux. (3) Increased glycolytic flux replenishes ATP and increases pools of TCA metabolites. (4) Negative feedback to upper glycolysis is triggered by an increase in ATP, but is counteracted by the insulin-stimulated high activity of Akt; glycolytic flux remains high. Meanwhile, glutamine entering the TCA cycle through anaplerotic reactions alleviates the negative feedback by allowing citrate to continue through the TCA cycle and preventing its buildup. Therefore, cells continue to be able to maintain a high level of glycolytic flux, providing high levels of ATP even in the absence of oxidative phosphorylation.
Figure 6
Linkage of AMPK and Akt activity fluctuations in the absence of chemical metabolic stresses.
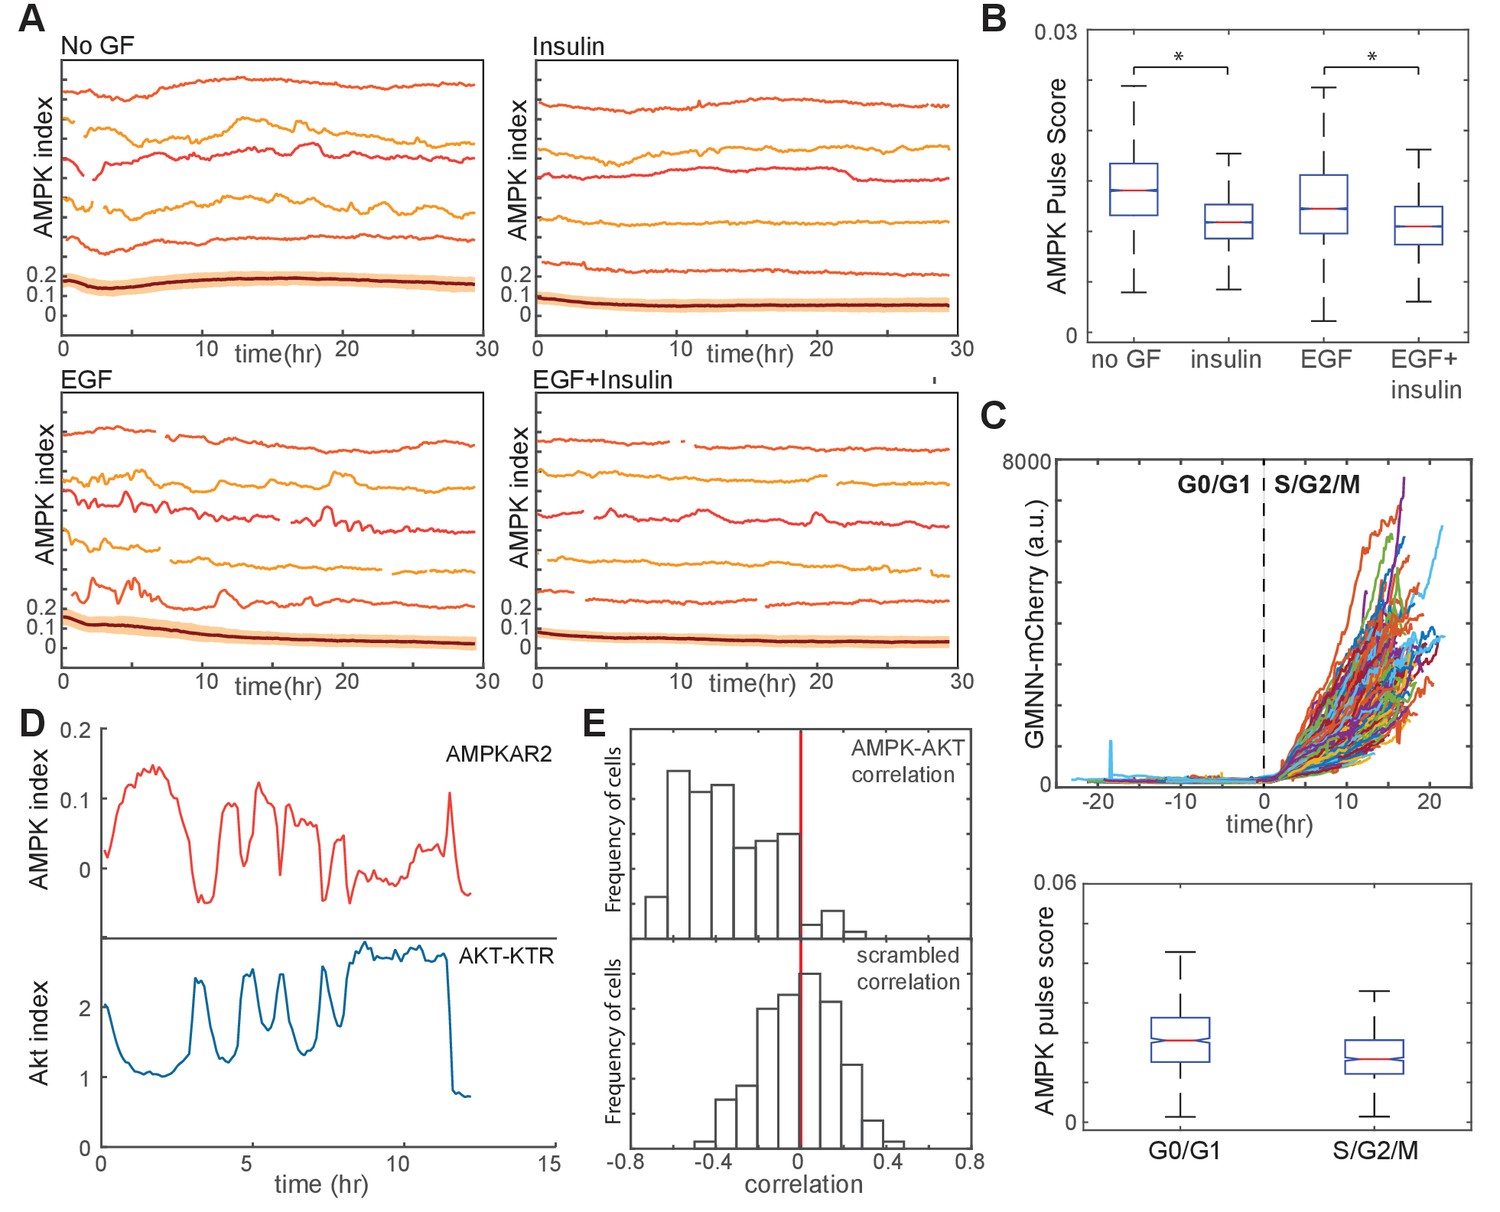
(A,B) Single-cell measurements of AMPK index in MCF10A cells in the presence of EGF (20 ng/ml), insulin (10 μg/ml), or both. Prior to imaging, cells were placed in iGM lacking pyruvate and containing the indicated GFs. Quantification of pulse score for each condition is shown in (B). N = 4, representative. Statistical significance between no GF and insulin conditions, and between EGF and EGF +insulin conditions, was determined as described in the Materials and methods section. (C) Quantification of pulsatile behavior in G0/G1 relative to S/G2. Live-cell measurements of Geminin-mCherry and AMPK index were made in individual cells grown in the presence of EGF; cells were aligned by the time of G1-to-S transition (top). For each cell, we calculated the pulse scores during a 10 hr window preceding the induction of GMNN-mCherry to a 10 hr window immediately following induction (bottom). (D) Single-cell measurements of AMPK index (AMPKAR2) and Akt index (AKT-KTR) in the same cell; culture medium was iGM lacking insulin and pyruvate. The cell shown was manually selected to display a prominent example of the anti-correlation trend visible in the population analysis in (E). (E) Correlation analysis of AMPK and Akt indices. The time-dependent correlation between measured AMPK and Akt was quantified for each cell, and the distribution of individual correlation values is shown. A histogram centered around 0 indicates a population in which there is no systematic trend in the correlation, while skew to the left or right indicates a negative or positive trend in correlation, respectively. The bottom panel shows distributions of correlation values between Akt and AMPK for randomly chosen cells as a negative control.
Figure 7

Suppression of spontaneous bioenergetic fluctuations by Akt/PI3K signaling.
(A,B) Single-cell measurements (A) and pulse analysis of AMPK index (B) in MCF10A cells imaged in iGM and treated with BKM-120 or MK2206 at time 0. N = 4, representative. Statistical significance was determined as described in the Materials and methods section; both inhibitor conditions differed significantly from the DMSO condition with p<0.01. (C, D) Single-cell measurements (C) and pulse analysis (D) of NADH index in MCF10A cells expressing Peredox and cultured in iGM2 with the indicated inhibitors. Median pulse scores are shown in green above each plot. N = 2, combined. Because the Peredox signal showed a higher degree of frame-to-frame variance that is not likely to be biologically relevant, the ‘smooth’ parameter was set to six for this analysis to prevent identification of spurious pulses.
Author response image 1

Population measurement of NADH/NAD+ ratio in response to IA treatment.
Measurements of NADH and NAD+ were made on MCF10A cells following treatment with the indicated compounds for 2 hr, using the NAD/NADH Glo Assay (Promega) and the protocol of Sullivan et al., 2015 (PMID: 26232225).
Videos
Video 1
Induction of AMPK oscillations by inhibition of glycolysis.
MCF10A-AMPKAR2 cells were imaged in iGM as in Figure 3A, and treated at time 0 with 10 µM IA. Color scale bar on upper left indicates approximate AMPK index, with white representing low activity and orange/brown representing high activity. All supplemental movies were created using Nikon Elements software; ratiometric images of mTurquoise2 signal divided by YPet signal were constructed following background subtraction, and intensity modulation display was used to suppress spurious background values. Additional annotation was performed in ImageJ 2.0 (Fiji). Due to software limitations, the color scale bar was manually inserted using ImageJ and numerical values on the color bar do not correspond directly to AMPK index values shown in the main figures.
Video 2
Fluctuating AMPK activity in response to oligomycin.
MCF10A-AMPKAR2 cells were imaged in iGM as in Figure 3B, treated at time 0 with 4.5 µg/ml oligomycin. Color scale bar on upper right indicates AMPKAR signal, with white representing low activity and orange/brown representing high activity. Annotation was performed as for Video 1.
Video 3
Continuous AMPK activity in response to CCCP.
MCF10A-AMPKAR2 cells were imaged in iGM as in Figure 3C, treated at time 0 with 1.6 µM CCCP. Color scale bar on upper right indicates AMPKAR signal, with white representing low activity and orange/brown representing high activity. Annotation was performed as for Video 1.
Video 4
Cell fates in response to metabolic perturbation.
MCF10A-AMPKAR2-mCherryGMNN cells were imaged in iGM and treated with 10 µM IA, 4.5 µg/ml oligomycin, or 1.6 µM CCCP. The left column of images shows the YPet channel of AMPKAR as a cytosolic marker (yellow) and mCherryGMNN (red); the right column shows mCherryGMNN alone.
Video 5
AMPK and Akt activity oscillations in response to IA.
MCF10A-AKT-KTR/AMPKAR2 cells were imaged in iGM2 as in Figure 4E, and were treated at time 0 with 10 µM IA. AMPK index is shown on right using a color scale as in Video 1. AKT-KTR signal is shown on left in grayscale.
Video 6
NADH oscillations detected by Peredox in response to IA.
MCF10A-Peredox cells were imaged in iGM2 as in Figure 4D and were treated at time 0 with 10 µM IA. Color scale bar at upper left indicates NADH index, with blue representing low values and green, yellow, red, and violet indicating successively higher values.
Video 7
AMPK activity dynamics as a function of glucose level.
MCF10A-AMPKAR2 cells were imaged in iGM modified to lack glutamine and pyruvate and to contain the indicated concentrations of glucose. Oligomycin (9 µg /ml) was added at time 0. Annotation was performed as for Video 1.
Tables
Key resources table
| Reagent type (species) or resource | Designation | Source or reference | Identifiers | Additional information |
|---|---|---|---|---|
| Cell line (H. sapiens) | MCF10A | Brugge Lab, Harvard Medical School | RRID: CVCL_0598 | Clone 5E (Janes et al., 2010) used for all experiments |
| Cell line (H. sapiens) | MCF12A | ATCC | RRID: CVCL_3744 | |
| Cell line (H. sapiens) | 184A1 | ATCC | RRID: CVCL_3040 | |
| Cell line (H. sapiens) | MCF10A-AMPKAR2 | This paper | N/A | Available on request |
| Cell line (H. sapiens) | MCF10A-AMPKAR2-GMNN | This paper | N/A | Available on request |
| Cell line (H. sapiens) | MCF10A-AMPKAR2-AKTKTR | This paper | N/A | Available on request |
| Cell line (H. sapiens) | MCF10A-Peredox | This paper | N/A | Available on request |
| Cell line (H. sapiens) | MCF10A-Peredox-AKTKTR | This paper | N/A | Available on request |
| Peptide, recombinant protein | Epidermal growth factor | Peprotech | Cat#AF-100–15 | |
| Peptide, recombinant protein | Insulin | Sigma-Aldrich | Cat#I9278 | |
| Antibody | Anti-pACC | Cell Signaling Technology | Cat#11818 RRID:AB_2687505 | |
| Chemical compound, drug | Sodium iodoacetate | Sigma-Aldrich | Cat#I2512 | |
| Chemical compound, drug | Carbonyl cyanide 3-chlorophenylhydrazone | Sigma-Aldrich | Cat#C2759 | |
| Chemical compound, drug | Oligomycin A | Sigma-Aldrich | Cat#75351 | |
| Chemical compound, drug | BKM120 | Axon Medchem | Cat#1797 | |
| Chemical compound, drug | MK2206 | Selleck Biochemicals | Cat#S1078 | |
| Chemical compound, drug | BEZ235 | Axon Medchem | Cat#1281 | |
| Chemical compound, drug | Torin-1 | Tocris Biosciences | Cat#4247 | |
| Chemical compound, drug | Torin-2 | Selleck Biochemicals | Cat#S2817 | |
| Chemical compound, drug | Rad001 | Selleck Biochemicals | Cat#S1120 | |
| Transfected construct (synthetic) | pPBJ-puro-AMPKAR2-nes | This paper | N/A | Available on request |
| Transfected construct (synthetic) | pMSCV-puro-AKTKTR-mCherry | This paper | N/A | Available on request |
| Transfected construct (synthetic) | pMSCV-puro-Peredox-nls-mCitrine | This paper | N/A | Available on request |
| Transfected construct (synthetic) | pMSCV-puro-GMNN-mCherry | Albeck et al. (2013) | N/A | Available on request |
| Software, algorithm | MATLAB | Mathworks | RRID: SCR_001622 |
Additional files
-
Source Code 1
MATLAB files used to analyze peak size and frequency. Fluctuation scores were calculated on a cell-by-cell basis using the function ct_pulseanalysis.
Unless otherwise noted, the parameter ‘narm’ was set to 3 and ‘smooth’ was set to 0. Subfunctions ct_getpeaks and ct_filter are required for ct_pulseanalysis, as is the MATLAB Signal Processing Toolbox.
- https://doi.org/10.7554/eLife.27293.033
-
Transparent reporting form
- https://doi.org/10.7554/eLife.27293.034
Download links
A two-part list of links to download the article, or parts of the article, in various formats.
Downloads (link to download the article as PDF)
Open citations (links to open the citations from this article in various online reference manager services)
Cite this article (links to download the citations from this article in formats compatible with various reference manager tools)
Akt regulation of glycolysis mediates bioenergetic stability in epithelial cells
eLife 6:e27293.
https://doi.org/10.7554/eLife.27293


