Species-specific modulation of food-search behavior by respiration and chemosensation in Drosophila larvae
- The Barcelona Institute of Science and Technology, Spain
- Universitat Pompeu Fabra, Spain
- Catalan Institute of Nanoscience and Nanotechnology, CSIC and The Barcelona Institute of Science and Technology, CIBER-BBN, Spain
- University of California, Santa Barbara, United States
Figures
Figure 1 with 1 supplement
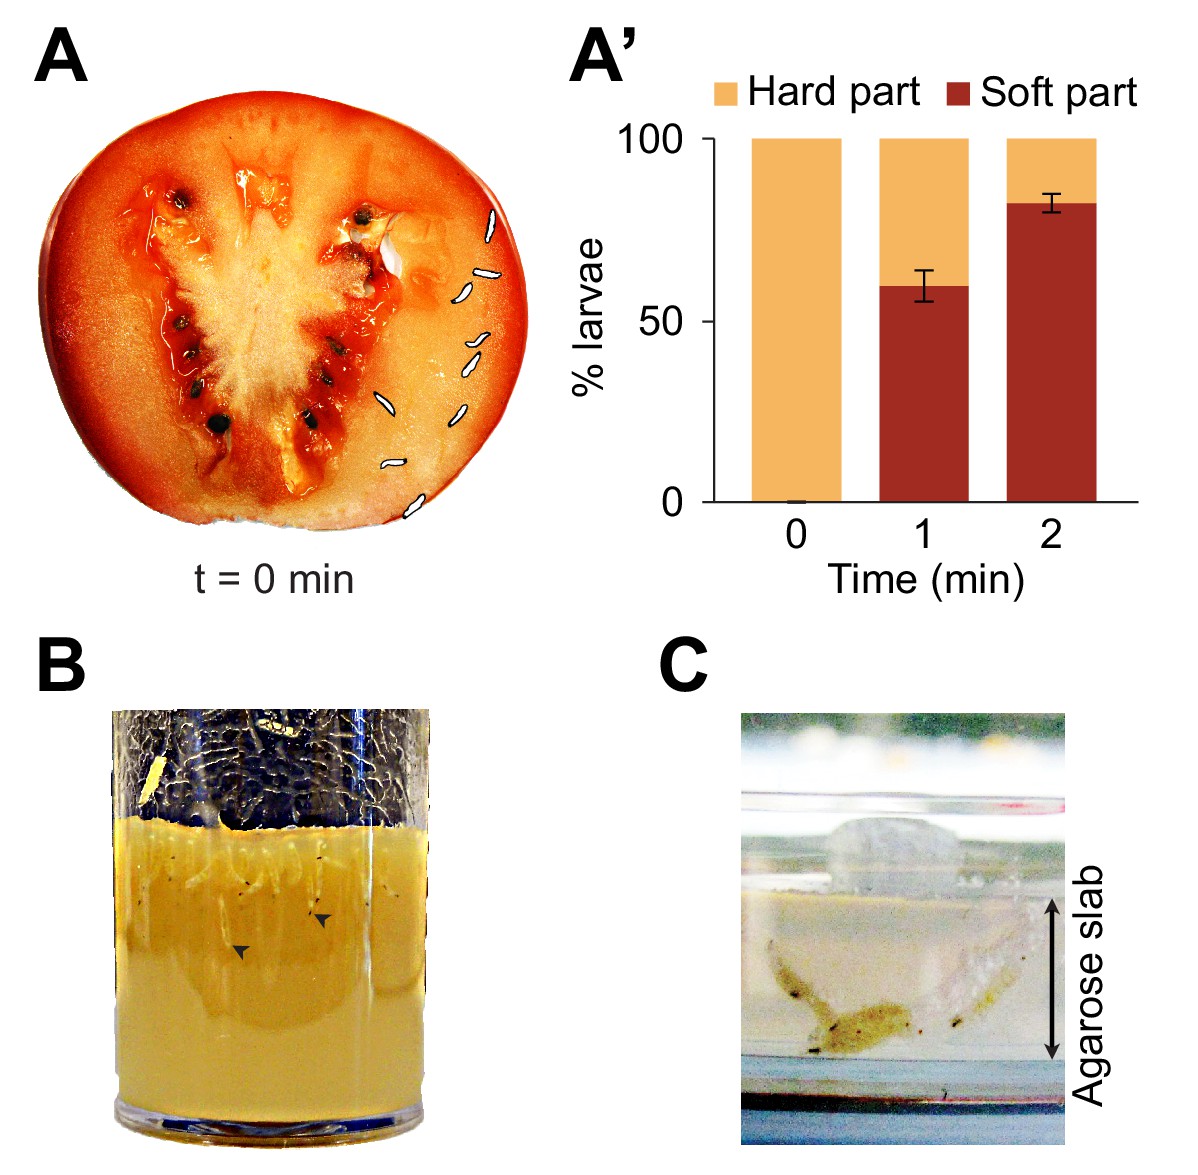
Foraging behaviors of larvae on a fruit and in controlled laboratory conditions.
Digging and diving behaviors of larvae in (A) a tomato slice, (B) a vial of lab food (arrowheads indicate diving larvae), and (C) a plain agarose slab (2%, w/v). Larvae introduced on hard agarose slabs as shown in (C) initiated burrowing after having foraged for more than 30 min on the surface. In (A), the outline of the individual larvae was drawn by hand upon careful inspection of pictures to increase the contrast with the background. In (A’), the percentage of larvae located in the hard part (mesocarp) and soft part (locular gel) of the tomato slice were quantified over time upon introduction of larvae (n = 9 or 10 individuals) on the hard part of the fruit (bars report means ± s.e.m., n = 8 trials). One-sample Student’s t-test of the mean fraction of larvae found in the soft part of the tomato at time point t = 2 min compared to 50%: p<0.001. For more information about the statistics, see Supplementary file 1.
Figure 1—figure supplement 1
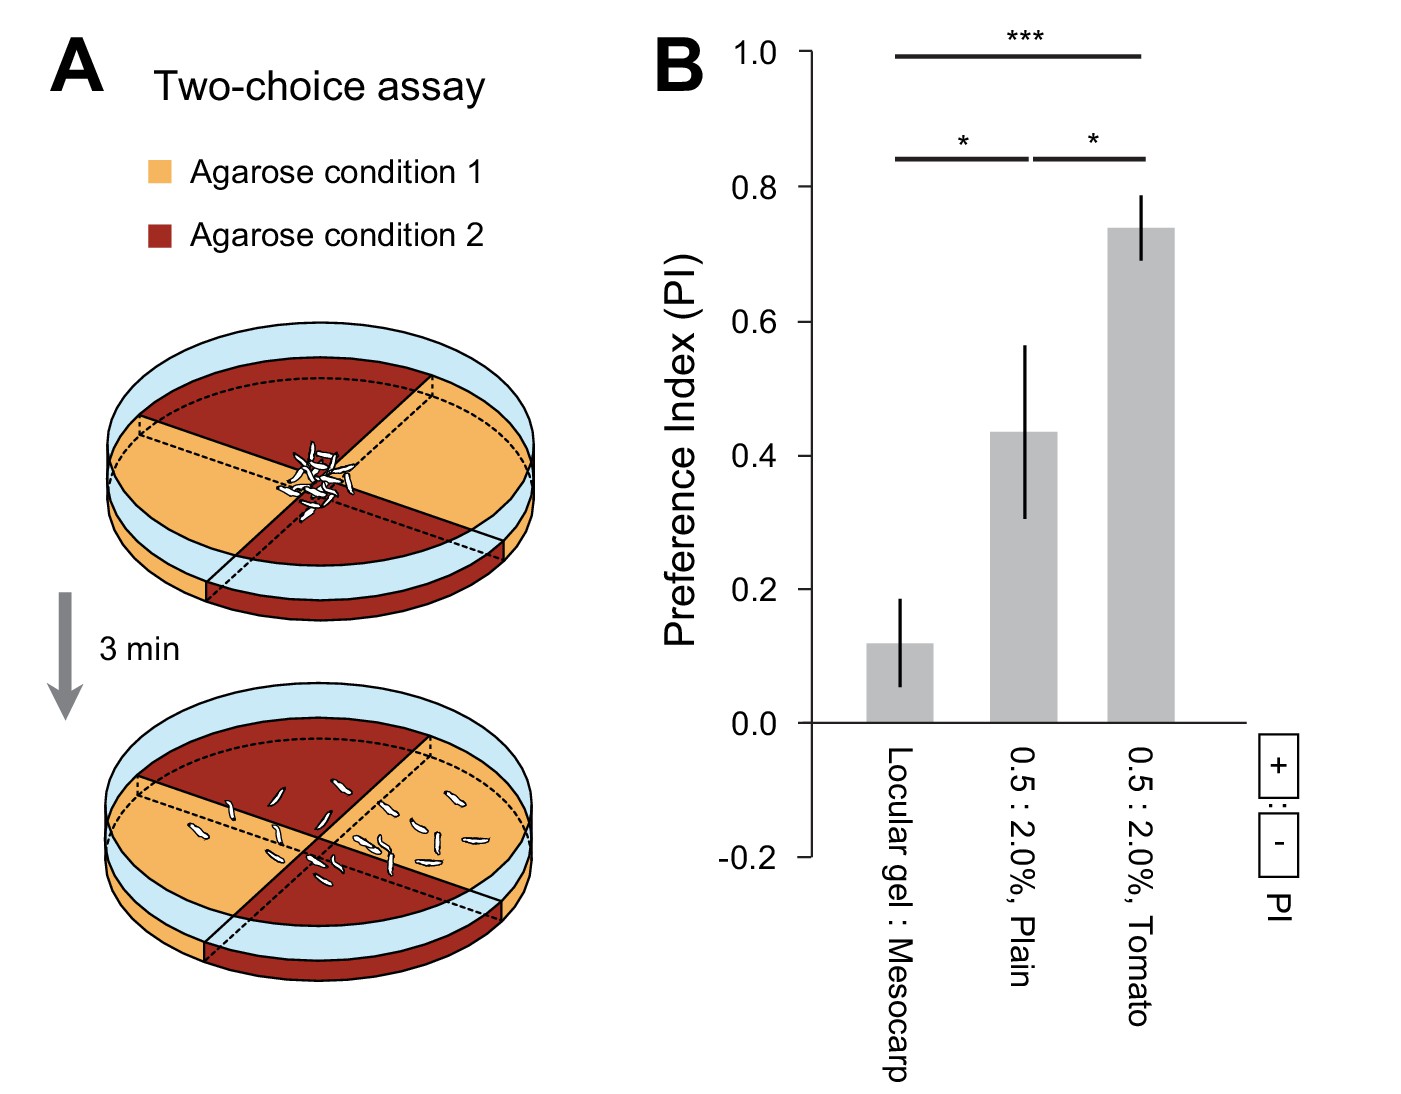
Spatial preferences elicited by substrates of different hardnesses and nutritional values.
(A) Schematic of the two-choice assay. Two different agarose conditions were prepared in pairs of identical quadrants. A group of 20 larvae were placed in the middle of the dish at the start of the experiment. The number of larvae in each quadrant was counted after 3 min. For more detail about the methodology, see the Materials and methods section. (B) Each independent trial led to a preference index (PI). The means and s.e.m. of the distributions of PIs corresponding to one experimental condition were reported in a bar graph (n = 10 trials, Student’s t-test). The experimental conditions tested in the paper included quadrants with the following properties: (0.5 vs. 2.0% plain agarose gels), (0.5 vs. 2.0% agarose gels mixed with mesocarp-tomato juice), and (2.0% agarose gels mixed with tomato juices obtained from the locular gel or the mesocarp). The two concentrations of agarose gel, 0.5% and 2.0%, are characterized by the same ranges of mechanical hardness of the locular gel and the mesocarp of regular tomatoes, respectively. The significance levels of the statistics are indicated as *p<0.05 and ***p<0.001.
Figure 2 with 1 supplement
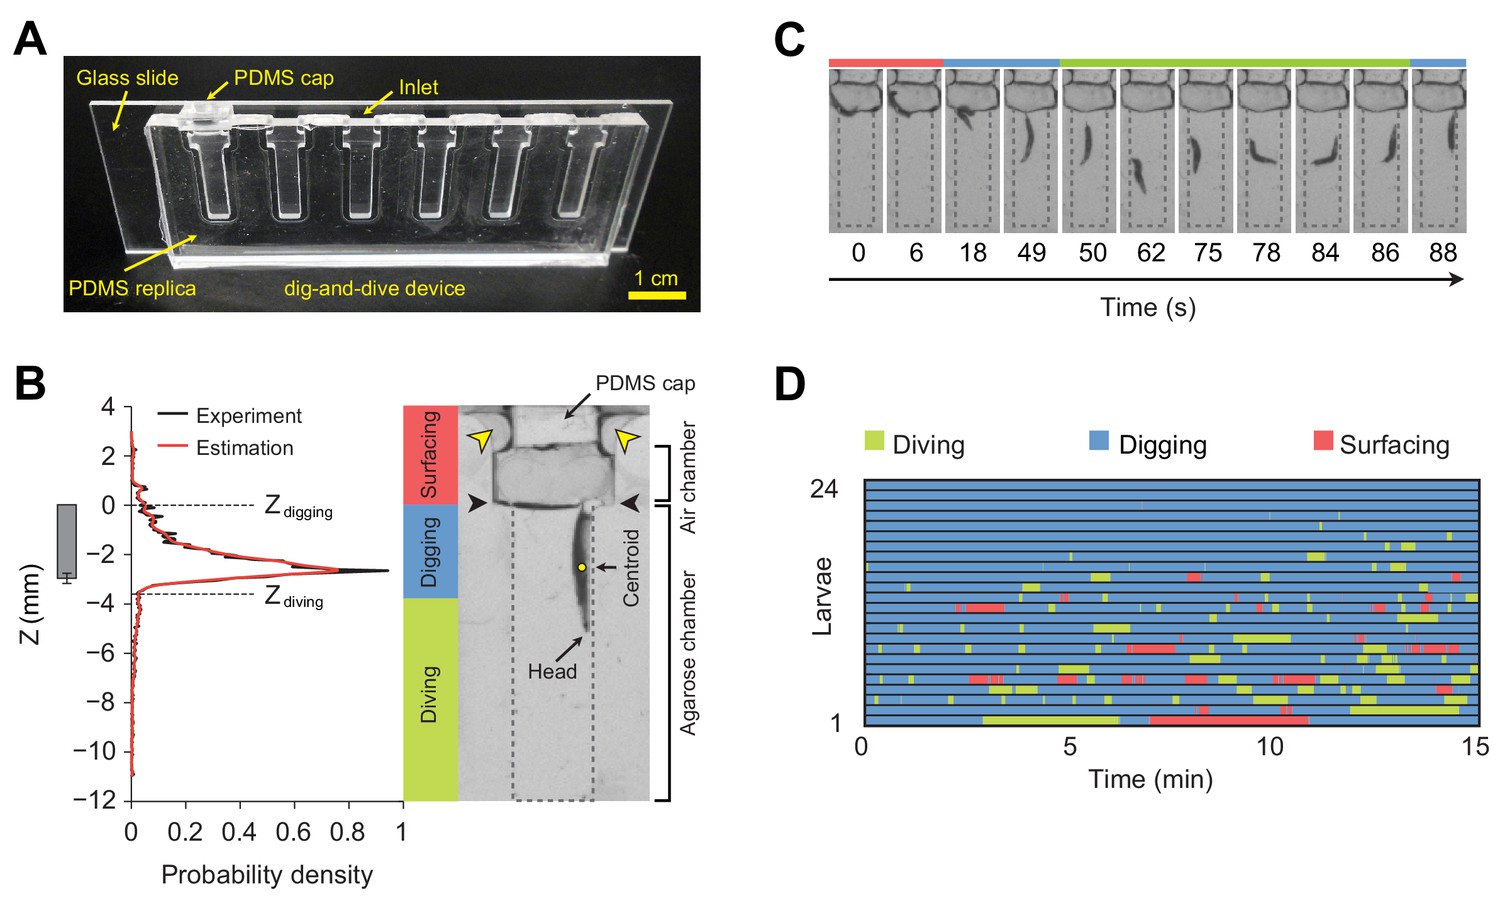
Dig-and-dive assay and definition of behavioral modes.
(A) Picture of the dig-and-dive device. The dimensions of the assay are given in Figure 2—figure supplement 1. (B) Probability density function (PDF) of larval centroid depths (Z) observed in 0.4% plain agarose gel. Kernel density estimation was applied to smoothen the PDF (red). The thresholds on the depth for classifying digging and diving behavioral modes are Zdigging = 0, Zdiving = −3.6 mm, respectively. The left bar represents the distribution over larval centroid position plus the length of the posterior spiracles (mean ± s.d., n = 24 pictures). Typical posture of a larva engaged in digging behavior. Yellow arrowheads indicate two lateral air channels on the side of the removable cap (200 µm in thickness). Black arrowheads represent the interface between the agarose gel and the air. (C) A sequence of larval postures corresponding to surfacing (red) followed by digging (blue), diving (green) and a new digging episode (blue). After a dive, larvae do not necessarily resurface. (D) Ethogram over time of 24 larvae. Each row of the ethogram corresponds to a different animal. The time course of the behavioral state of a larva is represented according to the color code at the top of the panel. Trials were sorted by increasing total dive times. The average number of dives per trial is 4.1 ± 3.2 (mean ± s.d.). More information about the statistics is given in Supplementary file 1.
Figure 2—figure supplement 1
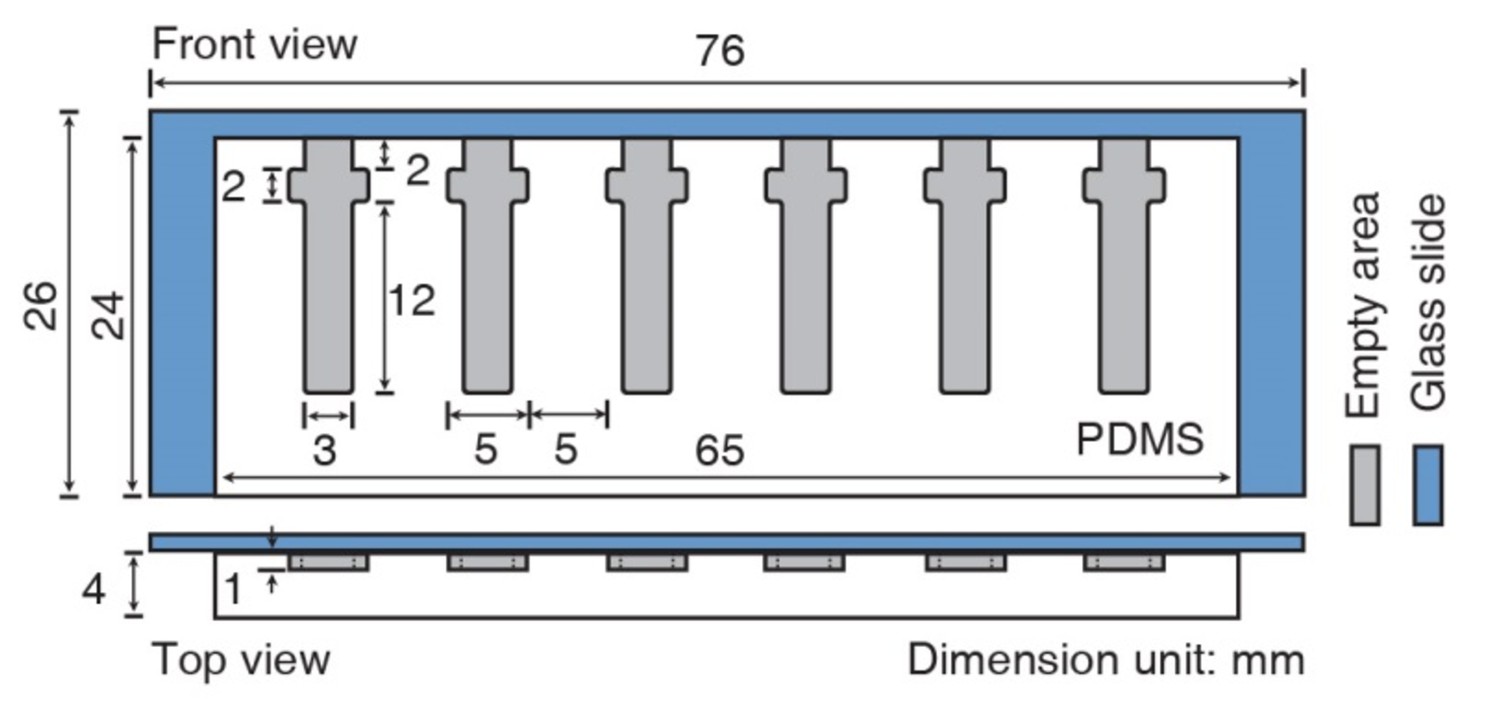
Schematic diagram of the assay device.
Front and top views. Dimensions are given in mm. The mold (white) of the agarose chambers (gray) was made of a polydimethylsiloxane (PDMS) prepolymer.
Figure 3 with 2 supplements
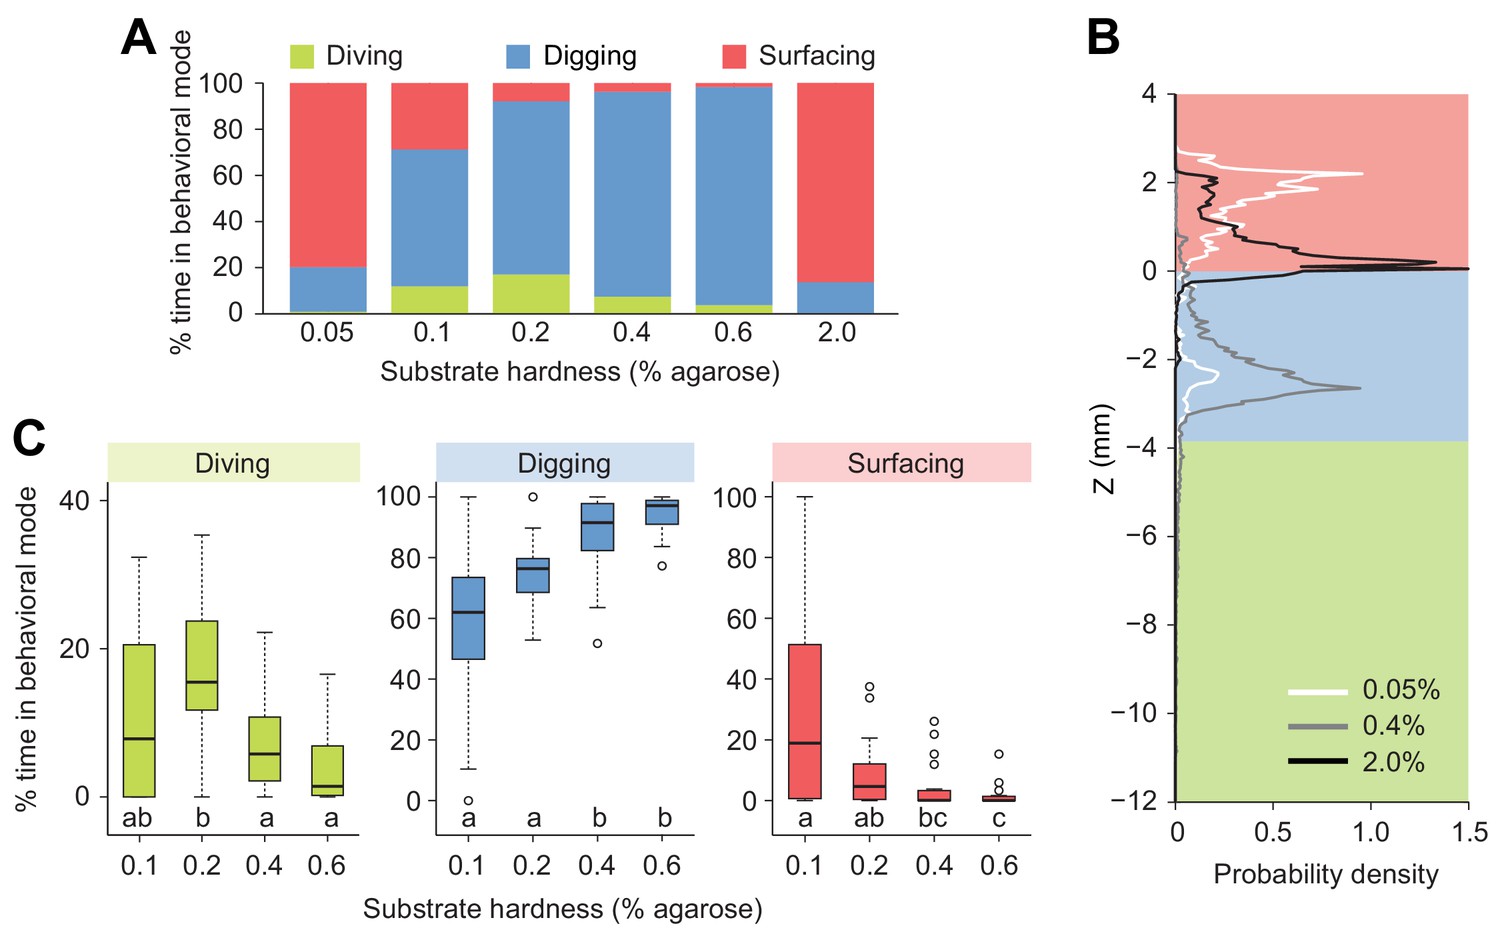
Modulation of exploratory behavior by the hardness of the substrate.
(A) Percentage of time spent in each of the three elementary behavioral modes: diving (green), digging (blue) and surfacing (red) of larvae foraging in agarose gels of different hardness. (B) Probability density functions of larval centroid depth (Z) in very soft (0.05%), moderately stiff (0.4%) and solid-like (2.0%) agarose gels. (C) Boxplots of percentage of time in behavioral modes in intermediate range of the substrate hardness, 0.1–0.6% agarose. Samples with different letters indicate significantly different medians (Kruskal-Wallis test followed by pairwise Wilcoxon rank-sum test with Bonferroni correction, p<0.05, n = 24 trials). More information about the statistics is given in Supplementary file 1.
Figure 3—figure supplement 1
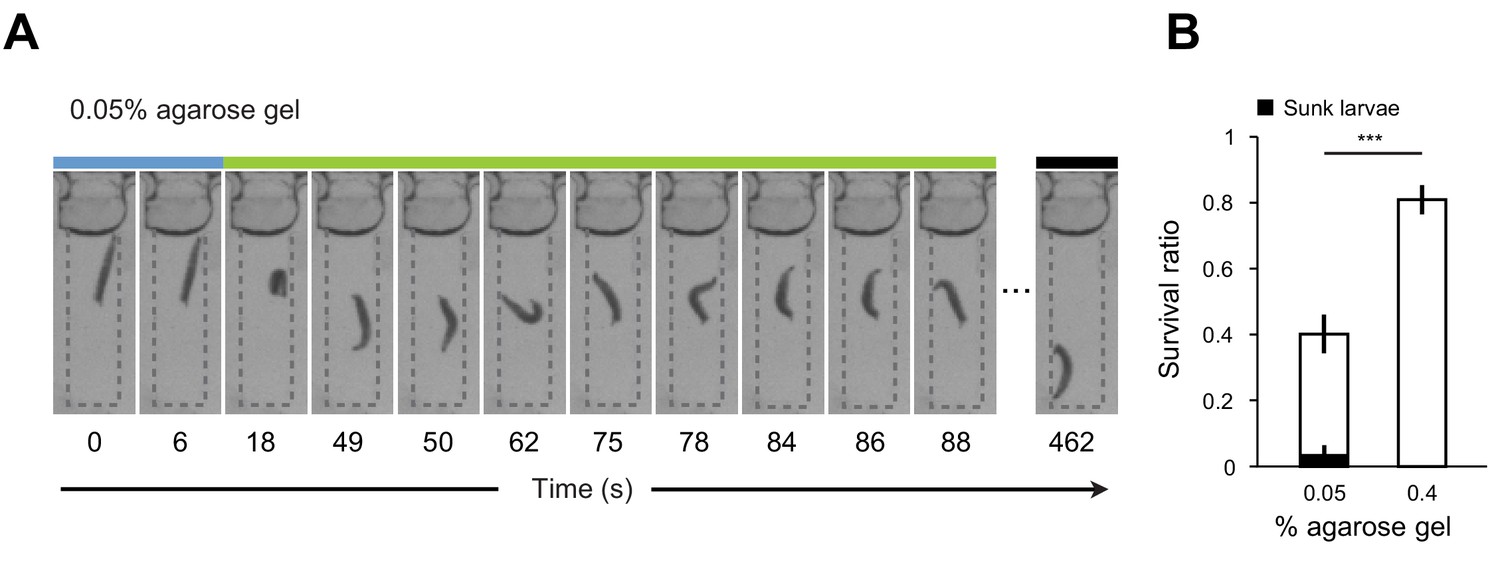
Diving in soft substrates involves the risk of drowning.
(A) Examples of sequence of larval postures annotated with the three behavioral modes in 0.05% agarose gel. While larvae return to the surface of the gel after a dive in gels with medium hardness (Figure 2C), larvae immersed in soft 0.05% gels have a tendency to sink inside the gel without being able to return to the surface. (B) Survival ratios of larvae (n = 8 ~ 14 individuals) having foraged for 1 hr in 0.05% and 0.4% agarose gels (mean ± s.e.m., n = 10 trials, Student’s t-test, see Survival assay description in Materials and methods). A majority of sunken larvae died in the survival assay. The fraction of sunken larvae that survived is represented in black. The significance level of the statistics is indicated as ***p<0.001.
Figure 3—figure supplement 2
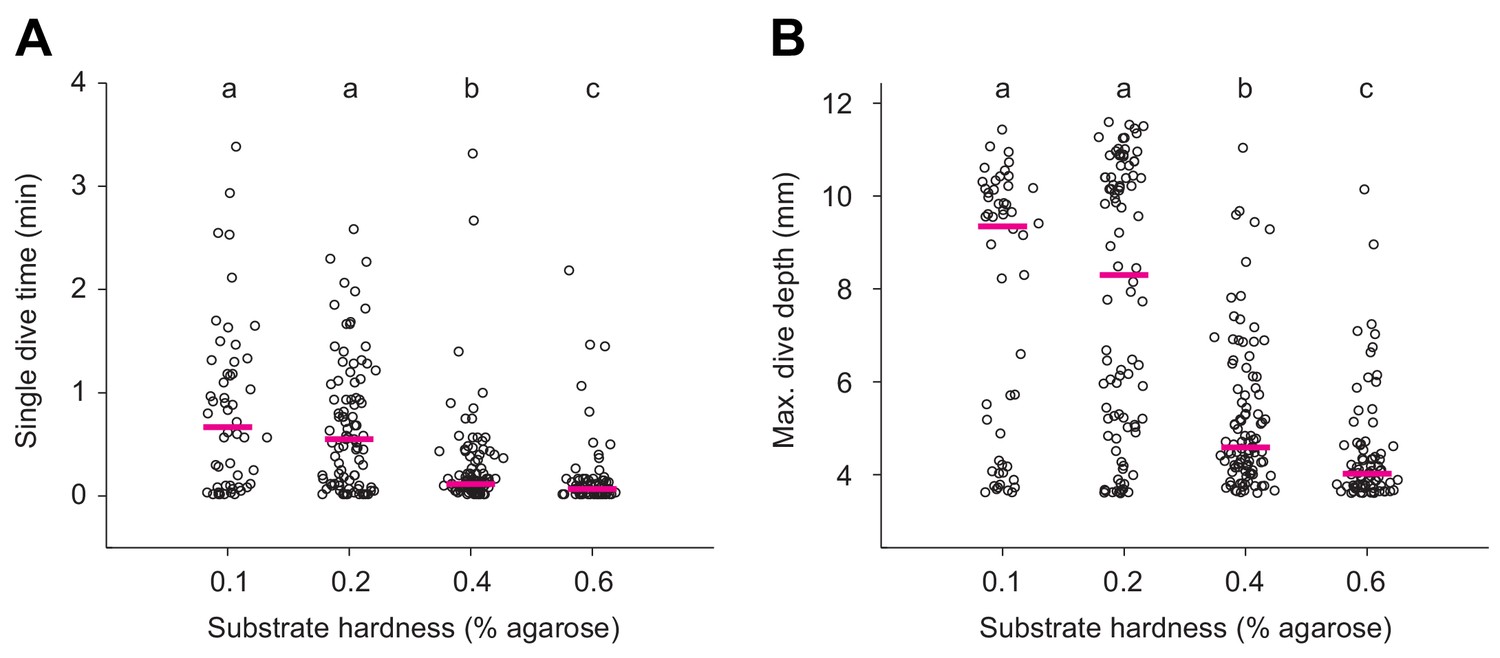
Quantification of single dives in substrates of different hardness.
(A) Durations of single dives and (B) maximum dive depths reached by larvae that forage in agarose gels of different hardness (Kruskal-Wallis test followed by Wilcoxon rank-sum test with Bonferroni correction, p<0.05, n = 52–98).
Figure 4 with 1 supplement
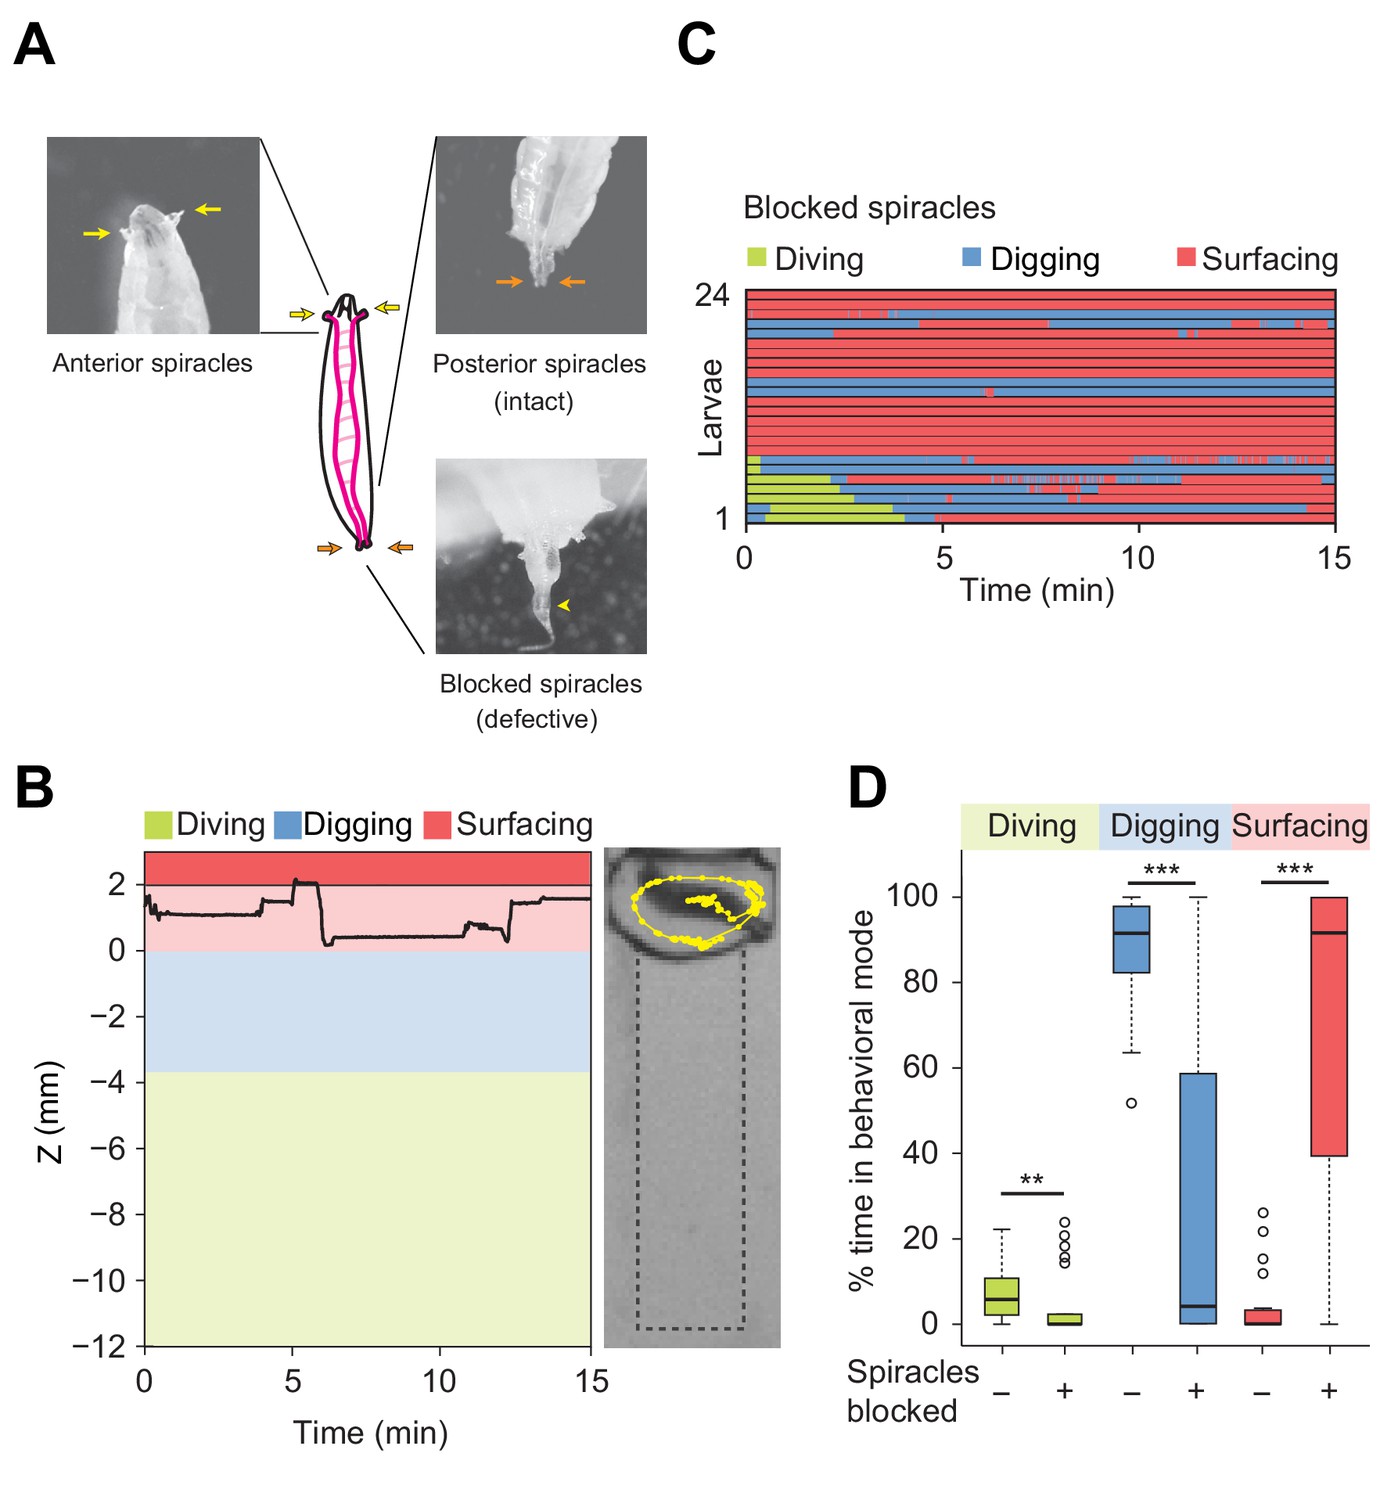
Modulation of exploratory behavior by respiration.
(A) Schematic of the larval tracheal system and close-up view of spiracles. The magenta lines in the diagram illustrate the two dorsal main trunks of the trachea (parallel to the longitudinal body axis) and their lateral branches (perpendicular to the longitudinal body axis). Top panel: the arrows indicate two anterior (yellow) and two posterior (orange) spiracles. Bottom panel: the arrowhead indicates blocked posterior spiracles with thermoplastic adhesives. (B) Left panel: time course of the centroid depth (Z) of a representative of spiracle-blocked larva during a 15 min trial. Right panel: picture of the assay overlaid with a complete 15 min trajectory (dots highlight positions every 1 s). (C) Ethograms over time of larvae with blocked spiracles (n = 24 trials). Each row of the ethogram corresponds to a different animal. The time course of the behavioral state of a larva is represented according to the color code at the top of the panel. Trials were sorted by increasing total dive times. Average numbers of dives per trial are 4.1 ± 3.2 and 0.3 ± 0.6 (mean ± s.d.), respectively. (D) Percentage of time in behavioral modes for larvae with intact and blocked spiracles (Wilcoxon rank-sum test, **p<0.01 and ***p<0.001). More information about the statistics is given in Supplementary file 1.
Figure 4—figure supplement 1
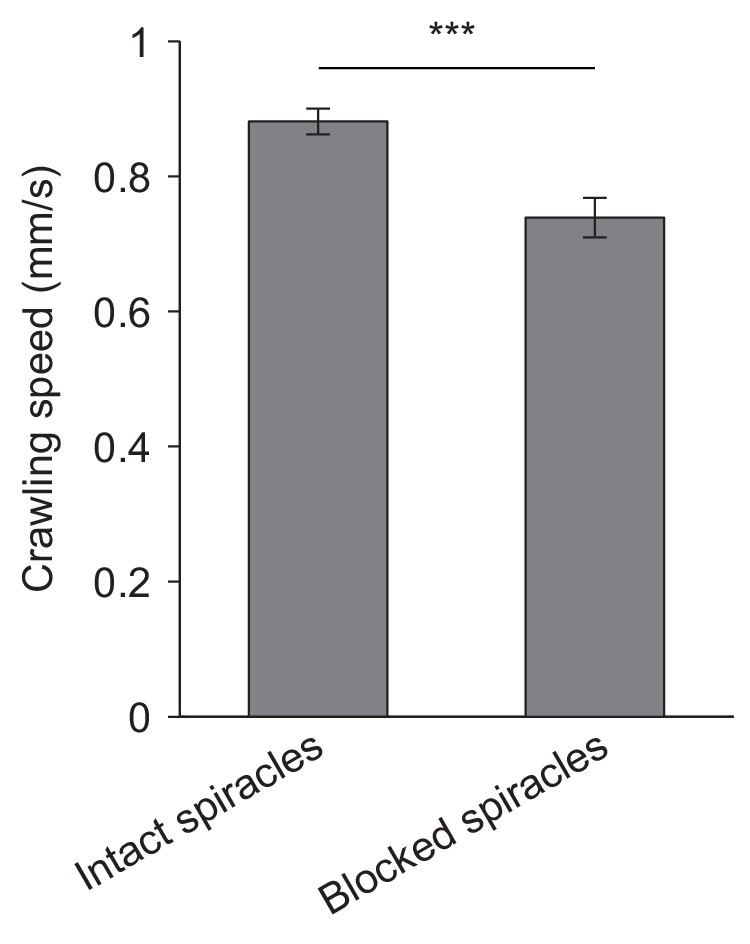
Locomotor activity of larvae with intact and blocked spiracles.
Crawling speeds of D. melanogaster larvae having intact spiracles and blocked spiracles (mean ± s.e.m., 21 and 25 larvae, n = 102 and 66). Movement monitored on hard planar agarose slabs (2 % w/v). In these experiments, none of the larvae dived into the agarose. Significance level of statistical tests indicated as ***p<0.001 upon application of Student’s t-test. The locomotor behavior of larvae with intact and blocked spiracles can be evaluated in Videos 3 and 4, respectively.
Figure 5 with 5 supplements
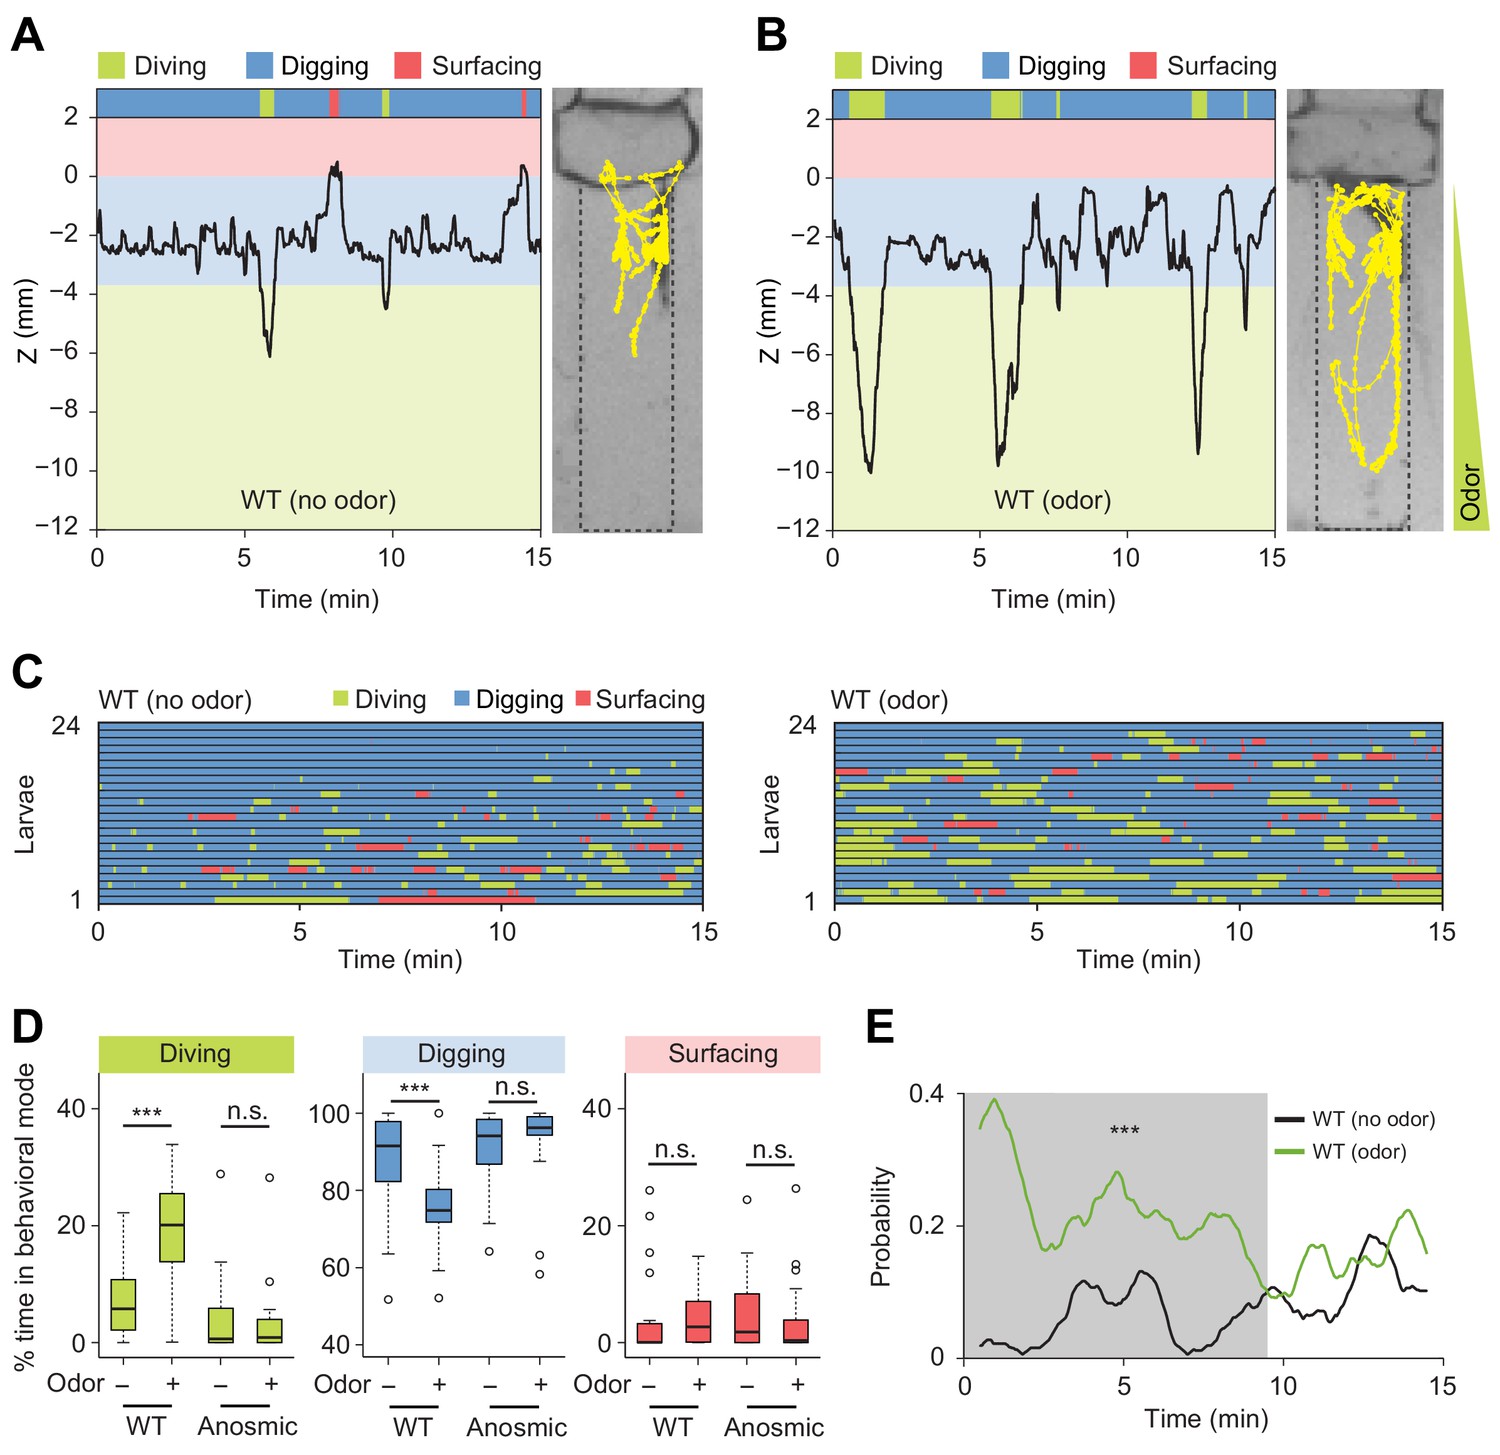
Induction of exploratory behavior by an attractive odor (ethyl acetate).
(A) Representative time course of centroid depth (Z) of a wild-type (WT) larva and corresponding trajectory in 0.4% agarose gel in absence of odor (dots highlight positions every 1 s). (B) Same as in presence of the odor (ethyl acetate). The larva reached the bottom of the agarose chamber when its centroid was at the depth close to −10 mm. (C) Ethograms for wild-type larvae tested in absence and in presence of the odor (n = 24 trials). The ethogram shown in panel C for the absence of odor is the same as that presented in Figure 2D. Average numbers of dives per trial are 4.1 ± 3.2 and 5.3 ± 2.5 (mean ± s.d.), respectively. Trials were sorted by increasing total dive times. (D) Percentages of total time spent in behavioral modes for wild-type and anosmic (Orco-/-) larvae with olfactory impairment tested in an agarose gel without/with the odor (Wilcoxon rank-sum test, n = 22–24 trials). (E) Time course of probability of diving for wild-type larvae without (black) and with (green) the odor. A sliding window of 1 min was applied. The gray background represents the period during which the likelihood of diving in the agarose with the odor is higher than that without the odor (Kolmogorov-Smirnov test). For (D) and (E), significance levels of the statistics are indicated as ***p<0.001 and n.s. stands for not significant. More information about the statistics is given in Supplementary file 1.
Figure 5—figure supplement 1
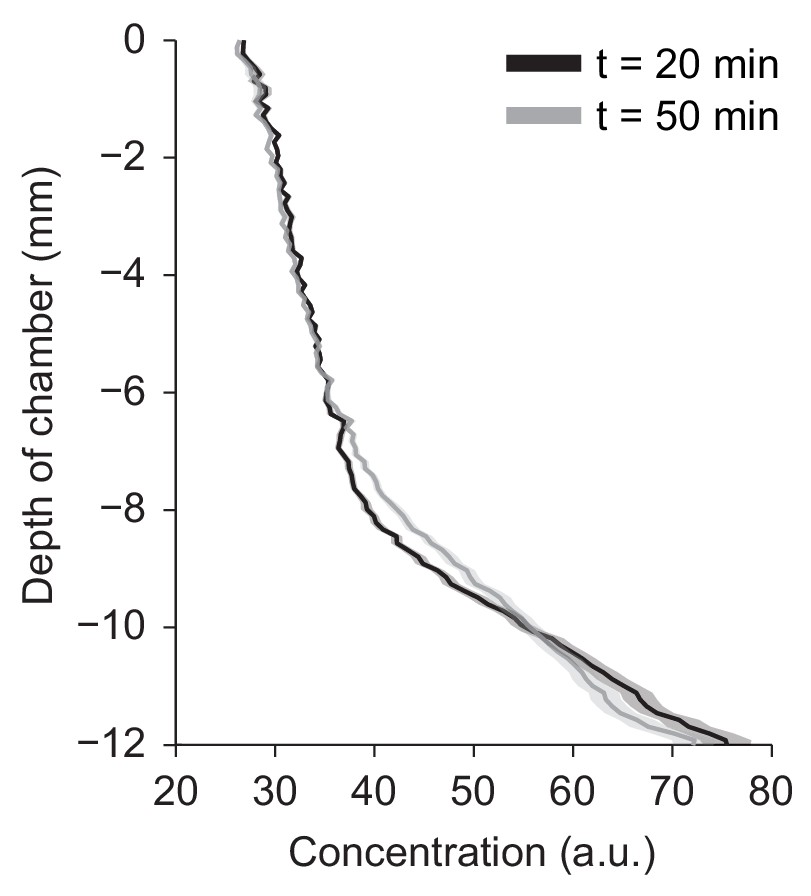
Vertical gradient of chemical concentration.
Spatial gradient of bromophenol blue (BPB) concentration along the vertical-axis of the agarose chamber at two time points, t = 20 and 50 min after injection of 1 µL of 1 mM BPB at the bottom of the chamber (mean ± s.e.m., n = 6 trials).
Figure 5—figure supplement 2
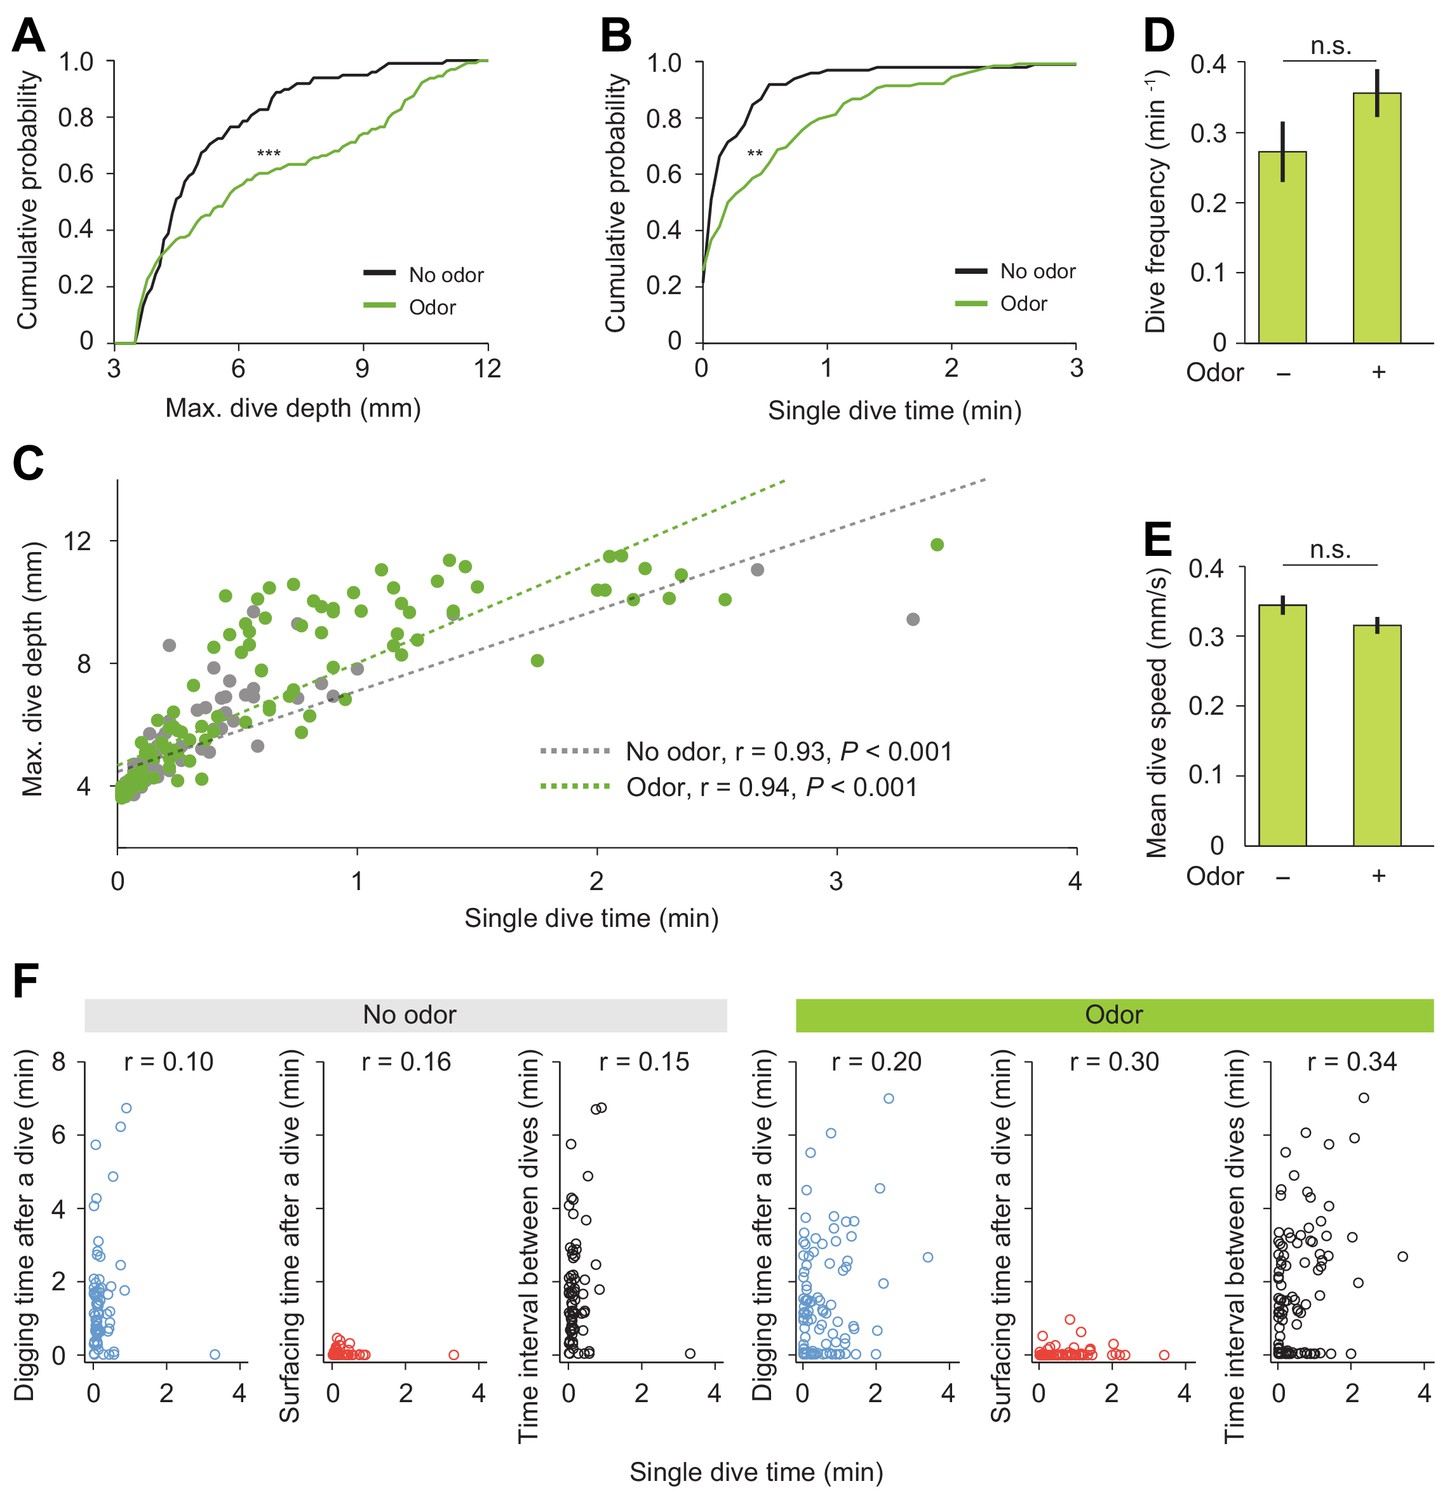
Detailed analysis of diving behavior of wild-type larva in absence and in presence of an attractive odor (ethyl acetate).
(A) Cumulative distribution functions (CDFs) of maximum depth of single dives and (B) single dive time (Kolmogorov-Smirnov test applied to compare distributions). (C) Maximum dive depth vs. single dive time of larvae in the agarose without/with an attractive odor ethyl acetate (Spearman's rank correlation (ρ) analysis, n = 98 and 128 dives). (D) Dive frequency of larvae (n = 24 trials). (E) Mean dive speed of larvae (Student’s t-test). In all statistical tests, **p<0.01, ***p<0.001 and n.s. stands for not significant. (F) Correlation analyses between individual diving time and one of the following variables: digging time, surfacing time, and inter-dive intervals. The value of the Spearman’s correlation coefficient is reported at the top of each graph.
Figure 5—figure supplement 3
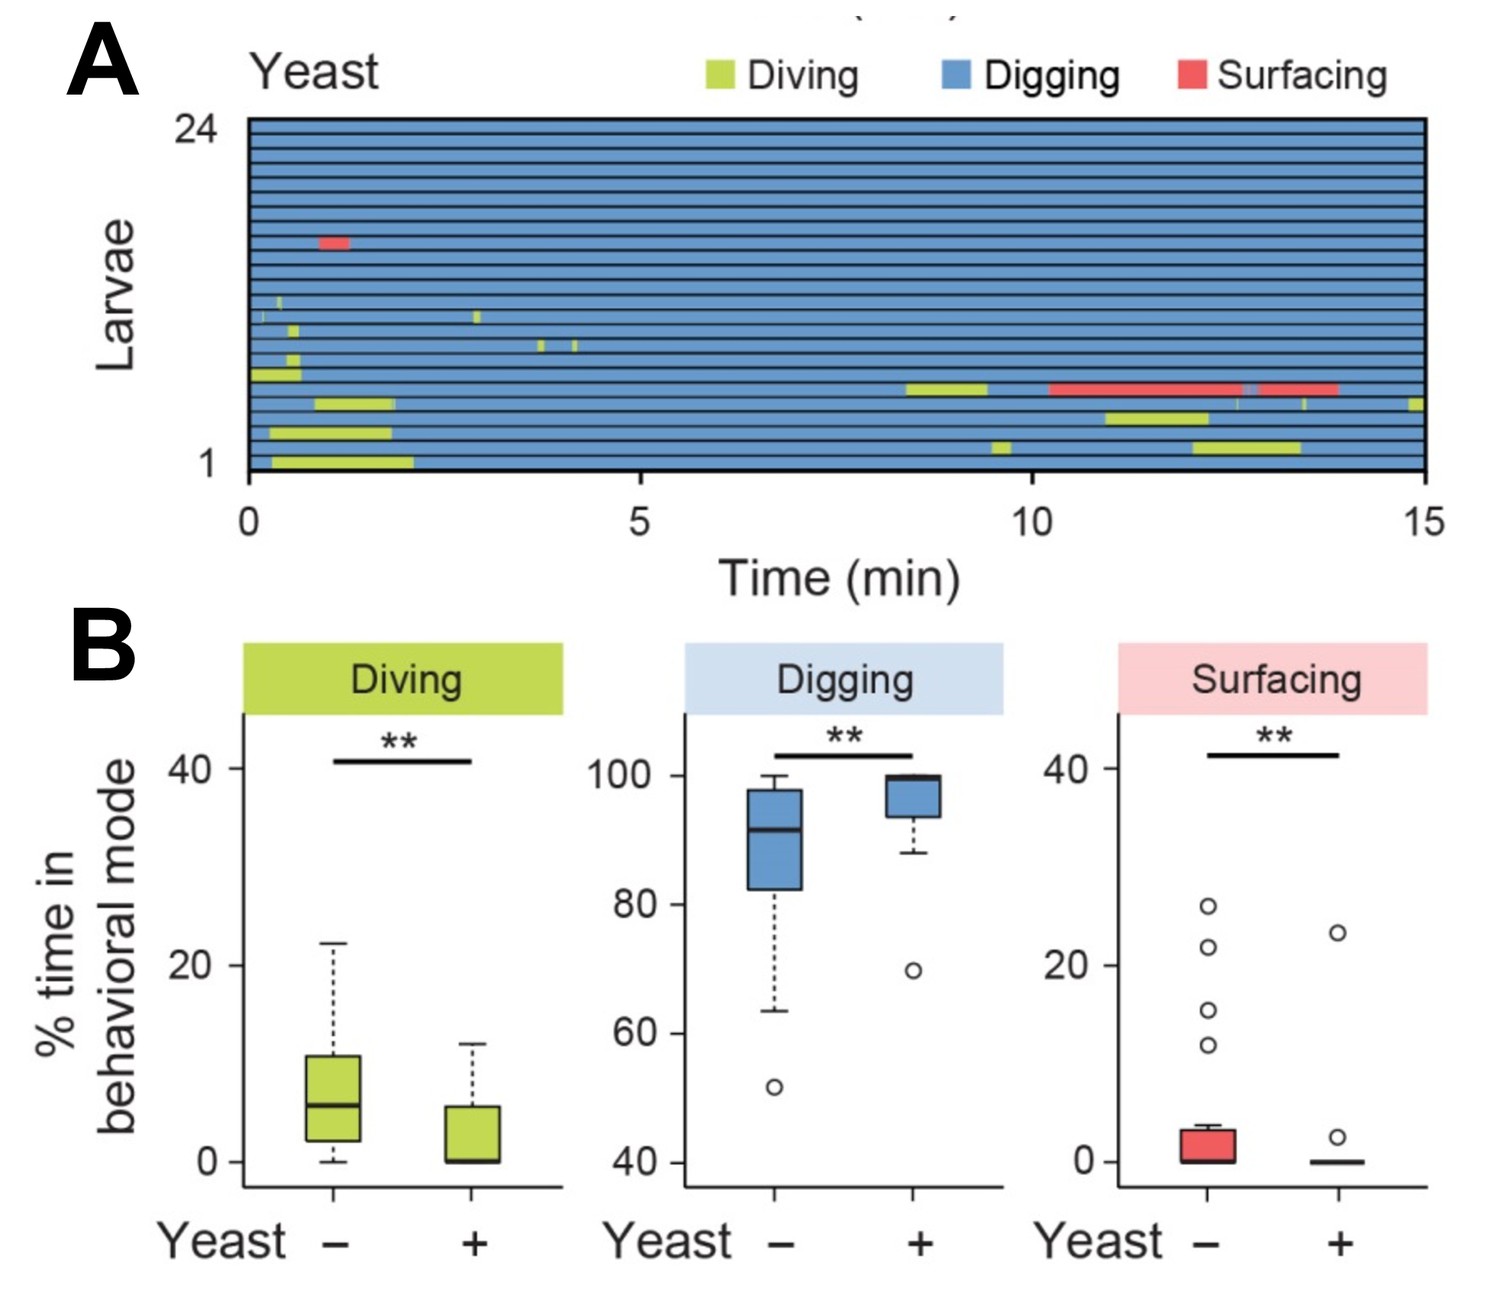
Diving is impaired by the detection of yeast mixed in the agarose substrate.
(A) Ethogram for larvae tested in presence of yeast (0.2%, w/v) (n = 24 trials). Average numbers of dives per trial are 4.1 ± 3.2 and 0.9 ± 1.3 (mean ± s.d.), respectively. (B) Percentages of total time spent in behavioral modes for larvae tested in an agarose gel with/without yeast (Wilcoxon rank-sum test, n = 24 trials). The significance levels of the statistics are indicated as **p<0.01.
Figure 5—figure supplement 4
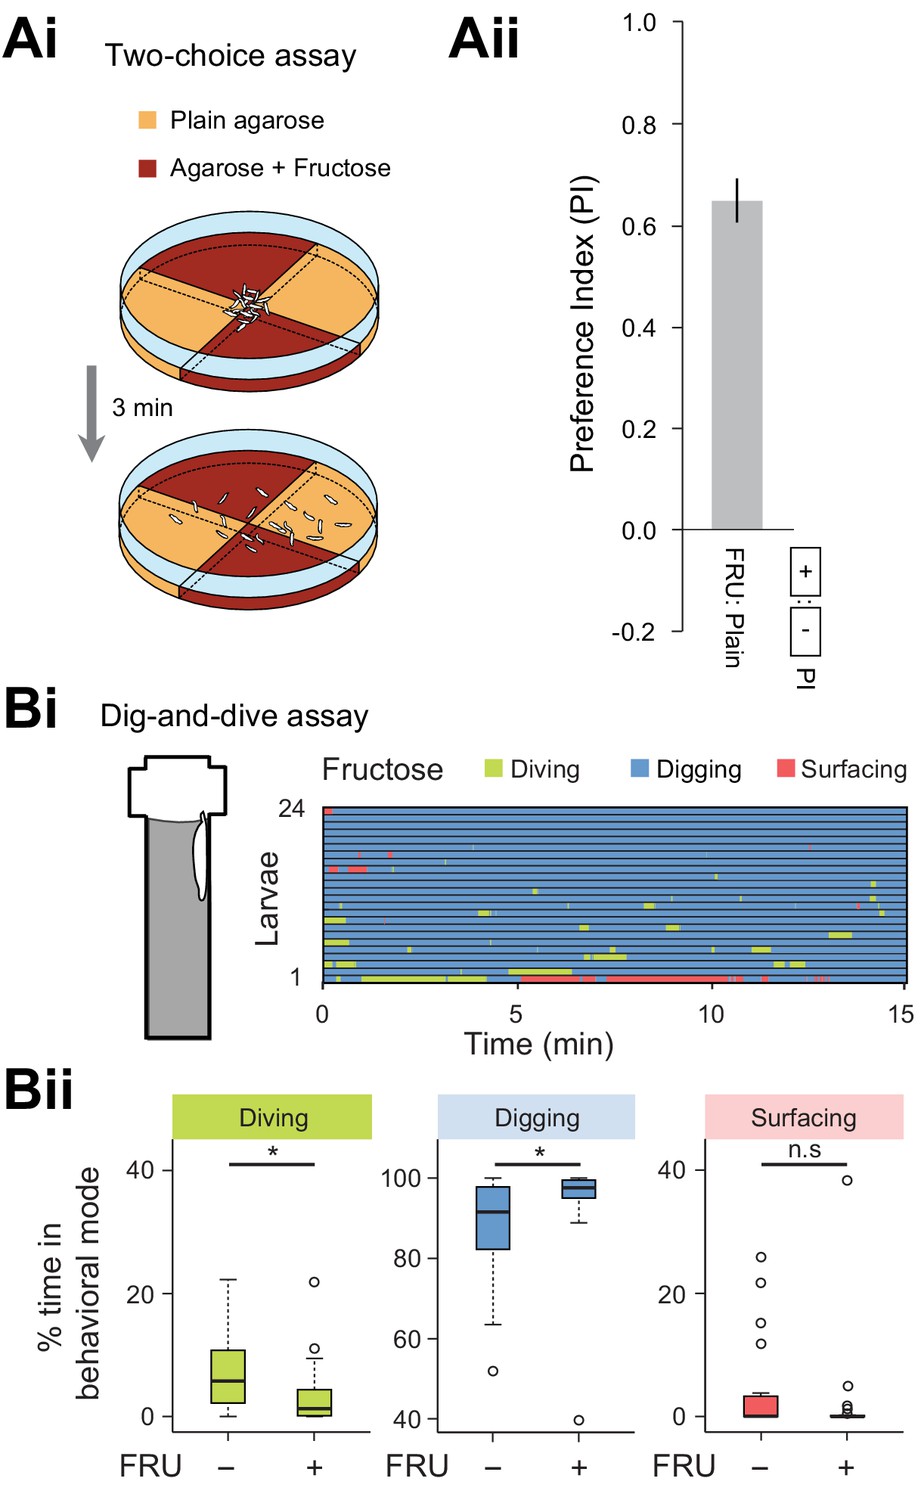
Diving is significantly reduced by the perception of sugar mixed in the agarose substrate.
(Ai) Schematic of the two-choice assay featuring two pairs of 2.0% agarose quadrants: plain agarose and agarose mixed with 1.5M fructose (FRU). (Aii) After 3 min, the dispersal of larvae on the assay dish was quantified through a preference index (see Materials and methods). A strong attraction for the quadrants mixed with fructose was observed. (Bi) Ethogram for larvae tested in presence of 1.5 M fructose (n = 24 trials). (Bii) Percentages of total time spent in behavioral modes for larvae tested in an agarose gel with (+) and without (-) fructose (Wilcoxon rank-sum test, n = 24 trials). Average numbers of dives per trial are 4.1 ± 3.2 and 2.1 ± 2.0 (mean ± s.d.), respectively. The significance levels of the statistics are indicated as *p<0.05 and n.s stands for not significant.
Figure 5—figure supplement 5
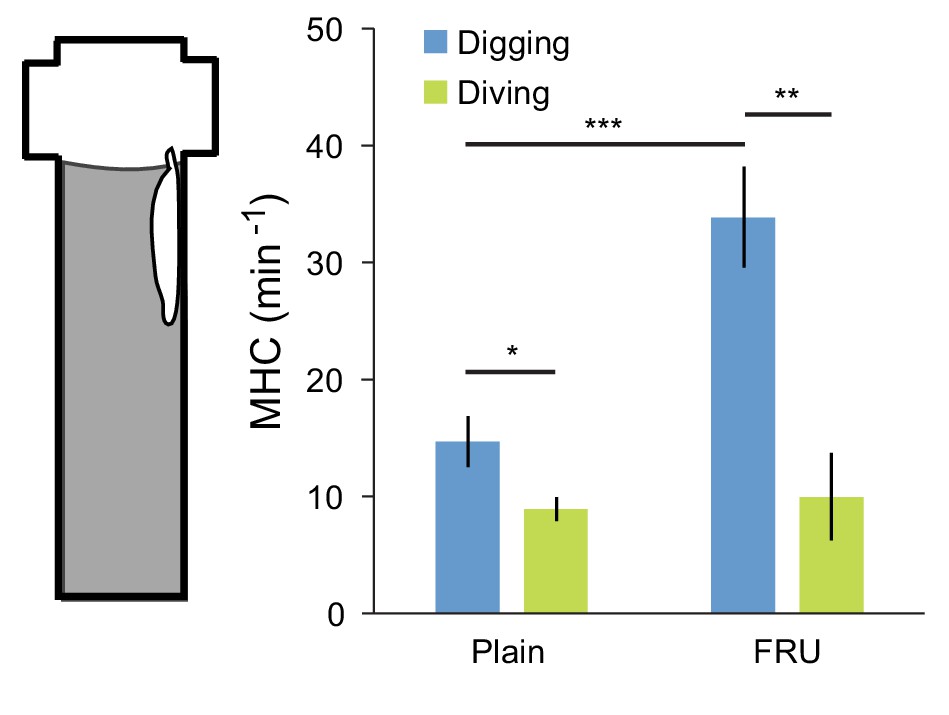
Feeding behavior is mostly associated with digging.
Feeding is monitored through the rate of mouth hook contraction (MHC). Patterns of MHC were manually identified from the behavior of 6 independent larvae monitored in the dig-and-dive assay. Quantification of the rate of MHC was conditioned to the behavioral mode of the larva, either digging or diving (see illustrative movie sequence in Video 9). Two different types of agarose substrates were tested: 0.4% agarose with and without fructose (FRU) (mean ± s.e.m., n = 30 digging sequences of 1 min for the plain and FRU conditions; n = 24 and 9 full dives for the plain and FRU conditions, respectively). In the statistical test, Student’s t-test, the significance levels of the statistics are indicated as *p<0.05, **p<0.01, and ***p<0.001.
Figure 6 with 1 supplement
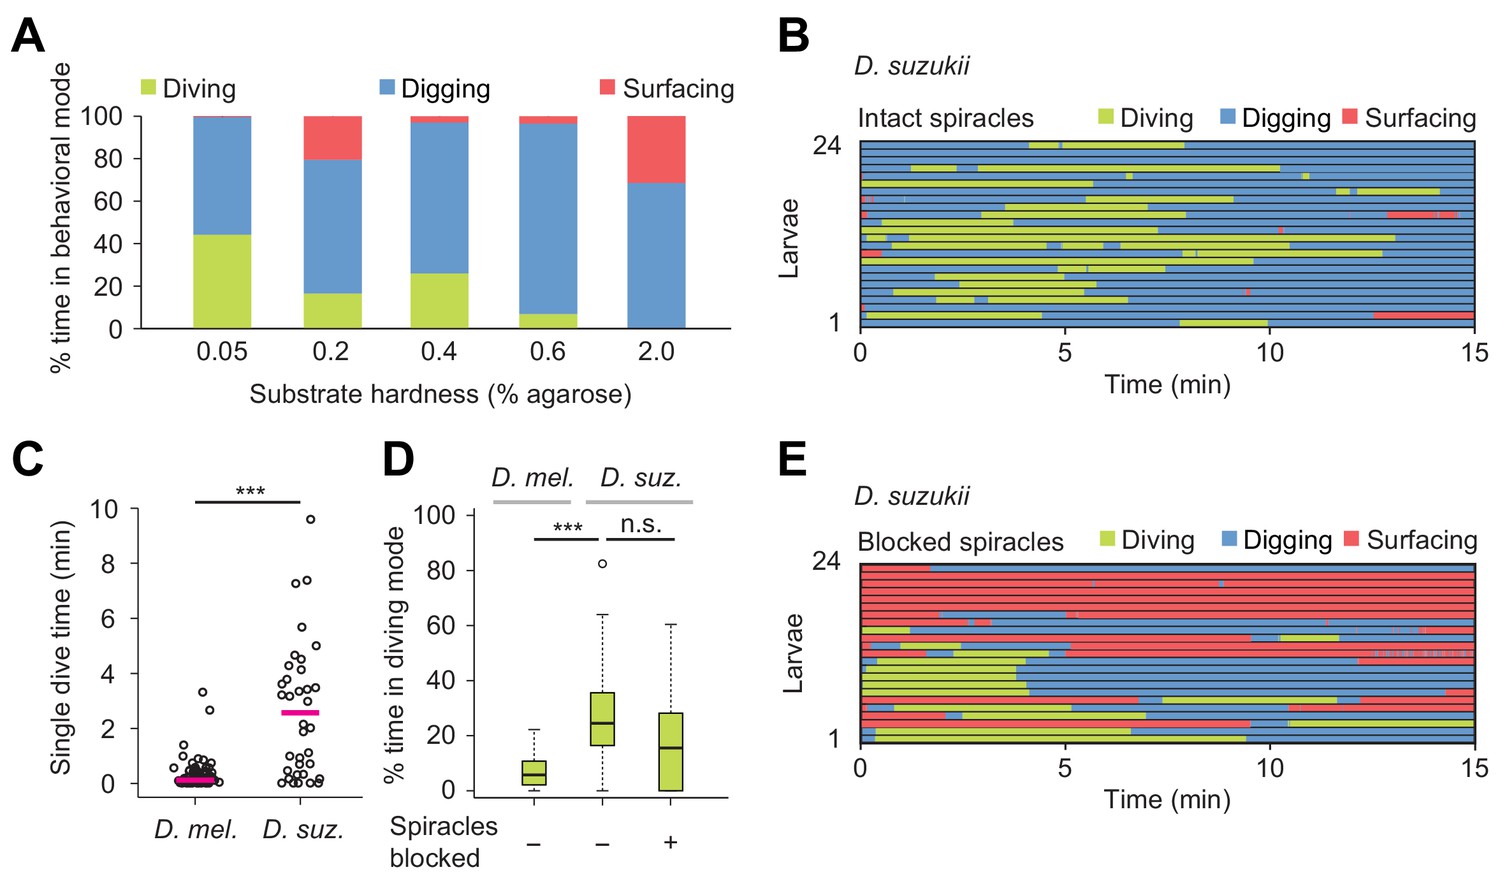
Effects of substrate hardness and respiration on the exploratory behavior of Drosophila suzukii larvae.
(A) Percentages of time in the three behavioral modes observed in gels with different percentages of agarose. (B) Ethogram over time of intact larvae of the Drosophila suzukii group (n = 24 trials). Average number of dives per trial is 1.9 ± 1.5 (mean ± s.d.). (C) Duration of single dives of D. melanogaster and D. suzukii larvae with intact spiracles (Wilcoxon rank-sum test, n = 98 and 45 dives, respectively). (D) Percentages of total time spent in diving mode of D. melanogaster with intact spiracles compared to D. suzukii larvae with intact and blocked posterior spiracles (Wilcoxon rank-sum test). (E) Ethogram of the D. suzukii larvae with blocked posterior spiracles (n = 23 trials). Trials were sorted by increasing total dive times. Average number of dives per trial is 1.0 ± 0.9 (mean ± s.d.). For (C) and (D), significance levels of the statistics are indicated as ***p<0.001. Results shown in panels (C) and (D) for D. melanogaster arise from the same dataset as Figure 4. For more information about the statistics, see Supplementary file 1.
Figure 6—figure supplement 1
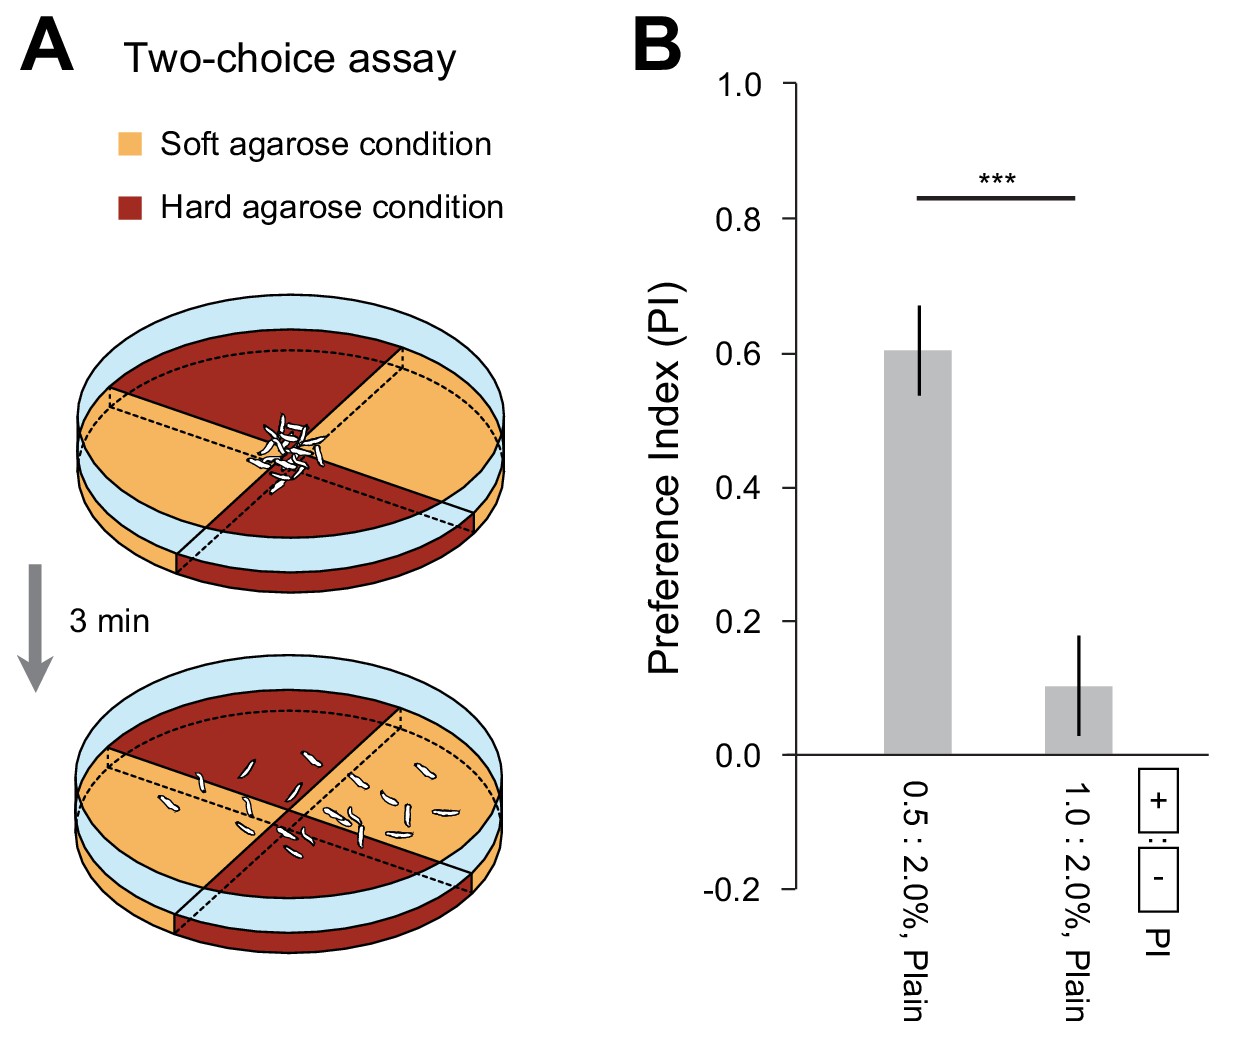
D. suzukii larvae display a preference for soft substrates.
(A) Schematic of the two-choice assay featuring quadrant pairs with soft and hard agarose gels. (B) The preference index (PI) was quantified in the two-choice assay (mean ± s.e.m., n = 10 repetitions, Student’s t-test). The two experimental conditions tested were: (0.5 vs. 2.0% plain agarose) and (1.0 vs. 2.0% plain agarose). The significance level of the statistics is indicated as ***p<0.001.
Figure 7 with 1 supplement
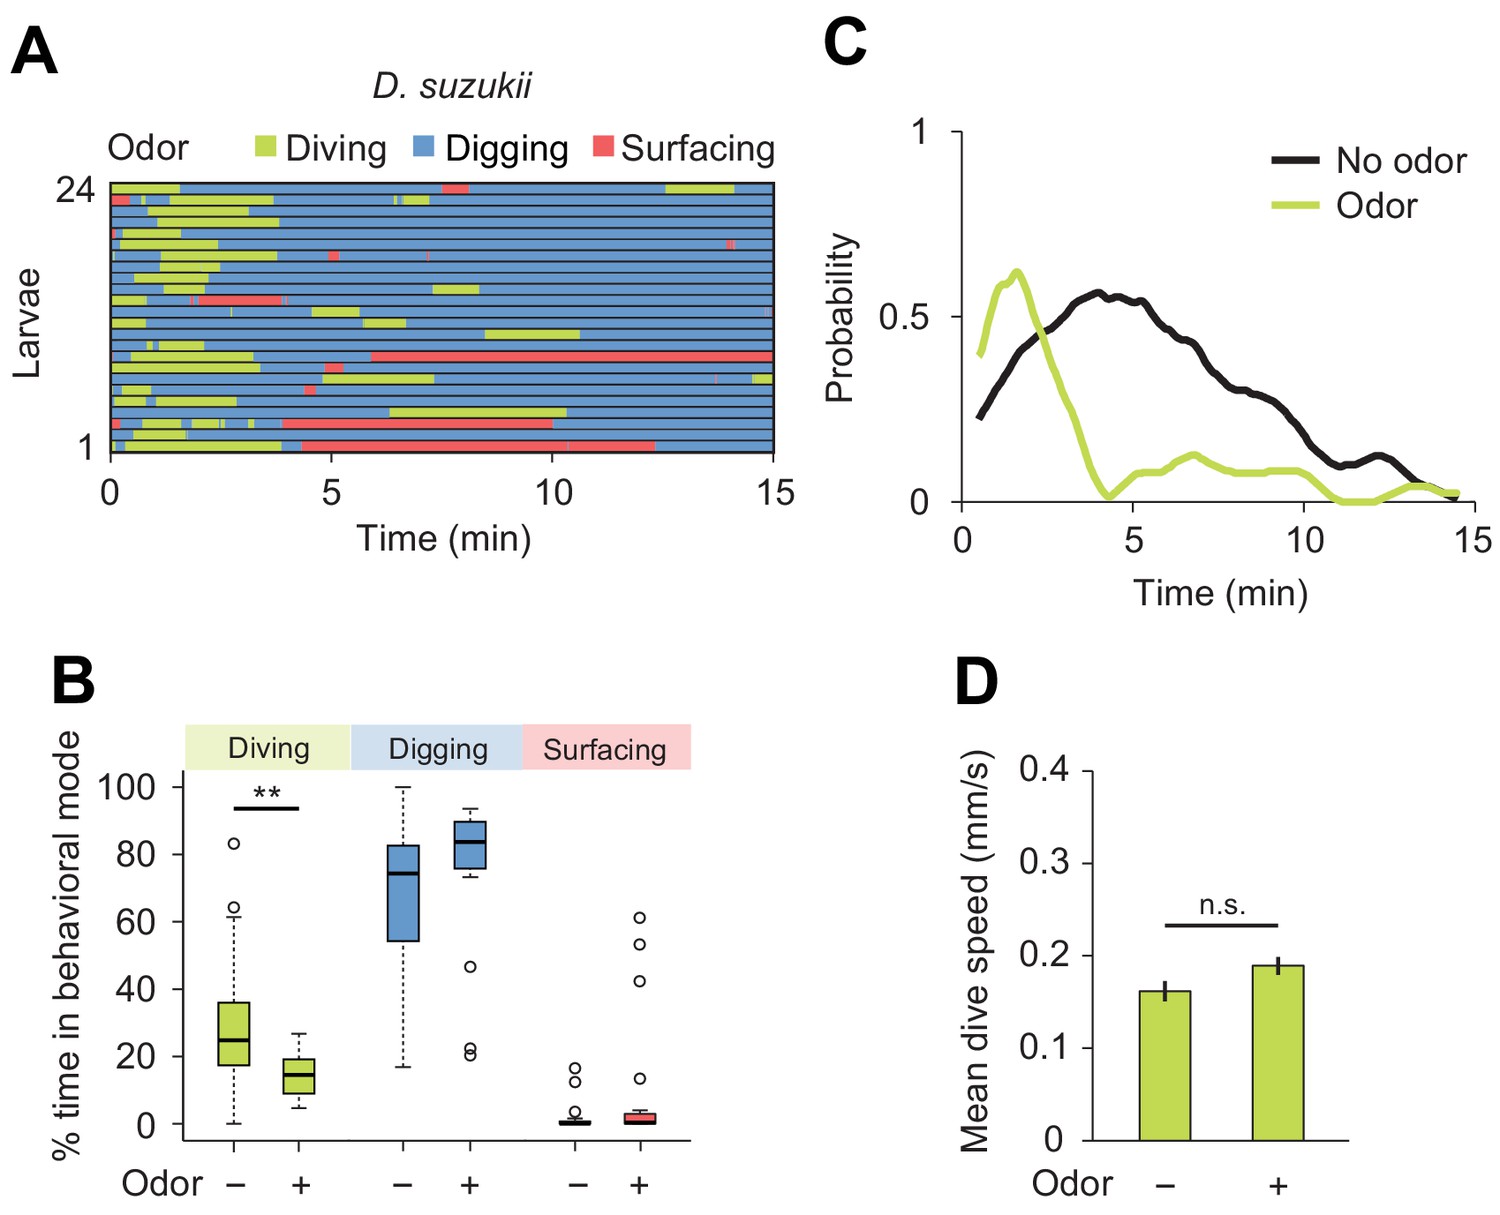
Behavioral responses of Drosophila suzukii larvae to an attractive odor (ethyl acetate).
(A) Ethograms in assay filled with agarose where 1 µL of odor (40 mM ethyl acetate, EtA) injected at 11 mm depth below the surface of the gel (n = 24 trials). Average number of dives per trial is 2.0 ± 1.1 (mean ± s.d.). (B) Percentages of total time spent in behavioral modes (Wilcoxon rank-sum test, n = 24 trials). (C) Time course of probability of diving with total number of larvae without (black) and with (green) the odor. A sliding window of 1 min was applied. (D) Mean dive speed of larvae (means ± s.e.m., n = 45 and n = 48 dives, Student’s t-test). For (B) and (D), significance levels of the statistics are indicated as **p<0.01 and n.s. for not significant. More information about the statistics is given in Supplementary file 1.
Figure 7—figure supplement 1
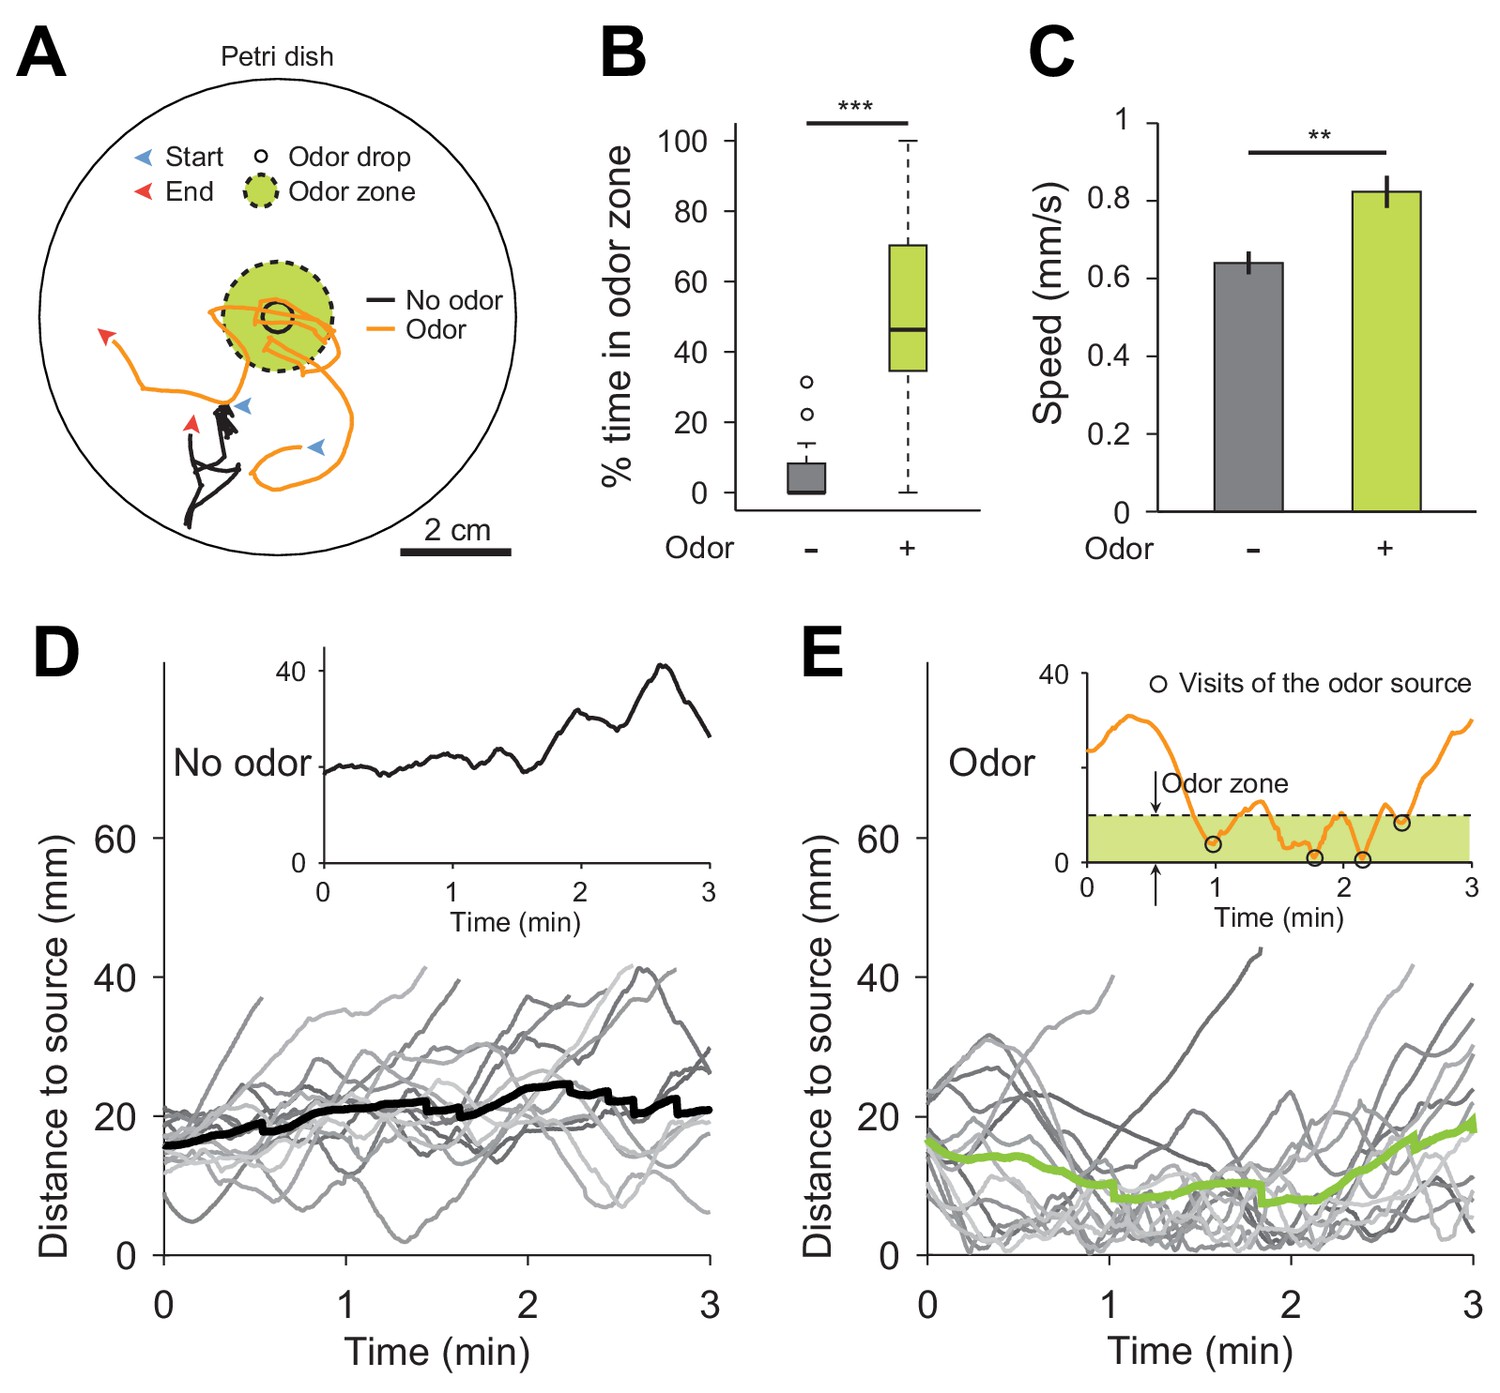
Drosophila suzukii larvae are attracted by the airborne food-odor ethyl acetate.
(A) Illustration of 2D chemotaxis assay based on a Petri dish. Single larvae were placed at a radial distance of 2 cm from the center of the bottom dish with initial orientation towards the center. For the odor stimulation, 3 μL of a solution of 40 mM ethyl acetate diluted in paraffin oil was applied at the center of the lid. The lid was then inverted on top of the bottom part of the dish, which was coated by a thin agarose layer (1% w/v). The odor gradient was established for 30 s before a single larva was introduced at the bottom of the dish. Trajectory of the centroid of the larva was recorded for 3 min. Two examples of trajectories in no-odor (black solid line) and odor (orange solid line) conditions are illustrated in panel a. (B) Percentage of time spent in the odor zone defined as a circular area with a radius of 1 cm from the center of dish (Wilcoxon rank-sum test, n = 15 trials). (C) Crawling speeds of larvae (means ± s.e.m., Student’s t-test, n = 15 trials). (D) Time course of the distance of the larva to the source in the absence of odor. The thin gray lines represent individual larvae and the thick solid line represents the average distance. The insert illustrates the time course of the distance to source for the larval trajectory in a. (E) Same as (D) in presence of the odor droplet. Larvae visited the odor source more than a couple of times as shown in the example at the top. Significance levels are indicated as **p<0.01 and ***p<0.001.
Figure 8 with 2 supplements
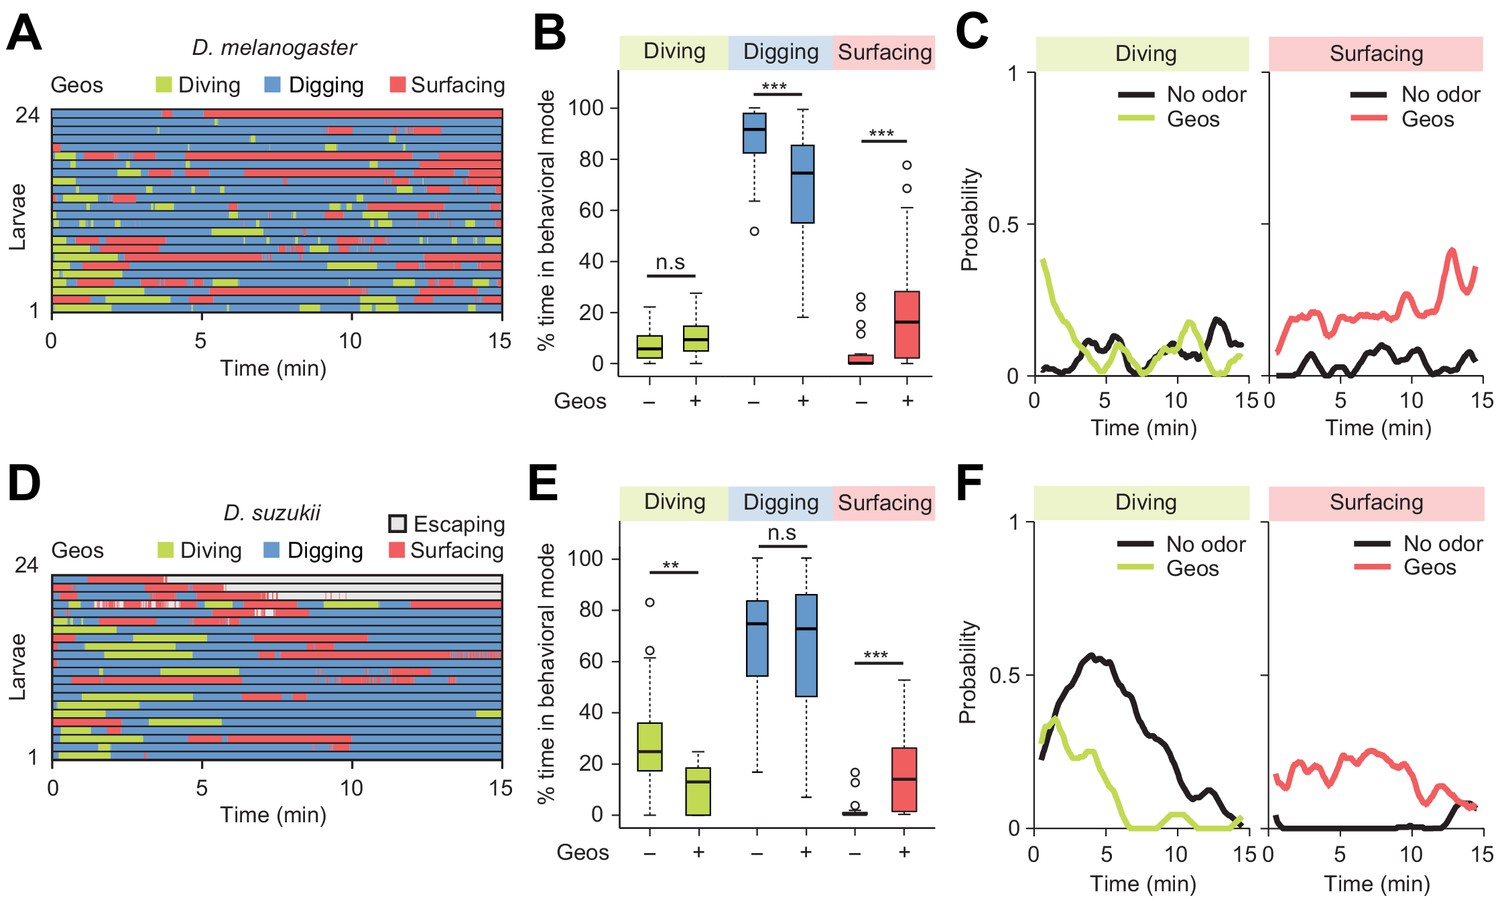
Behavioral responses to an aversive odor (geosmin) in two different Drosophila species.
(A, D) Ethograms of D. melanogaster and D. suzukii larvae in the presence of 1 µL of 0.5 mM geosmin (Geos) injected at a depth of 11 mm below the surface of the gel (n = 24 and n = 22 trials). Average numbers of dives per trial are 3.7 ± 3.1 and 1.2 ± 1.1 (mean ± s.d.). (B, E) Percentages of total time spent in behavioral modes for different species. D. melanogaster in (B) and D. suzukii in (E) (Wilcoxon rank-sum test). (C, F) Time courses of probability of diving and surfacing with total number of larvae without and with the odor. D. melanogaster in (C) and D. suzukii in (F). A sliding window of 1 min was applied. Significance levels of the statistics are indicated as **p<0.01, ***p<0.001, and n.s. for not significant. For more information about the statistics, see Supplementary file 1.
Figure 8—figure supplement 1

Repulsive responses induced by stimulations with geosmin in the dig-and-dive assay.
(A) Probability density functions (PDFs) of the centroid depth of Drosophila melanogaster tested in absence (No odor) and in presence (Odor) of geosmin at 11 mm depth of chamber. The arrow indicates the position of larvae in ‘surfacing’ mode that actively stood away from the gel surface. We associate this behavior with repulsion to geosmin. (B) Same as for Drosophila suzukii larvae. The odor stimulation increased the probability density of larval position above the agarose gel (illustrated as the dashed line) compared to the no-odor condition. In contrast with panel (A), we observe that the distribution of D. suzukii has a less pronounced peak above the surface compared to D. melanogaster. We speculate this reduced accumulation of positions above the surface is due to the higher rate of escapes from the chamber (upon escape, the position of a larva is not included in the distribution). Upon stimulation by the odor, we notice that the PDF of the centroid of D. suzukii was reduced at deep depth, indicating a decrease in exploration during diving.
Figure 8—figure supplement 2

Response of Drosophila suzukii larvae to DEET in the dig-and-dive assay.
(A) Ethograms of larvae tested in presence of the insect repellent DEET (n = 24 trials). A small quantity (1 μL) of 10 mM DEET was injected at a depth of 11 mm in the agarose chamber. (B) Percentages of total time spent in behavioral modes in absence (-) and presence (+) of the repellent (Wilcoxon rank-sum test, n = 24 and 24 trials, respectively). (C) Percentage of larvae that escaped the assay as a result of the repulsion induced by DEET. Significance level of statistical tests indicated as *p<0.05 and ***p<0.001.
Videos
Video 1
Exploratory behavior of D. melanogaster larvae in dig-and-dive chambers containing 0.05% plain agarose gel.
Replay speed is 10 times faster than the original behavior.
Video 2
Exploratory behavior of D. melanogaster larvae in dig-and-dive chambers containing 2.0% plain agarose gel.
Replay speed is 10 times faster than the original behavior.
Video 3
Crawling behavior of intact D. melanogaster larvae on a 2% plain agarose gel.
Replay speed is real time.
Video 4
Crawling behavior of D. melanogaster larvae with blocked posterior spiracles.
Larvae were tested on a 2% plain agarose gel similar to Video 3. Replay speed is real time.
Video 5
Exploratory behavior of D. melanogaster larva in a dig-and-dive chamber containing 0.4% plain agarose gel.
Replay speed is 10 times faster than the original behavior.
Video 6
D. melanogaster larva in a dig-and-dive chamber containing 0.4% plain agarose gel with a stable gradient of ethyl acetate (EtA).
The presence of the odor induces more frequent, longer, and deeper dives. Replay speed is 10 times faster than the original behavior.
Video 7
Exploratory behavior of D. suzukii larvae in dig-and-dive chambers filled with a 0.05% plain agarose gel.
Replay speed is 10 times faster than the original behavior.
Video 8
Exploratory behavior of D. suzukii larvae in dig-and-dive chambers filled with a 2% plain agarose gel.
Replay speed is 10 times faster than the original behavior.
Video 9
D. melanogaster larva in a dig-and-dive chamber containing 0.4% agarose gel mixed with fructose (1.5 M).
A sequence of digging and diving motions is presented (real-time speed). The movie correspond to a sequence of 99 s excerpted from a 15 min trial. Transitions between behavioral modes are indicated by a 2-s banner at the bottom of the movie.
Additional files
-
Supplementary file 1
Tables summarizing the conditions and results of the statistical tests conducted throughout the manuscript.
- https://doi.org/10.7554/eLife.27057.033
-
Transparent reporting form
- https://doi.org/10.7554/eLife.27057.034
Download links
A two-part list of links to download the article, or parts of the article, in various formats.
Downloads (link to download the article as PDF)
Open citations (links to open the citations from this article in various online reference manager services)
Cite this article (links to download the citations from this article in formats compatible with various reference manager tools)
Species-specific modulation of food-search behavior by respiration and chemosensation in Drosophila larvae
eLife 6:e27057.
https://doi.org/10.7554/eLife.27057


