Mechanism of bidirectional thermotaxis in Escherichia coli
- Max Planck Institute for Terrestrial Microbiology and LOEWE Research Center for Synthetic Microbiology, Germany
- Zentrum für Molekulare Biologie der Universität Heidelberg, Germany
- University of Toronto, Canada
- University of California, United States
- Ben Gurion University of the Negev, Israel
- Princeton University, United States
Figures
Figure 1 with 3 supplements
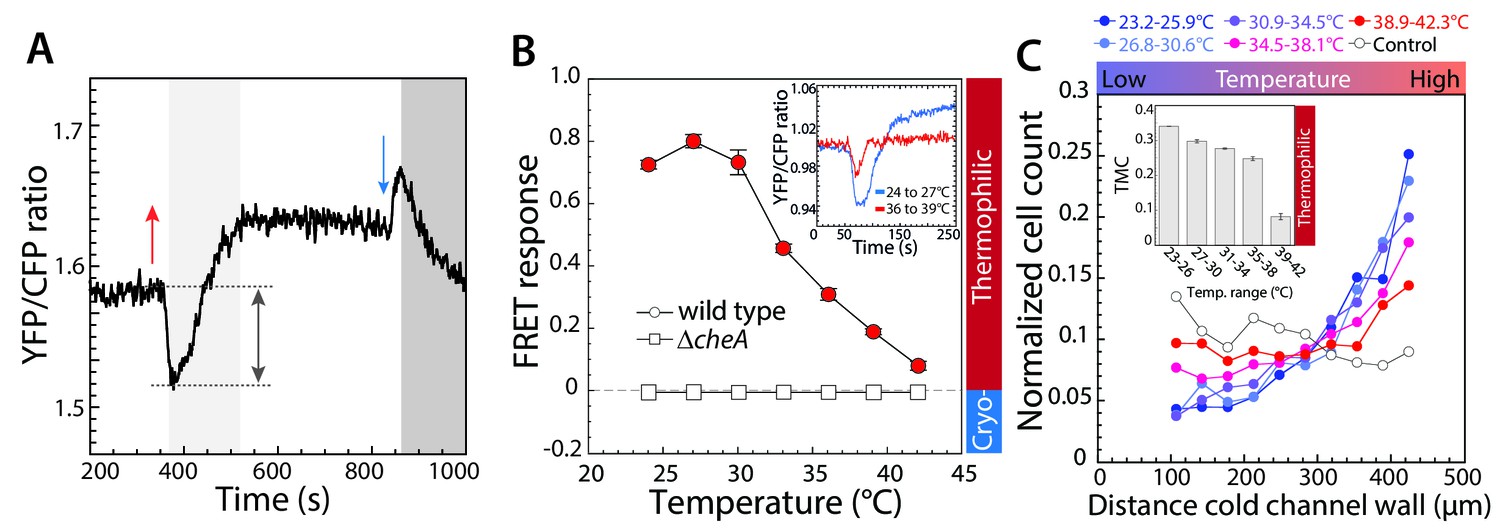
Thermotactic response of wild-type E.coli in absence of chemical ligands.
(A,B) The intracellular kinase activity of CheA was measured using an in-vivo CheY phosphorylation assay based on fluorescence resonance energy transfer (FRET) between CheY-YFP and CheZ-CFP (see Materials and methods). (A) A typical FRET measurement, where the YFP/CFP ratio reflects decrease of CFP fluorescence and increase of YFP fluorescence due to energy transfer within a complex formed by phosphorylated CheY-YFP and CheZ-CFP, with complex formation proportional to the activity of CheA. The initial response of wild-type cells adapted in buffer to a temperature increase of 9°C (red arrow) is an attractant-like response (i.e., decrease in CheA activity), while the subsequent decrease of temperature (blue arrow) elicits a repellent-like response (i.e., increase in CheA activity). CheA activity is subsequently restored to the basal level by CheR and CheB-dependent methylation (light grey area) and demethylation (dark grey area). Note the general increase in the basal YFP/CFP ratio with temperature is due to its differential effect on YFP and CFP fluorescence. (B) The amplitude of the initial response (grey arrow in A) was used to quantify the pathway response of buffer-adapted cells to a 3°C stepwise increment of temperature in wild-type and ΔcheA cells as indicated. The response was normalized to the maximal response obtained upon stimulation with saturating concentration (1 mM) of the chemical attractant MeAsp at 21°C. For data points in all figures of this type, thermophilic responses (downregulation of the YFP/CFP ratio) are highlighted in red, cryophilic responses (upregulation of the YFP/CFP ratio) are highlighted in blue, and no significant response is indicated in white. Means of at least three independent experiments and the corresponding standard errors are shown as a function of initial temperature for each step. Inset: An example of the FRET response to an increase of temperature from 24° to 27°C (blue) and from 36° to 39°C (red). Here, for convenience the mean initial YFP/CFP ratio was normalized to one for both measurements. (C) Quantification of the thermotactic response of buffer-adapted cells in a microfluidics device with indicated temperature gradients, with lower temperature at the left channel wall. As a control (white circles) no gradient was applied. Cell counts at different positions of the microfluidic channel were determined and the data were normalized as described in Materials and methods. The inset shows the thermal migration coefficient (TMC) that characterizes drift in the temperature gradient, calculated from three independent experiments (such as that shown in the main panel). Positive values of TMC correspond to thermophilic response, whereas negative values of TMC correspond to cryophilic response.
-
Figure 1—source data 1
Source data for Figure 1B.
- https://doi.org/10.7554/eLife.26607.007
-
Figure 1—source data 2
Source data for Figure 1C.
- https://doi.org/10.7554/eLife.26607.008
-
Figure 1—source data 3
Source data for Figure 1—figure supplement 2B.
- https://doi.org/10.7554/eLife.26607.009
Figure 1—figure supplement 1

Thermotaxis assays for E.coli.
(A,B) Schematic representations of the FRET microscopy (A) and microfluidics (B) setups used in temperature stimulation experiments. Lower right graph in (B) shows typical trajectories for cells swimming in the channel, where the distance to the cold channel wall (X-position) was used for calculating the TMC (see Materials and methods). (C–E) Examples of FRET measurements of response of wild-type cells to chemical attractants (C) and to temperature (D), with temperature response of ΔcheA shown as a negative control (E). Upper panels show fluorescence of individual YFP and CFP channels, while lower panels show the normalized YFP/CFP ratio. Arrows highlight 3°C stepwise increase to the indicated temperatures in FRET experiments. Insets in (E) for ΔcheA illustrate the direct effect of temperature on fluorescence of YFP and CFP and on the YFP/CFP ratio, respectively.
Figure 1—figure supplement 2
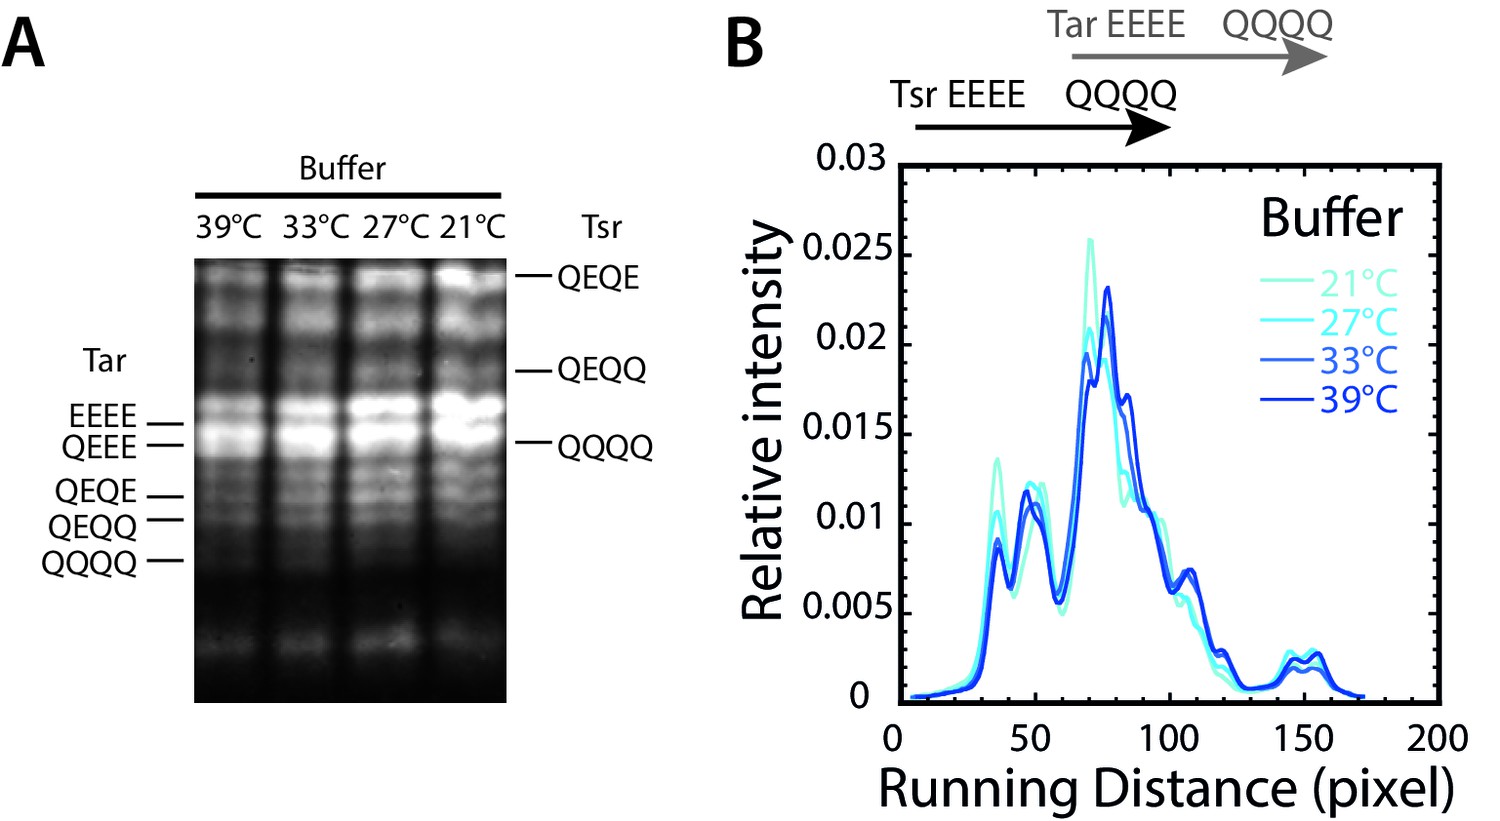
Temperature dependence of receptor methylation in buffer.
(A) Distribution of methylation states of Tar and Tsr in wild-type cells adapted to different temperatures, determined by receptor mobility on the SDS-PAGE gel (see Materials and methods). Mobility of Tar and Tsr in defined modification states (with indicated numbers of glutamine/glutamate substitutions) is indicated. Additional peaks correspond to receptors with different sites of the modified residues. (B) Corresponding lane intensity profiles, quantified as described in Materials and methods.
Figure 1—figure supplement 3
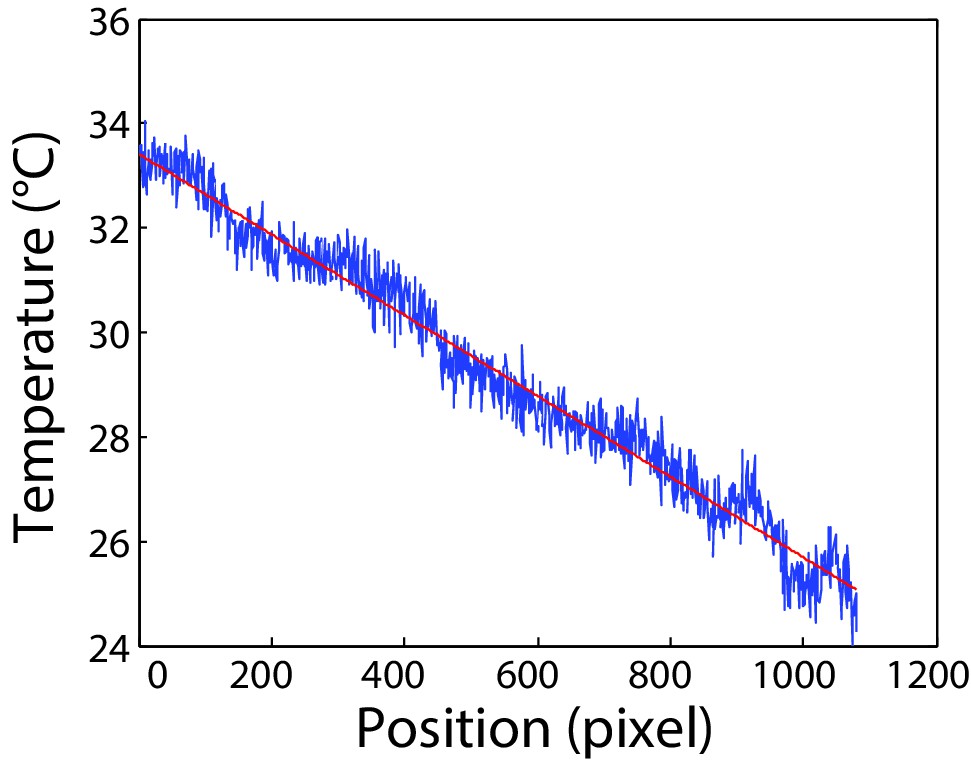
Calibration of the microfluidics device.
Calibration of temperature gradient along the microfluidic channel. Measurement was done as described in Materials and methods in the channel area used for cell tracking. One pixel correspond to 0.3 µm. Red line indicates linear fit to the data used for calibration.
Figure 2 with 2 supplements
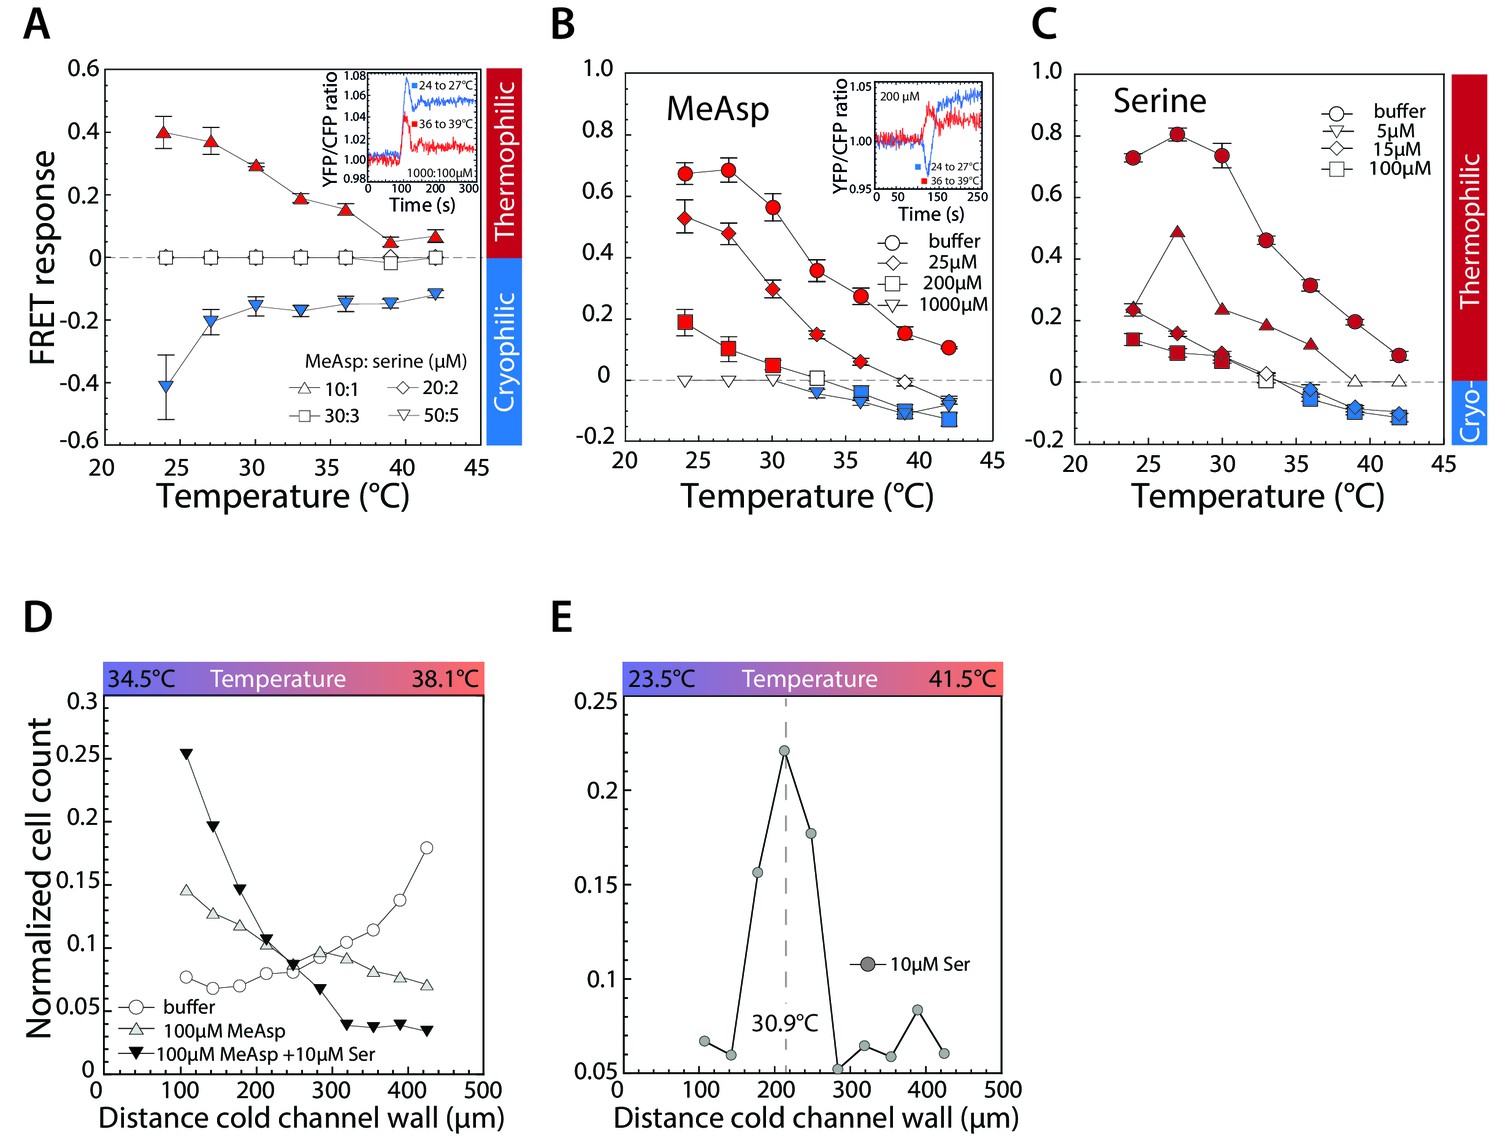
Thermotactic response of wild-type E.coli in presence of chemical ligands.
(A–C) FRET measurements of the pathway response to 3°C steps of temperature after adaptation to a combination of indicated concentrations (in µM) of MeAsp and serine (A); only to MeAsp (B); or only to serine (C). At a 10:1 ratio of MeAsp:serine in (A) both receptors are stimulated approximately equally. Insets: Examples of individual measurements for indicated temperature steps and attractant concentrations. Thermophilic and cryophilic responses are indicated by red and blue symbols, respectively. Absence of response is indicated in white. Data are means of at least three independent experiments and the respective standard errors are displayed. (D,E) Thermotactic responses in a microfluidics device, measured as in Figure 1C for wild-type cells adapted to indicated levels of serine and or MeAsp in a 34.5° to 38.1°C temperature gradient (D) or adapted to 10 µM serine in a 23.5° to 41.5°C temperature gradient (E). Dashed line in (E) indicates cells’ accumulation point in the gradient.
-
Figure 2—source data 1
Source data for Figure 2A.
- https://doi.org/10.7554/eLife.26607.013
-
Figure 2—source data 2
Source data for Figure 2B.
- https://doi.org/10.7554/eLife.26607.014
-
Figure 2—source data 3
Source data for Figure 2C.
- https://doi.org/10.7554/eLife.26607.015
-
Figure 2—source data 4
Source data for Figure 2D.
- https://doi.org/10.7554/eLife.26607.016
-
Figure 2—source data 5
Source data for Figure 2E.
- https://doi.org/10.7554/eLife.26607.017
-
Figure 2—source data 6
Source data for Figure 2—figure supplement 1A.
- https://doi.org/10.7554/eLife.26607.018
-
Figure 2—source data 7
Source data for Figure 2—figure supplement 1B.
- https://doi.org/10.7554/eLife.26607.019
-
Figure 2—source data 8
Source data for Figure 2—figure supplement 1C.
- https://doi.org/10.7554/eLife.26607.020
-
Figure 2—source data 9
Source data for Figure 2—figure supplement 1D.
- https://doi.org/10.7554/eLife.26607.021
-
Figure 2—source data 10
Source data for Figure 2—figure supplement 1E.
- https://doi.org/10.7554/eLife.26607.022
-
Figure 2—source data 11
Source data for Figure 2—figure supplement 2A.
- https://doi.org/10.7554/eLife.26607.023
-
Figure 2—source data 12
Source data for Figure 2—figure supplement 2B.
- https://doi.org/10.7554/eLife.26607.024
-
Figure 2—source data 13
Source data for Figure 2—figure supplement 2C.
- https://doi.org/10.7554/eLife.26607.025
Figure 2—figure supplement 1
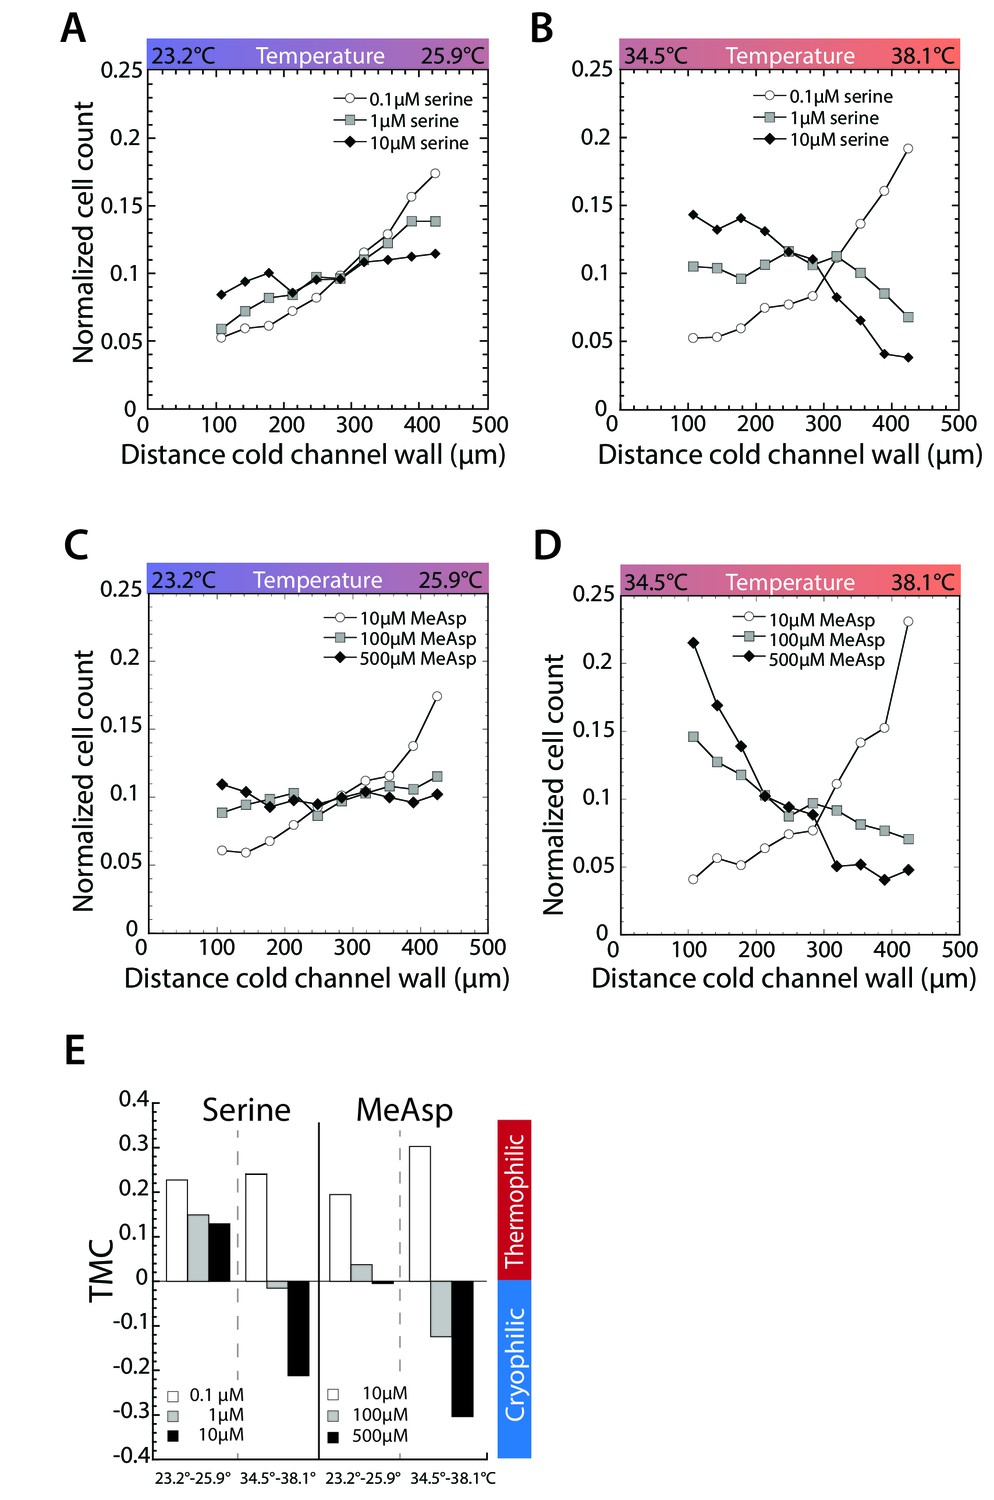
Asymmetric stimulation of receptors leads to thermophilic response at low temperature and cryophilic response at high temperature.
(A–D) Thermotactic behavior of wild-type cells adapted to the indicated serine concentrations in a gradient from 23.2 to 25.9 C (A) or 34.5°C to 3.18°C (B) or to the indicated MeAsp concentrations in a gradient from 23.2°C to 25.9°C (C) or 34.5°C to 38.1°C (D). Measurements were done as in Figure 1C.(E) TMC calculated from cell distribution in thermal gradients at indicated concentrations of serine and MeAsp and temperature gradients. Negative TMC indicates cryophilic response; positive TMC indicates thermophilic response.
Figure 2—figure supplement 2
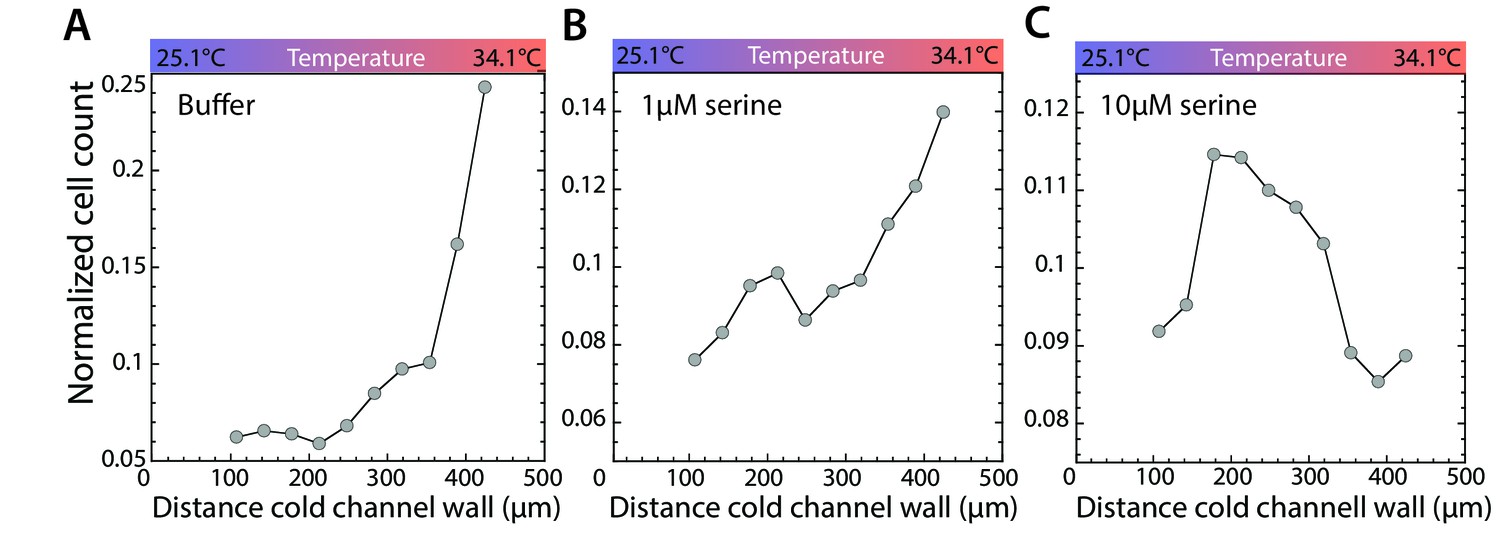
Stimulation of Tsr leads to accumulation in a temperature gradient.
(A–C) Thermotactic behavior of wild-type cells adapted to buffer (A), 1 µM (B), or 10 µM serine (C) in a temperature gradient from 25.1°C to 34.1°C. Measurements were done as in Figure 1C.
Figure 3 with 5 supplements
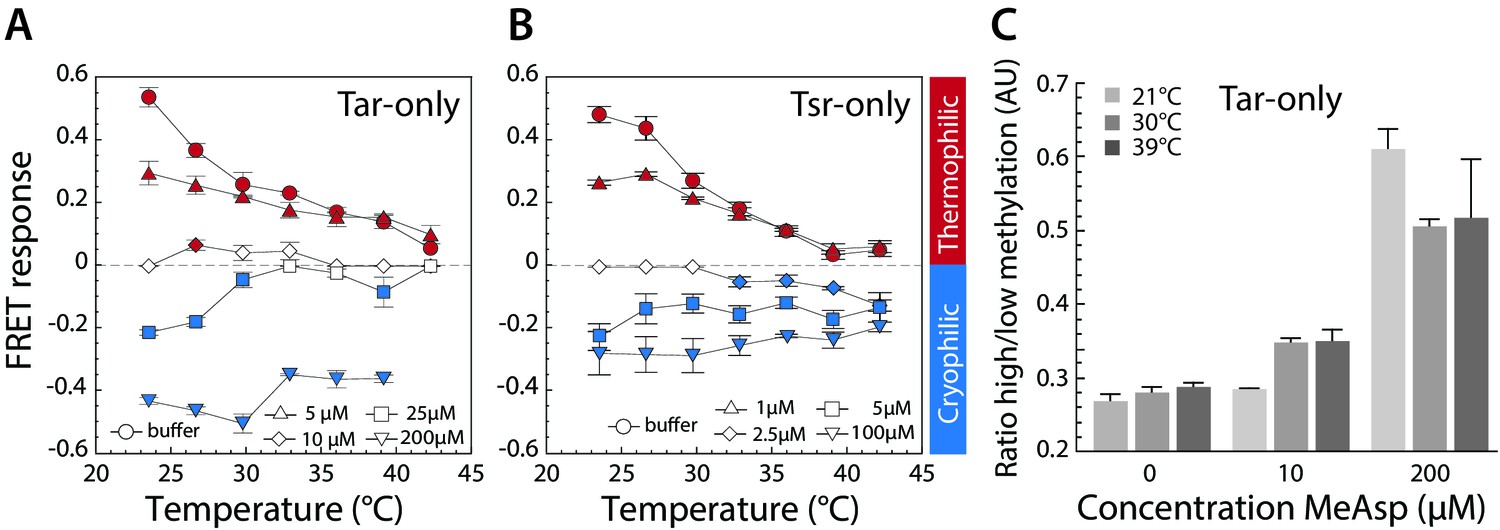
Thermotactic response of Tar- and Tsr-only strains.
(A,B) FRET measurements of the pathway response in receptorless E. coli strains expressing Tar (A) or Tsr (B) as the sole receptor from a plasmid. Cells were adapted to the depicted concentrations of MeAsp (A) or serine (B). Thermophilic, cryophilic or no responses are highlighted in red, blue and white, respectively. Data are means of at least three independent experiments and the standard error is displayed. (C) Methylation levels of Tar in Tar-only cells adapted to buffer or indicated levels of MeAsp at the depicted temperatures. Methylation was determined according to receptor mobility in SDS-PAGE and quantified as the ratio of high to low states of methylation (see Figure 3—figure supplement 1). Data points are mean values from three independent experiments, with error bars representing standard errors.
-
Figure 3—source data 1
Source data for Figure 3A.
- https://doi.org/10.7554/eLife.26607.032
-
Figure 3—source data 2
Source data for Figure 3B.
- https://doi.org/10.7554/eLife.26607.033
-
Figure 3—source data 3
Source data for Figure 3C.
- https://doi.org/10.7554/eLife.26607.034
-
Figure 3—source data 4
Source data for Figure 3—figure supplement 3.
- https://doi.org/10.7554/eLife.26607.035
Figure 3—figure supplement 1

Methylation profiles of Tar-only cells at varying temperature and MeAsp levels.
Methylation was analyzed as in Figure 1—figure supplement 2 at the indicated temperatures and levels of MeAsp stimulation.
Figure 3—figure supplement 2
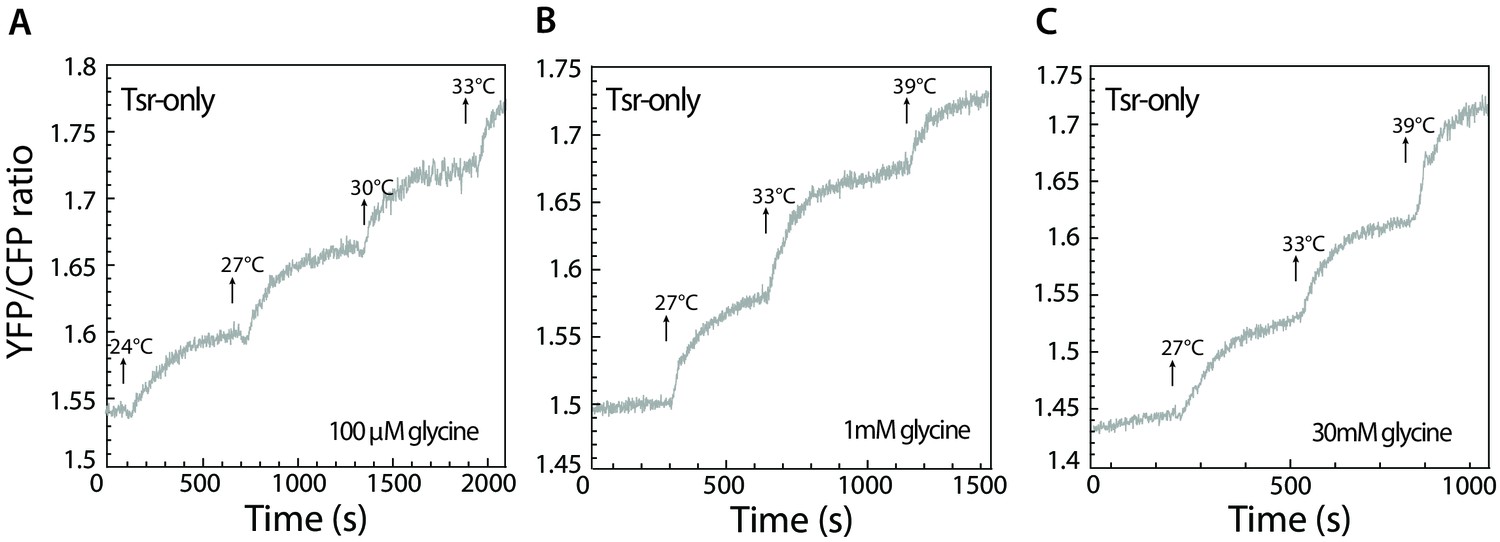
Tsr-mediated response in presence of glycine.
(A–C) Response to stepwise changes in temperature was measured using FRET for Tsr-only cells adapted to 100 µM (A), 1 mM (B), or 30 mM glycine (C). Because, in comparison to serine, glycine is a weak attractant for Tsr, glycine only weakens or abolishes the temperature response of Tsr at low concentrations (A and B) and leads to a very weak cryophilic response at high concentration (C).
Figure 3—figure supplement 3
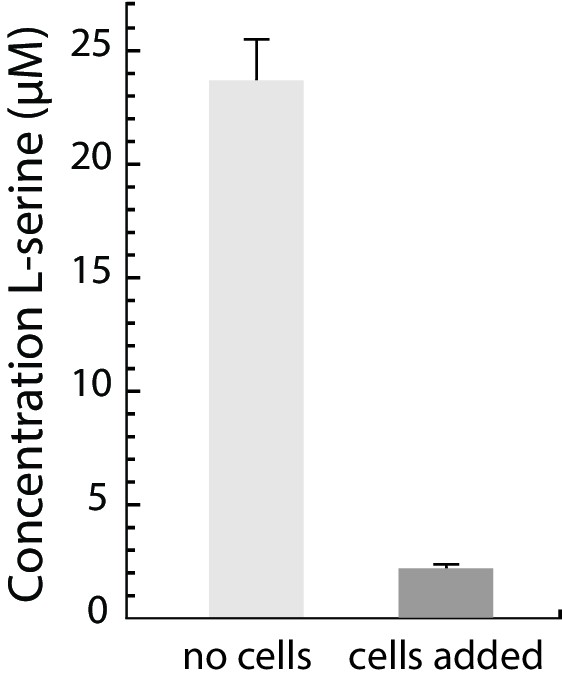
Serine is depleted from M9CG medium upon incubation with E. coli cells.
The serine concentration in M9CG medium and in M9CG medium incubated with E. coli cells for 40 min, analyzed by LC-MS/MS (see Supplementary material).
Figure 3—figure supplement 4
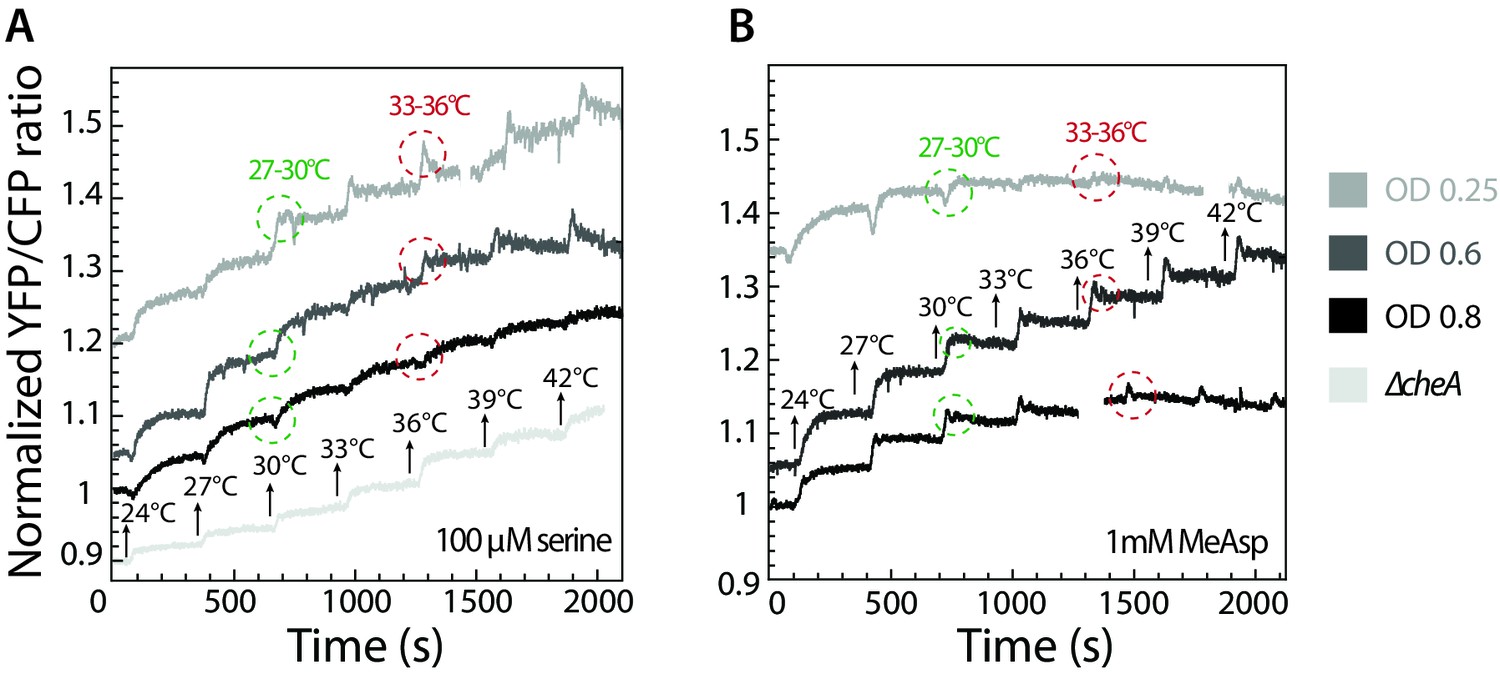
Inversion of thermotactic response depends on cell culture density.
(A–B) Thermotactic response was measured using FRET in wild-type cells grown to different optical densities and adapted to 100 µM serine (A) or 1 mM MeAsp (B). Note that the ratio of Tar to Tsr depends on the growth stage and is highest at low optical densities. Arrows indicate stepwise increase in temperature. Circles highlight the response to the same increase in temperature, from 27°C to 30°C (green) and from 33°C to 36°C (red). ΔcheA strain was used as a negative control (A).
Figure 3—figure supplement 5

Indirectly binding ligands do not invert thermotactic response.
(A–C) Response to stepwise changes in temperature was measured for cells adapted to 100 µM maltose (A), 100 µM galactose (B), or 1 µM dipeptide Pro-Leu (C).
Figure 4 with 2 supplements
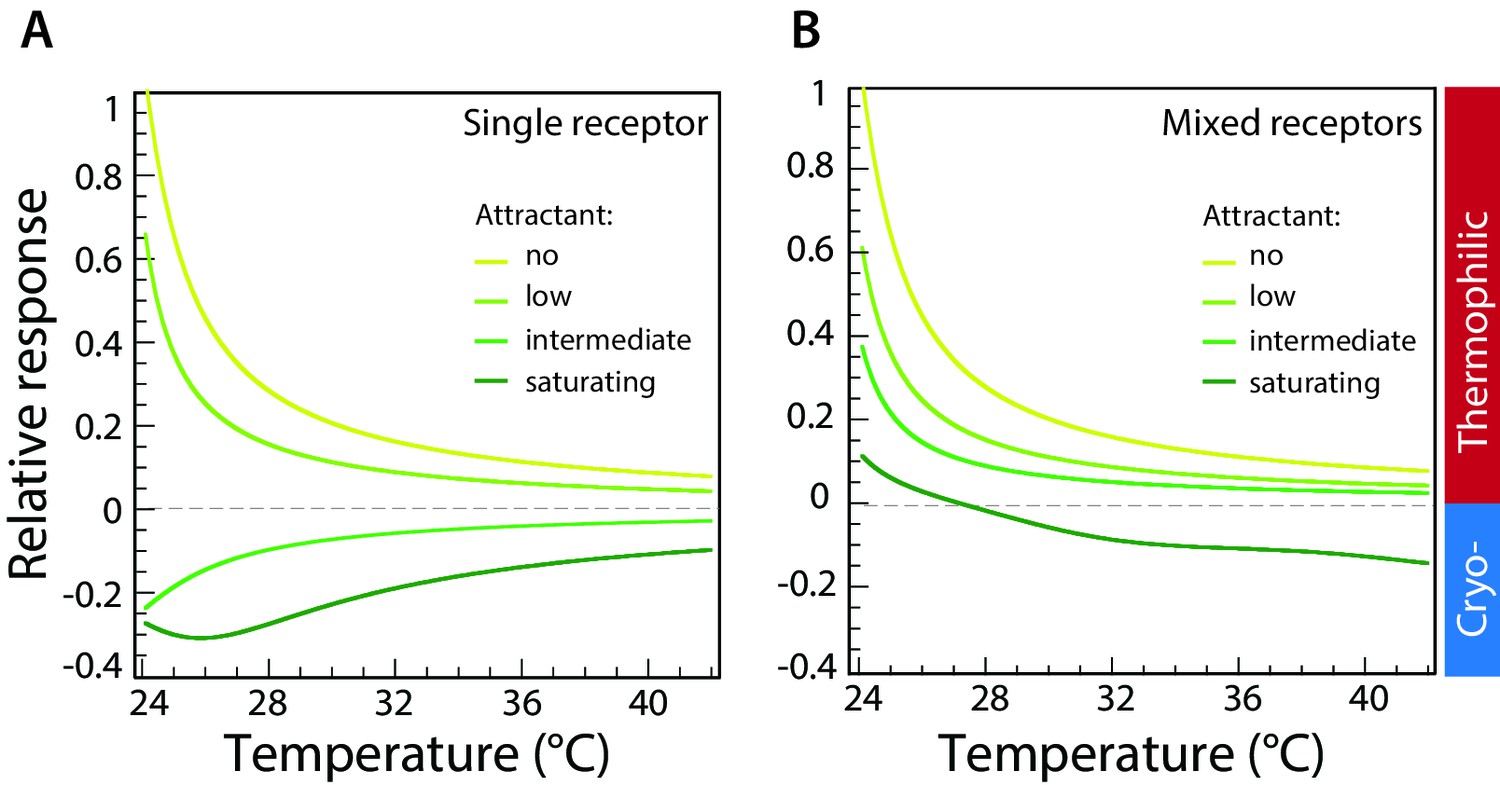
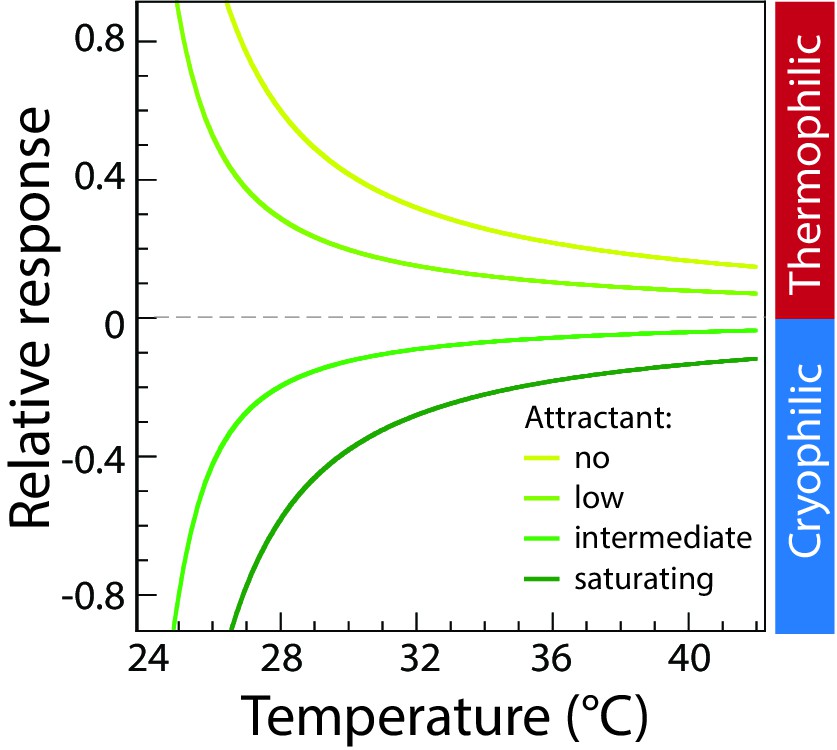
Computer simulations of thermotactic response.
(A) Thermotactic response of the chemosensory complexes was simulated for a single type of receptor (Tar) using a mathematical model described in Materials and methods. Compare to experimental data in Figure 3A. The thermotactic response is shown as a function of temperature. Simulations were performed in the absence of attractant (MeAsp) or in the presence of low, intermediate, or saturating concentrations of MeAsp, as indicated by different colors. (B) Simulated response for randomly mixed complexes of two receptor types (Tar and Tsr), with only Tar being stimulated by attractant. Compare to experimental data in Figure 2B. Simulations were performed as in (A) at varying levels of stimulation with MeAsp and assuming random mixing of equal amounts of Tar and Tsr within receptor trimers. The MeAsp concentration determines the values of the free-energy parameter for Tar, which are (0, 0.5, 1.5, 2.5), respectively (see Materials and methods) in (A), and (0, 1, 1.5, 15) in (B). The value of for Tsr in (B) is 0, independent of MeAsp concentration; other parameters are as specified in Materials and methods. Sidebar indicates regions corresponding to thermophilic or cryophilic responses. Note that the response inversion from thermophilic to cryophilic at saturating MeAsp stimulation in (B) is due to imperfect adaptation; no inversion is observed in case of perfect adaptation (see Figure 4—figure supplement 2).
Figure 4—figure supplement 1
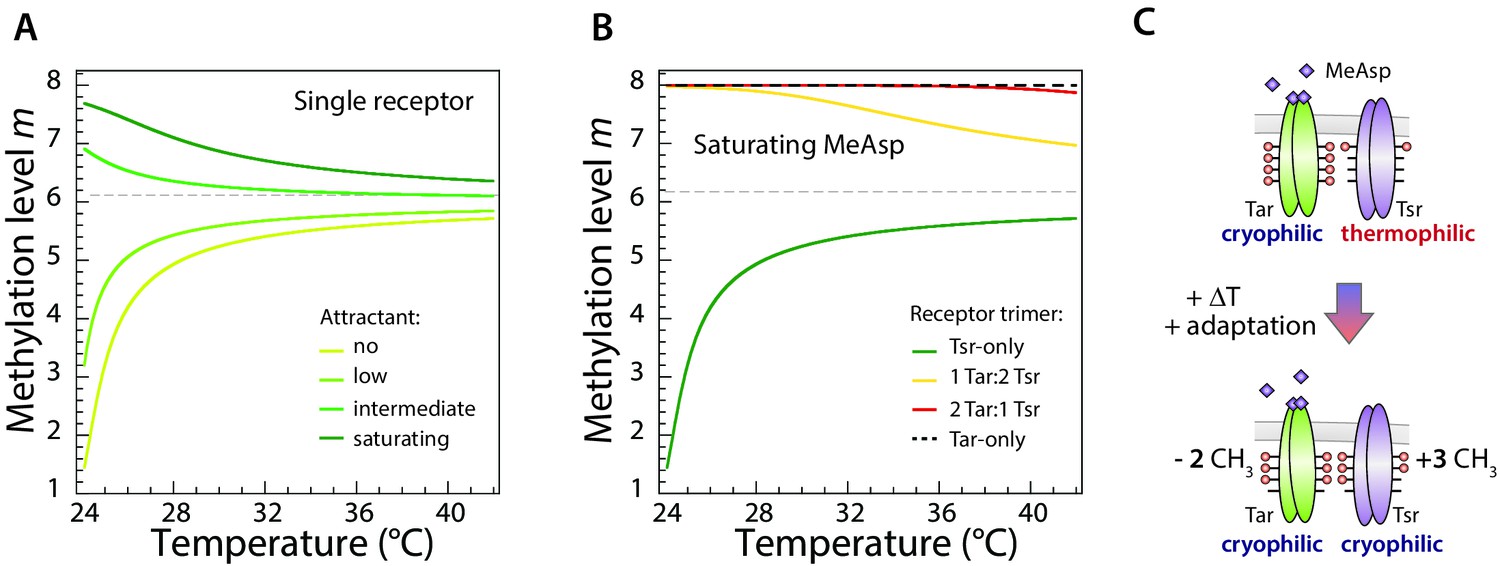
Average modeled methylation levels of receptors versus temperature for different concentrations of chemical attractant.
(A) Modeled adapted methylation levels of trimers of a single receptor type (Tar). Modeling was done using the same parameters as in Figure 4A, in the absence of attractant or at low, intermediate, and saturating attractant (MeAsp) concentrations, as indicated. As temperature increases, for all attractant concentrations, the per-receptor methylation level approaches the same asymptotic value, never crossing it. Thus the sign of the thermal response remains constant, implying the cell is either always cold seeking or always heat seeking, depending on the initial value of methylation. (B) Modeled methylation levels of different mixed-receptor trimers present in cells that display an accumulation temperature. With imperfect adaptation, the thermal response of mixed-receptor cells may change sign with temperature, giving rise to an accumulation temperature (dark green curve in Figure 4B). We plot the methylation levels of the four possible trimers (each consisting of 3 receptors): Tsr-only (green), 1Tar:2Tsr (yellow), 2Tar:1Tsr (red), and Tar-only (dashed black). Here Tar is stimulated with saturating level of MeAsp while Tsr remains unstimulated, with the same parameters as for the dark green curve in Figure 4B. At low temperature, the response is dominated by the heat-seeking Tsr-only trimer. As temperature is increased, its methylation level approaches the asymptotic high-temperature methylation level, and its response become weaker. On the other hand, the responses of the trimers that include stimulated Tar receptors only change slightly, as their methylation levels remain close to saturation, due to the slowing down of methylation in that regime. Eventually the response of these cold-seeking trimers overcomes that of the Tsr-only trimer, and the thermotactic response changes sign. (C) Schematic illustration of the change in methylation of Tar and Tsr dimers due to increase in temperature, in the presence of a high concentration of MeAsp. The methylated sites are highlighted as red circles. When methylation of Tar is close to saturation, Tar cannot adapt perfectly, meaning that upon temperature stimulation the methylation level of Tar changes less than the opposite methylation of Tsr (illustrated as different numbers of added/removed CH3 groups). This difference allows a net change in total receptor methylation and thus the change in the sign of the overall thermotactic response.
Figure 4—figure supplement 2
Modeled thermotactic response of mixed-receptor cells assuming perfect adaptation.
Simulations of the thermotactic response of mixed-receptor cells assuming perfect adaptation, were performed in the absence of attractant (MeAsp) or at low, intermediate and saturating attractant concentrations as indicated; characterized in the model by the parameter . The four curves, from the top down, correspond to = 0, 0.75, 1.75, 2.5, respectively, for one type of receptor, while = 0 for the other type of receptor. For the case of perfect adaptation, the thermotactic response does not change sign, but only decreases in magnitude with increasing temperature, similar to the behavior for a single receptor type. Sidebar indicates regions corresponding to thermophilic or cryophilic responses, respectively.
Figure 5 with 1 supplement
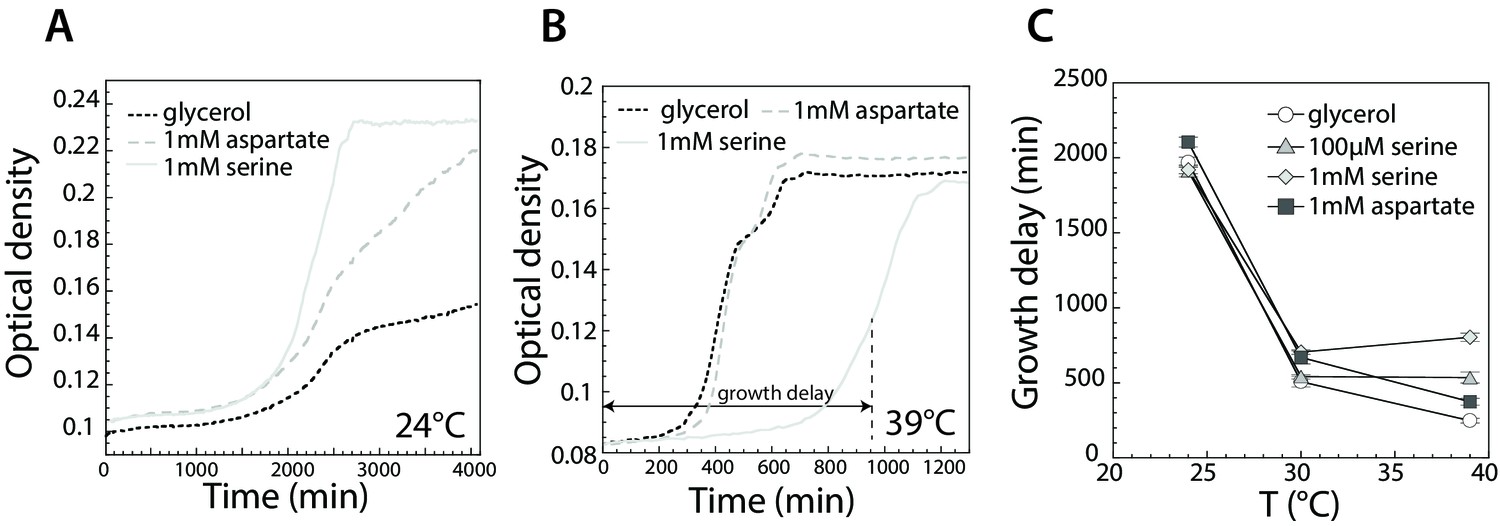
Effect of serine and aspartate on cell growth at different temperatures.
(A,B) Growth curves of E. coli MG1655 cells grown at 24°C (A) and 39°C (B) in M9 minimal medium supplemented with glycerol (0.2%) or with glycerol and 1 mM serine or aspartate, as indicated. Optical density was measured at 600 nm in the plate reader as described in Materials and methods. (C) Time until maximal growth rate achieved (highlighted by the grey arrow in (B)) was used to measure the delay in growth at indicated temperatures and amino acid concentrations. Data are means of at least six independent experiments and the respective standard error is displayed.
-
Figure 5—source data 1
Source data for Figure 5A.
- https://doi.org/10.7554/eLife.26607.041
-
Figure 5—source data 2
Source data for Figure 5B.
- https://doi.org/10.7554/eLife.26607.042
-
Figure 5—source data 3
Source data for Figure 5C.
- https://doi.org/10.7554/eLife.26607.043
-
Figure 5—source data 4
Source data for Figure 5—figure supplement 1.
- https://doi.org/10.7554/eLife.26607.044
Figure 5—figure supplement 1
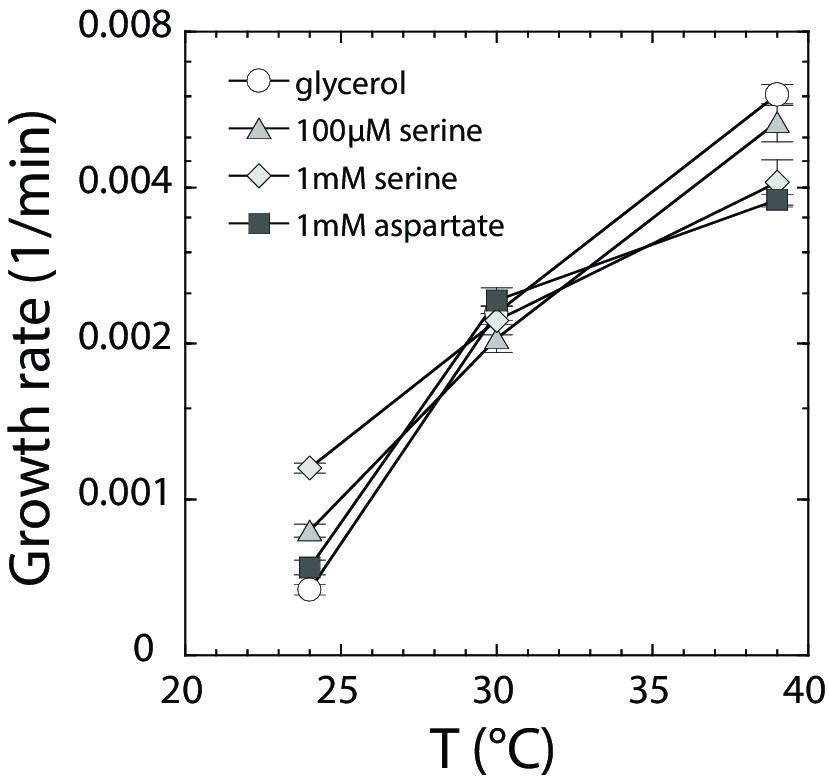
Growth rate dependence on amino acids and temperature.
MG1655 cells were grown at indicated temperatures as in Figure 5, in M9 supplemented with (○) 0.2% glycerol, (Δ) 0.2% glycerol and 100 µM serine, (◊) 0.2% glycerol and 1 mM serine, and (□) 0.2% glycerol and 1 mM aspartate. Maximal growth rate [1/min] was determined by a peak finding algorithm (see Materials and methods). Data were averaged for at least six independent experiments. The respective standard error is displayed.
Tables
Table 1
Strains.
https://doi.org/10.7554/eLife.26607.045| Strains | Relevant genotype or phenotype | Reference |
|---|---|---|
| RP437 | Escherichia coli K12 derivative; wild type for chemotaxis | (Parkinson and Houts, 1982) |
| AW405 | Escherichia coli K12 derivative; wild type for chemotaxis | (Armstrong et al., 1967) |
| MG1655 | Escherichia coli K12 | (Blattner et al., 1997) |
| VH1 | Δ(cheR cheB cheY cheZ) Δtsr Δ(tar tap) Δtrg Δaer | (Endres et al., 2008) |
| VS181 | Δ(cheY cheZ) Δtsr Δ(tar tap) Δtrg Δaer | (Sourjik and Berg, 2002b) |
| VS168 | ΔcheA Δ(cheY cheZ) | (Sourjik and Berg, 2002a) |
| VS223 | ΔcheY-cheZ, ΔflgM | this work |
Table 2
Plasmids used for FRET analyses.
https://doi.org/10.7554/eLife.26607.046| Plasmids | Relevant genotype | Resistance | Replication origin | Induction | Reference |
|---|---|---|---|---|---|
| pVS88 | cheZ-ecfp/cheYeyfp | ampicillin | pBR | 50 μM IPTG | (Sourjik and Berg, 2004) |
| pVS120 | tar [QEEE] | chloramphenicol | pACYC | 2 μM sodium salicylate | (Sourjik and Berg, 2004) |
| pVS121 | tar [EEEE] | chloramphenicol | pACYC | 1 μM sodium salicylate | (Sourjik and Berg, 2004) |
| pVS122 | tar [QEQQ] | chloramphenicol | pACYC | 2 μM sodium salicylate | (Sourjik and Berg, 2004) |
| pVS123 | tar [QEQE] | chloramphenicol | pACYC | 2 μM sodium salicylate | (Sourjik and Berg, 2004) |
| pVS415 | tar [QQQQ] | chloramphenicol | pACYC | 2 μM sodium salicylate | (Endres et al., 2008) |
| pVS 160 | tsr [QEQE] | chloramphenicol | pACYC | 2 μM sodium salicylate | (Oleksiuk et al., 2011) |
| pVS 356 | tsr [QEEE] | chloramphenicol | pACYC | 2 μM sodium salicylate | (Oleksiuk et al., 2011) |
| pVS 357 | tsr [QEQQ] | chloramphenicol | pACYC | 2 μM sodium salicylate | (Oleksiuk et al., 2011) |
| pVS361 | tsr [QQQE] | chloramphenicol | pACYC | 2 μM sodium salicylate | (Oleksiuk et al., 2011) |
| pVS362 | tsr [EEEE] | chloramphenicol | pACYC | 0.6 μM sodium salicylate | (Oleksiuk et al., 2011) |
Additional files
-
Source code file 1
Modelling
- https://doi.org/10.7554/eLife.26607.047
-
Source code file 2
Microfluidics
- https://doi.org/10.7554/eLife.26607.048
-
Source code file 3
Growth
- https://doi.org/10.7554/eLife.26607.049
Download links
A two-part list of links to download the article, or parts of the article, in various formats.
Downloads (link to download the article as PDF)
Open citations (links to open the citations from this article in various online reference manager services)
Cite this article (links to download the citations from this article in formats compatible with various reference manager tools)
Mechanism of bidirectional thermotaxis in Escherichia coli
eLife 6:e26607.
https://doi.org/10.7554/eLife.26607


