Distinct stages of synapse elimination are induced by burst firing of CA1 neurons and differentially require MEF2A/D
- University of Texas Southwestern Medical Center, United States
Figures
Figure 1 with 1 supplement

Theta frequency postsynaptic bursts of action potentials in CA1 neurons induce a long-term depression of excitatory synaptic transmission.
(A) Experimental paradigm. Hippocampal slice cultures were prepared from wild-type (WT) mice, transfected with ChR-mCherry and Cre-mCherry and treated with patterned photostimulation (PPS; 3 Hz; 50 ms blue light pulses; 1 or 24 hr). (B) Patterned postsynaptic burst firing of ChR2 transfected (blue trace) or untransfected neurons induced by photostimulation (blue bars). Scale bar = 100 ms/ 10 mV (right panel). (C1) Upper: Time course of brief PPS and recording. Simultaneous whole cell recordings from WT neurons transfected with ChR2-mCherry, Cre-mCherry, and MRE-GFP and neighboring untransfected neurons in cultures treated with brief PPS. Black fill triangles indicate the time window for recording. C2 Left: Group averages of evoked EPSCs (upper) and mEPSC frequency (lower) from transfected (red fill) and untransfected neurons (black fill). Error bars in this and all figures represent SEM. Inset: Representative evoked EPSCs (scale = 10 ms/20 pA) from transfected (red) and untransfected (black) neurons. Right: Evoked EPSC amplitudes (upper) or mEPSC frequency (lower) from individual cell pairs (open circles). Transfected cell is plotted as a function of untransfected cell. Mean value is plotted as average ±SEM (filled circle). Diagonal line represents equality. C3 Representative mEPSCs (scale = 500 ms/10 pA). (D1-3). The same as C, except cultures were treated with chronic PPS. N = 13–19 cell pairs/condition. Statistic: Paired t-test.
Figure 1—figure supplement 1
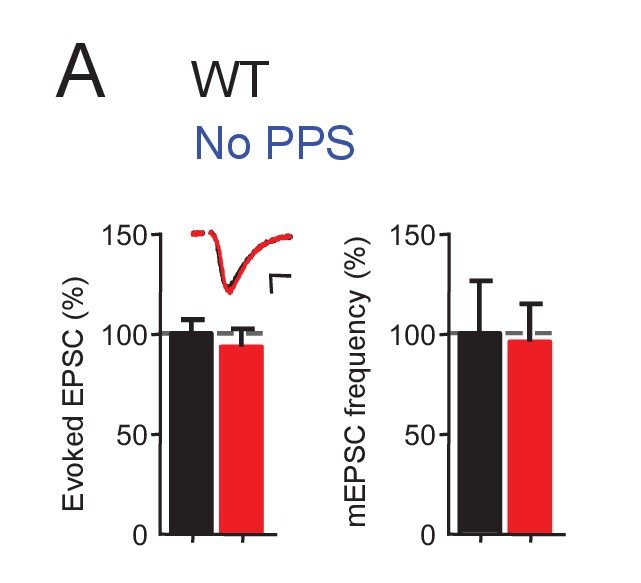
Channelrhodopsin expression does not affect excitatory synaptic transmission.
(A) Transfection of ChR2-mCherry into CA1 neurons of WT slice cultures, without photostimulation (PPS), does not affect excitatory synaptic transmission. Group data of evoked EPSC amplitudes and mEPSC frequency from dual whole cell voltage clamp recordings from untransfected CA1 neurons and neighboring neurons transfected with ChR2-mCherry in WT hippocampal slice cultures. n = 12 cell pairs/condition. Statistic: Paired t-test.
Figure 2 with 1 supplement
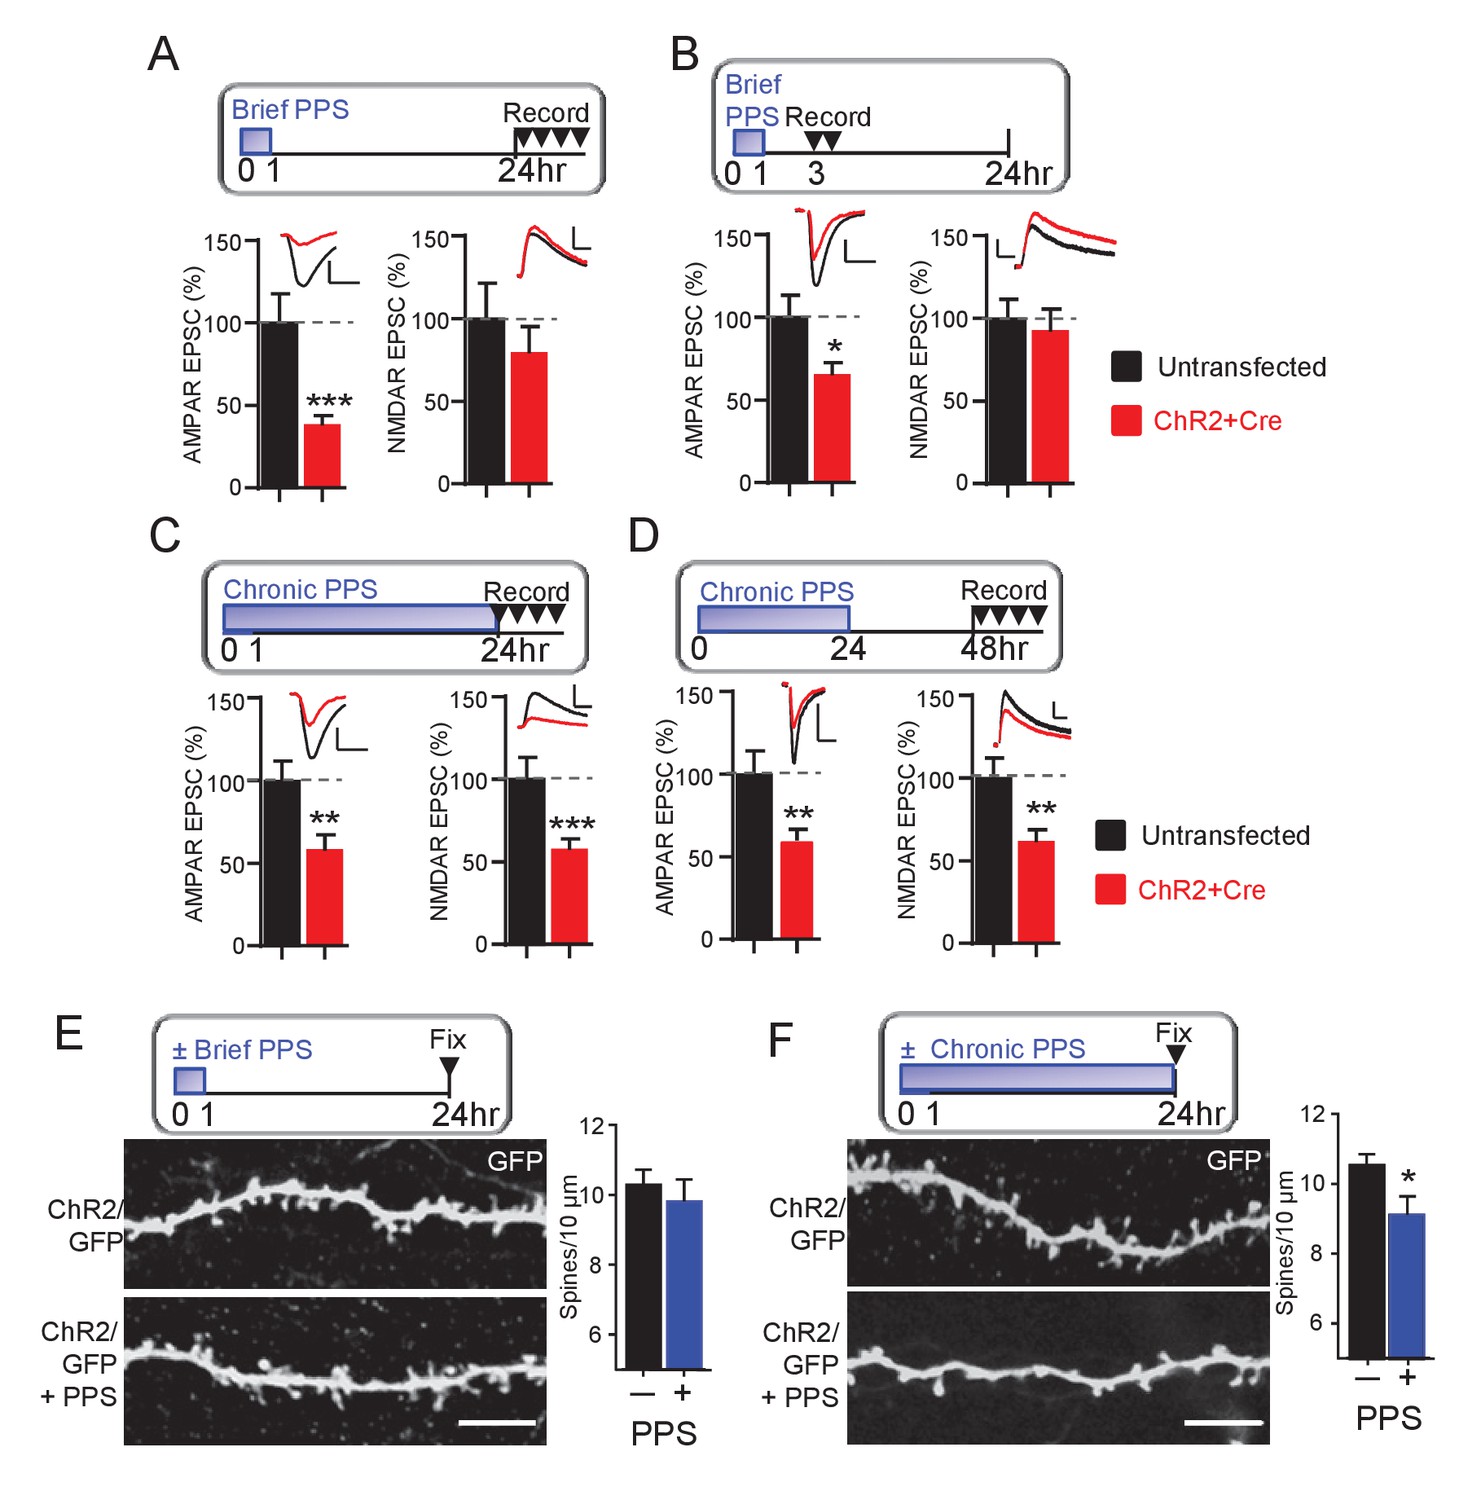
Brief PPS silences synapses, whereas chronic PPS induces functional and structural synapse elimination.
(A) Upper: Time course of brief PPS and recording. Lower: Group average of evoked AMPAR (left) or NMDAR (right) mediated EPSC amplitudes from pairs of transfected and untransfected neurons after brief PPS. Inset: Representative evoked AMPAR and NMDAR EPSCs (scale = 20 ms/50 pA) from transfected (red) and untransfected (black) neurons. (B) The same as A, except slices were recorded 3–7 hr after PPS onset. (C) The same as A, except slices were treated with chronic (24 hr) PPS and recordings were performed 24–30 hr after PPS onset. (D) The same as C, except recordings were performed 48–54 hr after PPS onset. N = 13–22 cell pairs/condition. Statistic: Paired t-test. (E) Upper: Time course of brief PPS and fixation. Slice cultures, transfected with PA1-GFP and ChR2-mcherry, were subjected to brief PPS or not. Left: Representative images of secondary apical dendrites. Scale bar = 5 μm. Right: Group average of spine density on GFP + ChR2 transfected neurons with (blue bar) or without (black bar) PPS. (F) The same as D, except slice cultures were treated with chronic PPS or not. N = 13–20 cells/ condition. Statistic: Unpaired t-test. *p<0.05; **p<0.01; ***p<0.001.
Figure 2—figure supplement 1
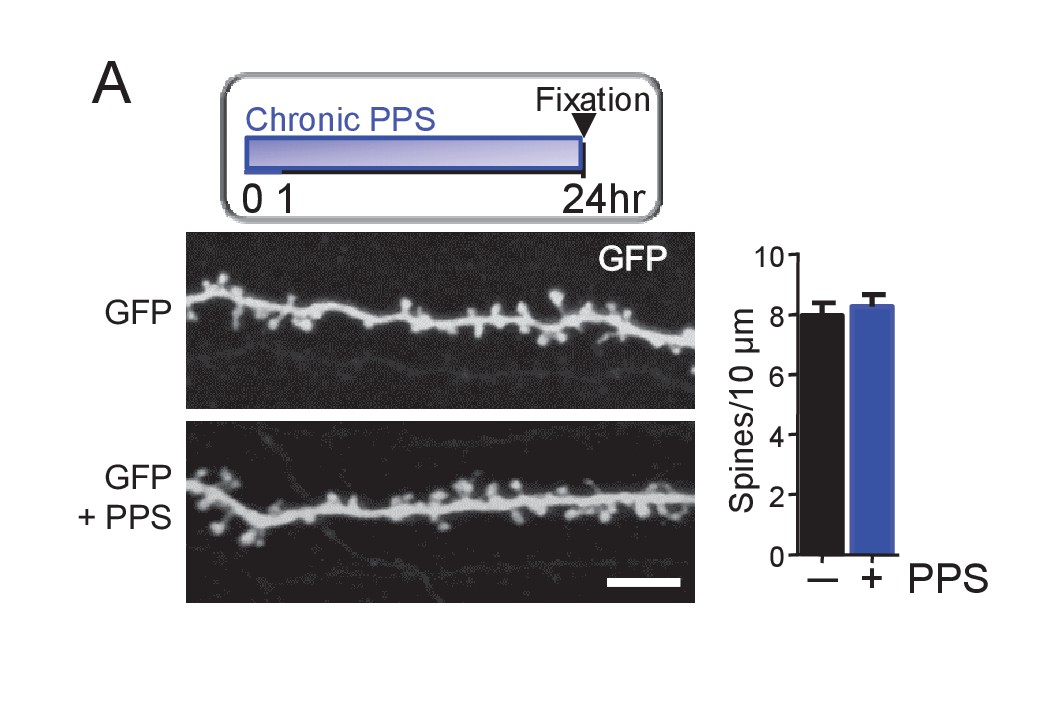
Chronic PPS of CA1 neurons transfected with GFP alone has no effect on spine density.
(A) Inset: Experimental time line. Left: Representative 2-photon images of secondary apical dendrites from CA1 neurons in slice culture transfected with GFP with and without chronic PPS. Scale bar = 5 μm. Right: Group data demonstrates that PPS of GFP transfected neurons has no effect spine density. n = 12–13 cells/condition. Statistic: Unpaired t-test.
Figure 3 with 1 supplement

Brief and Chronic PPS activates MEF2A/D dependent transcription in individual CA1 neurons.
(A) Representative images of MRE-GFP, ChR2-mCherry and Cre-mCherry in CA1 neurons treated with different durations of PPS or no stimulation (no stim). Neurons were imaged 24 hr after PPS onset. Scale bar = 10 μm. (B) Group average of normalized MRE-GFP expression in A. N = 26–52 cells/condition. Statistic: One-way ANOVA with Dunnet’s multiple comparison. (C) Representative images for MRE-GFP, ChR2-mCherry and Cre-mCherry induced by 1 or 24 hr PPS in WT or Mef2a/dfl/fl neurons. Scale bar = 10 μm. (D) Group data of normalized MRE-GFP in C. N = 20–24 cells/condition. Statistic: Two-way ANOVA and Tukey’s multiple comparison. **p<0.01; ***p<0.001; ****p<0.0001.
Figure 3—figure supplement 1
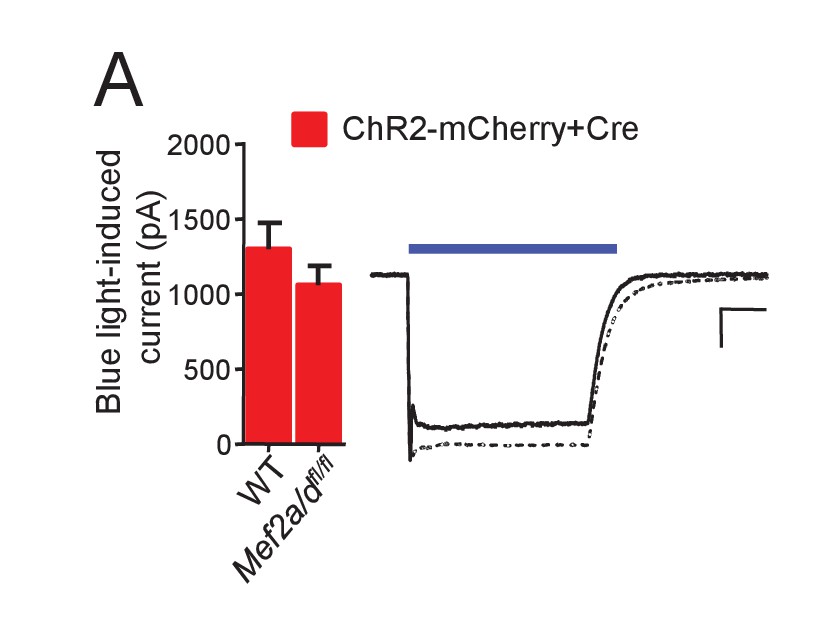
ChR2 function is not altered by MEF2A/D deletion.
(A) Whole cell voltage clamp recordings from CA1 neurons in organotypic hippocampal slice cultures from either WT or Mef2a/dfl/fl transfected with ChR2-mCherry and Cre-mCherry. Left: Group averages of inward current amplitudes in response to a blue light (470 nM) pulse (35 mW/mm2; 200 msec) from each genotype; N = 15–16 cells/genotype. Statistic: Unpaired t-test. Right: Representative blue light-induced currents from each genotype (WT; solid; Mef2a/dfl/fl dashed line). Scale bar is 50 ms/ 200 pA.
Figure 4 with 1 supplement
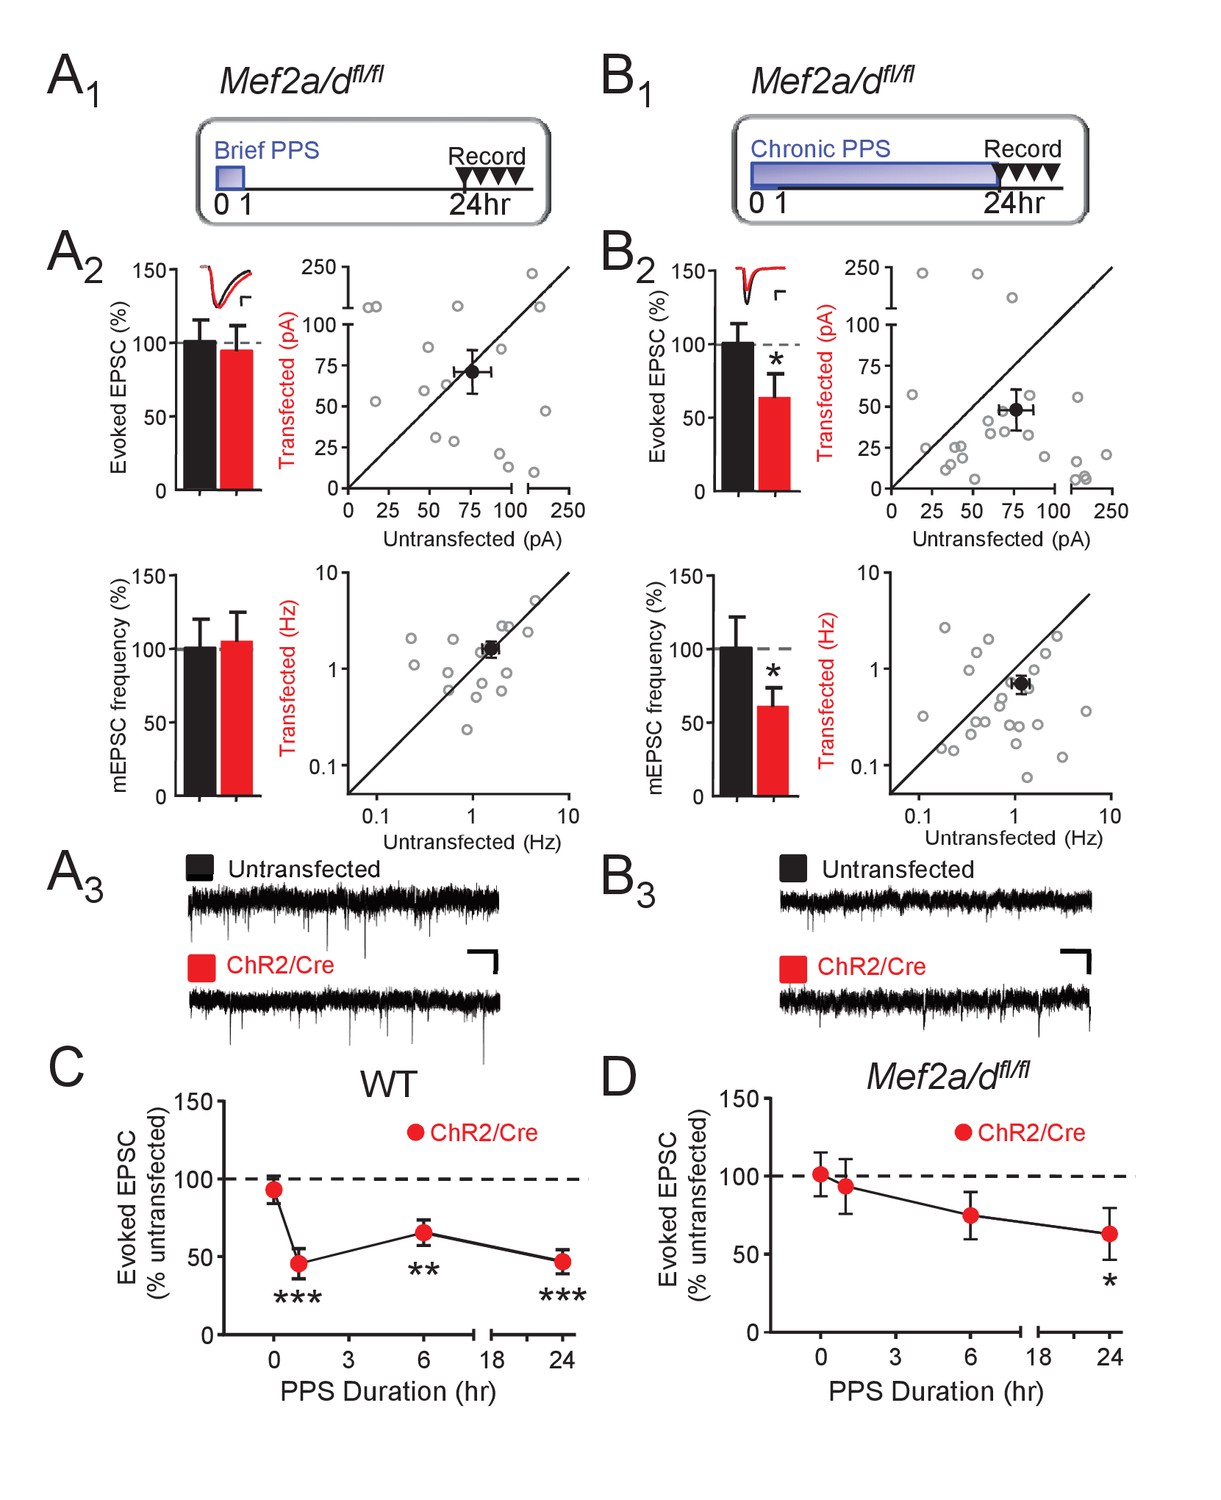
Postsynaptic MEF2A/D is necessary for synaptic depression induced by brief (1 hr), but not chronic (24 hr), PPS.
(A1). Time course of brief PPS and recording. (A2) Left: Group averages of EPSC amplitudes (upper) or mEPSC frequency (lower) from simultaneous whole cell recordings from Mef2a/dfl/fl neurons transfected with ChR2-mCherry, Cre-mCherry, and MRE-GFP (red fill) and neighboring untransfected neurons (black fill) in cultures treated with brief PPS. Inset: Representative evoked EPSCs (scale = 10 ms/20 pA) from transfected (red) and untransfected (black) neurons. Right: Evoked EPSC amplitudes (upper) or mEPSC frequency (lower) from individual cell pairs (open circles). Transfected cell is plotted as a function of untransfected cell. Mean value is plotted as average ±SEM (filled circle). Diagonal line represents equality. (A3) Representative mEPSCs (scale = 500 ms/10 pA). (B1-3) The same as A except cultures were treated with chronic, 24 hr, PPS. N = 16–24 cell pairs/condition. Statistic: Paired t-test. (C) Group data of evoked EPSC amplitudes in transfected neurons (normalized) from WT slices either untreated (0 hr) or treated with increasing durations of PPS. (D) The same as C, except recordings are from Mef2a/dfl/fl cultures. N = 13–24 cell pairs/condition. Wilcoxon signed rank with Bonferroni correction for multiple comparisons. *p<0.05; **p<0.01; ***p<0.001.
Figure 4—figure supplement 1
Acute, postsynaptic deletion of Mef2a/d does not affect excitatory synaptic transmission and the persistence of chronic PPS-induced synapse depression.
(A) Deletion of postsynaptic MEF2A/D by transfection of Cre-mCherry into Mef2a/dfl/fl slice cultures has no effect on synaptic transmission. Inset: Representative EPSCs from untransfected (black) and transfected (red) neuron. Scale bar is 10 ms/20 pA. N = 17 cell pairs. (B) Deletion of postsynaptic MEF2A/D does not alter the persistence of chronic PPS-induced synapse AMPA and NMDA transmission depression. N = 16 cell pairs. Statistic: Paired t-test.
Figure 5 with 1 supplement
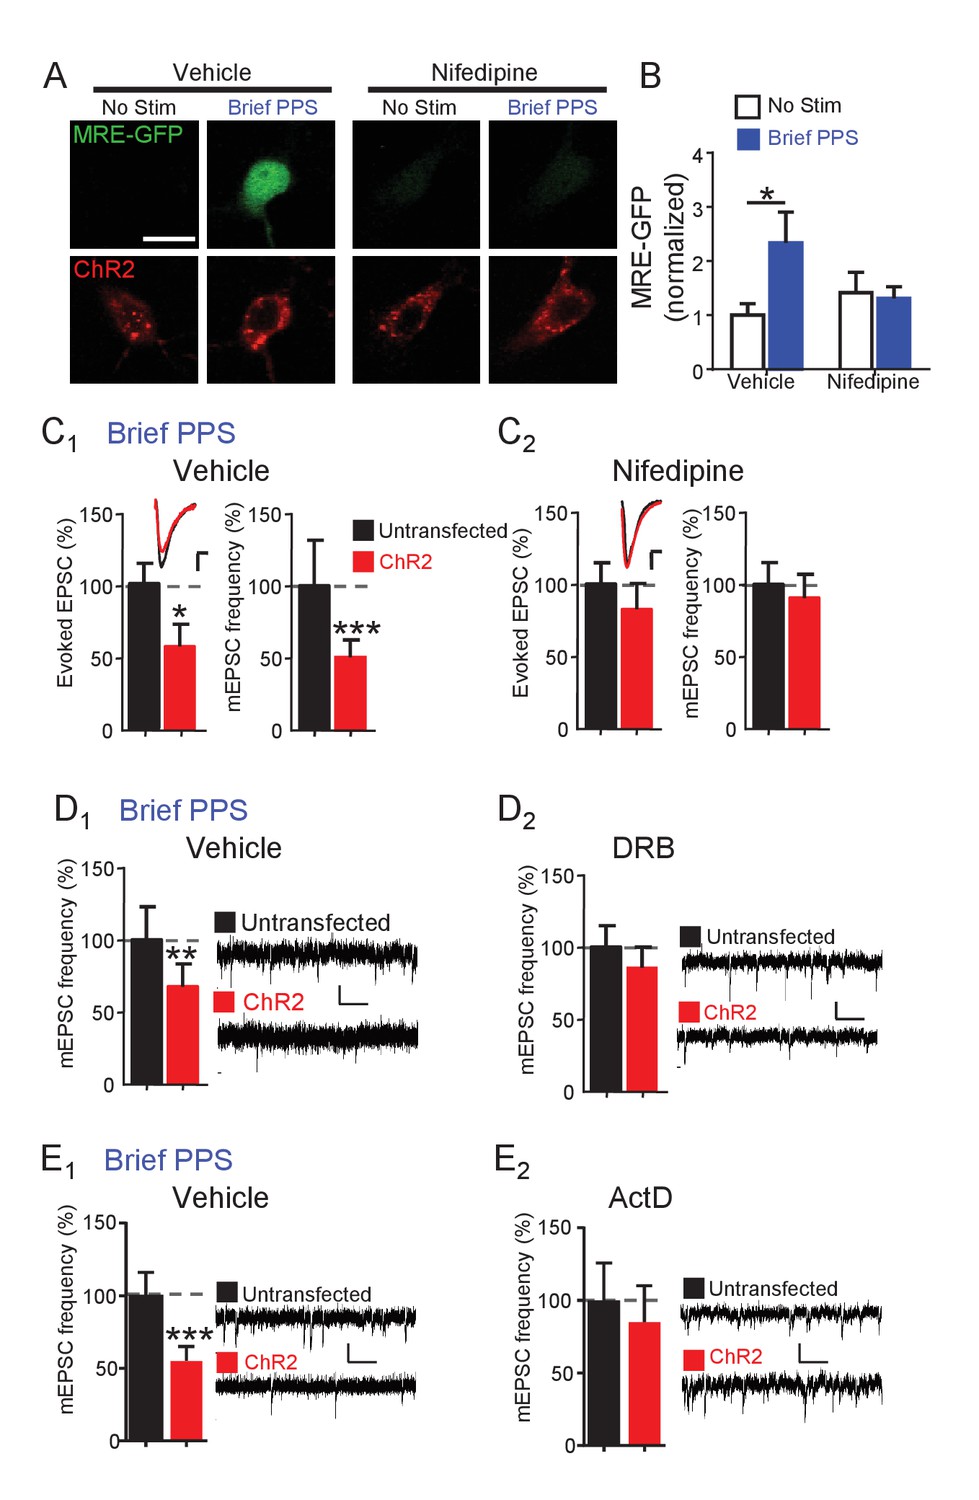
Synapse depression induced by brief PPS requires activation of L-type voltage-gated calcium channels and de novo transcription.
(A) Representative images of MRE-GFP and ChR2-mCherry in CA1 neurons with or without brief PPS in vehicle (0.1% DMSO) or nifedipine (20 μM). Scale bar = 10 μm. (B) Group averages of MRE-GFP from experiments in A. Two-way ANOVA with Tukey’s multiple comparison. N = 15–27 cells/condition. Statistic: Two-way ANOVA with Tukey’s multiple comparison. (C) Group averages of evoked EPSC amplitude and mEPSC frequency from paired recordings of transfected and untransfected neurons subjected to brief PPS in the presence of vehicle (C1) or nifedipine (C2). Inset: Representative evoked EPSCs (scale = 10 ms/20 pA) from transfected (red) and untransfected (black) neurons. (D) Group averages of mEPSC frequency from transfected and untransfected neurons after brief PPS in vehicle (D1; 0.2% DMSO) or DRB (D2; 160 µM). Inset: Representative evoked EPSCs (scale = 10 ms/20 pA). (E) The same as D, except in actinomycin D (1 µM). Paired t-test. N = 12–19 cell pairs/condition. *p<0.05; **p<0.01; ***p<0.001.
Figure 5—figure supplement 1
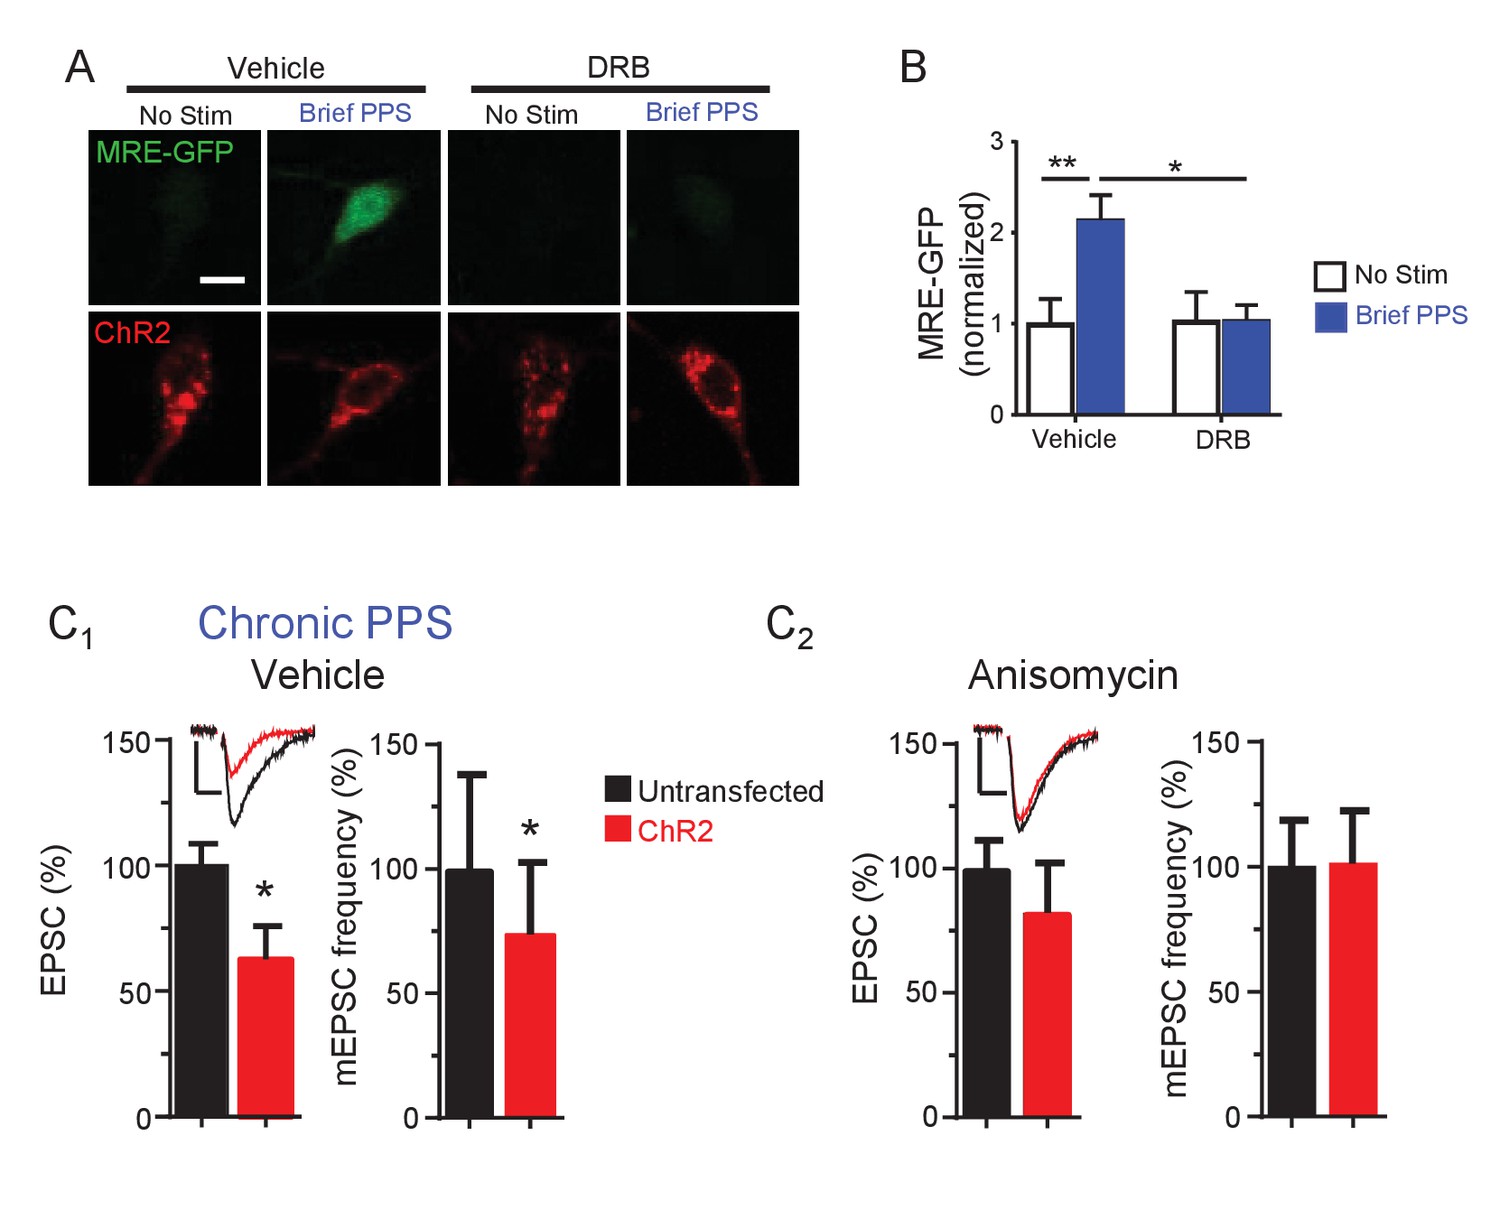
Effects of transcription and translation inhibitors on PPS-induced MRE-GFP and synaptic function.
(A) Activation of the MEF2 transcriptional reporter, MRE-GFP, by brief PPS requires transcriptional activation. Representative confocal images of CA1 neurons transfected with MRE-GFP and ChR2-mCherry with or without exposure to brief PPS pretreated with either vehicle (0.2% DMSO) or the transcription inhibitor DRB (160 μM). Scale bar is 10 μm. (B) Group data of MRE-GFP intensity, normalized to no stim-vehicle, demonstrate that DRB blocks PPS-induced increases in MRE-GFP. N = 16–33 cells/condition. Statistic: two-way ANOVA with Tukey’s multiple comparisons. (C) The translation inhibitor anisomycin blocks synaptic depression induced by chronic PPS. Group data of evoked EPSC amplitudes and mEPSC frequency from dual recordings untransfected CA1 neurons and neighboring neurons transfected with ChR2-mCherry in WT hippocampal slice cultures pretreated with vehicle (C1) or anisomycin (20 µM; C2). N = 14–16 cell pairs/condition. Statistic: Paired t-test. **p<0.01; *p<0.05. Inset: Representative EPSCs from each condition. Scale bar = 50 pA/10 msec.
Figure 6 with 2 supplements
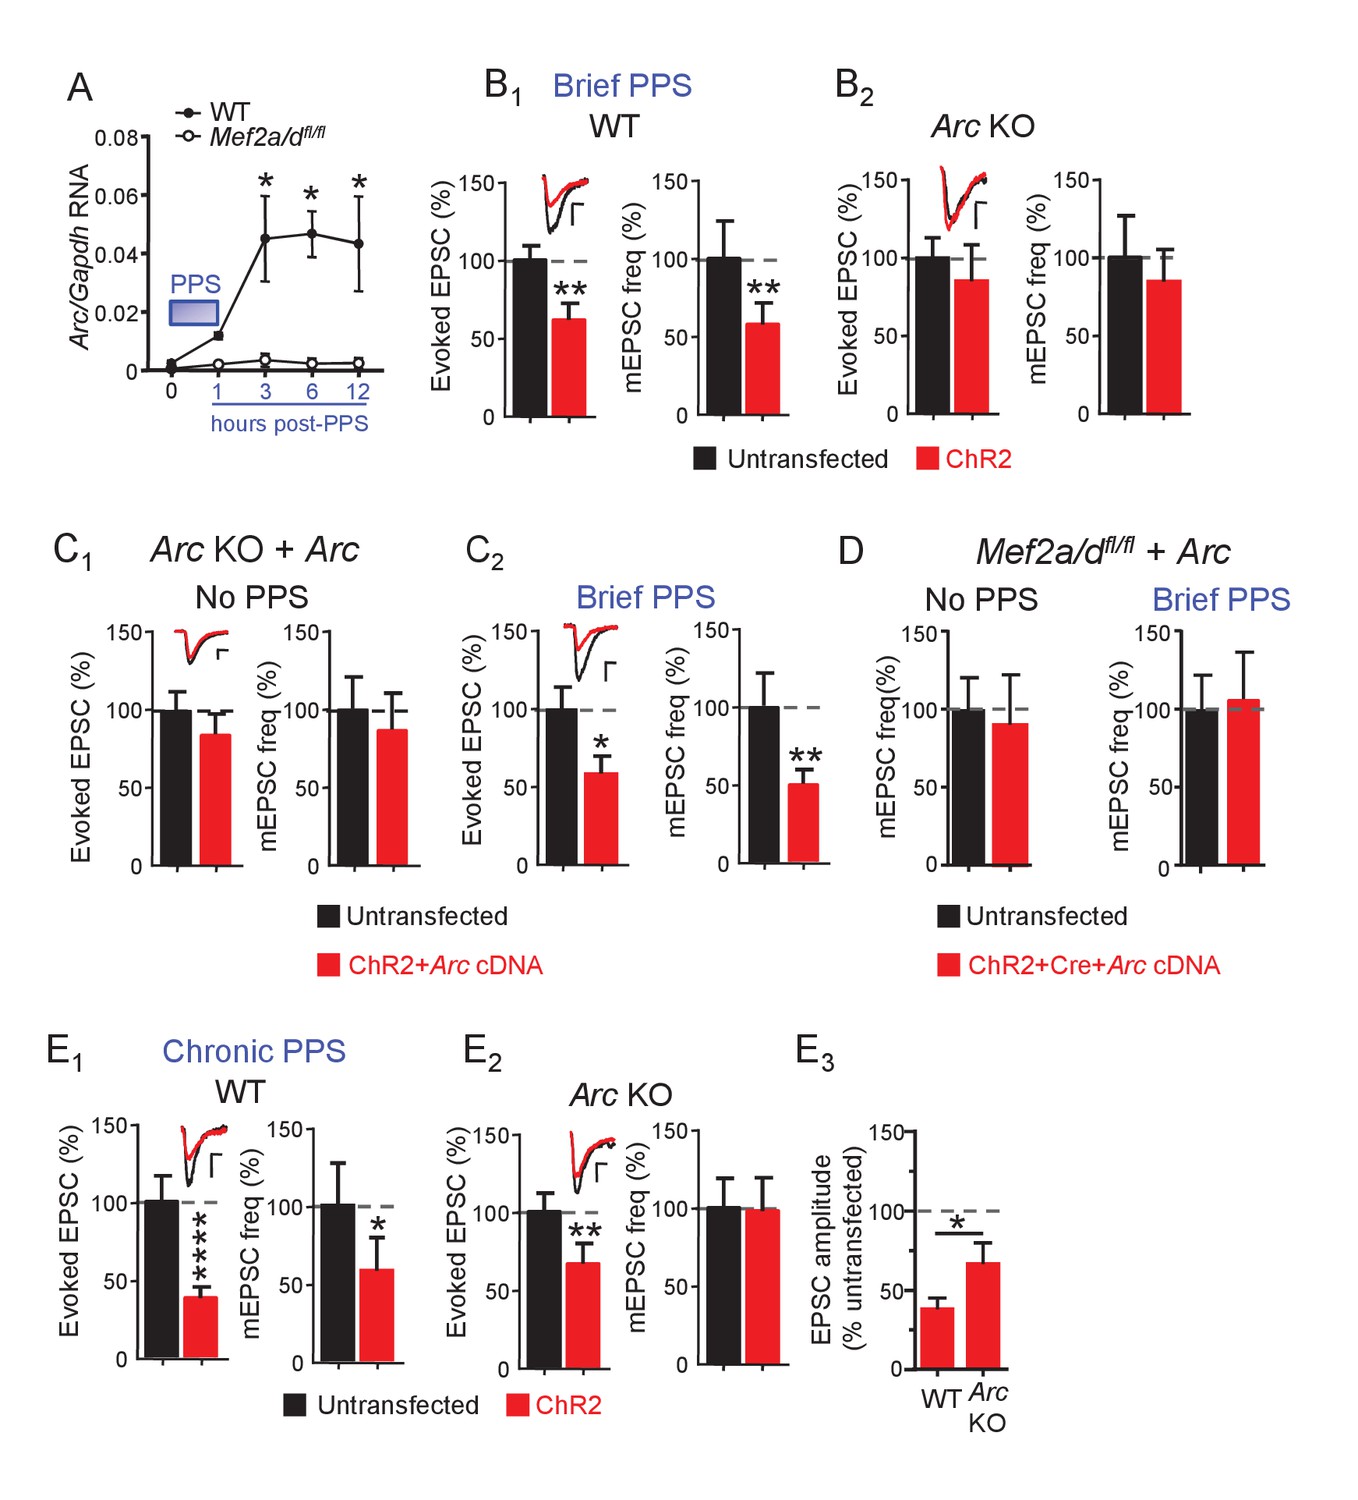
Brief PPS induces Arc which is necessary, but not sufficient, for synaptic depression.
(A) Arc RNA expression after brief PPS in dissociated WT (closed circles) or Mef2a/dfl/fl (open circles) cultures transfected with Cre-mCherry and ChR2-YFP. N = 3–5 independent cultures. Statistic: Two-way ANOVA and Sidak’s multiple comparison comparing WT vs. Mef2a/dfl/fl. (B) Group averages of EPSC amplitude and mEPSC frequency from ChR2-transfected and untransfected neurons from WT (B1) or Arc KO (B2) slice cultures after brief PPS. Inset: Representative EPSCs (scale = 10 ms/20 pA) from transfected (red) and untransfected (black) neurons. (C) Group averages of EPSC amplitude and mEPSC frequency from untransfected Arc KO neurons and those cotransfected with ChR2 and Arc cDNA in cultures without (C1) or with (C2) brief PPS. Inset: Representative EPSCs (scale = 10 ms/20 pA). (D) Group averages of mEPSC frequency from untransfected Mef2a/dfl/fl neurons and those cotransfected with ChR2, Cre-mCherry and Arc cDNA without or with exposure to brief PPS. (E) Group averages of EPSC amplitude and mEPSC frequency from ChR2-transfected and untransfected neurons from WT (E1) or Arc KO (E2) cultures after chronic PPS. Inset: Representative EPSCs (scale = 10 ms/20 pA). N = 11–23 pairs/condition. Statistic: Paired t-test. (E3) Group averages of EPSC amplitudes expressed as % untransfected neurons from WT and Arc KO cultures after chronic PPS. Independent t-test. *p<0.05; **p<0.01; ***p<0.001; ****p<0.0001.
Figure 6—figure supplement 1
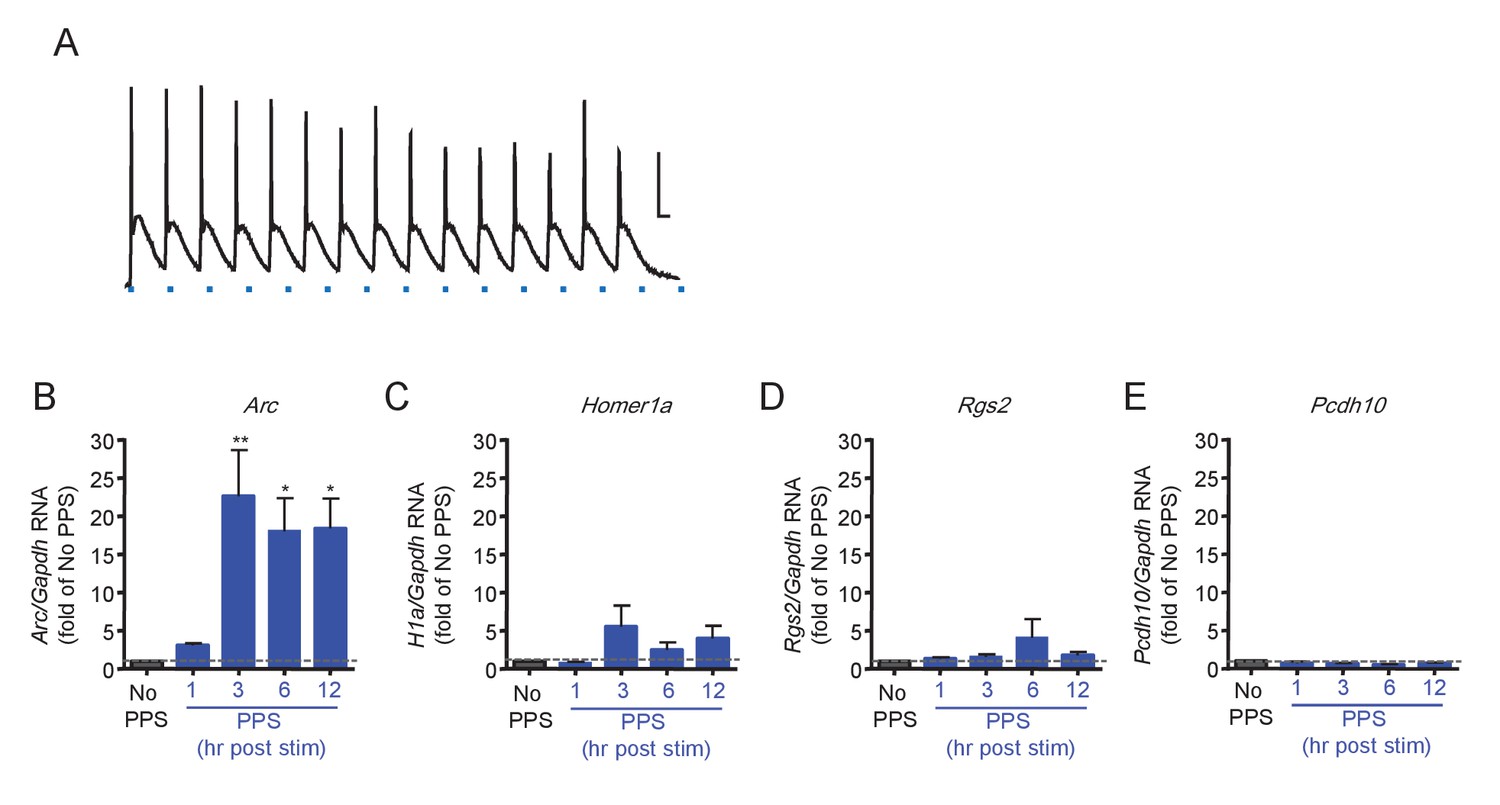
Brief PPS robustly induces Arc.
(A) Pulses of blue light stimulation (PPS; 10 ms; blue dash) reliable evoke action potentials in dissociated hippocampal neurons infected with lentivirus expressing ChR2-YFP. Scale bar = 20 mV/20msec B. Quantitative PCR reveals the time course of PPS induced Arc. In contrast, Homer1a (C), Rgs2 (D) and Pcdh10 (E) are not significantly induced. RNA expression for each gene is plotted as fold of RNA expression level in the ‘no PPS’ group. N = 3–5 independent culture. Statistic: One-way ANOVA; post hoc Dunnett’s test.
Figure 6—figure supplement 2
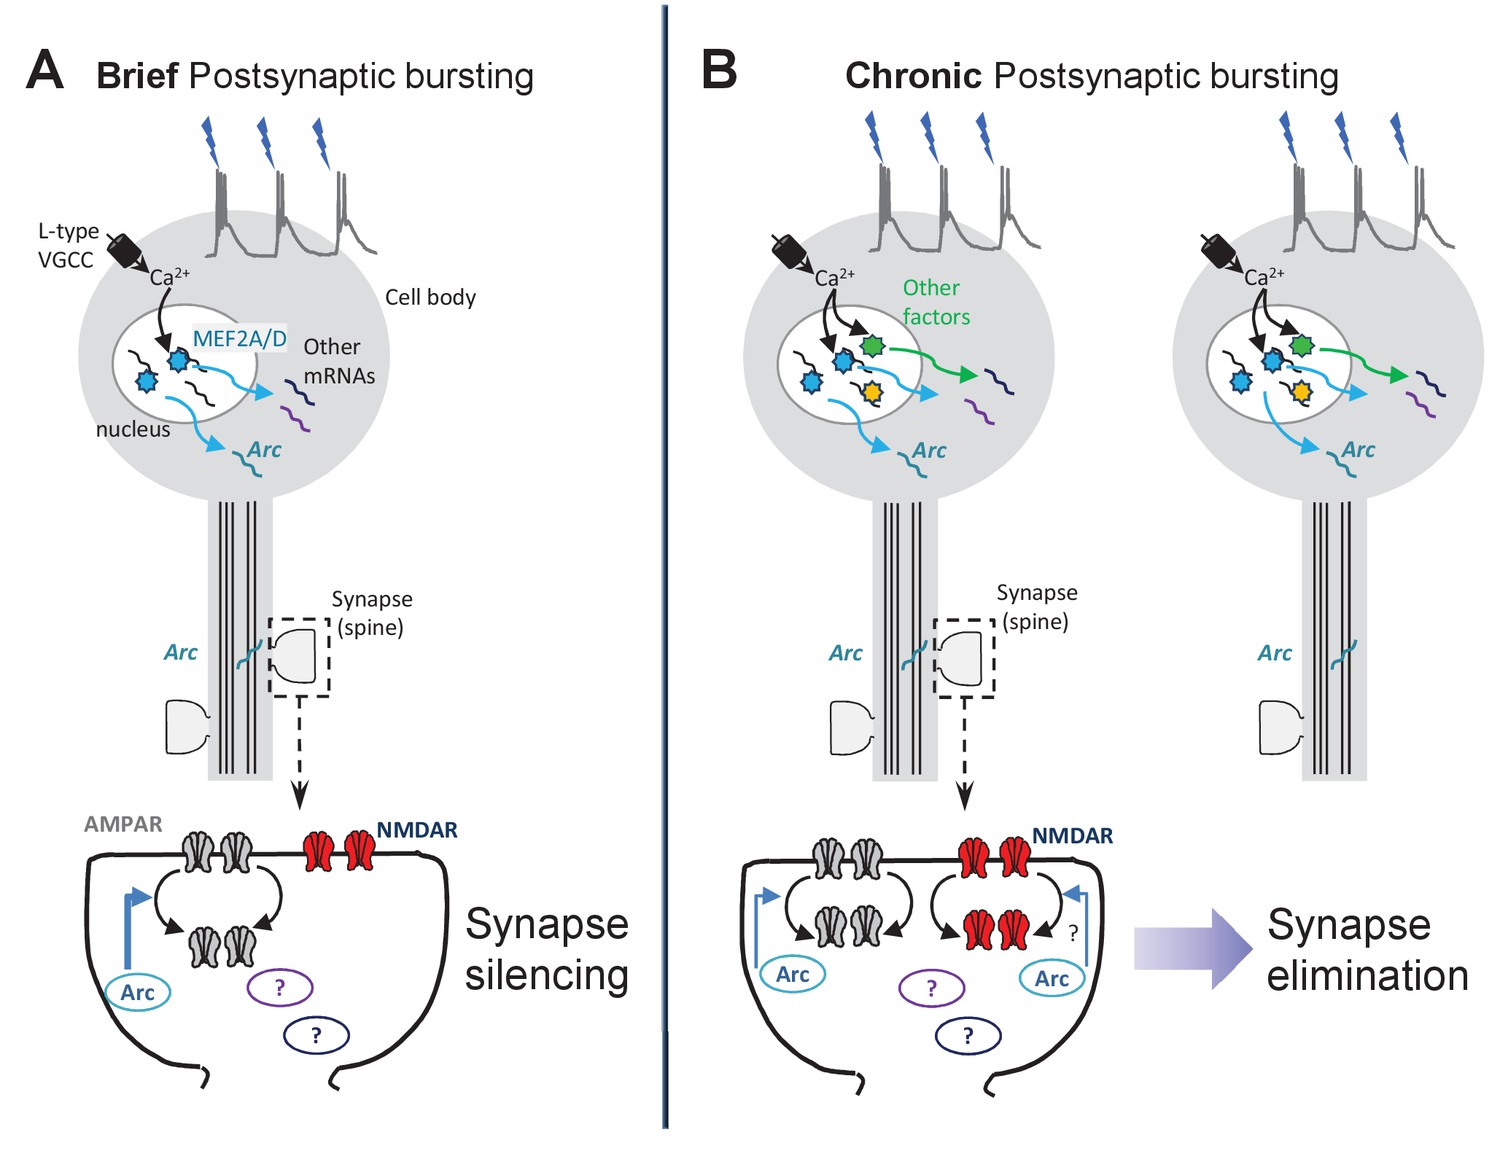
Working model of synapse silencing and elimination by different durations of postsynaptic bursting.
(A) Driving 3 Hz bursting of CA1 neurons stimulates MEF2A/D -dependent transcriptional activation through a Ca2 +influx through L-type voltage-gated Ca2+ channels (VGCCs). Bursting-activated MEF2A/D induces Arc mRNA, as well as other target genes, that function together to silence excitatory synapses through selective depression of AMPAR-mediated synaptic transmission. Based on results from Elmer et al., (Elmer et al., 2013) this may be through synaptic removal of GluA1-containing AMPARs. (B) Chronic (24 hr) bursting depresses both AMPA and NMDAR-mediated synaptic transmission and eliminates spines through activation of L-type VGCCs, transcription (Goold and Nicoll, 2010), translation, and Arc, but independent of MEF2A/D. Other activity-dependent transcription factors may contribute Arc expression and synapse elimination in response to chronic bursting activity.
Additional files
-
Supplementary file 1
Raw electrophysiological measurements in untransfected (U) or transfected (T) hippocampal CA1 neurons.
- https://doi.org/10.7554/eLife.26278.015
-
Transparent reporting form
- https://doi.org/10.7554/eLife.26278.016
Download links
A two-part list of links to download the article, or parts of the article, in various formats.
Downloads (link to download the article as PDF)
Open citations (links to open the citations from this article in various online reference manager services)
Cite this article (links to download the citations from this article in formats compatible with various reference manager tools)
Distinct stages of synapse elimination are induced by burst firing of CA1 neurons and differentially require MEF2A/D
eLife 6:e26278.
https://doi.org/10.7554/eLife.26278


