Impairments in laterodorsal tegmentum to VTA projections underlie glucocorticoid-triggered reward deficits
- University of Minho, Portugal
- ICVS/3B’s–PT Government Associate Laboratory, Portugal
Figures
Figure 1 with 3 supplements
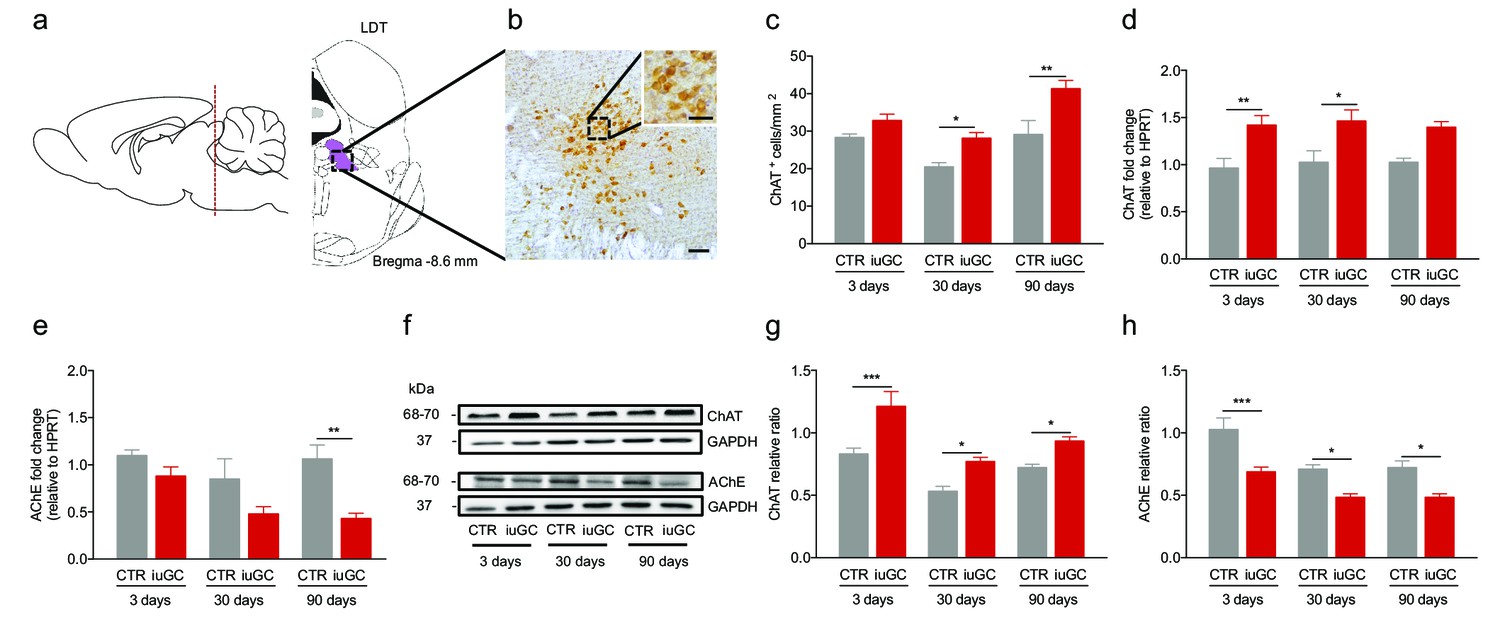
Prenatal exposure to glucocorticoids alters LDT cholinergic system.
(a) Schematic representation of the LDT. (b) Coronal section of the LDT showing ChAT immunohistochemistry. (c) iuGC animals present increased number of ChAT+ cells in the LDT at postnatal day 30 and 90. (d) Real-time PCR analysis revealed that ChAT mRNA levels are increased in the LDT of iuGC animals from postnatal day 3. (e) Conversely, AChE mRNA levels are decreased at postnatal day 90 (nCTR = 4; niuGC = 5). (f) Representative immunoblot of ChAT and AChE in the LDT of 3, 30 and 90 days old animals. (g) Protein quantification confirmed the upregulation of ChAT and (h) downregulation of AChE in the LDT from postnatal day 3 until adulthood (nCTR = 4; niuGC = 5). Data represented as mean ±s.e.m. *p<0.05, **p<0.001, ***p<0.0001. Scale bars in b: 100 µm and inset - 50 µm. Additional data is depicted in Figure 1—figure supplements 1, 2 and 3.
Figure 1—figure supplement 1
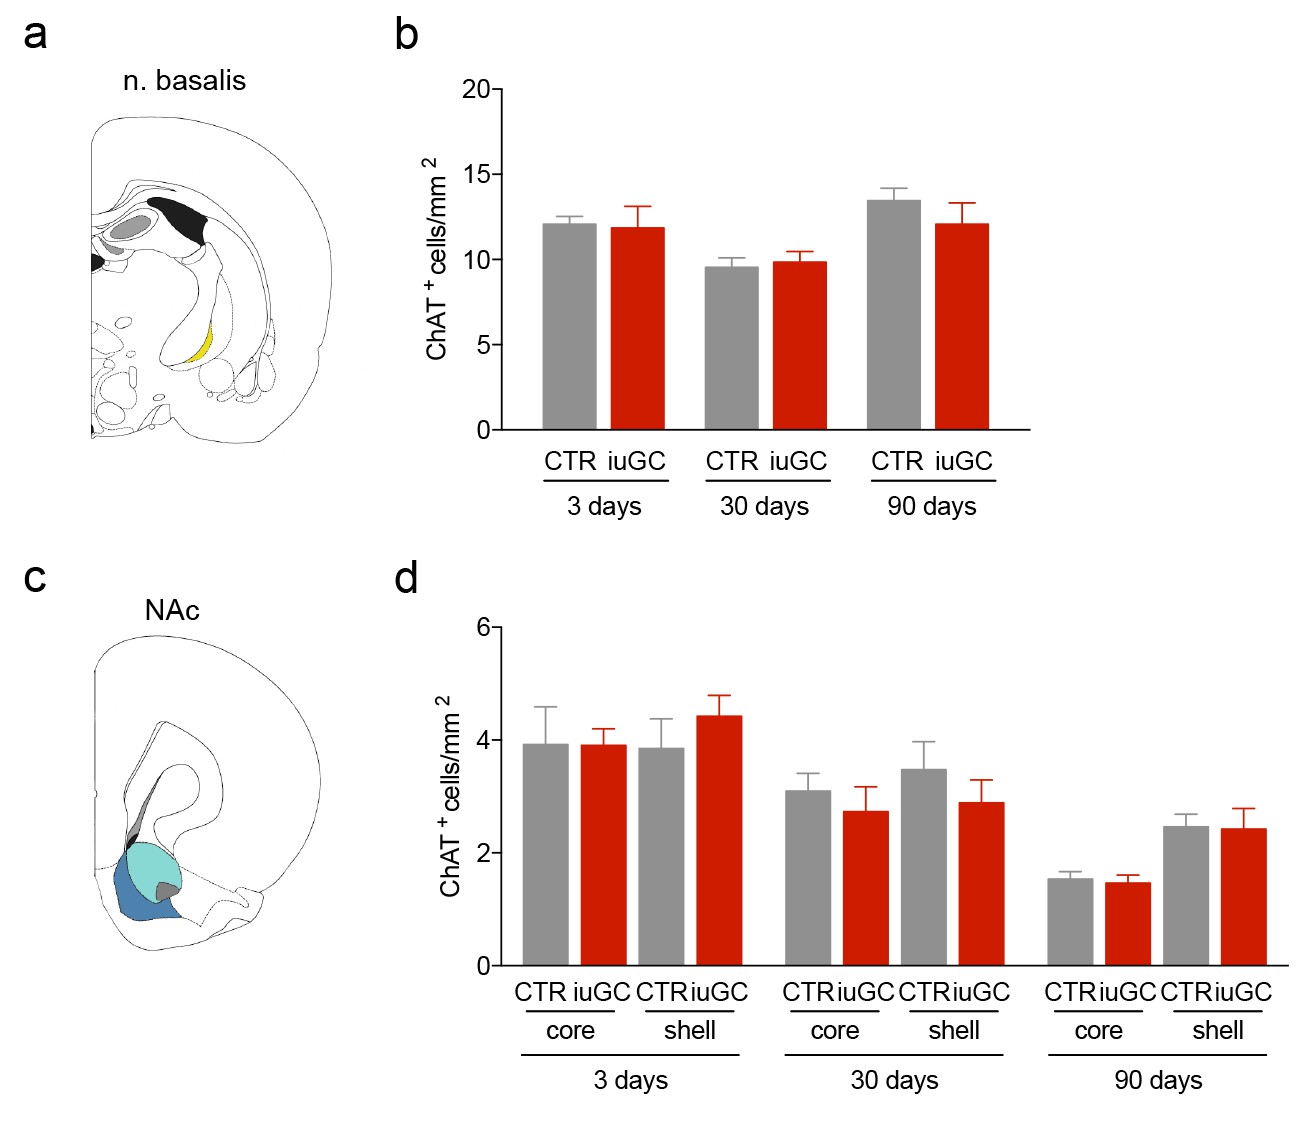
iuGC animals do not present changes in the number of cholinergic cells in other regions.
(a) Schematic representation of the nucleus basalis of Meynert (n. basalis) and (d) nucleus accumbens (NAc). (b-d; f–h) No changes between groups were observed in the number of ChAT+ cells. Data represented as mean ±s.e.m.
Figure 1—figure supplement 2
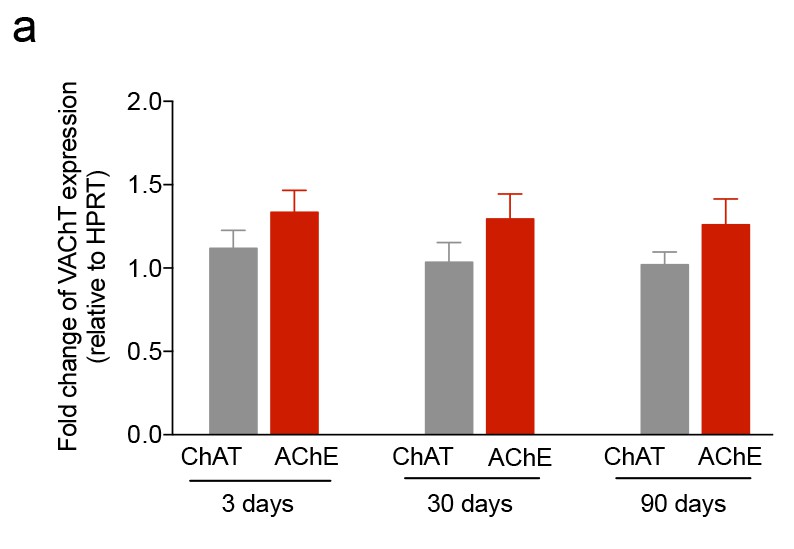
iuGC exposure does not change the expression levels of VAChT.
(a–c) Real-time PCR analysis showed no changes in the levels of VAChT in the LDT for all ages. Data represented as mean ±s.e.m.
Figure 1—figure supplement 3
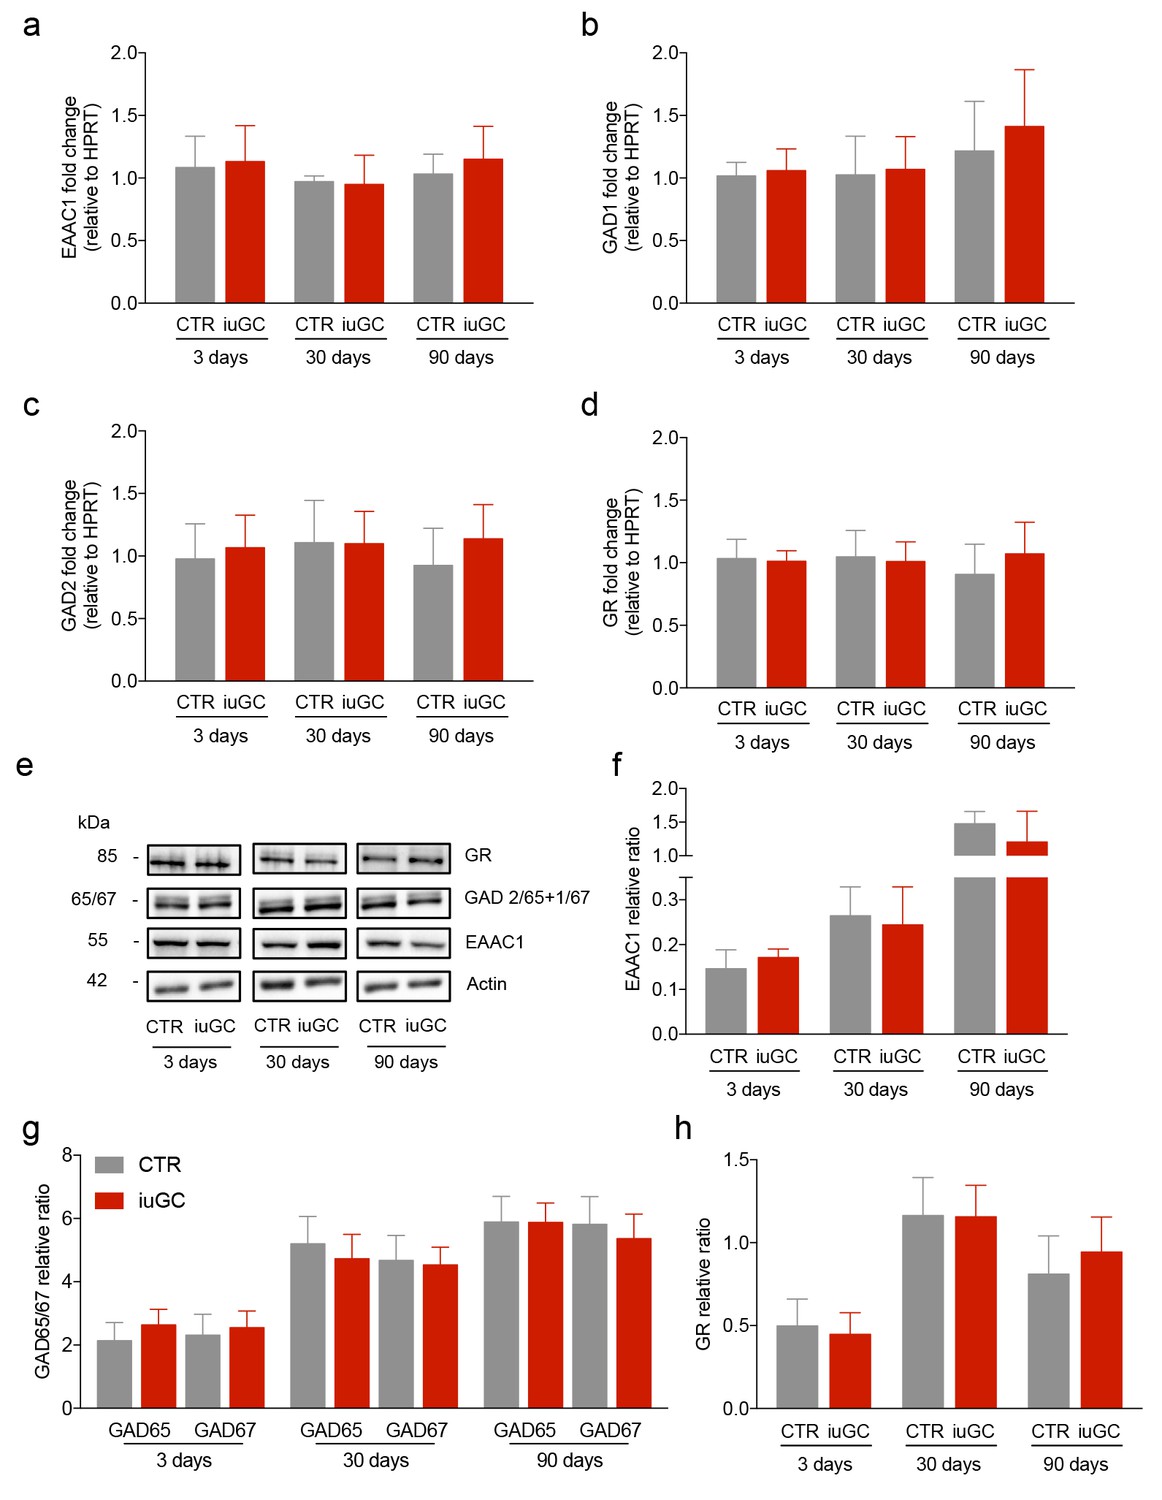
iuGC exposure does not change the expression levels of GABAergic and glutamatergic markers in the LDT.
Real-time PCR analysis showed no changes in the mRNA levels of (a) EAAC1, (b) GAD1, (c) GAD2 and (d) GR in the LDT for all ages. (e) Representative immunoblot of EAAC1, GAD67/GAD65, GR and loading controls in the LDT of 3, 30 and 90 days old animals. Band quantification of (f) EAAC1, (g) GAD67 +GAD65, (h) GR in the LDT of 3, 30 and 90 days old animals. (nCTR = 4; niuGC = 5). Data represented as mean ±s.e.m.
Figure 2
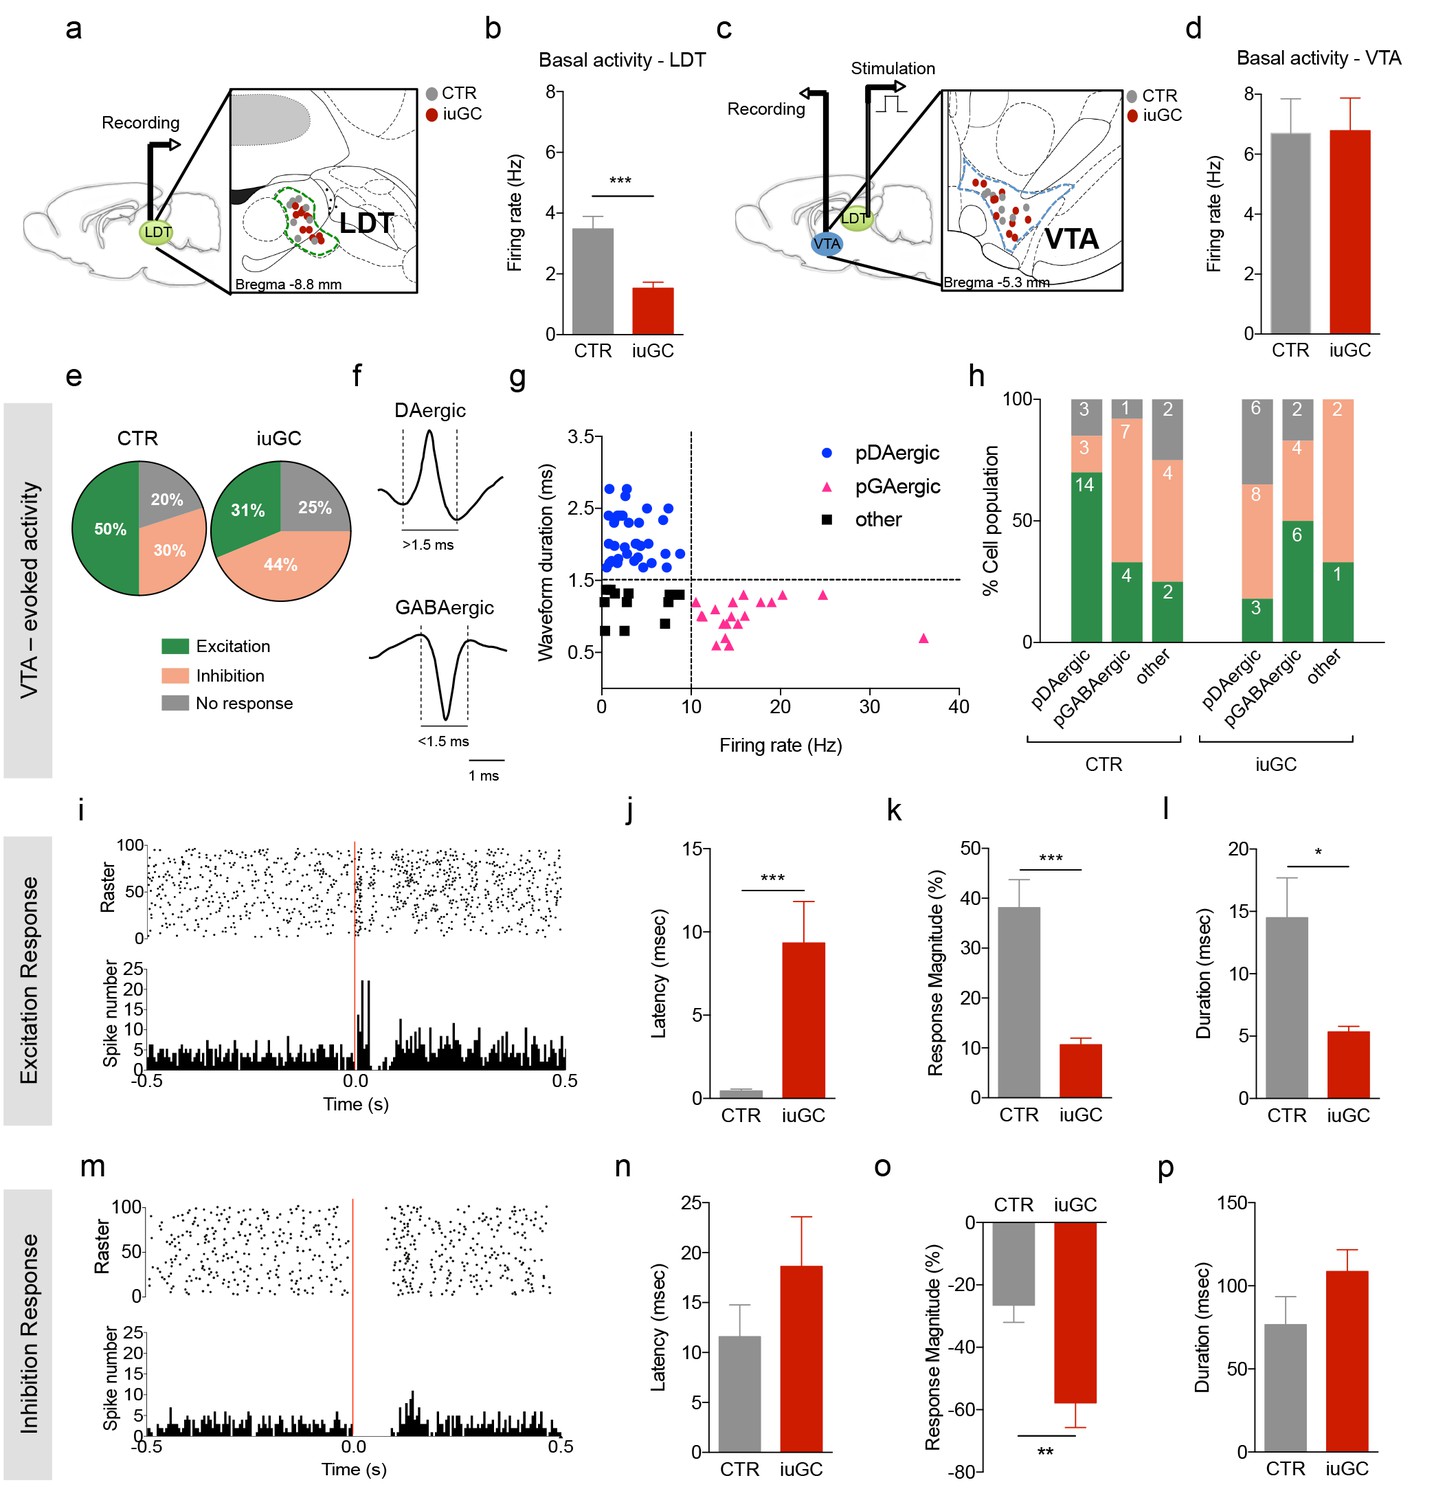
Distinct VTA neuronal response to LDT electrical stimulation in iuGC animals.
(a) Schematic representation of the in vivo single-cell electrophysiological recording experiments and electrode placement in the LDT in anesthetized animals. (b) iuGC animals present decreased basal activity of LDT neurons in comparison to CTR (nLDT-CTR = 36 cells; nLDT-iuGC = 94 cells). (c) Schematic representation of the in vivo single-cell electrophysiological recording experiments in the VTA with electric stimulation performed in the LDT; and recording electrode placement. (d) The basal activity of the VTA is similar between groups (nVTA-CTR = 40 cells; nVTA-iuGC=32 cells). (e) Electrical stimulation of the LDT (0.5 Hz) induces excitatory and inhibitory responses in VTA neurons. Pie plots represent the percentage of excitatory, inhibitory and no responses of VTA neurons. (e–g) In CTR animals, 50% of neurons present an excitatory response (70% pDAergic, 20% pGABAergic) and 30% present an inhibitory response (21% pDAergic, 50% pGABAergic). iuGC group shows a different profile, with 31% of recorded cells presenting an excitatory response (30% pDAergic, 60% pGABAergic) versus 44% with inhibitory response (57% pDAergic, 29% pGABAergic). (f) Representative examples of rat VTA pDAergic and pGABAergic neuronal waveforms. (g) Firing rate and waveform duration were used to classify single units into 3 types of neurons. (h) Percentage of each putative neuronal population presenting excitation, inhibition or with no response to LDT stimulation. There is a shift in the percentage of putative DAergic and GABAergic neurons presenting excitatory and inhibitory responses. Numbers in bars represent number of cells in each category. (i, m) Peristimulus time histograms (PSTHs) show LDT-evoked responses of VTA dopamine neurons; (i) excitation; (m) inhibition. (j) VTA neurons that display an excitatory profile in response to LDT electrical stimulus present increased latency to fire in iuGC animals. (k) The magnitude and (l) duration of response of VTA neurons is reduced in iuGC animals. (n) VTA neurons that display an inhibitory response in response to LDT electrical stimulus do not show differences in the latency to fire in both groups. (o) The magnitude of response of inhibited neurons of the VTA is increased in iuGC animals, with no differences in (p) the duration of inhibition in VTA neurons upon LDT stimulation. pDAergic: putative dopaminergic neurons; pGABAergic: putative GABAergic neurons. Data is represented as mean ±s.e.m. *p<0.05, **p<0.001, ***p<0.0001.
Figure 3 with 1 supplement
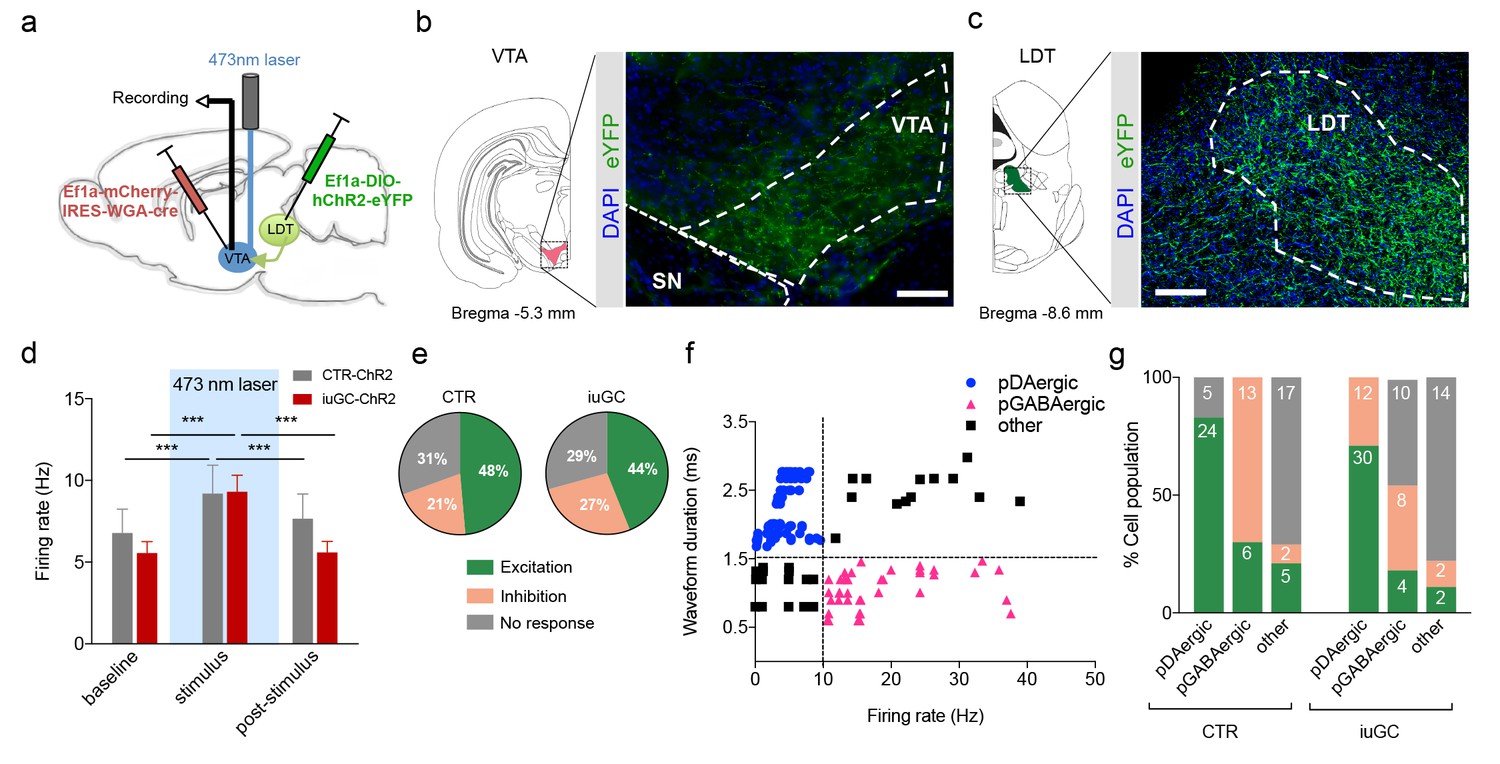
Optogenetic activation of LDT terminals in VTA elicits a differential electrophysiological response in iuGC animals.
(a) Strategy used for optogenetic activation of LDT projecting neurons in the VTA. An AAV5–EF1a–WGA–Cre–mCherry virus construct was injected unilaterally in the VTA, and a cre-dependent ChR2 vector (AAV5-EF1a-DIO-hChR2-eYFP) in the LDT. WGA-Cre will retrogradely migrate and induce the expression of ChR2 in LDT neurons that directly project to the VTA. (b) Representative image of immunofluorescence for GFP showing LDT axon terminals in the VTA and (c) cell bodies in the LDT; scale bar: 200 µm. (d) Optogenetic stimulation of LDT terminals in the VTA (blue rectangle; 30 pulses of 15 ms at 20 Hz) increases the firing rate of VTA neurons in both groups (nCTR = 72 cells; niuGC = 82 cells). (e) In CTR, upon LDT terminal stimulation, 48% of recorded VTA cells present an increase in firing rate (of those 69% pDAergic, 17% pGABAergic), 21% decrease activity (0% pDAergic, 87% pGABAergic) and 31% presented no change. In iuGC animals, upon LDT terminal stimulation, 44% of recorded VTA cells present an increase in firing rate (83% pDAergic; 11% GABAergic) 27% decrease activity (55% pGABAergic, 36% DAergic) and 29% presented no change. (f) Firing rate and waveform duration were used to classify single units into 3 types of neurons. (g) Percentage of each putative neuronal population presenting excitation, inhibition or with no response to LDT terminals optogenetic stimulation. Numbers in bars represent number of cells in each category. pDAergic: putative dopaminergic neurons; pGABAergic: putative GABAergic neurons. Data represented as mean ±s.e.m. ***p<0.001. Additional data is depicted in Figure 1—figure supplement 1.
Figure 3—figure supplement 1
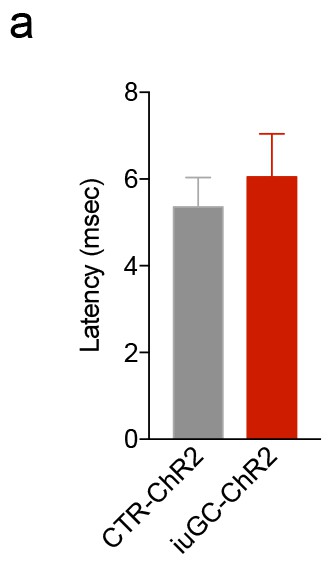
iuGC treatment has no effect on the response latency after optical stimulation of the LDT-VTA circuit.
(a) Latency of neuronal response to LDT-VTA terminals optical stimulation (30 pulses of 15 ms at 20 Hz) from cells depicted in Figure 3. Data represented as mean ±s.e.m.
Figure 4 with 3 supplements

Optogenetic activation of LDT-VTA rescues motivational deficits of iuGC-ChR2 animals and induces conditioning.
(a) Optogenetic stimulation of LDT terminals in the VTA during cue exposure (30 pulses of 15 ms at 20 Hz) rescues the breakpoint deficits in the PR test of iuGC-ChR2 animals, with no effect in other groups (nCTR = 6; nCTR-eYFP = 7; nCTR-ChR2 = 13; niuGC-ChR2 = 12). (b) Activation of LDT terminals in the VTA in an irrelevant period, such as for example during inter-trial interval (ITI) does not change breakpoint of iuGC-ChR2 animals. (c) Individual performance in the PR test. All iuGC-ChR2 animals increase their breakpoint when stimulation is associated with the cue but not during the ITI. (d) Schematic representation of the CPP protocol. Laser stimulation (30 pulses of 15 ms at 20 Hz, every 60 s) is associated to one chamber. (e) Optogenetic stimulation of LDT terminals in the VTA increases preference for the stimulation-paired box (ON) in iuGC-ChR2 but not in CTR-eYFP nor CTR-ChR2 animals (nCTR = 6; nCTR-eYFP = 7; nCTR-ChR2 = 5; niuGC-ChR2 = 6). (f) Difference score of CPP protocol shown as the difference in time spent in pre- and post-test. iuGC-ChR2 animals present a shift in preference for the ON chamber. (g) Real Time Place Preference (RTPP) protocol: animals were placed in a box with two identical chambers for 15 min and allowed to freely explore. When animals crossed to the ON side, optical stimulation was given until exiting the chamber. Shown are representative tracks from a CTR, CTR-eYFP, CTR-ChR2 and an iuGC-ChR2 animal. (h) CTR-ChR2 and iuGC-ChR2 rats spend a significantly higher percentage of time in the stimulation-associated box (ON side) (nCTR = 6; nCTR-eYFP = 7; nCTR-ChR2 = 8; niuGC-ChR2 = 6). (i) Difference between time spent in the ON versus OFF side. Data represented as mean ±s.e.m. *p<0.05, **p<0.001, ***p<0.0001. #: comparison with CTR-eYFP; +: comparison with CTR-ChR2. Additional data is depicted in Figure 4—figure supplements 1–3.
Figure 4—figure supplement 1
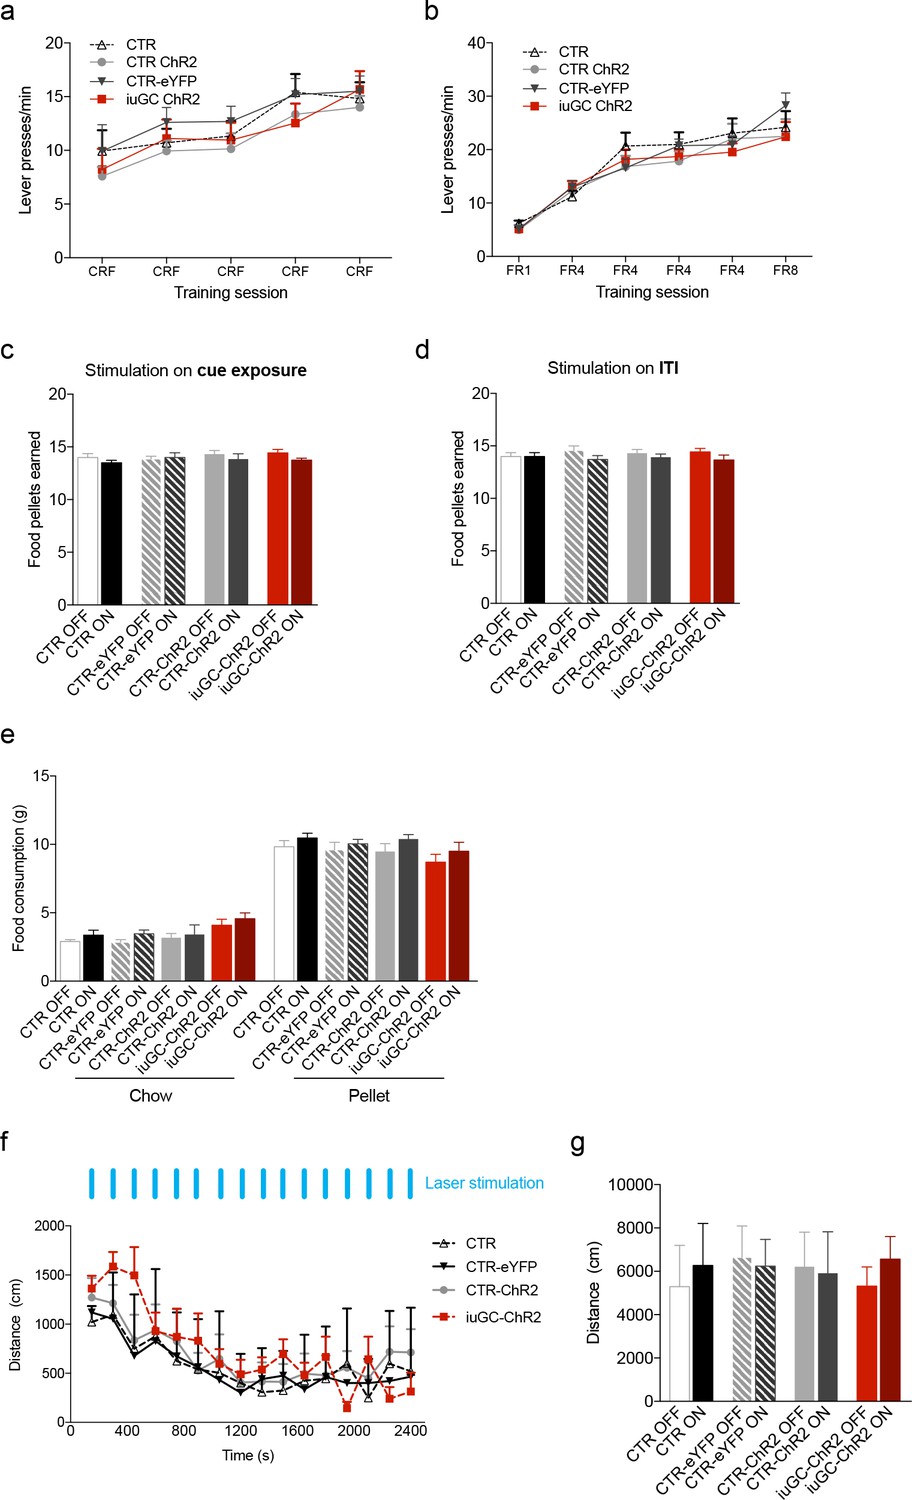
Effects of iuGC treatment or optogenetic activation of the LDT-VTA circuit in operant learning, food consumption and locomotion.
Performance in the (a) Conditioning Reinforcement (CRF) and (b) Fixed Ratio (FR) sessions was similar between groups (nCTR = 6; nCTR-eYFP = 7; nCTR-ChR2 = 13; niuGC-ChR2 = 12). (c) Total number of food pellets earned in the PR session, in which optical stimulation was given during cue exposure and (d) during the ITI. (e) No effects in free feeding behavior – regular chow or pellets in stimulated animals (nCTR = 6; nCTR-eYFP = 7; nCTR-ChR2 = 8; niuGC-ChR2 = 6). (f) No differences were observed in the locomotor activity of CTR, CTR-eYFP, CTR-ChR2 and iuGC upon stimulation (30 pulses of 15 ms at 20 Hz; given every minute). (g) Total distance travelled revealed no differences between groups (nCTR = 6; nCTR-eYFP = 7; nCTR-ChR2 = 8; niuGC-ChR2 = 6). Data represented as mean ±s.e.m.
Figure 4—figure supplement 2
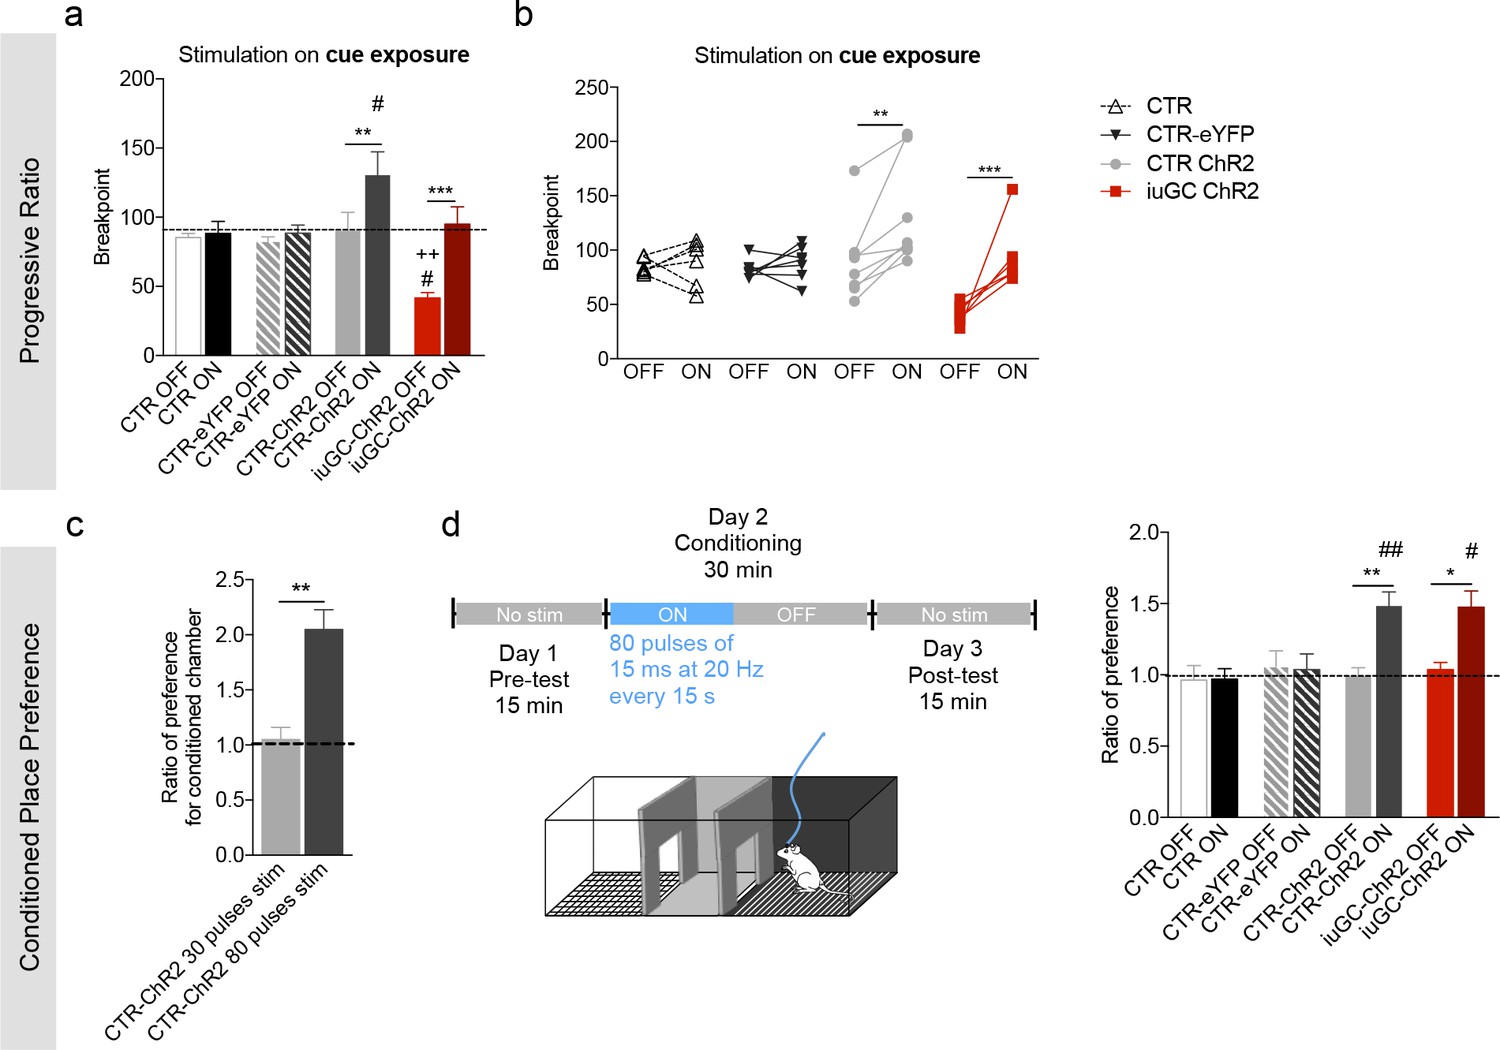
Behavioral effects of higher stimulation of LDT-VTA terminals.
(a) To verify the reinforcing properties of LDT-VTA stimulation, we performed a different protocol of optogenetic stimulation of LDT terminals that consists in higher number of pulses - 80 pulses of 15 ms at 20 Hz. (a) This stimulation is able to increase the motivational levels of both CTR-ChR2 and iuGC-ChR2 animals as seen by their increased breakpoint. No effect in CTR and CTR-eYFP groups. (b) Individual performance in the progressive ration task during laser OFF and laser ON sessions (nCTR-=6; nCTR-ChR2 = 8; niuGC-ChR2 = 6). (c) Ratio of preference of CTR-ChR2 and iuGC-ChR2 rats increases in the CPP in response to higher number of stimuli (80 pulses of 15 ms at 20 Hz) (nCTR-ChR2-stim=5, nCTR-ChR2-high stim=8). (d) Higher number of stimuli (80 pulses of 15 ms at 20 Hz, every 15 s) induces preference in CTR-ChR2 and iuGC-ChR2 animals, but not in control groups (nCTR = 6; nCTR-eYFP = 7; nCTR-ChR2 = 8; niuGC-ChR2 = 6). Data represented as mean ±s.e.m.*p<0.05; **p<0.01; ***p<0.001. #: Comparison with CTR-eYFP.
Figure 4—figure supplement 3
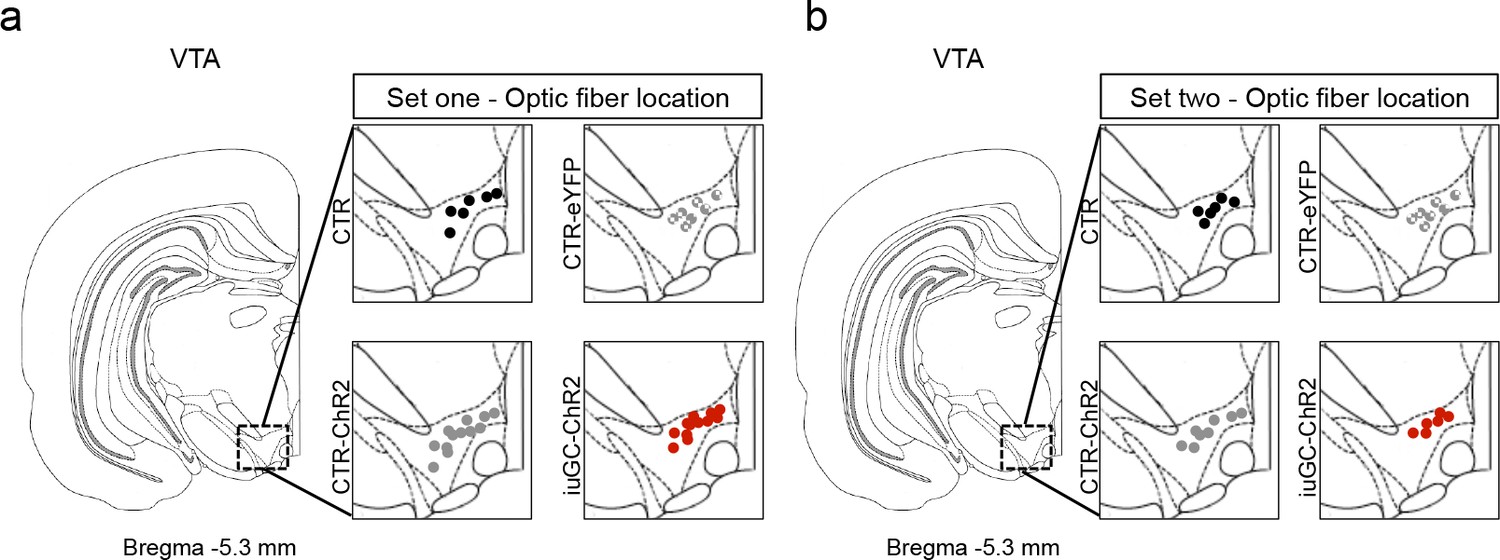
Optic fiber placement of animals used for behavioral experiments.
Schematic representation of optic fiber placement in LDT terminals in the VTA of the first (a) and second (b) set of rats that performed behavioral experiments.
Download links
A two-part list of links to download the article, or parts of the article, in various formats.
Downloads (link to download the article as PDF)
Open citations (links to open the citations from this article in various online reference manager services)
Cite this article (links to download the citations from this article in formats compatible with various reference manager tools)
Impairments in laterodorsal tegmentum to VTA projections underlie glucocorticoid-triggered reward deficits
eLife 6:e25843.
https://doi.org/10.7554/eLife.25843


