CTCF and cohesin regulate chromatin loop stability with distinct dynamics
- University of California, Berkeley, United States
- Howard Hughes Medical Institute, University of California, Berkeley, United States
Figures
Figure 1 with 5 supplements
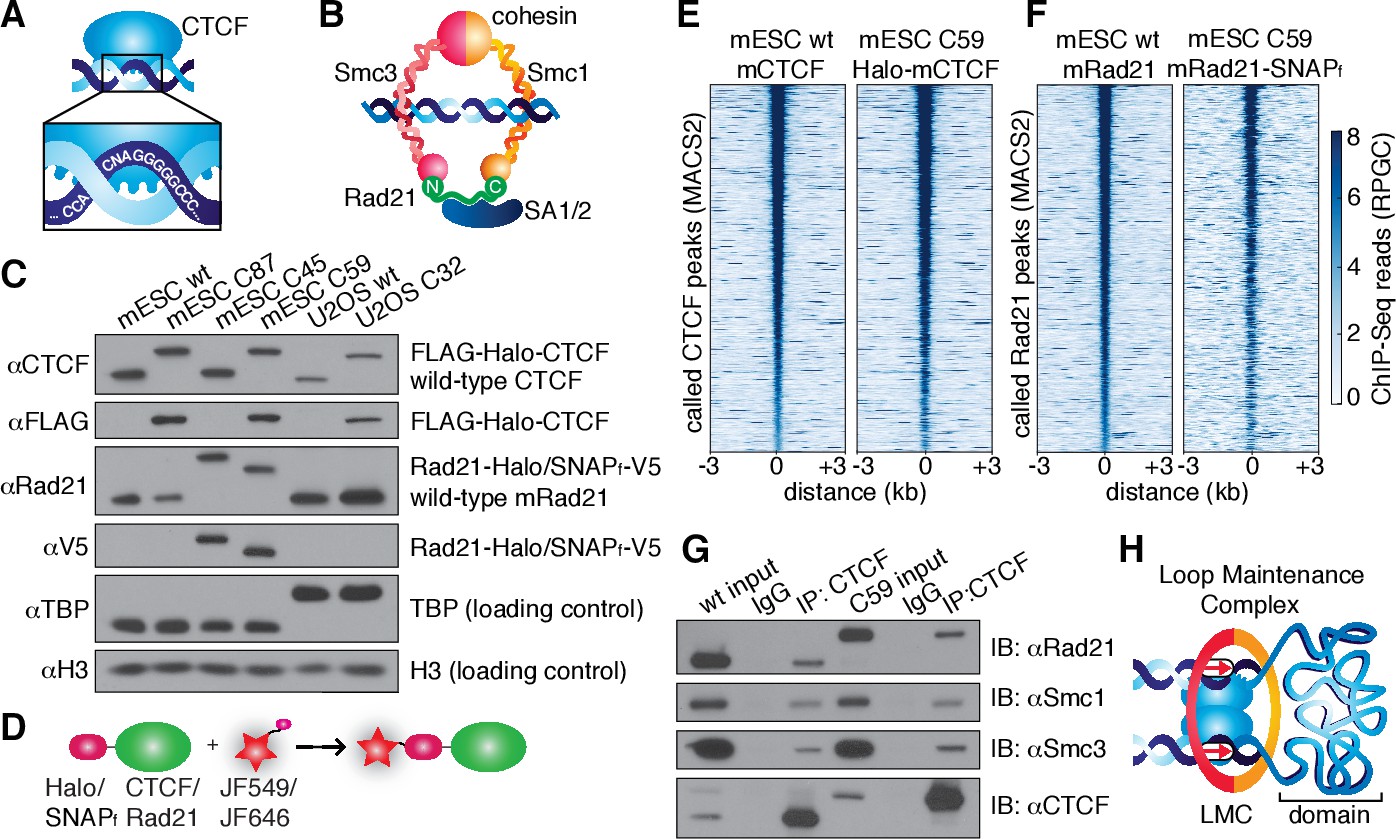
CTCF and cohesin can be endogenously tagged and form a complex.
(A) Sketch of CTCF and its consensus DNA-binding sequence. (B) Sketch of cohesin, with subunits labeled, topologically entrapping DNA. (C) Western blot of mESC and U2OS wild-type (wt) and knock-in cell lines demonstrating homozygous insertions. (D) Sketch of covalent dye-conjugation for Halo or SNAPf-Tag. (E) CTCF ChIP-Seq read count (Reads Per Genomic Content) for wild-type and C59 plotted at MAC2-called wt-CTCF peak regions centered around the peak. (F) Rad21 ChIP-Seq read count (Reads Per Genomic Content) for wild-type and C59 plotted at MACS2-called wt-Rad21 peak regions. (G) Co-IP. CTCF was immunoprecipitated and we immunoblotted for cohesin subunits Rad21, Smc1 and Smc3. (H) Sketch of a loop maintenance complex (LMC) composed of CTCF and cohesin holding together a spatial domain as a loop.
Figure 1—figure supplement 1
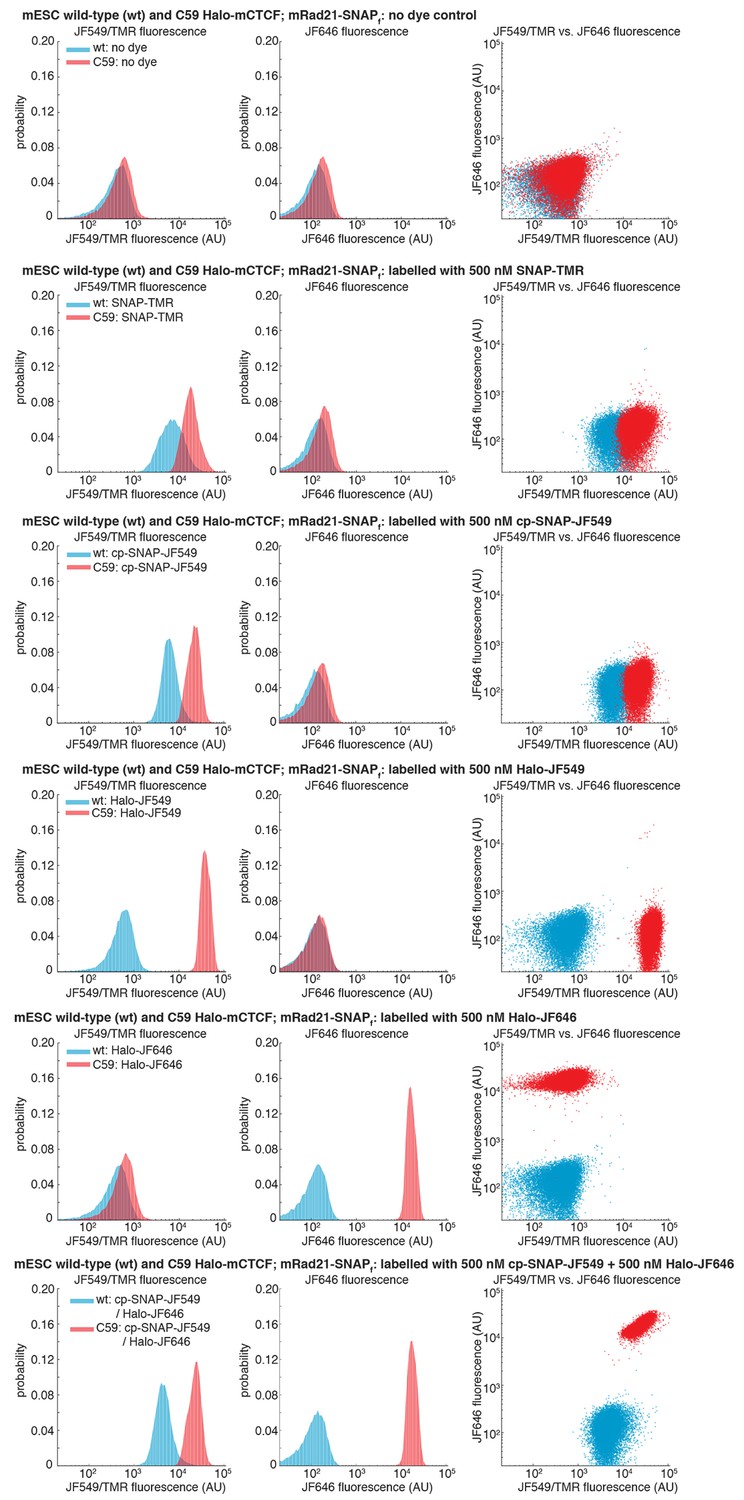
Specific labeling of HaloTagged and SNAPf-Tagged proteins in live cells.
Wild-type (wt) mouse embryonic stem cells (mESCs) and C59 mESCs expressing endogenously tagged FLAG-Halo-mCTCF and mRad21-SNAPf-V5 were labeled with the indicated dye by 30-min incubation in a 37°C incubator followed by washing with PBS and fresh medium, preparation for FACS (dissociation with trypsin, cell collection by centrifugation and filtering through 40 μm mesh) and their fluorescence was then measured using analytical flow cytometry. Around 30,000 cells were measured in each case and live cells were gated using the area of forward and side scattering. JF549/TMR fluorescence was measured using a 561 nm excitation laser and a 610/20 nm emission filter. JF646 fluorescence was measured using a 640 nm excitation laser and a 670/30 nm emission filter. Each panel shows fluorescence in the JF549/TMR channel and in the JF646 channel as well as a JF549/TMR vs. JF646 scatterplot. First panel: no dye control. Second panel: 500 nM SNAP-TMR (NEB #S9105S) labeling only. Third panel: 500 nM cp-JF549 labeling only (the cp handle also labels SNAPf-Tag proteins, but more specifically than the SNAP-handle). Fourth panel: 500 nM Halo-JF549 labeling only. Fifth panel: 500 nM Halo-JF646 labeling only. Bottom panel: double 500 nM cp-JF549 and 500 nM Halo-JF646 labeling.
Figure 1—figure supplement 2

Teratoma assay demonstrates that tagging CTCF and Rad21 does not affect pluripotency in mESCs.
350,000 wild-type and C59 (FLAG-Halo-mCTCF; mRad21-SNAPf-V5) JM8.N4 mouse embryonic stem cells were injected into the testis and kidney of Fox Chase SCID-beige male 8-week-old mice (Charles River) and tumors were harvested 27–33 days after injection (top row). Tumors were fixed with 10% formalin overnight, embedded in paraffin and cut into 5 μm serial sections and then H and E stained. Representative sections from each of the three germ layers (endoderm, mesoderm and ectoderm; highlighted by black arrows) are shown for both wild-type and C59 mES cells. Black scale bar: 100 μm.
Figure 1—figure supplement 3
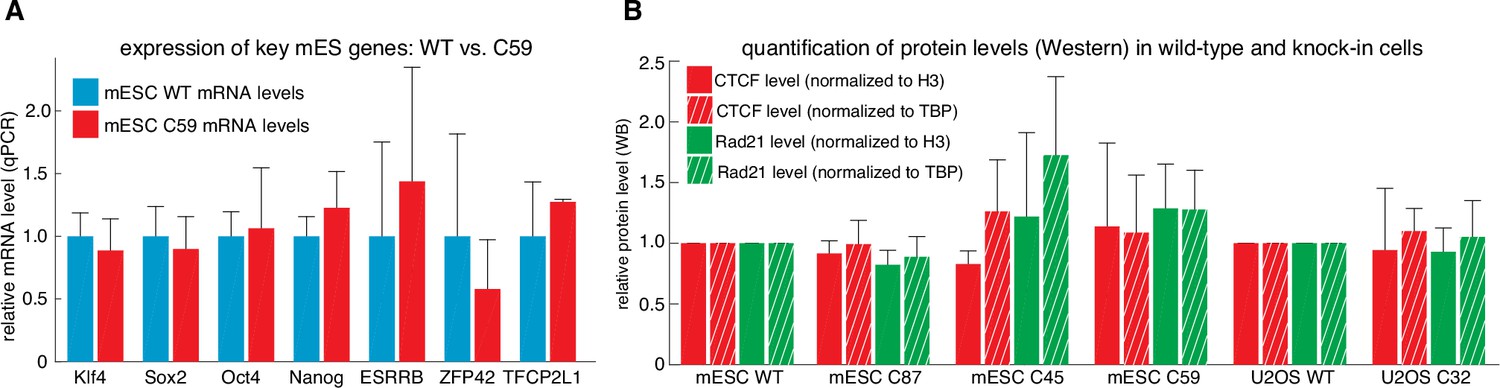
Tagging CTCF and Rad21 does not affect expression of key pluripotency genes or CTCF and Rad21 protein levels.
(A) Expression of key mouse embryonic stem cell genes measured by qPCR was similar in wild-type (blue) and C59 (FLAG-Halo-mCTCF; mRad21-SNAPf-V5) (red) JM8.N4 mouse embryonic stem cells. (B) CTCF (red) and Rad21 (green) protein levels as measured by western blot and normalized to either H3 levels (solid bar) or TBP (hashed bar) was similar between wild-type and tagged mouse embryonic stem cells (WT, C87, C45, C59) and similar between wild-type and tagged human U2OS cells (WT, C32). Error bars show standard deviation among three replicates.
Figure 1—figure supplement 4
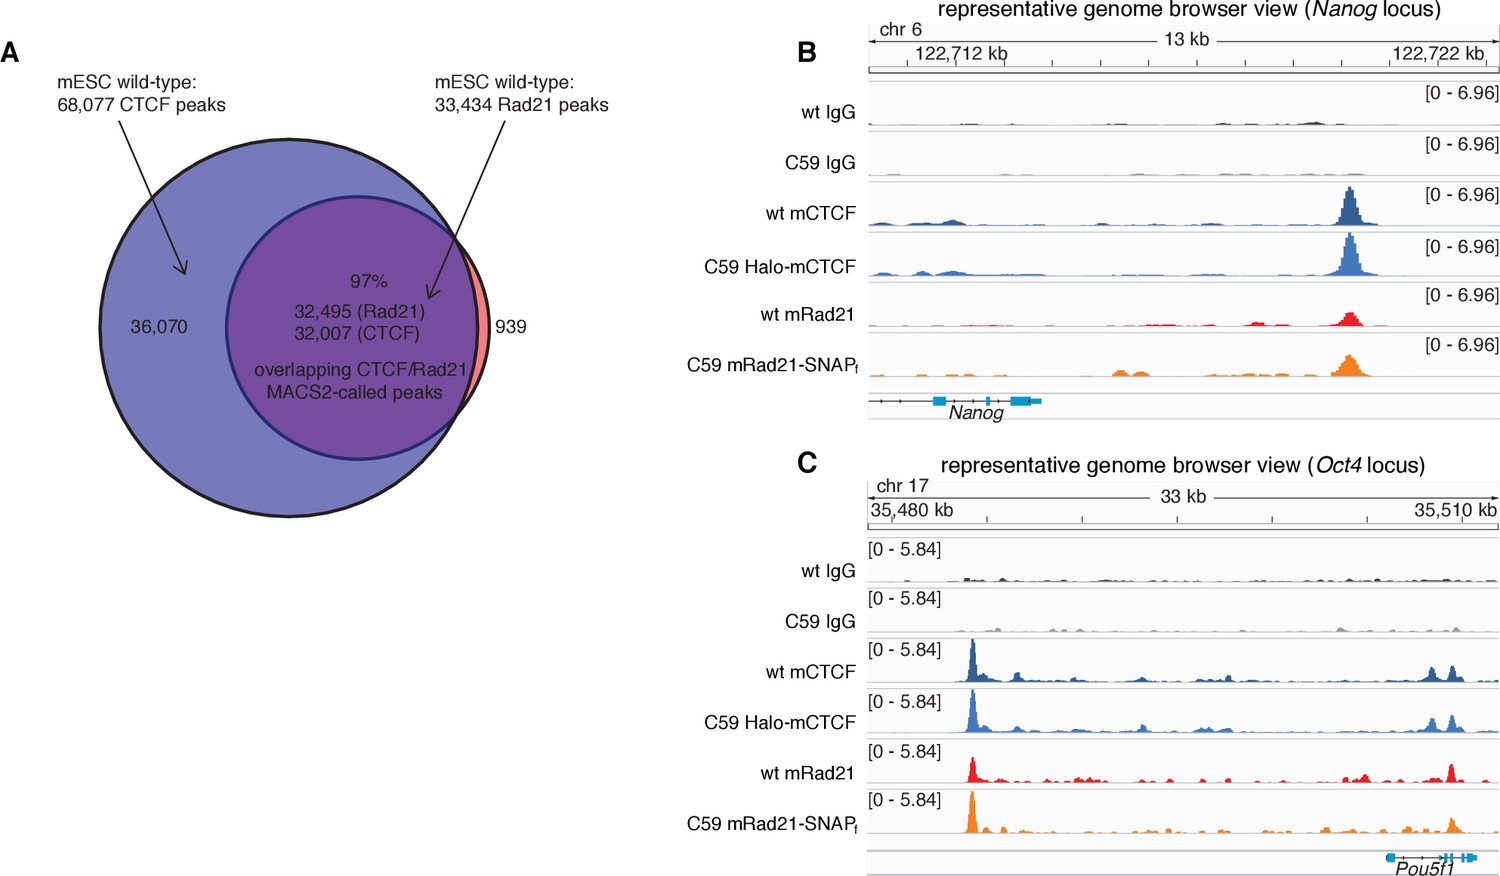
CTCF and Rad21 ChIP-Seq results in wt and C59 mESCs.
(A) Venn diagram showing overlap of called peaks (MACS2) of CTCF and Rad21 in wild-type mESCs. (B) Representative genome-browser view of IgG, CTCF and Rad21 ChIP-Seq for wild type (wt) and the double knock-in C59 mES cells at the Nanog locus on chromosome 6. As can been seen, the binding pattern of both CTCF and Rad21 is unaltered after tagging. Scale is (number of reads)/(106/(total read count)). (C) Representative genome-browser view of IgG, CTCF and Rad21 ChIP-Seq for wild type (wt) and the double knock-in C59 mES cells at the Oct4 (Pou5f1) locus on chromosome 17. As can been seen, the binding pattern of both CTCF and Rad21 is unaltered after tagging. Scale is (number of reads)/(106/(total read count)).
Figure 1—figure supplement 5

Tagging CTCF and Rad21 does not affect the ChIP-Seq genomic binding pattern.
(A) ChIP-Seq enrichment (RPGC: Reads Per Genomic Content) shown for all called CTCF peaks in wild-type mESCs, sorted by wild-type CTCF enrichment. The six columns show IgG ChIP-Seq, CTCF ChIP-Seq and mRad21 ChIP-Seq for wild-type (left) and C59 (FLAG-Halo-mCTCF; mRad21-SNAPf-V5) genome-edited (right) cells. On the right, the average in each case for the same conditions. (B) ChIP-Seq enrichment (RPGC: Reads Per Genomic Content) shown for all called Rad21 peaks in wild-type mESCs, sorted by wild-type Rad21 enrichment. The six columns show IgG ChIP-Seq, CTCF ChIP-Seq and mRad21 ChIP-Seq for wild-type (left) and C59 (FLAG-Halo-mCTCF; mRad21-SNAPf-V5) genome-edited (right) cells. On the right, the average in each case for the same conditions.
Figure 2 with 4 supplements

CTCF and cohesin have very different residence times on chromatin.
(A) Sketch illustrating HiLo (highly inclined and laminated optical sheet illumination) (Tokunaga et al., 2008). (B) Example images showing single Halo-mCTCF molecules labeled with JF549 binding chromatin in a live mES cell. (C) A plot of the uncorrected survival probability of single Halo-mCTCF molecules and one- and two-exponential fits. Right inset: a log-log survival curve. (D) Photobleaching-corrected residence times for Halo-CTCF, Halo-3xNLS and a zinc-finger (11 His→Arg point-mutations) mutant or entire deletion of the zinc-finger domain. Error bars show standard deviation between replicates. For each replicate, we recorded movies from ~6 cells and calculated the average residence time using H2B-Halo for photobleaching correction. Each movie lasted 20 min with continuous low-intensity 561 nm excitation and 500 ms camera integration time. Cells were labeled with 1–100 pM JF549. (E) FRAP recovery curves for Halo-mCTCF, H2B-Halo and Halo-3xNLS in mES cells labeled with 1 μM Halo-TMR. (F) FRAP recovery curves for mRad21-Halo and H2B-Halo in mES cells labeled with 1 μM Halo-TMR. Right: sketch of Fucci cell-cycle phase reporter (Sakaue-Sawano et al., 2008; Sladitschek and Neveu, 2015). We modified the system to contain mCitrine-hGem(aa1-110) and SCFP3A-hCdt(aa30-120) to avoid overlap in the red region of the electromagnetic spectrum. Each FRAP curve shows mean recovery from >15 cells from ≥3 replicates and error bars show the standard error.
Figure 2—figure supplement 1
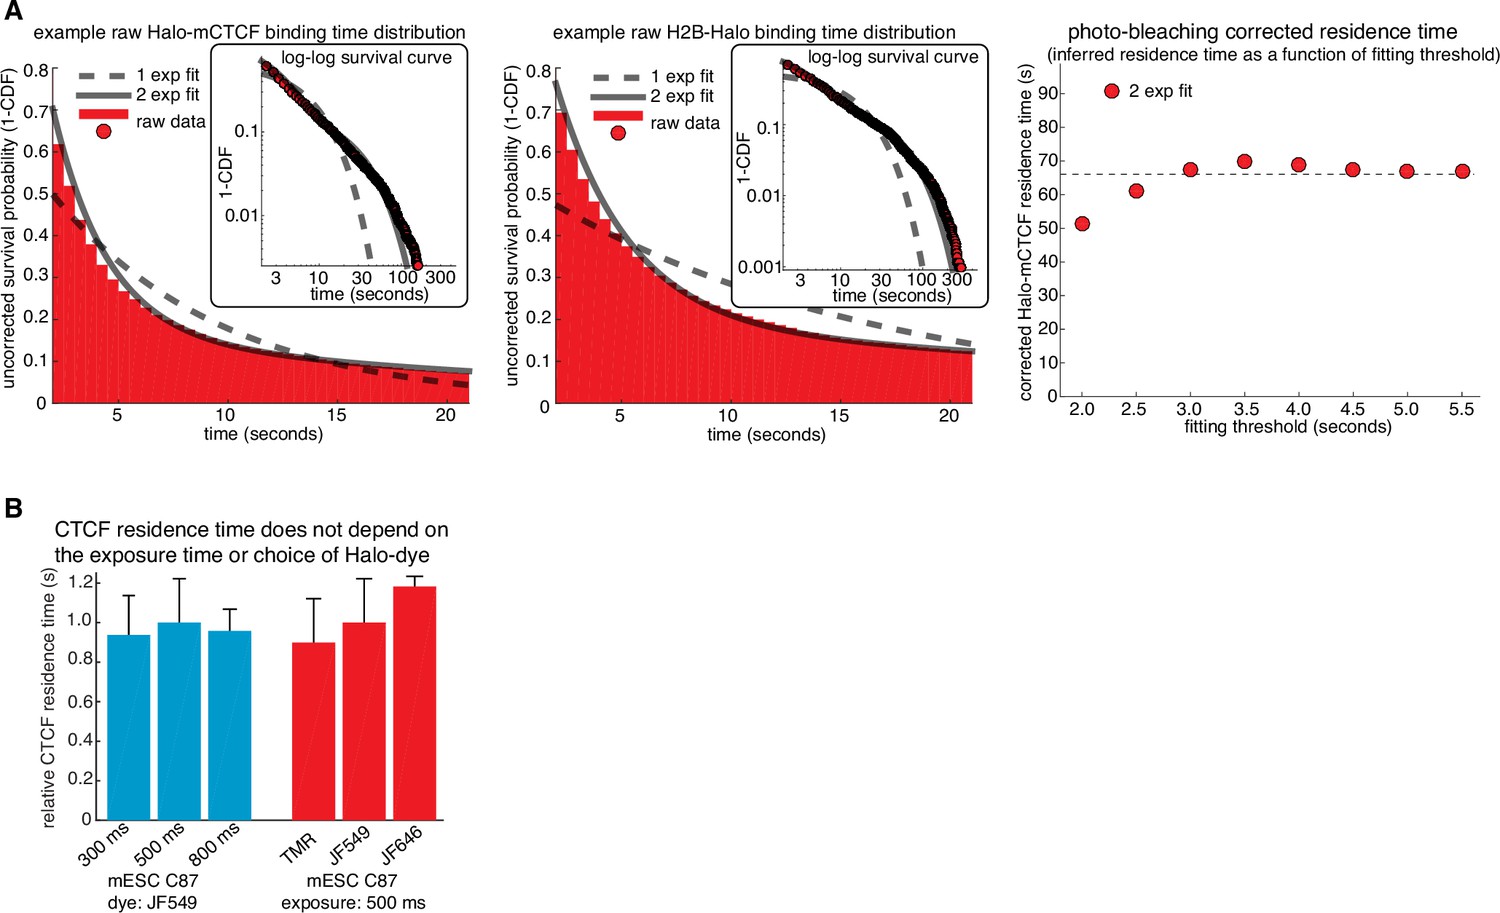
Illustration of how residence times are inferred from SMT and control experiments.
(A) Illustration of how residence times were inferred from single-molecule tracking experiments. Left, a double-exponential fit to Halo-CTCF and H2B-Halo survival curves measured from the two cell lines on the same day. H2B-Halo shows negligible turnover within the observation time window and thus the measured off-rate for H2B-Halo was taken as the rate of photo-bleaching. Right, a sketch showing the inferred residence time (true CTCF off rate = measured CTCF off rate - measured H2B off rate) as a function of the frame threshold used for the two-exponential fitting. The residence time was taken as the inferred residence time once convergence was reached (threshold = 2.5 s). (B) Bar graph showing that the CTCF residence time does not depend on the exposure time or dye used. Left, C87 Halo-mCTCF was labeled with JF549 and residence time was measured as in (A) using exposure times of either 300 ms, 500 ms or 800 ms. Right, residence time was measured as in (A) using an exposure time of 500 ms with C87 Halo-mCTCF and HaloTag dyes TMR, JF549 and JF646. Error bars show the standard deviation between replicates – each replicate consisted of 20 min movies of ~6 cells corrected for photobleaching using a similar number of H2B-Halo cells labeled with the same dye and using the same exposure time. At least three replicates were performed.
Figure 2—figure supplement 2
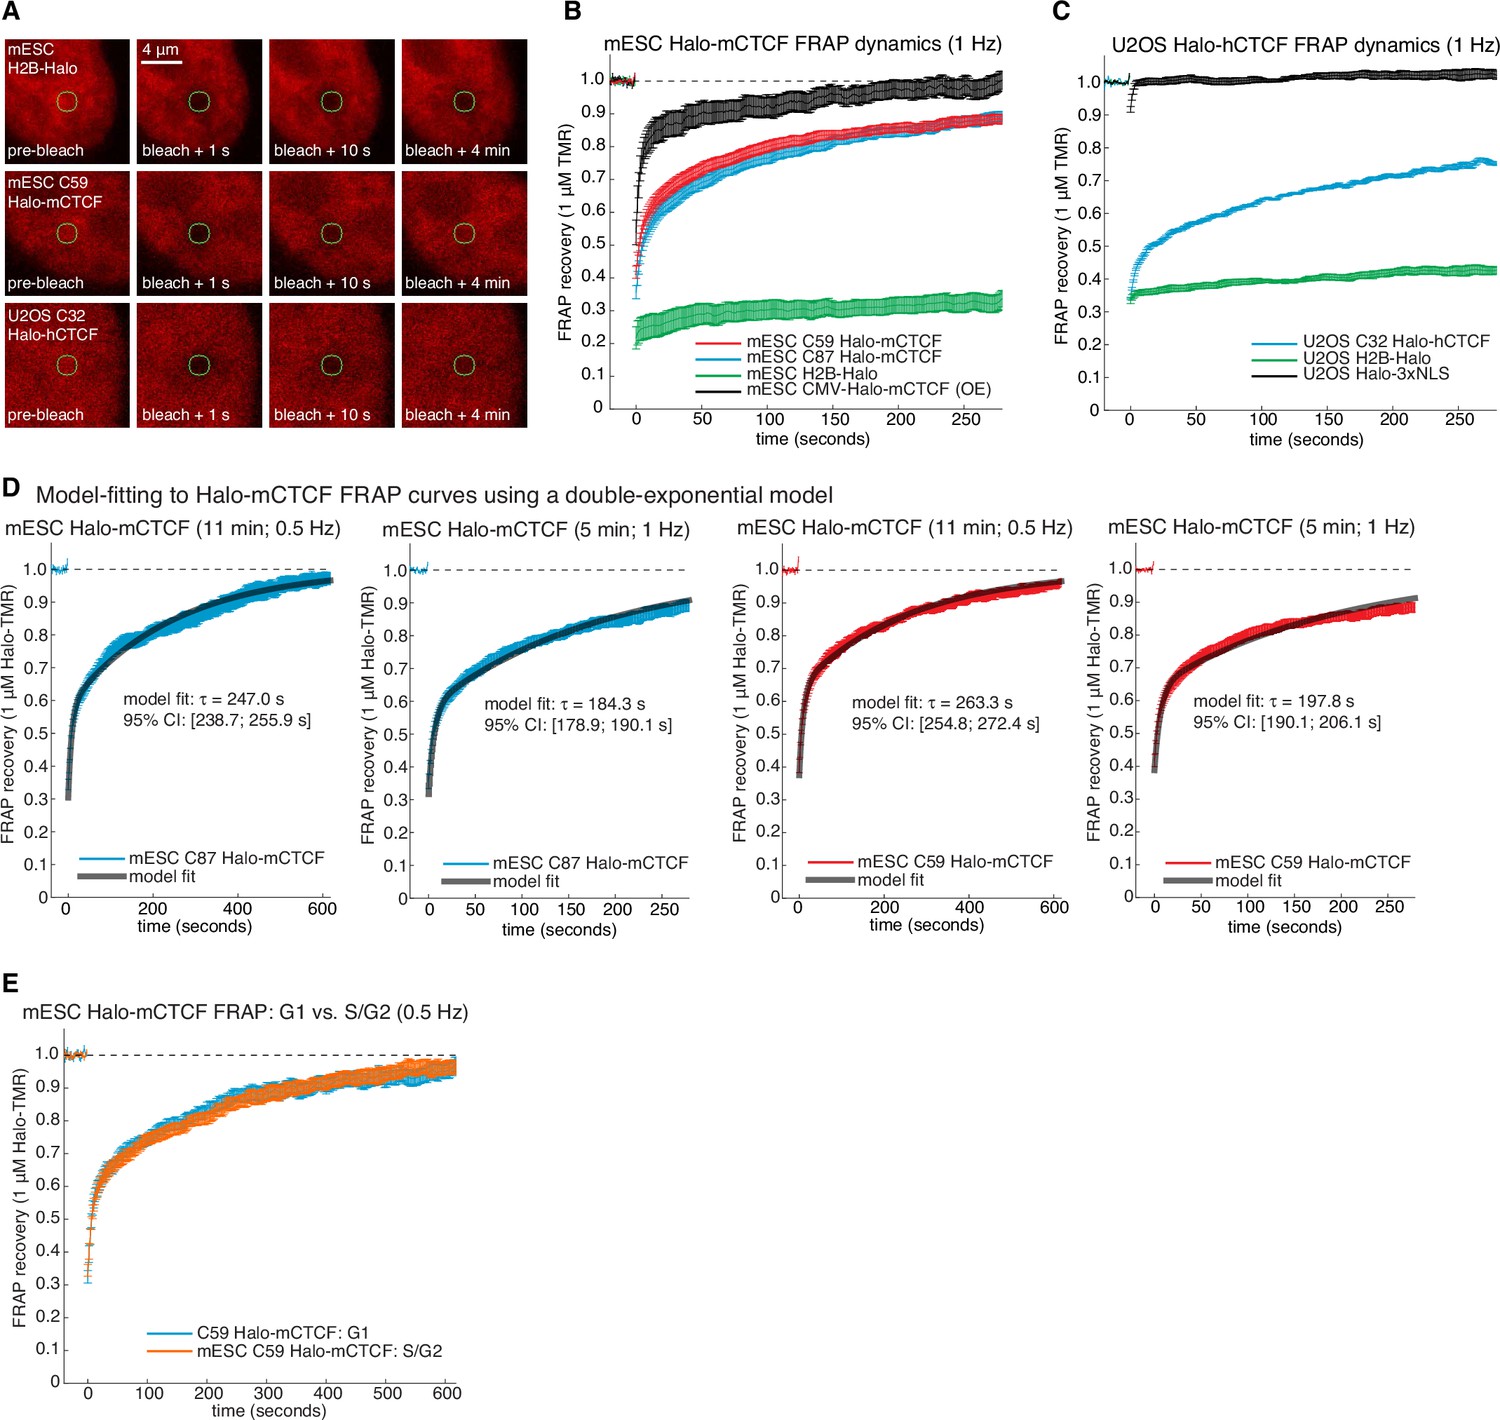
Supplementary and control CTCF FRAP experiments.
(A) Representative raw confocal microscopy images of H2B-Halo, C59 Halo-mCTCF and C32 Halo-hCTCF each labeled with 1 μM TMR just before, 1 s after, 10 s after and 4 min after bleaching a 1 μm circular spot (green circle). mES cells especially show significant movement on the minute time-scale and all movies were drift-corrected. (B) Photo-bleaching corrected FRAP curves measured at one frame per second in mESCs. C59 and C87 Halo-mCTCF show the behavior of endogenously tagged CTCF, and transiently transfected Halo-mCTCF expressed from a CMV-promoter is shown in black (OE: over-expressed). As can be clearly seen, the CTCF FRAP recovery is much faster when over-expressed. Error bars show standard error. (C) Photobleaching-corrected FRAP curves measured at one frame per second in human U2OS cells. Halo-3xNLS and H2B-Halo are controls for rapid and negligible recovery, respectively, demonstrating the validity our photobleaching- and drift-correction approaches. CTCF recovery in human U2OS cells is similar, albeit slightly slower than in mESCs. (D) Model-fitting of C87 and C59 Halo-mCTCF FRAP curves using a reaction dominant model (Materials and methods) for FRAP experiments at either 11 min and 0.5 Hz or 5 min and 1 Hz. The model-inferred residence time and the 95% confidence interval (CI) from the fitting is shown. (E) Dynamics of Halo-mCTCF (C59 mESCs) does not change between G1- and S/G2-phase of the cell cycle. G1 and S/G2 were distinguished using the Fucci system (Figure 2—figure supplement 4).
Figure 2—figure supplement 3
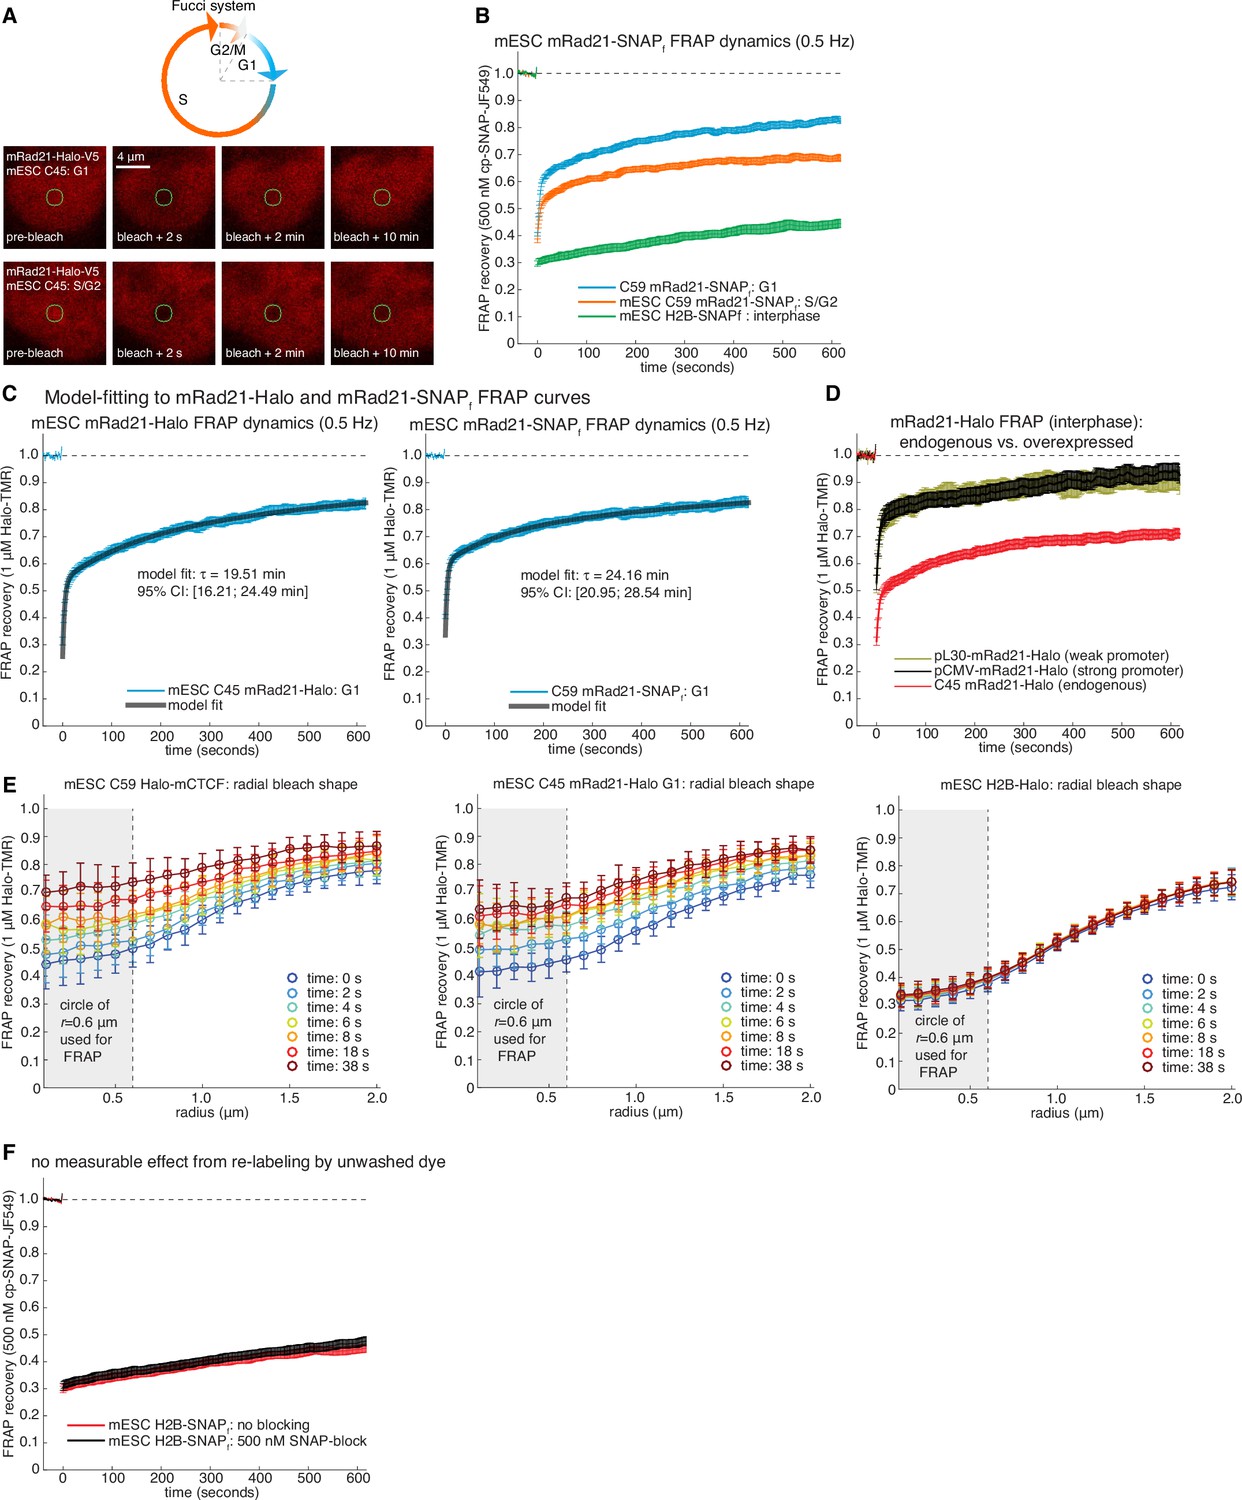
Supplementary and control cohesin FRAP experiments.
(A) Top, sketch of the Fucci-system, which distinguishes cells in G1-phase from S/G2-phase of the cell cycle. Bottom, representative raw confocal microscopy images of mESC C45 mRad21-Halo in G1 or S/G2 labeled with 1 μM TMR just before, 2 s after, 2 min after and 10 min after bleaching a 1 μm circular spot (green circle). We corrected for cell drift. (B) FRAP curves for SNAPf-tagged mRad21 (C59 mRad21-SNAPf-V5) similar to FRAP curves for C45 presented in main Figure 2F. C59 mRad21-SNAPf co-expressing Fucci reporters or H2B-SNAPf mESCs were labeled with cp-JF549, a small molecule dye that specifically labels the SNAPf- but not the Halo-Tag, and FRAP recovery measured, photobleaching and drift-corrected. Overall, the FRAP recovery of mRad21-Halo and mRad21-SNAPf were identical within error. Error bars show standard error. (C) show exponential-model fits (black line) to C45 mRad21-Halo and C59 mRad21-SNAPf FRAP curves (blue data) in G1-phase of the cell cycle. We stress that while direct modeling of FRAP curves suffers from fitting models with several fitted parameters to relatively simply data curves, a rough residence time estimate can, nevertheless, be obtained. The average inferred residence time and 95% confidence intervals (CI) are shown. (D) FRAP of endogenous and transiently transfected mRad21-Halo in interphase cells. For C45 mRad21-Halo we ‘simulated’ interphase cells by scaling the G1 to S/G2 FRAP by 1:7 (roughly the ratio of G1 to S/G2 cells for mESCs). For transient transfections, wild-type mESCs were transfected with a plasmid encoding either pCMV-mRad21-Halo (high expression) or pL30-mRad21-Halo (lower expression). Cells were transfected with Lipofectamine 3000 using the ThermoFisher Scientific protocol the day before the FRAP imaging. On the imaging day, cells were labeled with 1 μM TMR. Error bars show standard error. (E) Radial bleach spot profile. The radial bleach spot profile was determined by calculating the FRAP recovery at the perimeter of circles of increasing radii in increments of 100 nm. This was averaged over multiple cells (~20–30 cells). Curves show the mean radial profile along with the standard deviation (error bars) for C59 Halo-mCTCF, C45 mRad21-Halo in G1 and mESC H2B-Halo. As can be seen, diffusion does not significantly affect the recovery at a radius of 0.6 μm, which is what we used for calculating the FRAP recovery. (F) FRAP recovery for H2B-SNAPf labeled with 500 nM cp-JF549, extensively washed and then with or without blocking with 500 nM SNAP-block (a ‘dark’ ligand). As can be seen, there was no effect on the FRAP recovery within error (error bars show standard error). Thus, re-binding of insufficiently washed out dye after the bleach pulse does not significantly affect our FRAP recovery at the time-scales we are working at.
Figure 2—figure supplement 4
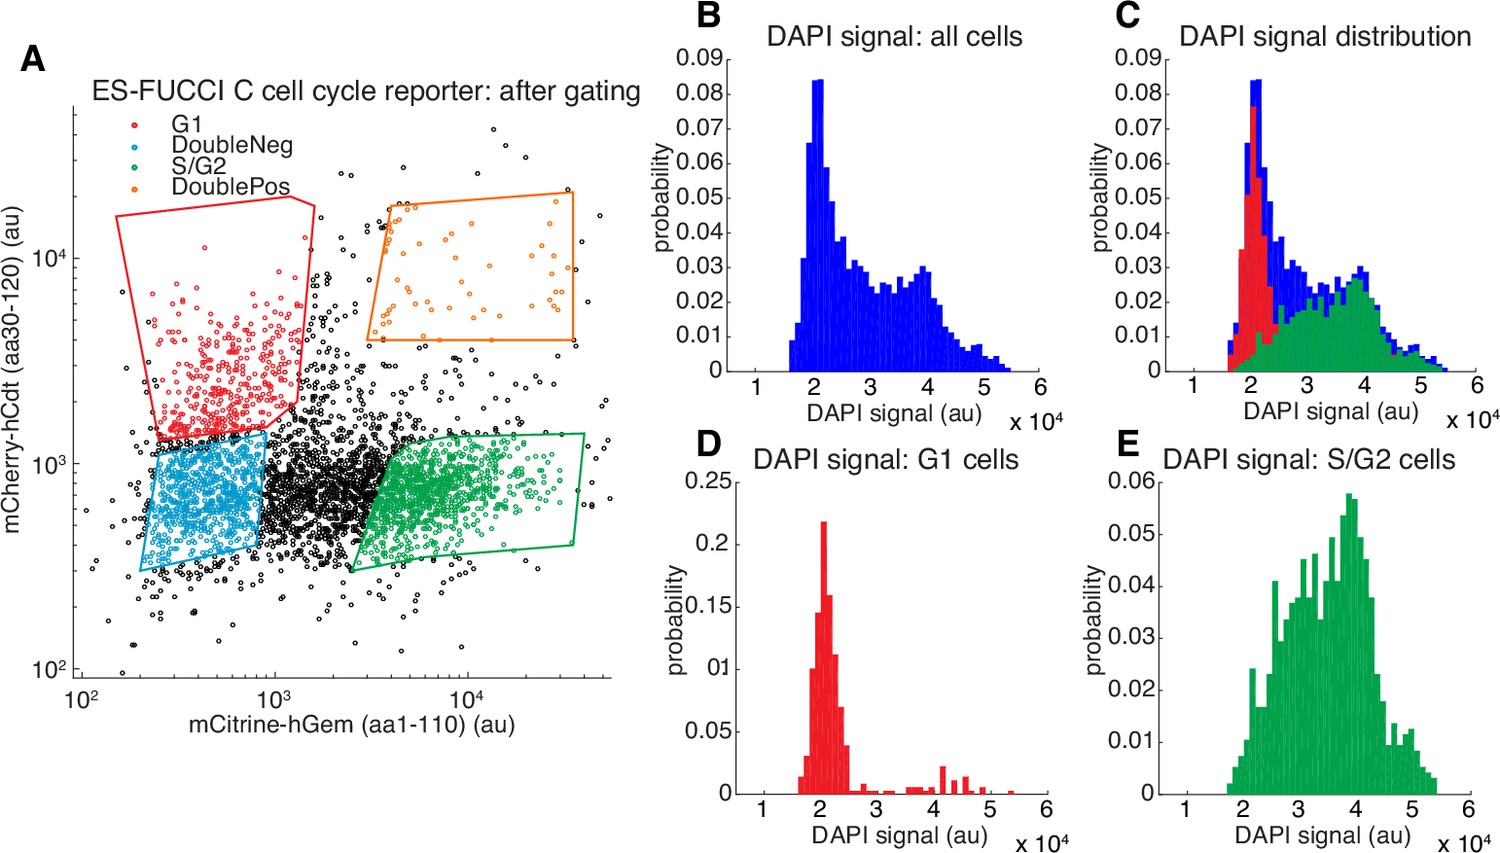
Validation of Fucci reporters.
(A) FACS gating of C59 mESCs co-expressing the Fucci reporters mCherry-hCdt(aa30-120) and mCitrine-hGem(aa1-110) with the four polygon gates shown (Sakaue-Sawano et al., 2008; Sladitschek and Neveu, 2015). Cells in G1 express mCherry-hCdt(aa30-120) but not mCitrine-hGem(aa1-110), whereas cells in S/G2 express mCitrine-hGem(aa1-110) but not mCherry-hCdt(aa30-120). For FRAP and SMT experiments where small-molecule dyes in the red part of the electromagnetic spectrum were used (TMR, JF549 or JF6464), we used SCFP3A-hCdt instead of mCherry-hCdt. We also note that strictly speaking, only the mCitrine-hGem(aa1-110) reporter is necessary since cells negative for this reporter must be in G1. (B–E) histograms showing DAPI (which stains DNA) signal for the gated populations in (A). Cells in G1 have not replicated their DNA and thus have 2n chromosomes (D), whereas cells in G2 have finished replicating their DNA and have 4n chromosomes. Cells in S-phase are actively replicating DNA and have an intermediate number of chromosomes (E). As can be seen, the Fucci system allows us to enrich for a relatively pure G1 population (D).
Figure 3 with 1 supplement
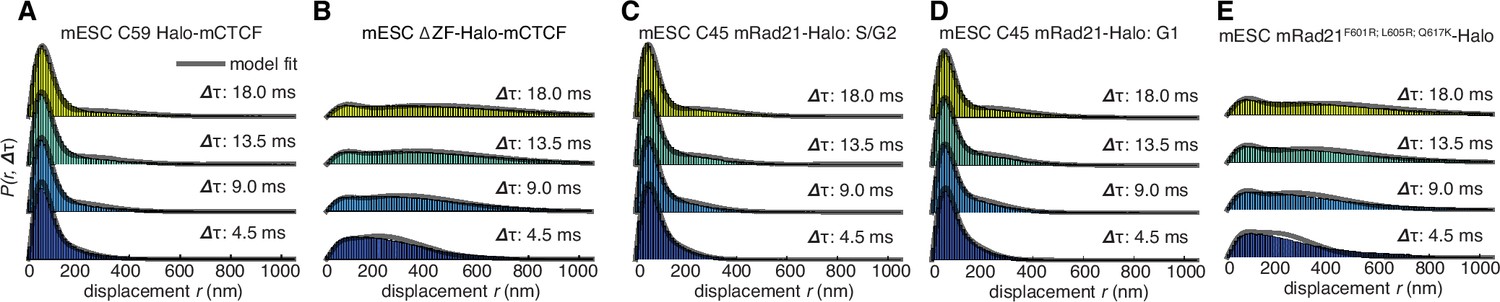
Dynamics of CTCF and cohesin’s nuclear search mechanism.
Single-molecule displacements from ~225 Hz stroboscopic (single 1 ms 633 nm laser pulse per camera integration event) paSMT experiments over multiple time scales for (A) C59 Halo-mCTCF, (B) a Halo-mCTCF mutant with the zinc-finger domain deleted, C45 mRad21-Halo in S/G2 phase (C) and G1 phase (D) and (E) a Rad21 mutant that cannot form cohesin complexes. Kinetic model fits (three fitted parameters) to raw displacement histograms are shown as black lines. All calculated and fitted parameters are listed in Table 1. Displacement histograms were obtained by merging data from at least 24 cells from at least three replicates.
Figure 3—figure supplement 1
Supplementary stroboscopic paSMT experiments and controls.
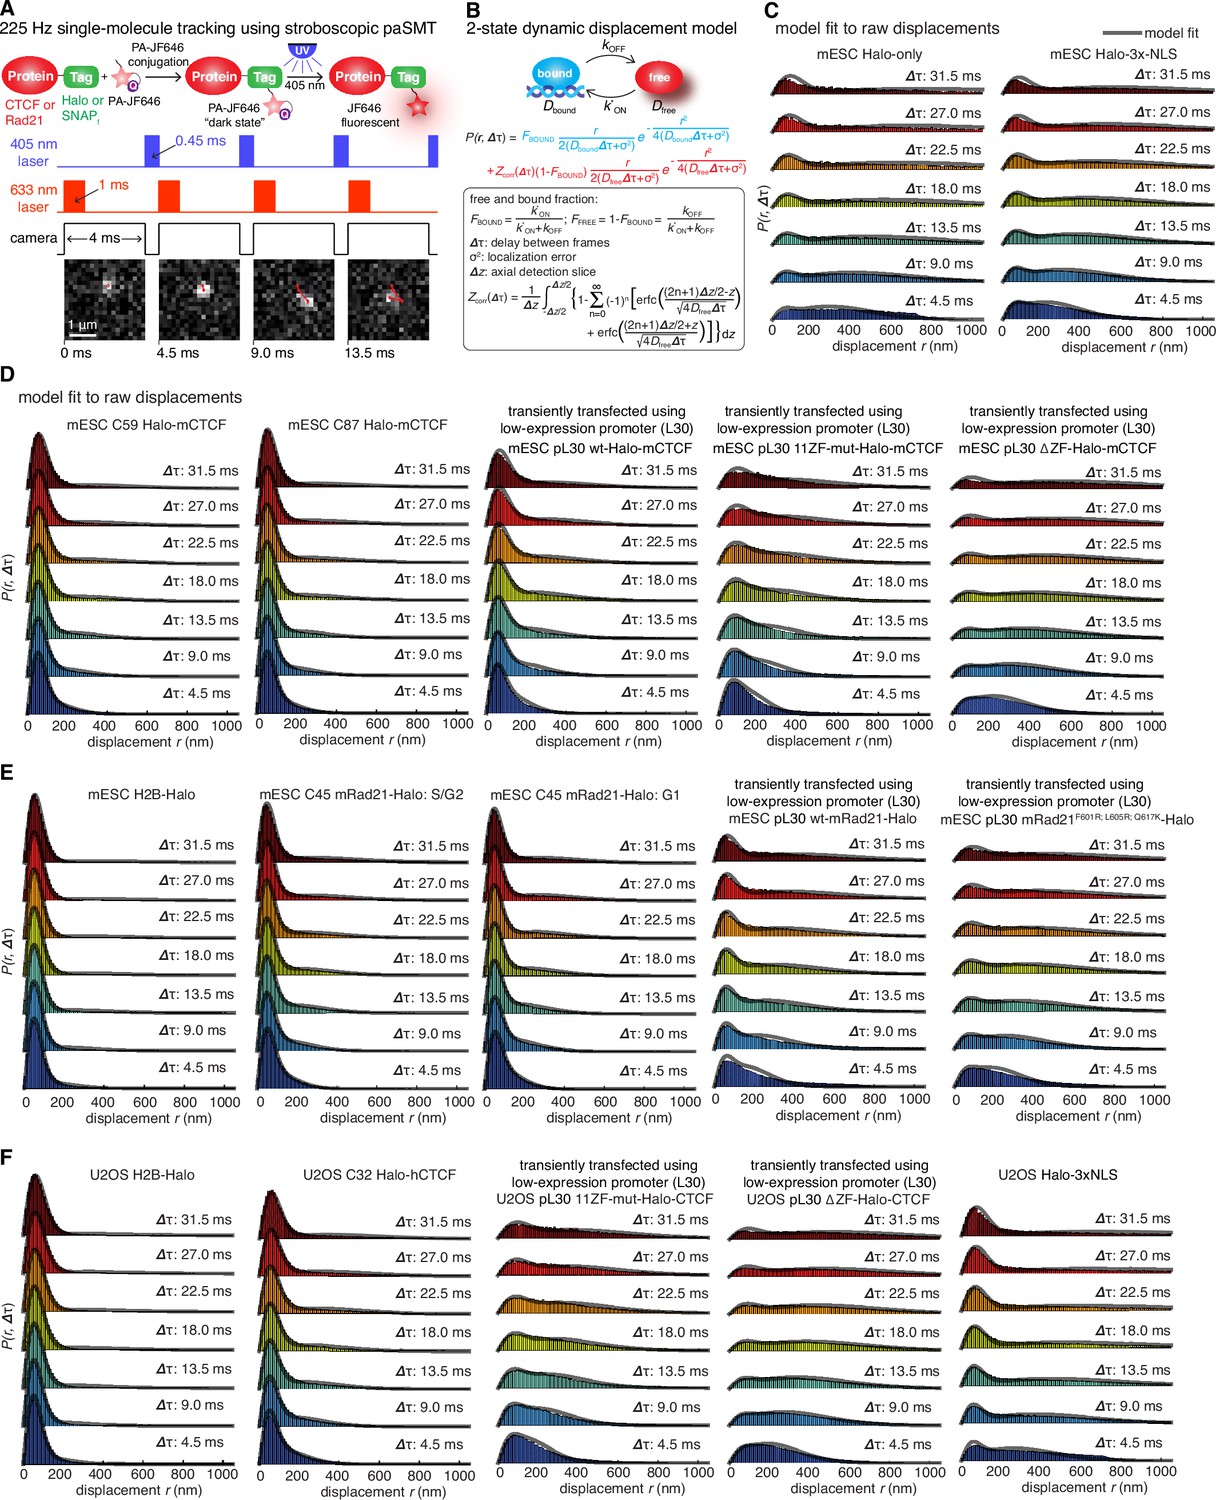
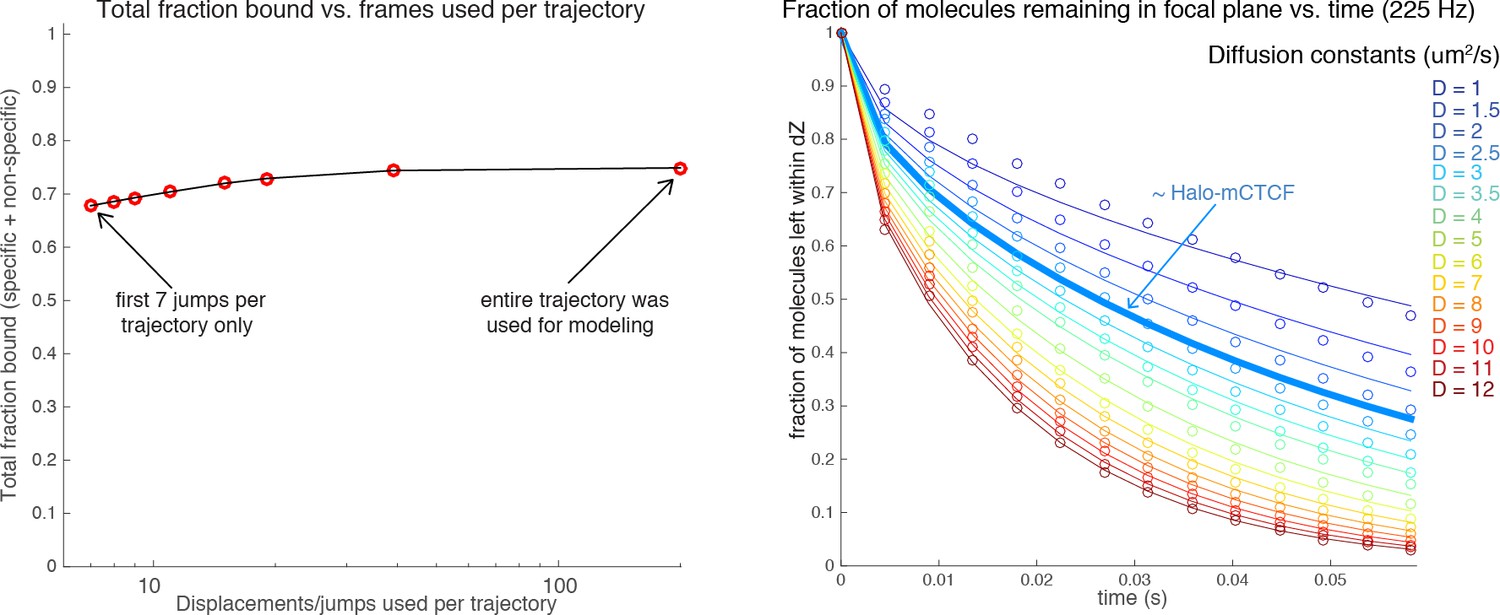
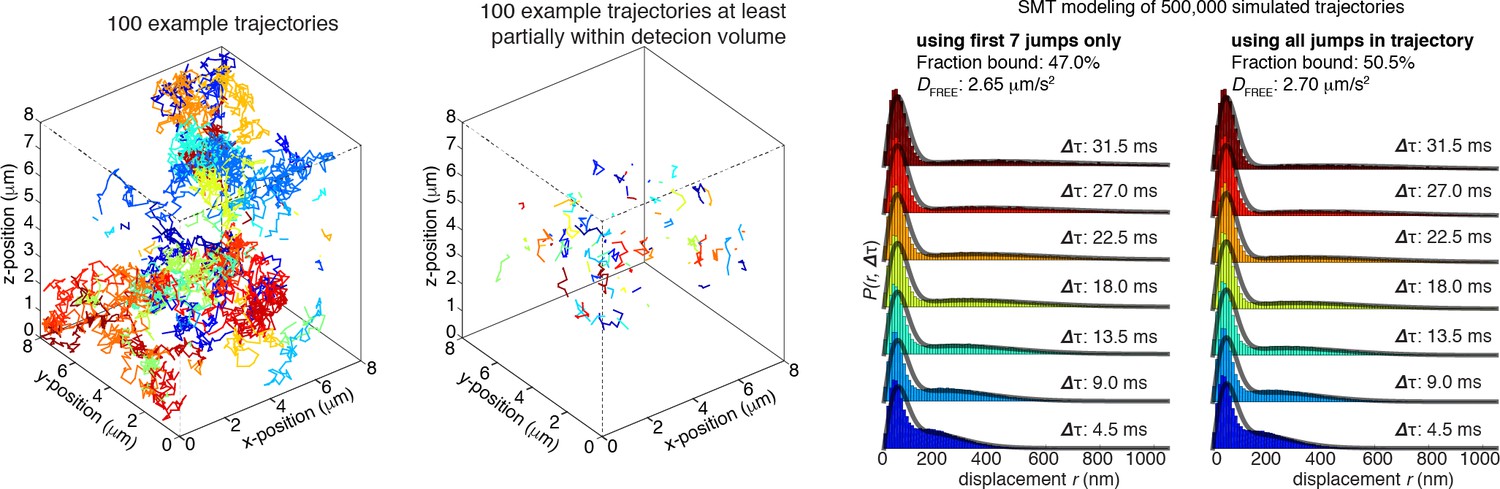
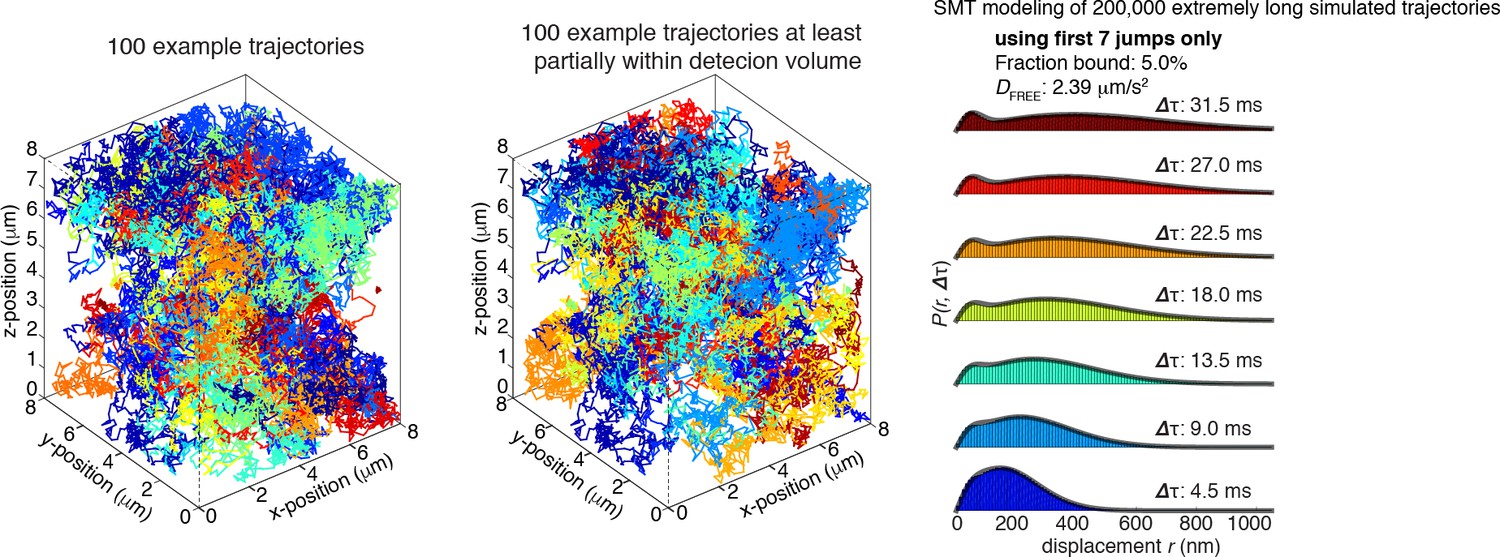
(A) Sketch illustrating stroboscopic paSMT. Sketch illustrating labeling Halo-tagged proteins, e.g. CTCF or Rad21, with PA-JF646. This dye remains dark until 405 nm activation, which converts it to regular fluorescent JF646. The advantage is that thousands of single-molecule trajectories can be recorded from a single cell at a density of ~0.5 fluorescent molecules per nucleus per frame, which makes tracking unambiguous, by using very low intensity 405 nm excitation. Since high 633 nm laser powers are used, most molecules bleach within 3–8 frames. We use PA-JF646 instead of PA-JF549 since the red-shifted 633 nm laser induces less photo-toxicity, although the displacement histograms were identical between PA-JF549 and PA-JF646. Moreover, we never record for more than 2 min per cell. We observed no visible signs of photo-toxicity after 2 min of paSMT. Below, sketch illustrating stroboscopic illumination. To minimize ‘motion-blurring’ of fast-diffusing molecules, we used pulsed 633 nm excitation with 1 ms pulses. The camera integration time was 4 ms + ~0.447 ms (frame-transfer mode) resulting in a frame rate of roughly 225 Hz. Below, raw microscopy images demonstrating that even fast-diffusing molecules can be imaged and tracked (red lines) at high-signal-to-background. (B) Overview of two-state dynamic displacement model. Full details are provided in the Materials and methods. Briefly, the model assumes molecules can exist in either a chromatin associating (specific and non-specific) state called ‘bound’ or in a free 3D diffusion state called ‘free’. A mathematical model describing how the distribution of displacements, r, depends on the time delay, fraction bound, diffusion constants, localization error and axial detection slice is shown below. Overall, the model contains three fitted parameters, which were estimated using least squares fitting to the raw displacements considering the first seven displacements (Δτ ~4.5 ms to 31.5 ms). For ease of visualization, we show displacement histograms in (C–F), but the fitting was performed on cumulative distribution functions (CDFs) to minimize binning artifacts. (C–F) displacement histograms for various cell lines all measured using the approach in (A–B). For ease of visualization, the displacement histograms are cut off at 1050 nm, but longer trajectories were included in the model fitting. (C) shows Halo-only and Halo-3xNLS in mESCs, which show negligible binding. Note, that most fast-diffusing molecules eventually move out of the focal plane. (D) shows various Halo-mCTCF constructs. C59 and C87 are endogenous Halo-mCTCF knock-ins. pL30-wt-Halo-mCTCF was transiently expressed using a weak promoter (L30). Compared to Halo-mCTCF overexpressed by the strong CMV promoter, overexpressing Halo-mCTCF using a weak promoter (L30) causes only a minor (10 percentage points; likely due to saturation of binding sites) underestimation of the fraction bound. Right, two transiently transfected Halo-mCTCF mutants: 11ZF-mut-Halo-mCTCF is a CTCF mutant with an essential His amino acid in all 11 zinc-fingers mutated to Arg, which should abolish specific DNA-binding. We used this mutant to estimate the non-specifically bound fraction. ΔZF-Halo-mCTCF has the entire 11-zinc-finger domain deleted. We used this mutant to verify that the zinc-finger domain solely is responsible for chromatin association. (E) H2B-Halo and Rad21 experiments in mESCs. We used H2B-halo as a control for a protein that is almost exclusively bound. Note that since we use an EF1a promoter to express H2B, which is not cell-cycle regulated, some H2B-molecules do show free diffusion. mRad21-Halo in S/G2 and G1 are also shown, as is transiently transfected wt-mRad21-Halo expressed using the low-expression promoter, L30. Even though mRad21-Halo is only weakly overexpressed, most molecules show free 3D diffusion. The overexpression artifact may be caused by the fact that without similar overexpression of Smc1, Smc3 and SA1/2, most Rad21 cannot form cohesin complexes. Finally, a Rad21-mutant (F601R, L605R, Q617K), which cannot form cohesin complexes was used to estimate the non-specifically bound Rad21 fractions. (F) Stroboscopic paSMT experiments in human U2OS cells. H2B-Halo and Halo-3xNLS were used as controls for mostly bound and free molecules and the same zinc-finger mutants as in mESCs were transiently transfected as control for non-specific chromatin association. Note that C32 Halo-hCTCF shows slightly more free diffusion than C59 and C87 in mESCs.
Figure 4 with 1 supplement

Models of CTCF/cohesin mediated chromatin loop dynamics.
(A) Two-color dSTORM of C59 mESCs with mRad21-SNAPf labeled with 500 nM JF549 (green) and Halo-mCTCF labeled with 500 nM JF646 (magenta). High-intensity co-localization is shown as white. Low-intensity co-localization is not visible. Zoom-in on red 3 μm square. Note, the SNAP dye cp-JF549 shows slight artefactual labeling of the nuclear envelope, which was removed during image rendering. (B) Cluster radii distributions for CTCF (C87 and C59) and Rad21 (C45) from single-color PALM experiments using PA-JF549 dyes. (C) Pair cross correlation of C59 and mESC H2B-SNAPf co-expressing Halo-only. Error bars are standard error from 12 to 18 dSTORM-imaged cells over three replicates. (D) Sketch illustrating the concept of a dynamic loop maintenance complex (LMC) composed of CTCF and cohesin with frequent CTCF exchange and slow, rare cohesin dissociation, which causes loop deformation and topological re-orientation of chromatin. (E) Sketch illustrating how dynamic CTCF exchange during loop extrusion of cohesin may explain alternative loop formations when two competing convergent sites (B and C) for another site A) exist.
Figure 4—figure supplement 1

Overview of super-resolution PALM approach and control experiments.
(A) Representative super-resolution PALM reconstruction of Halo-mCTCF in C59 mouse embryonic stem cells. Left: full nucleus. Right: zoom-in on a 3 μm square before (top) and after (bottom) cluster assignment using a Bayesian clustering algorithm. (B) Representative super-resolution PALM reconstruction of mRad21-Halo in C45 mouse embryonic stem cells. Left: full nucleus. Right: zoom-in on a 3 μm square before (top) and after (bottom) cluster assignment using a Bayesian clustering algorithm. (C) Bar graphs showing fraction of molecules in clusters for different mES cell lines as inferred from Bayesian cluster assignments. Bar graphs show mean per 3 μm square and the error bars show the standard error. (D) Bar graphs showing cluster radii in clusters for different mES cell lines as inferred from Bayesian cluster assignments. Bar graphs show mean per 3 μm square and the error bars show the standard error. (E) Representative control for photo-blinking in apparent PALM clustering. U2OS C32 Halo-hCTCF was labeled with ~50:50 PA-JF549:PA-JF646 and imaged using two-color PALM. Clusters were assigned as in (C–D) and the fraction of CTCF molecules in each cluster labeled with JF549 and JF646 plotted. If PALM clustering was solely a photo-blinking artifact, clusters should be exclusively composed of either JF549 or JF646, whereas under ideal conditions the distribution should follow a binomial distribution. The observed distributions resemble the expected binomial distributions suggesting that most called clusters are not a photo-blinking artifact (Kullback-Leibler divergence ~0.3 bits).
Author response image 1
Author response image 2
Author response image 3
Author response image 4
Author response image 5
Videos
Video 1
Single-molecule tracking of Halo-mCTCF in mESCs at 2 Hz.
Related to Figure 2. Using long 500 ms camera integration causes most diffusing molecules to ‘motion-blur’ into the background. Laser: 561 nm. Dye: JF549. One pixel: 160 nm.
Video 2
Single-molecule tracking of Halo-mCTCF in mESCs at 225 Hz.
Related to Figure 3. Stroboscopic (1 ms of 633 nm) paSMT allows tracking of fast-diffusing molecules. Lasers: 405 and 633 nm. Dye: PA-JF646. One pixel: 160 nm.
Video 3
Single-molecule tracking of ΔZF-Halo-mCTCF in transiently transfected mESCs at 225 Hz.
Related to Figure 3. Stroboscopic (1 ms of 633 nm) paSMT allows tracking of fast-diffusing molecules. Lasers: 405 and 633 nm. Dye: PA-JF646. One pixel: 160 nm.
Tables
Table 1
Nuclear search mechanism parameters.Table 1 lists key parameters for the nuclear search mechanism inferred from model fitting of the displacements in Figure 3 and the residence times in Figure 2.
| Fraction bound (specific) | Fraction bound (nonspecific) | Free 3D diffusion fraction | Apparent DFREE (m2/s) | SEARCH (total) | Fraction of SEARCH in free 3D diffusion | Fraction of SEARCH in non-specific chromatin association | |
|---|---|---|---|---|---|---|---|
| mESC C59 Halo-mCTCF | 48.9% | 19.1% | 32.0% | 2.5 | 65.9 s | 41.3 s | 24.6 s |
| mESC C87 Halo-mCTCF | 49.3% | 19.1% | 31.6% | 2.3 | 62.6 s | 39.0 s | 23.6 s |
| U2OS C32 Halo-hCTCF | 39.8% | 17.7% | 42.5% | 2.5 | 102.8 s | 71.9 s | 30.9 s |
| mESC C45 mRad21-Halo: G1 | 39.8% | 13.7% | 46.5% | 1.5 | 33.0 min | 25.5 min | 7.5 min |
| mESC C45 mRad21-Halo: S/G2 | 49.8% | 13.7% | 36.5% | 1.5 | n/a | n/a | n/a |
Additional files
-
Supplementary file 1
Table with ChIP-Seq relevant information.
- https://doi.org/10.7554/eLife.25776.022
-
Supplementary file 2
Supplementary information and table with primer sequences.
- https://doi.org/10.7554/eLife.25776.023
Download links
A two-part list of links to download the article, or parts of the article, in various formats.
Downloads (link to download the article as PDF)
Open citations (links to open the citations from this article in various online reference manager services)
Cite this article (links to download the citations from this article in formats compatible with various reference manager tools)
CTCF and cohesin regulate chromatin loop stability with distinct dynamics
eLife 6:e25776.
https://doi.org/10.7554/eLife.25776


