A bulky glycocalyx fosters metastasis formation by promoting G1 cell cycle progression
- Stanford University, United States
- University of California, San Francisco, United States
- Howard Hughes Medical Institute, Stanford University, United States
Figures
Figure 1 with 3 supplements
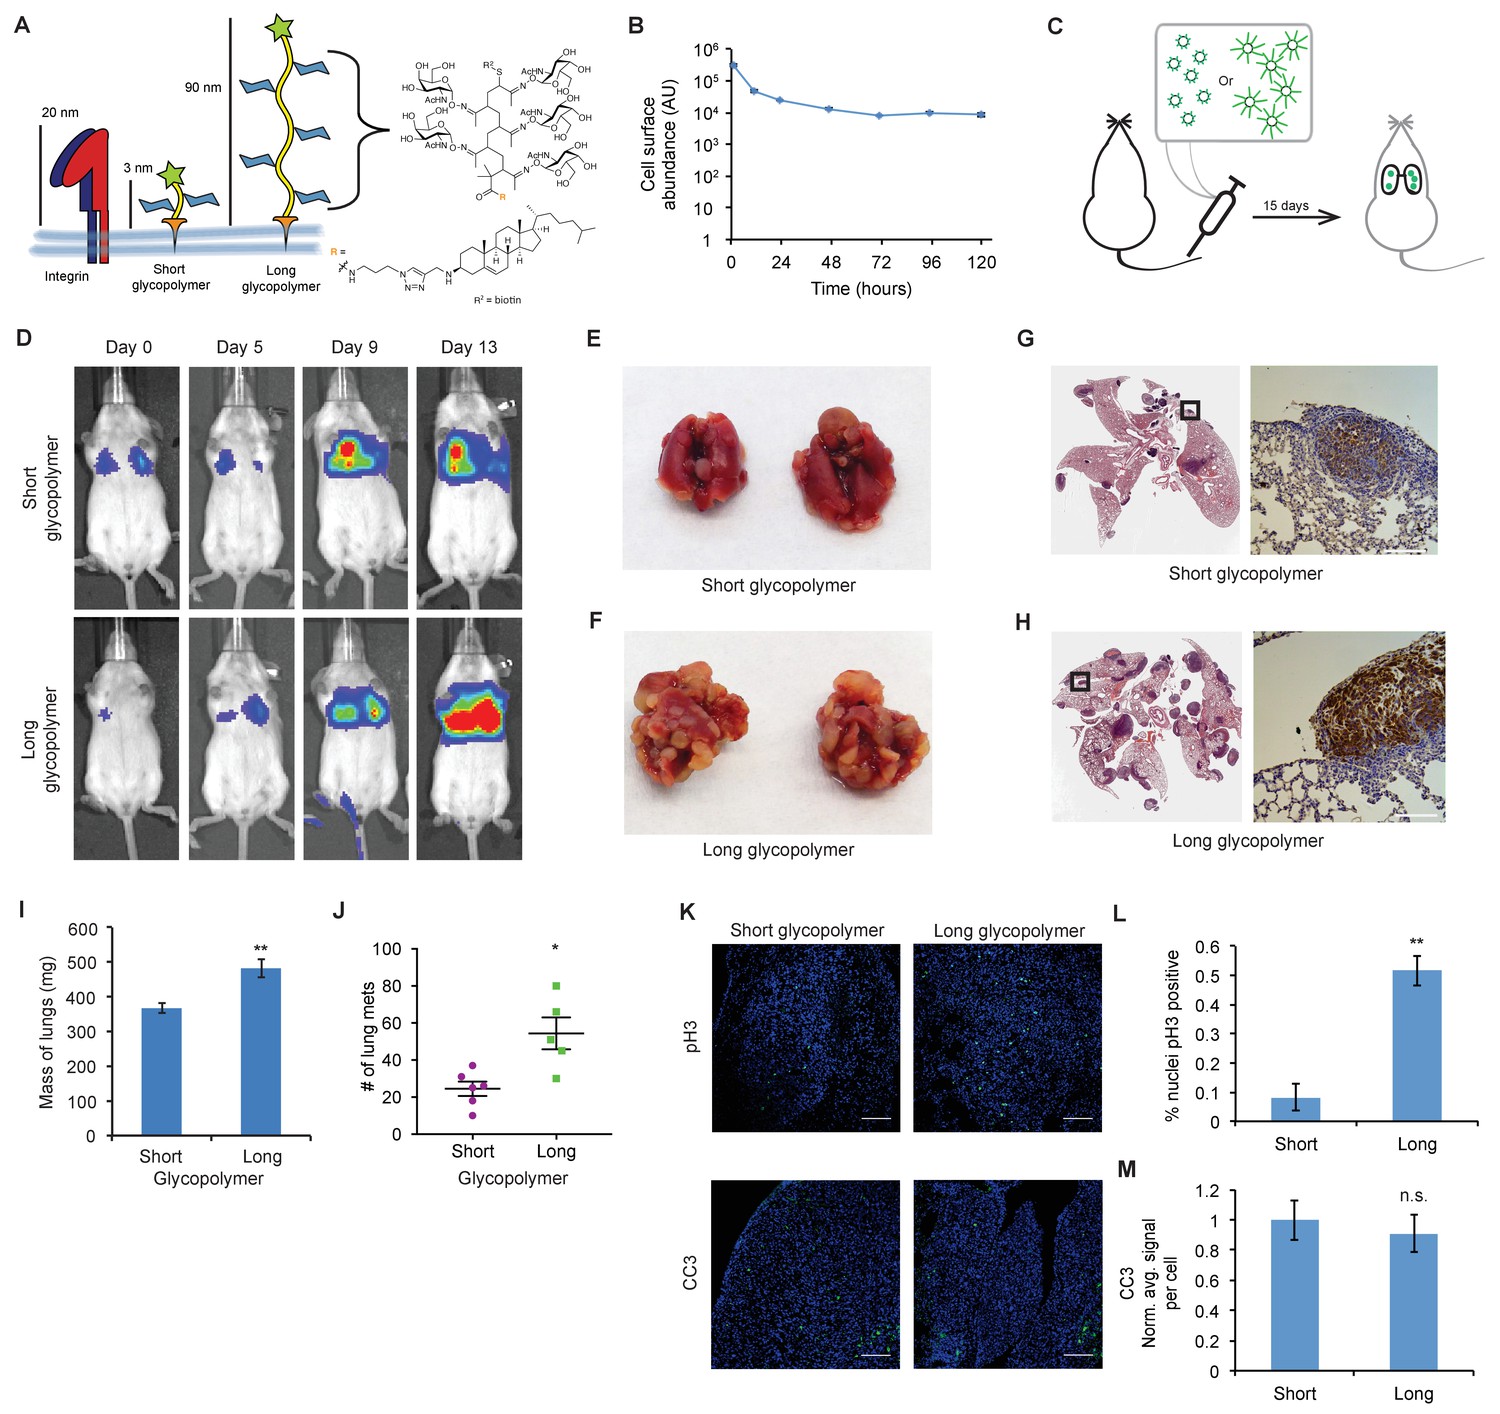
The glycocalyx increases metastatic potential in a size dependent manner.
(A) Mucin-mimetic glycopolymers consist of a poly(methyl vinyl ketone) polymer with pendant GalNAc residues. The glycopolymer terminates in a synthetic sterol for insertion into cell membranes. Precise synthetic control allows for glycopolymers to be made much larger or smaller than integrins. (B) Glycopolymers reside on 4TO7 cell surfaces for days. (C) Experimental scheme for Figure 1. Balb/c mice were injected with syngeneic 4TO7 mammary carcinoma cells bearing long or short glycopolymers. Tail vein injections lead cells to the capillary beds of the lungs where subsequent metastatic growth can be observed. (D) Bioluminescence Imaging (BLI) of mice injected with either long or short glycopolymer-bearing cells. (E) and (F) Gross appearance of lungs excised from mice at 15 days post injection. (G) and (H) H and E staining and IHC labeling for mApple indicating presence of exogenously introduced cells. (I) Lungs excised during necropsy were weighed, wet, before fixing. (J) Frank mets were counted on whole lung sections at 5 mm into sectioning for each mouse and grouped according to glycopolymer treatment type of injected cells. (K) IF staining of mets for the mitotic marker pH3 or apoptotic marker CC3 in green. DAPI nuclear staining is shown in blue. (L) and (M) Quantification of IF signal. For pH3, shown is the quotient of positive over total nuclei. For CC3, total signal was normalized to the average signal per nuceli in mets from short glycopolymer treated cells. For both L and M, shown is the mean ±SEM of three mice per group from which 3–4 tumors were averaged each. For I and J, shown is the mean ±SEM of n = 6 for mice injected with short glycopolymer-treated cells and n = 5 for mice injected with long glycopolymer-treated cells. Scale bars are 100 μm. *p<0.05, **p<0.01 (Student’s paired t-test).
Figure 1—figure supplement 1
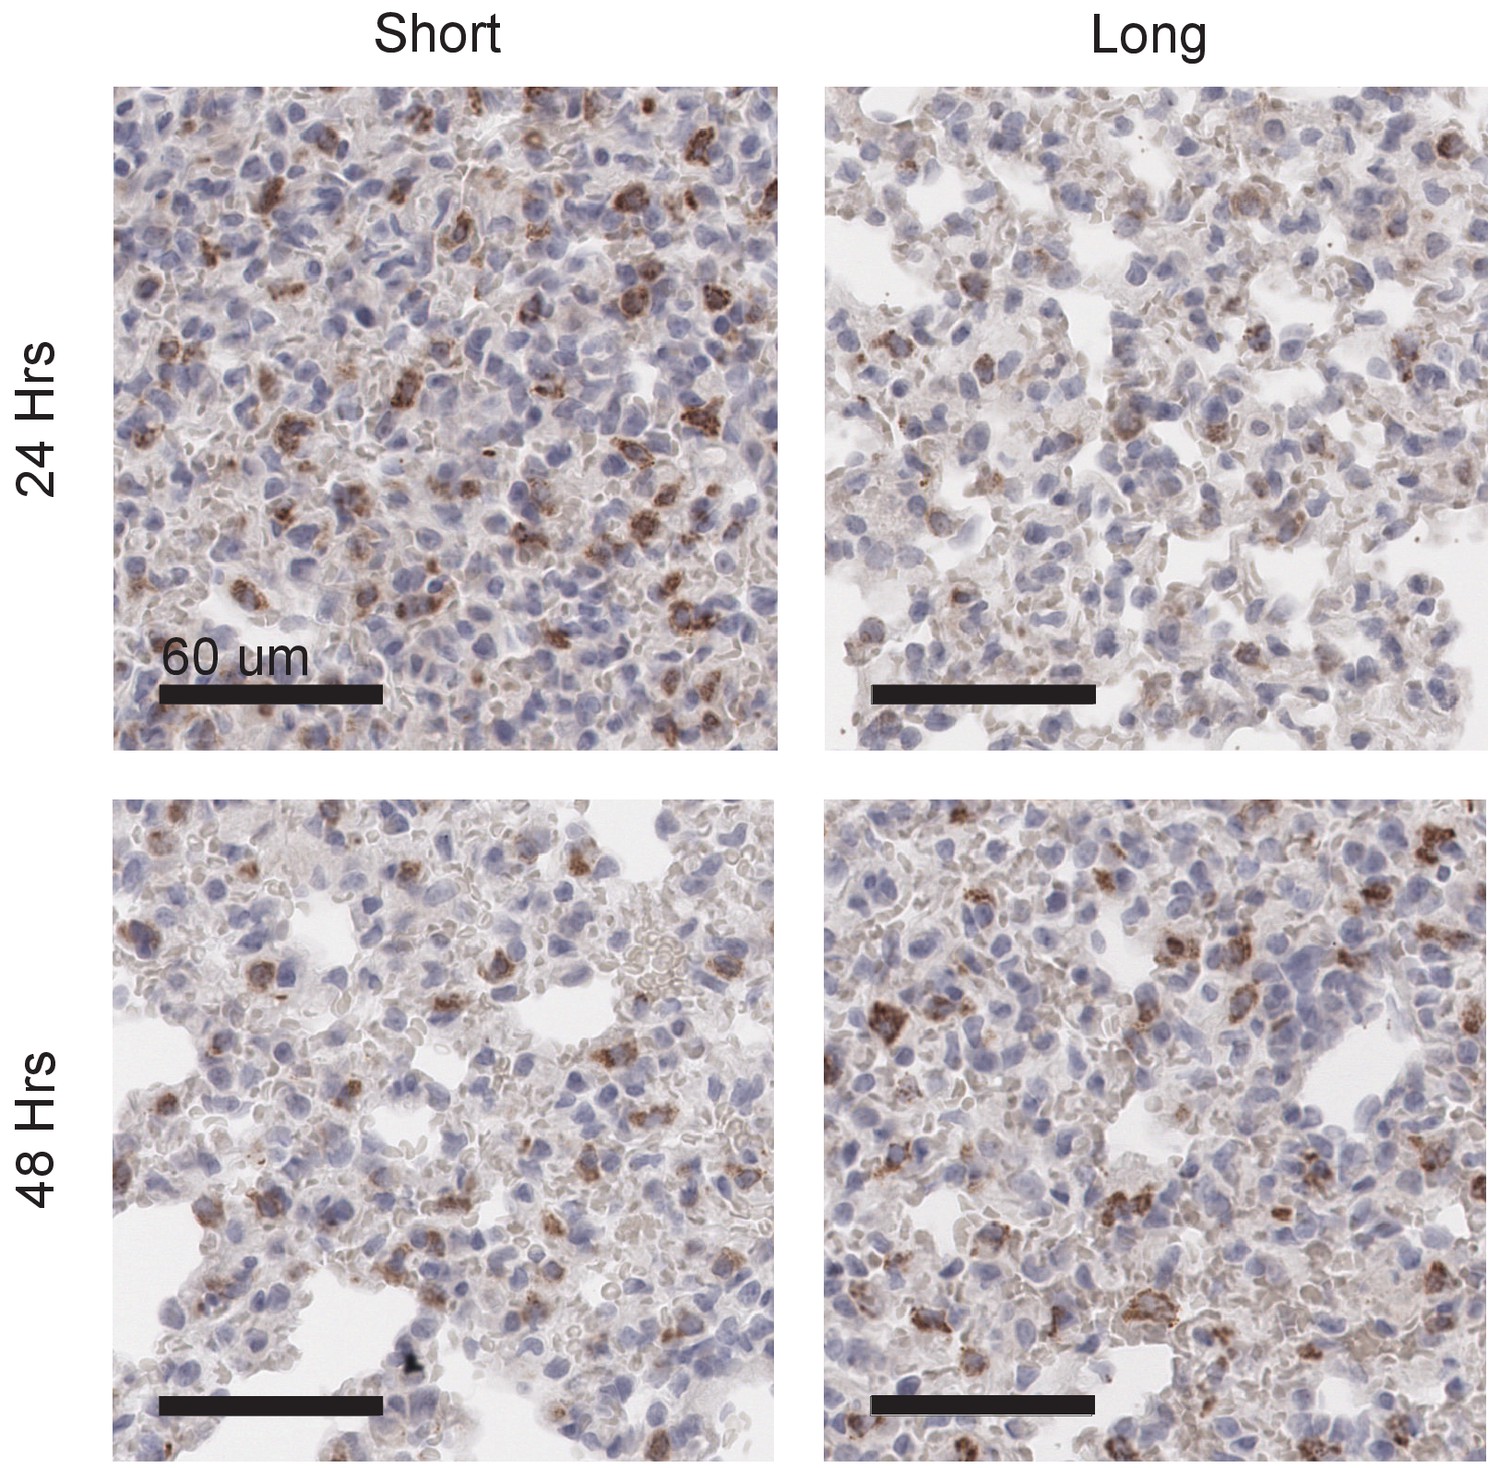
Long glycopolymers delay MCF-10A cell death in nude mice.
MCF-10A cells were painted with either short or long glycopolymers and injected into the tail veins of nude mice. At the time points indicated, the mice were sacrificed and their lungs fixed and paraffin embedded. Sections were stained by immunohistochemistry for the cell death marker cleaved caspase-3 (CC3) (brown). Nuclei are counterstained with hematoxylin. There is not only less CC3 expression 24 hr after injection in the long glycopolymer-bearing cells compared to the short, but also, whereas the short-treated cells experience the greatest death at 24 hr and subsequently signal decreases, the long glycopolymer-bearing cells don’t peak in CC3 expression until 48 hr after injection. This delay in the timing of cell death implies a protective effect provided by the glycopolymers that is dependent upon size. Shown are micrographs representative of at least three biological replicates. Scale bars are 60 μm.
Figure 1—figure supplement 2
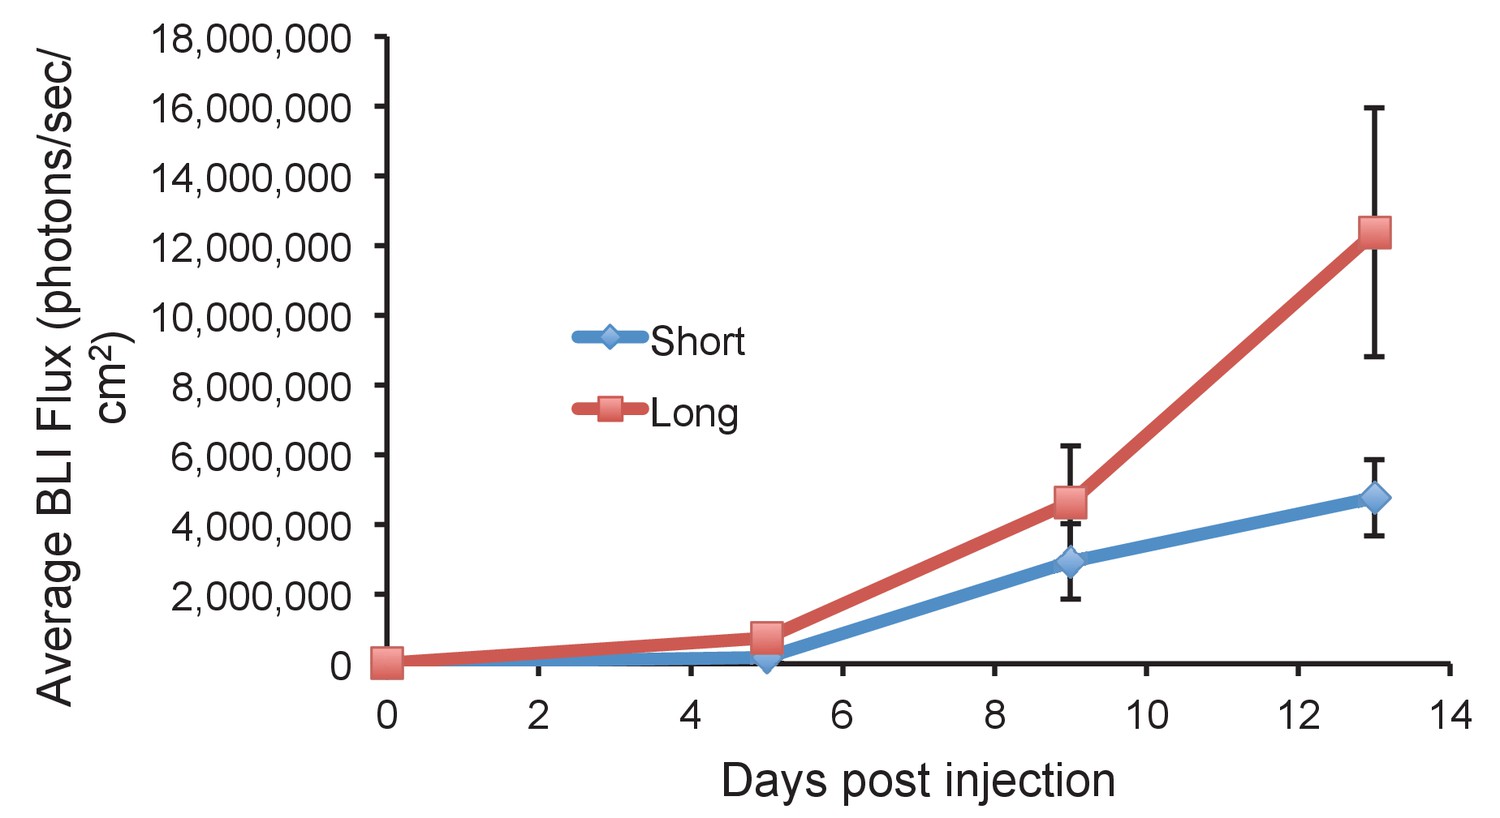
Long glycopolymer-bearing 4TO7 cells proliferate more rapidly in mouse lungs than those bearing short glycopolymers.
Animals were injected on day 0 with 4TO7 cells treated with either long or short cell-surface glycopolymers. At a given day post injection, mice were anesthetized, administered luciferin by intraperitoneal injection, then imaged using a live animal imaging system. Exogenously administered cells express luciferase and generate photons upon treatment with luciferin. Data shown are mean ±SEM. n = 5 for Long and n = 6 for Short.
Figure 1—figure supplement 3
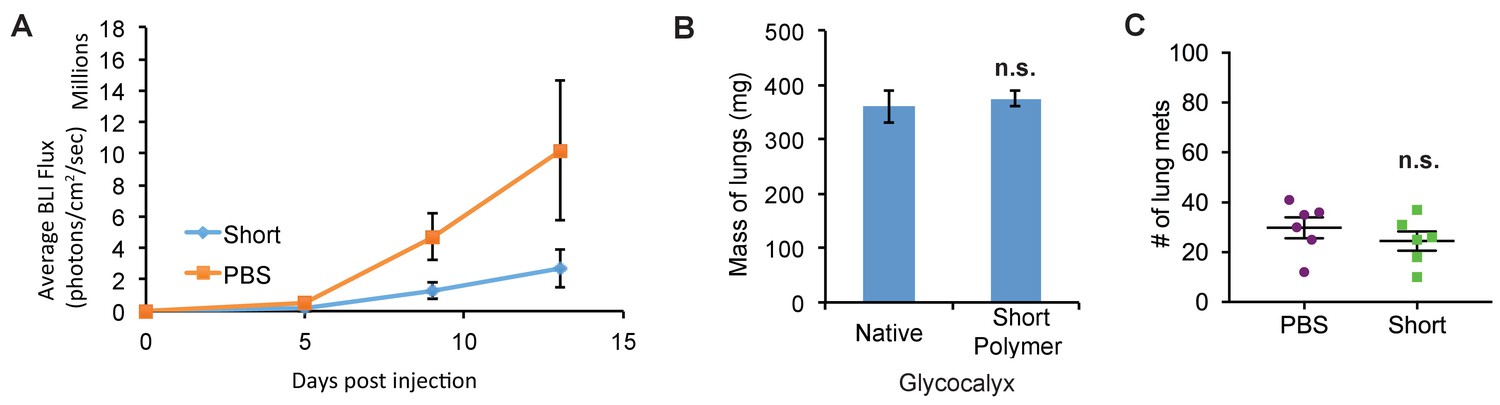
Short glycopolymer-bearing 4TO7 cells have no metastatic advantage over naïve 4TO7 cells.
Animals were injected on day 0 with cells treated with either short cell-surface glycopolymers or PBS vehicle. (A) Quantification of bioluminescence imaging of anesthetized mice. At a given day post injection, mice were anesthetized, administered luciferin by intraperitoneal injection, then imaged using a live animal imaging system. Exogenously administered cells express luciferase and generate photons upon treatment with luciferin. (B) Wet weight of mouse lungs excised during necropsy. (C) Frank mets were counted on whole lung sections at 5 mm into sectioning for each mouse and grouped according to glycopolymer treatment type of injected cells. Data shown are mean ±SEM. n = 6 for PBS and n = 6 for Short.
Figure 2 with 5 supplements
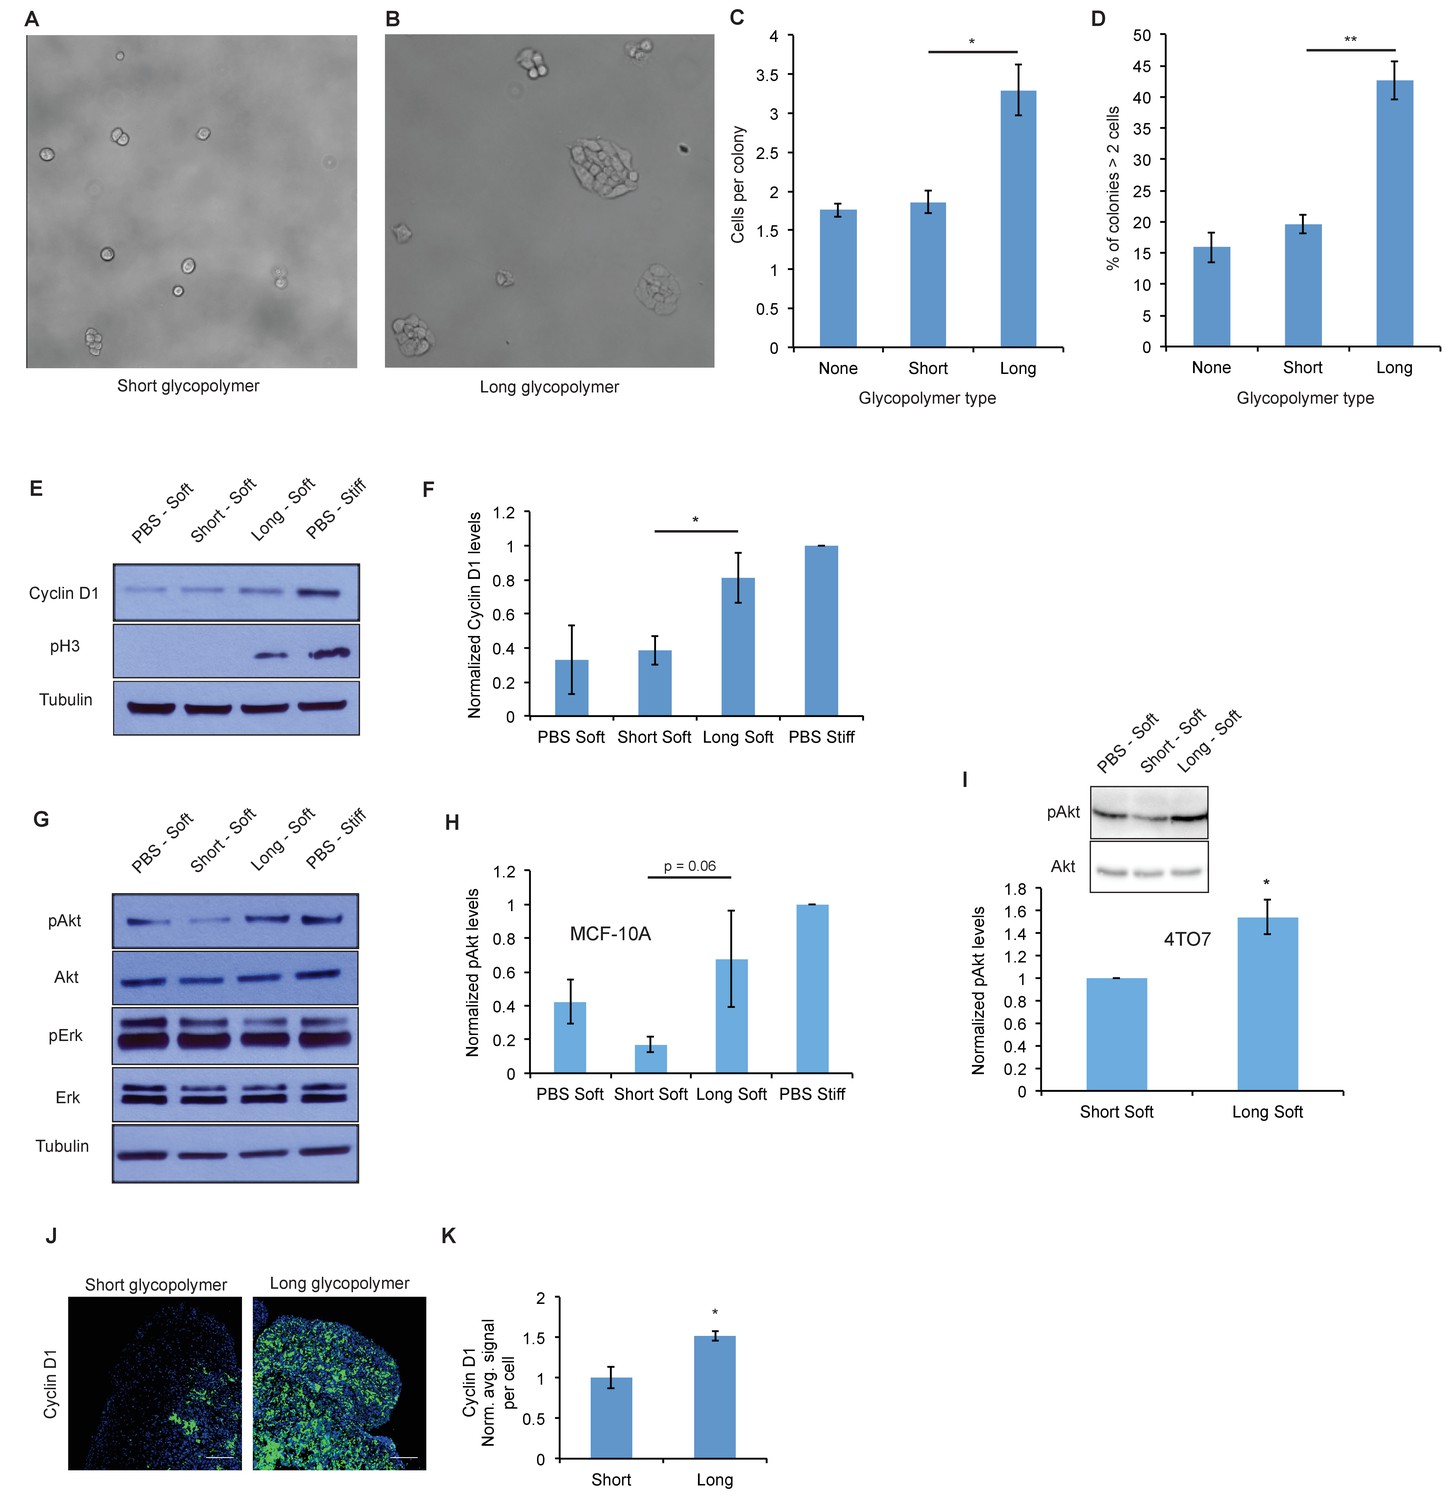
A thick glycocalyx drives cell cycle progression via the PI3K-Akt axis.
(A) and (B) Microscopy of MCF-10A cells labeled with short or long glycopolymers, plated on soft (400 Pa) fibronectin-functionalized gels, and cultured for 72 hr. (C) Average number of cells per colony in images such as A and B. (D) Percent of colonies containing more than 2 cells in images such as A and B. (E) Immunoblot analysis of proliferative markers in MCF-10A cells coated with long or short glycopolymers or treated with vehicle (PBS) and plated on soft (400 Pa) or stiff (60 kPa) fibronectin-functionalized polyacrylamide gels for six hours. (F) Western blots from E were analyzed by densitometry, their values normalized first to total protein (tubulin) then to that of the positive control—PBS treated cells on a stiff Fn-functionalized matrix. (G) Immunoblot analysis of pAkt and pErk in MCF-10A cells serum-starved for 72 hr, treated with long or short glycopolymers or vehicle and plated in serum-free media on soft or stiff gels for six hours, then challenged with epidermal growth factor for 15 min, and lysed. (H) Western blots from G were quantified and normalized to total Akt then to the positive control. (I) Immunoblot and quantification of pAkt and total Akt in 4TO7 cells in vitro treated as in G and quantified as in H except normalized to short glycopolymer control. (J) Cyclin D1 (green) IF staining of 4TO7 mets from experiments in Figure 1. DAPI nuclear stain in blue. (K) Quantification of IF staining normalized to the average signal per nuceli in mets from short glycopolymer treated cells. Shown in K is the mean ±SEM of three mice per group from which 3–4 tumors were averaged each. For C, D, F, and I, shown is the mean ±SEM of three biological replicate experiments. For H, shown is the mean ±SEM of four biological replicate experiments. Scale bars are 100 μm. *p<0.05, **p<0.01 (Student’s paired t-test).
Figure 2—figure supplement 1
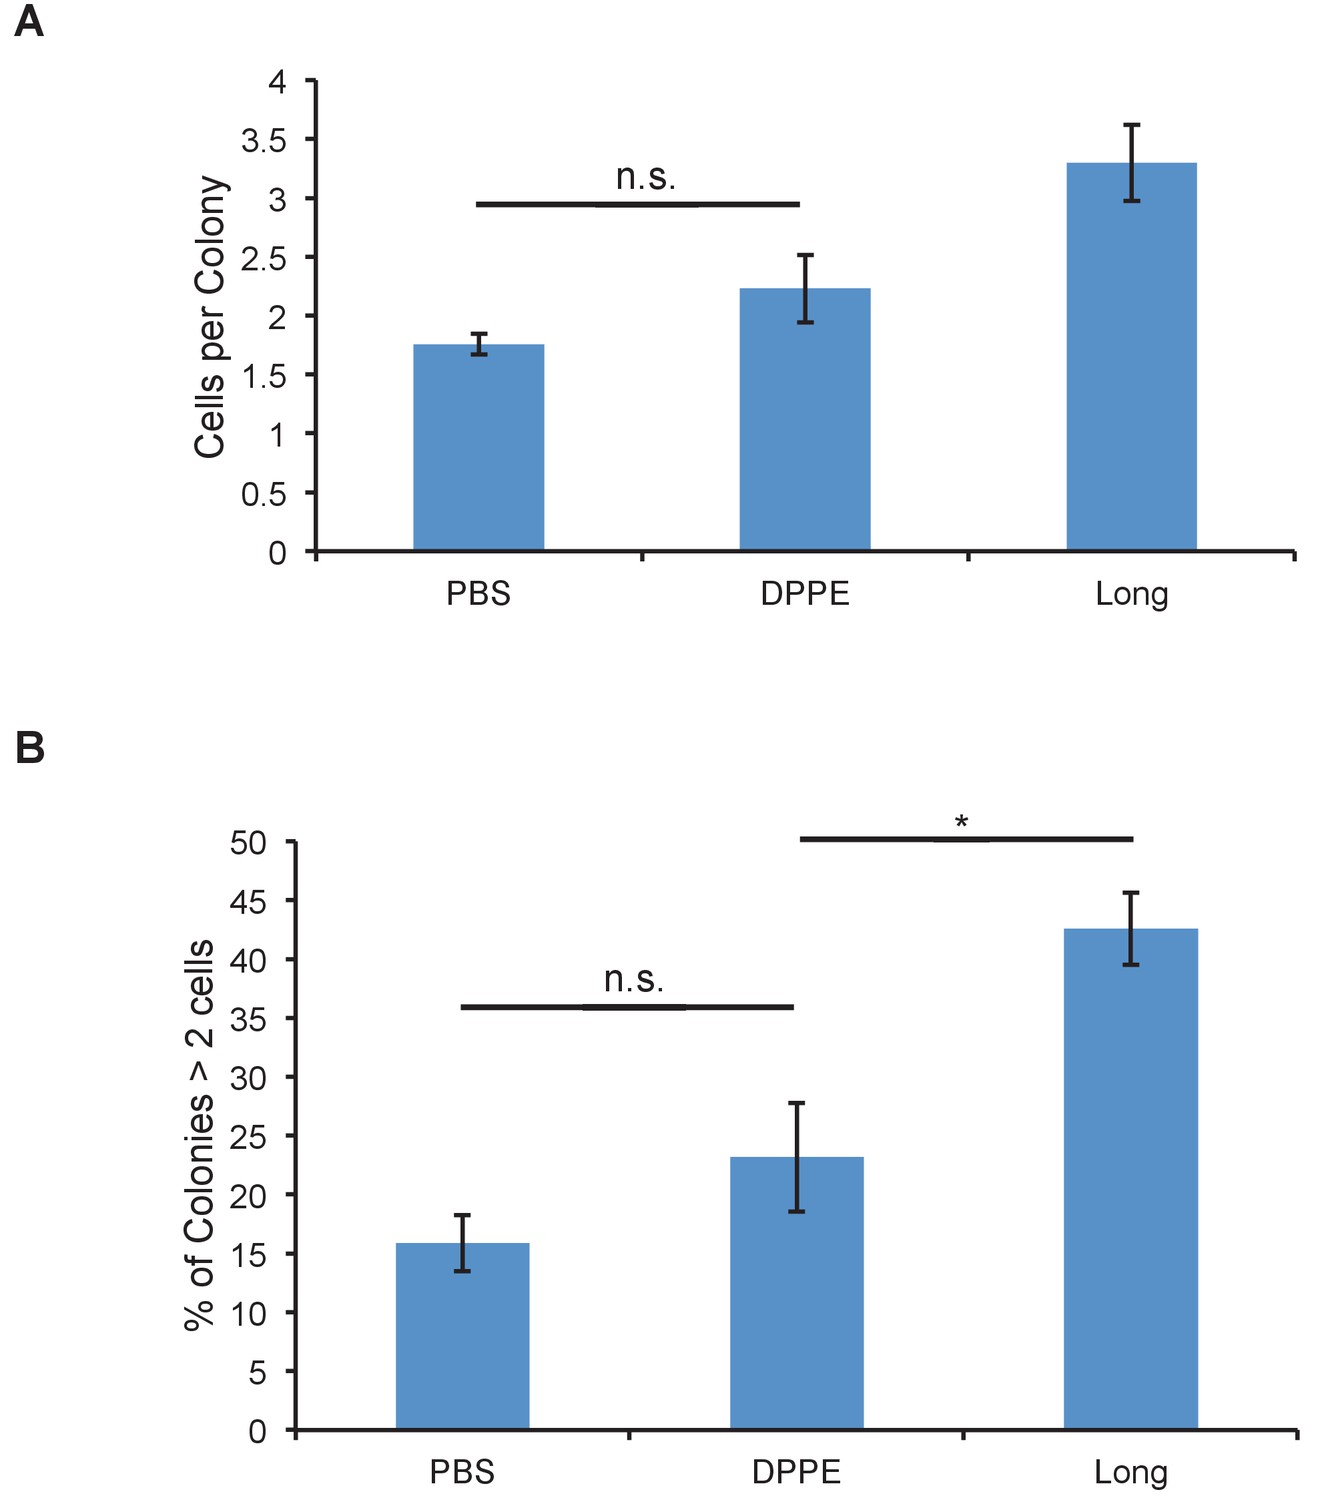
Glycopolymers must be cell-surface resident to affect colony size.
(A) Average number of cells per colony of MCF-10A cells treated with cell-surface persistent (Long) or rapidly endocytosed but equally long (DPPE) mucin-mimetic glycopolymers then plated at low density on soft (140 Pa) fibronectin-functionalized polyacrylamide gels. (B) Percent of colonies containing more than two cells of cells treated as in A. Shown is mean ±SEM of three biological replicate experiments in which nine fields of view were imaged randomly from each of two technical replicate gels. n.s. - not significant. *p<0.05. (Student’s paired t-test).
Figure 2—figure supplement 2
Glycopolymers do not abolish need for growth factor signals in proliferation.
(A) Immunoblot of MCF-10A cells serum-starved for 72 hr, treated with long or short glycopolymers or vehicle and plated in serum-free media on soft or stiff gels for six hours then lysed. Shown is a representative of at least three biological replicate experiments.
Figure 2—figure supplement 3
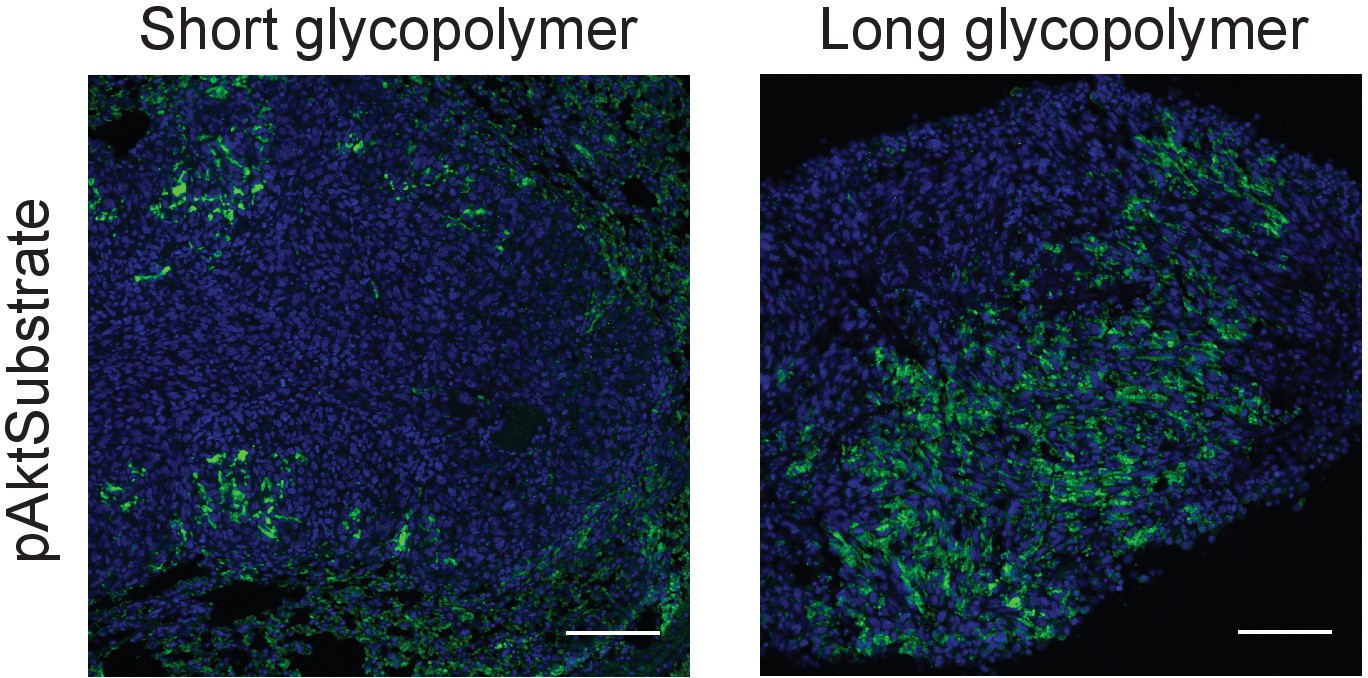
Long glycopolymers increase active Akt in 4TO7 lung metastases.
Tissue sections from lungs derived from the experiments described in Figure 1 were stained with an anti-pAkt substrate antibody. The antibody is selective for a phosphorylated consensus sequence known to be targeted by pAkt and thereby gives an indirect measure of Akt activity. Shown are fluoromicrographs representative of at least three independent experiments.
Figure 2—figure supplement 4
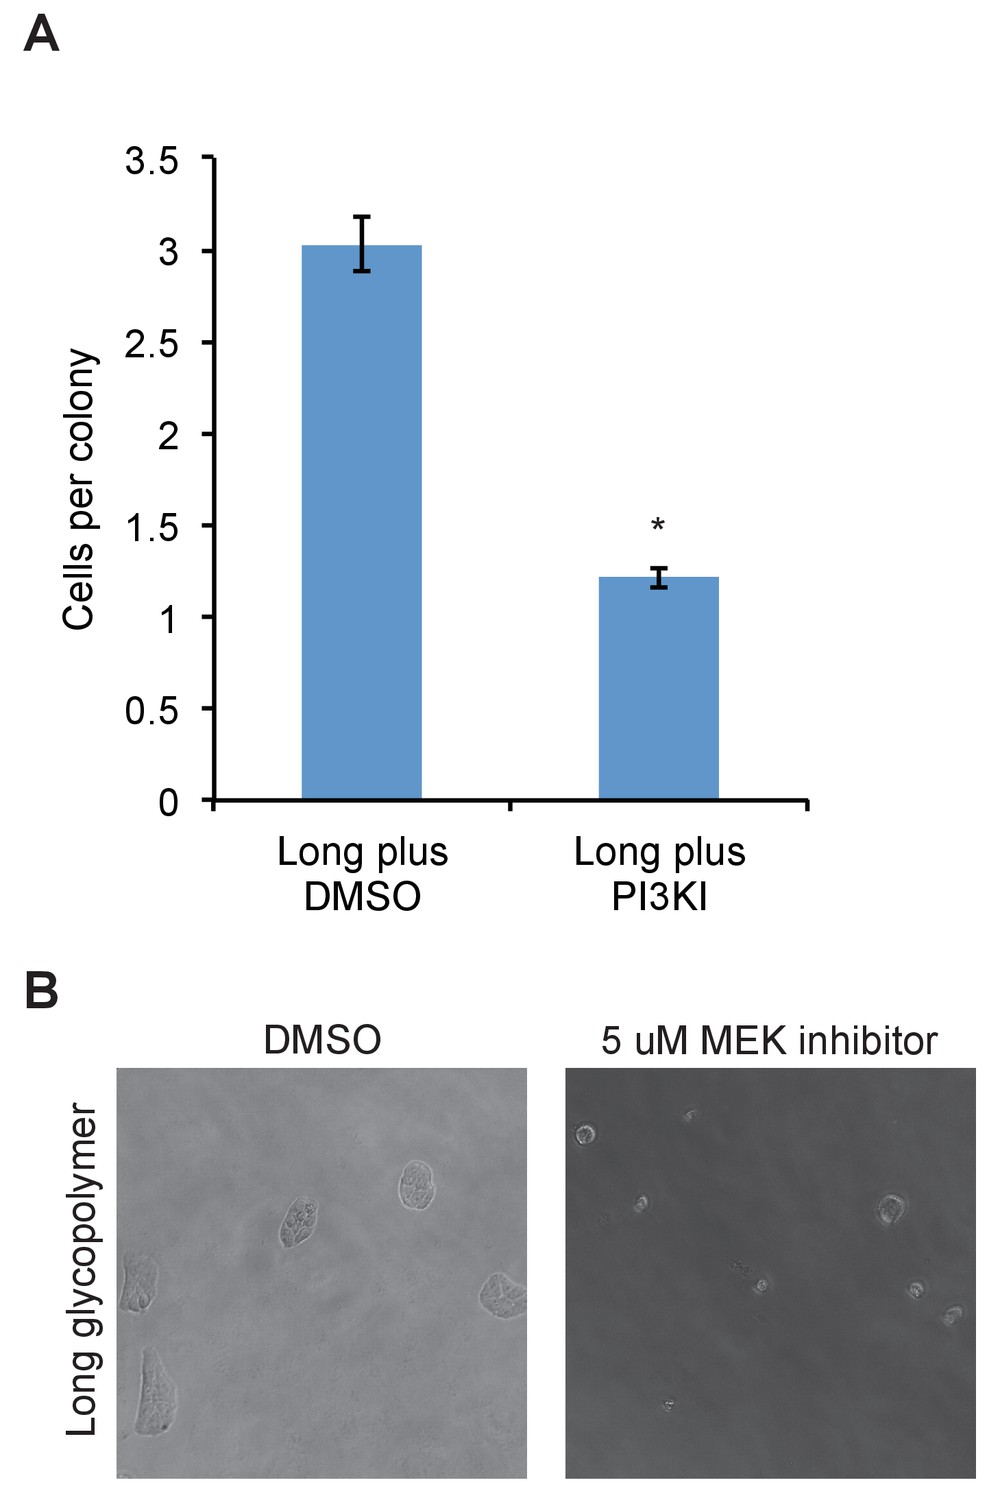
PI3K or MEK inhibitor abolishes effects of long glycopolymers on proliferation.
(A) Average number of cells per colony of long glycopolymer-bearing MCF-10A cells plated on soft gels in media containing 50 μM PI3K inhibitor LY294002 or vehicle (DMSO) and cultured for 72 hr. (B) Long glycopolymer-bearing MCF-10A cells seeded on soft polyacrylamide gels functionalized with fibronectin in media supplemented with 5 μM of the specific MEK inhibitor U0126 or DMSO vehicle alone after 72 hr.
Figure 2—figure supplement 5
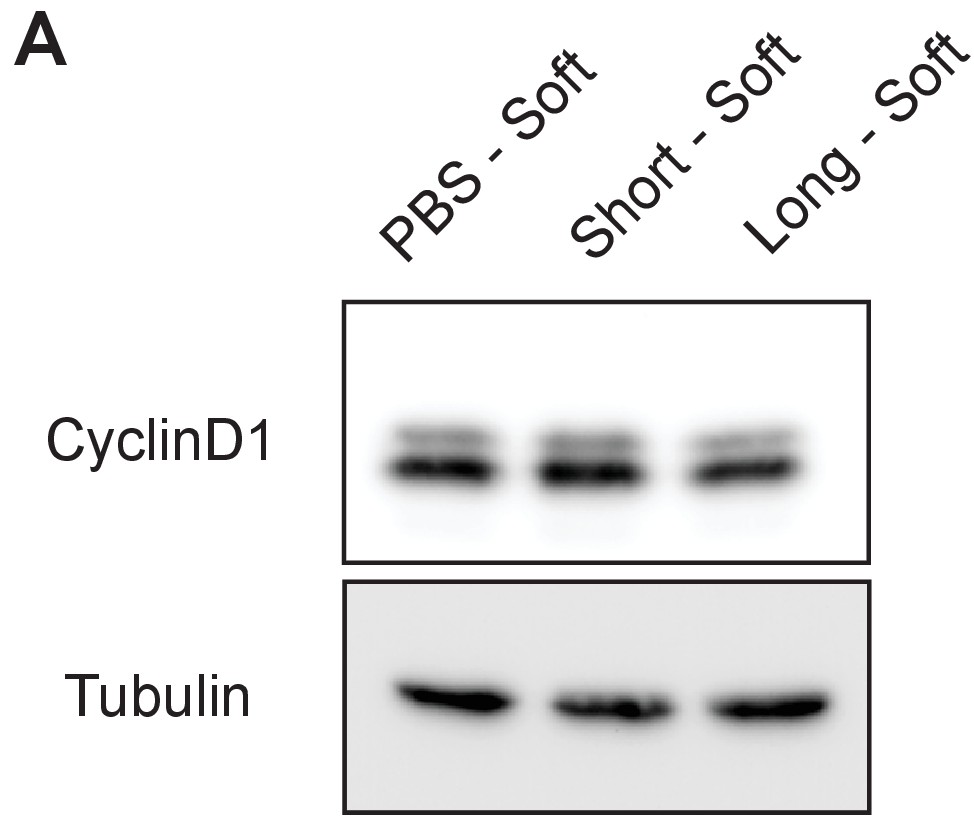
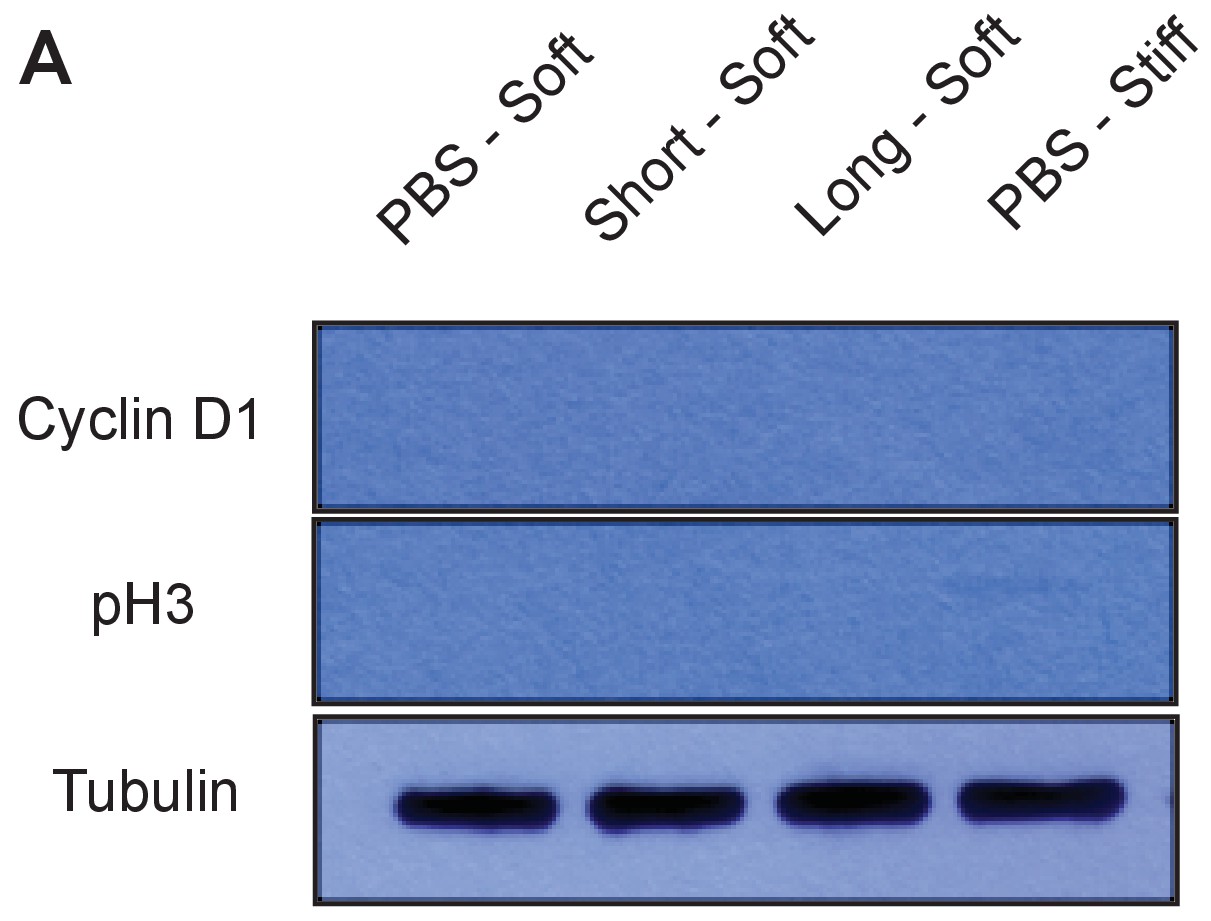
Cyclin D1 expression in 4TO7 cells in vitro.
A)Immunoblot analysis of Cyclin D1 levels in 4TO7 cells coated with long or short glycopolymers or treated with vehicle (PBS) and plated on soft (400 Pa) fibronectin-functionalized polyacrylamide gels and allowed to adhere before lysing.
Figure 3 with 1 supplement
A thick glycocalyx stimulates integrin-FAK mechanosignaling.
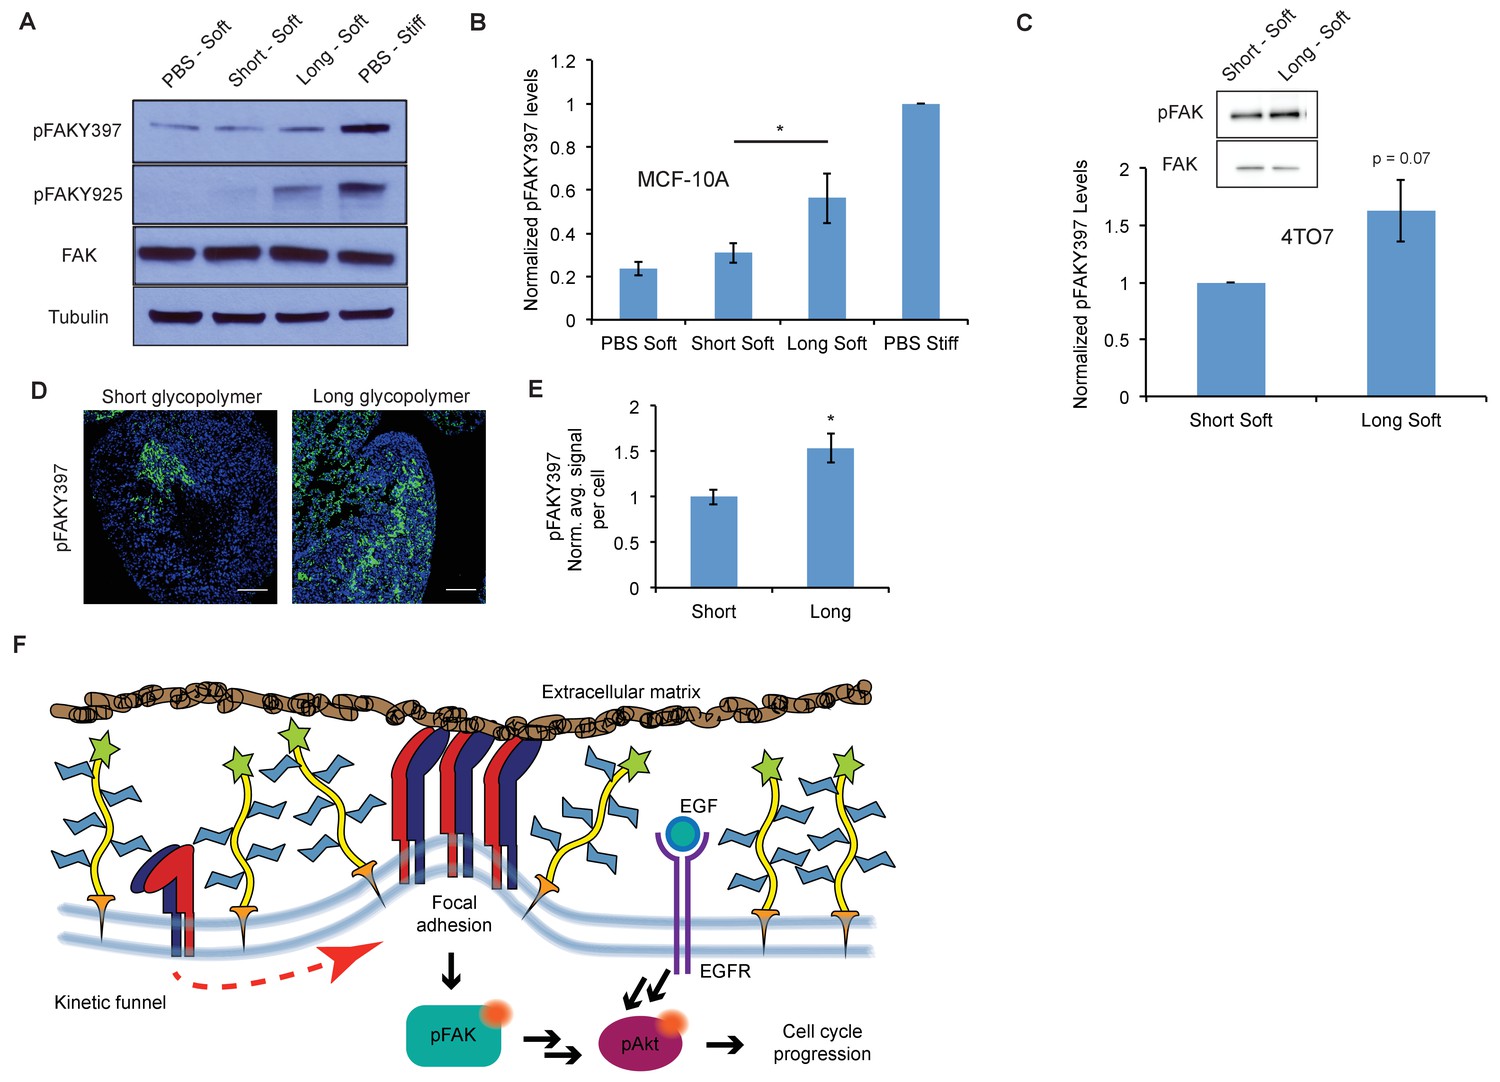
(A) Immunoblot analysis of FAK phosphorylation in MCF-10A cells coated with long or short glycopolymers or treated with vehicle (PBS) and plated on soft (400 Pa) or stiff (60 kPa) fibronectin-functionalized polyacrylamide gels for six hours. (B) Western blots from A were analyzed by densitometry, their values normalized first to total FAK then to that of the positive control—PBS treated cells on a stiff fibronectin-functionalized matrix. (C) Immunoblot analysis and quantification of pFAK and total FAK in 4TO7 cells treated as in A and quantified as in B except normalized to short glycopolymer control. D) pFAKY397 IF staining in green of mets from experiments in Figure 1. DAPI nuclear stain in blue. (E) Quantification of IF staining in D normalized to the average signal per nuceli in mets from short glycopolymer-treated cells. Shown is mean ±SEM of three mice per group from which 3–4 tumors were averaged each. (F) A model by which a mucin-bolstered glycocalyx may drive proliferation. Limited ligand access due to steric hindrance establishes a kinetic funnel in which integrins are likely to bind where bonds exist already. This drives a clustering of integrins that activates FAK which, in conjunction with EGFR, drives activation of Akt and subsequently cell cycle progression. Blot in A is representative of at least three biological replicate experiments. Shown in B is mean ±SEM from five biological replicate experiments. Shown in C is mean ±SEM from three biological replicate experiments. Scale bars are 100 μm. *p<0.05 (Student’s paired t-test).
Figure 3—figure supplement 1
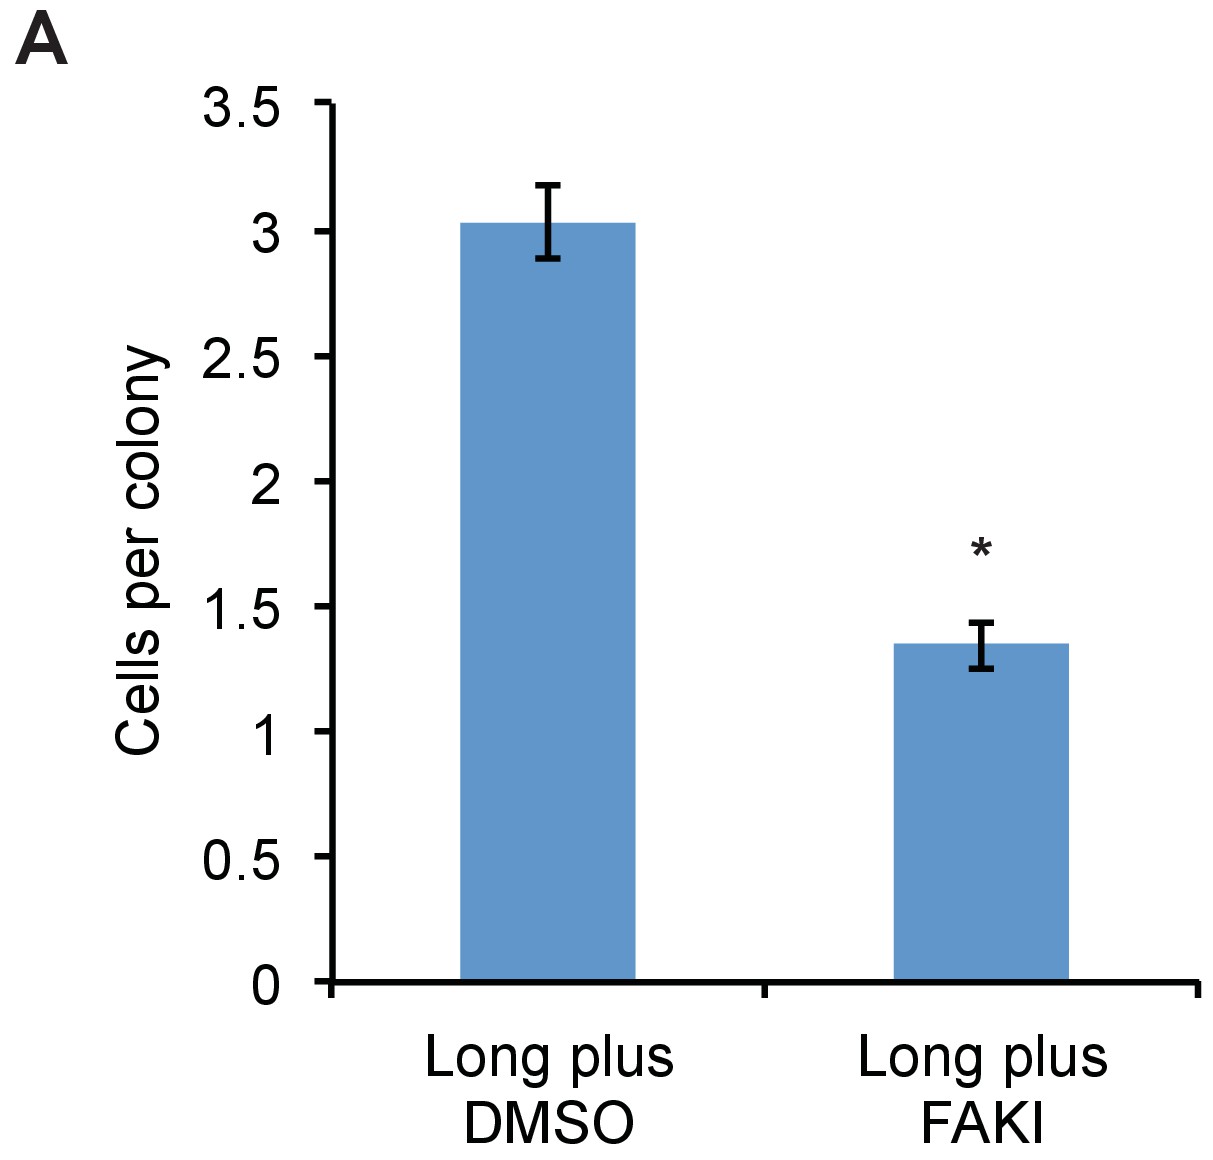
FAK inhibitor abolishes proliferative advantage from bulky glycocalyx.
(A) Average number of cells per colony of long glycopolymer-bearing MCF-10A cells plated on soft gels in media containing 1 μM FAK inhibitor FAK14 or vehicle (DMSO) and cultured for 72 hr. *p<0.05 (Student’s paired t-test).
Figure 4 with 2 supplements
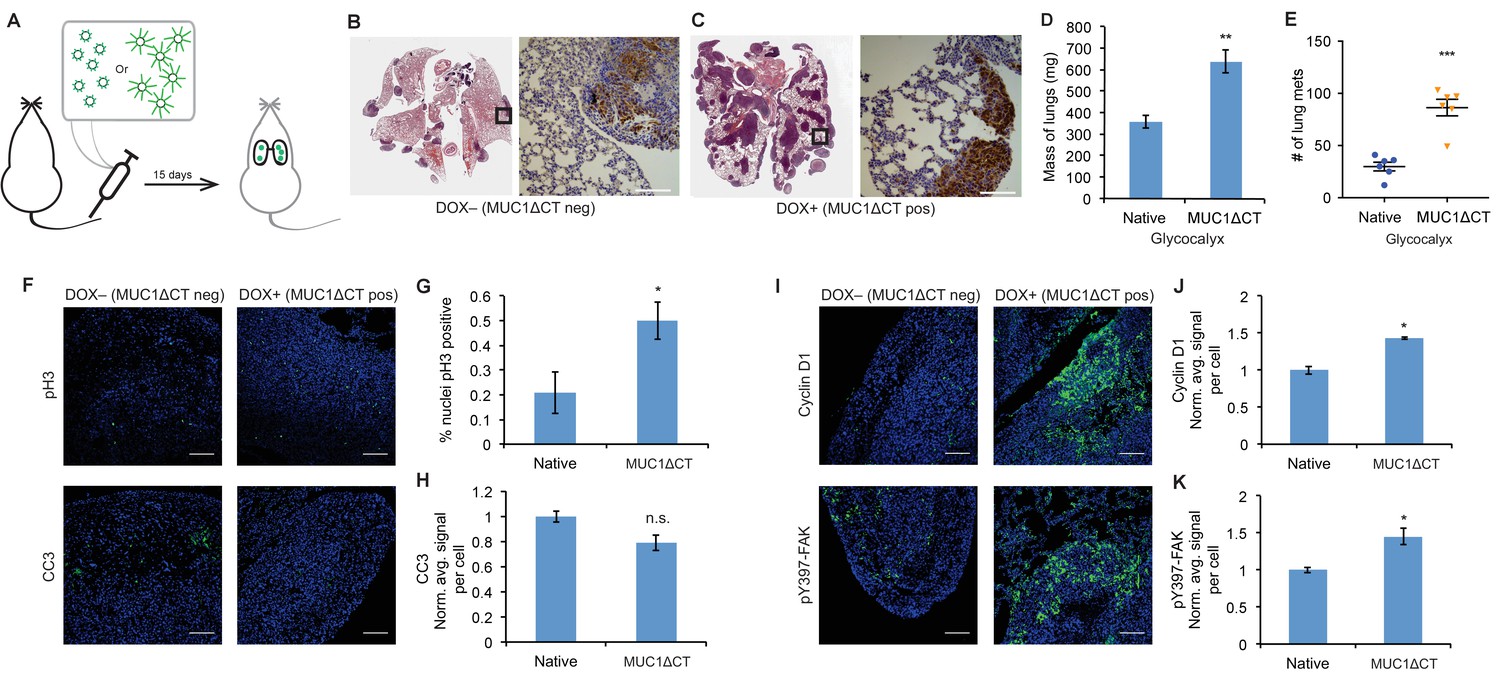
The MUC1 ectodomain is sufficient to increase the metastatic potential of 4TO7 cancer cells.
(A) Experimental scheme for Figure 4. Balb/c mice were injected with syngeneic 4TO7 mammary carcinoma cells transfected with a MUC1ΔCT construct under the control of a doxycycline (dox)-inducible promoter. Cells were treated with either dox 200 ng/ml or vehicle (PBS) for 24 hr before injections. (B) and (C) Whole lung sections H and E stained and IHC labeled for mApple indicating presence of exogenously introduced cells. (D) Lungs excised during necropsy were weighed, wet, before fixing. (E) Frank mets were counted on whole lung sections at 5 mm into sectioning for each mouse and grouped according to treatment type of injected cells. (F) IF staining of mets for the mitotic marker pH3 or apoptotic marker CC3 in green. DAPI nuclear staining is shown in blue. (G) and (H) Quantification of IF signal. For pH3, shown is the quotient of positive over total nuclei. (I) Cyclin D1 and pY397-FAK IF staining of mets in green. DAPI nuclear stain in blue. (J) and (K) Quantification of IF signal. For H, J, and K, total signal was normalized to the average signal per nuceli in mets from PBS treated cells. Shown is mean ±SEM of three mice per group from which 3–4 tumors were averaged each. For D and E, shown is the mean ±SEM of n = 6 for mice injected with PBS-treated cells and n = 6 for mice injected with dox-treated cells. Scale bars are 100 μm. *p<0.05, **p<0.01, ***p<0.001 (Student’s paired t-test).
Figure 4—figure supplement 1
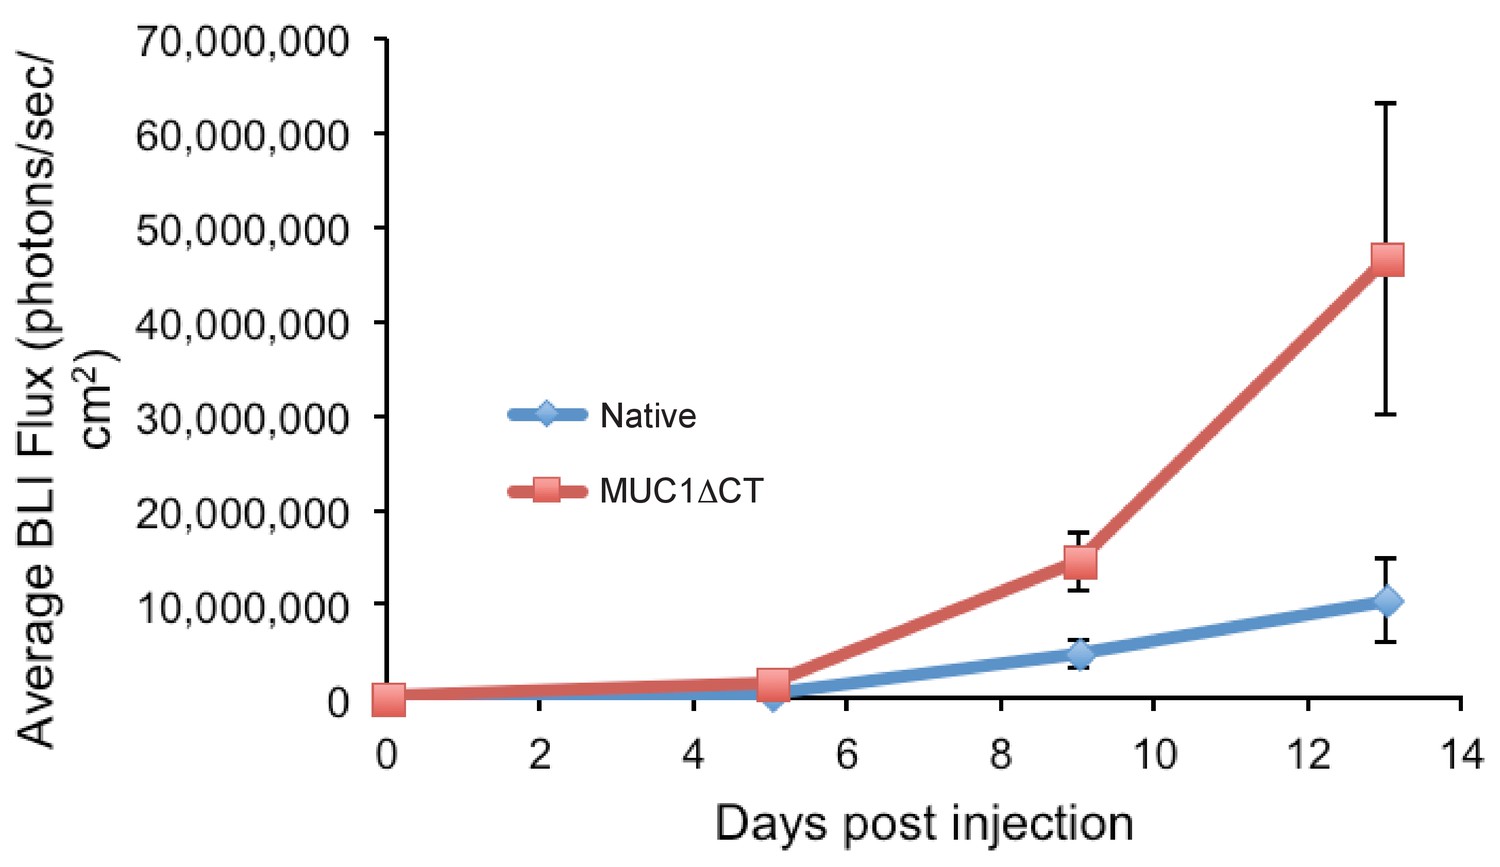
4TO7 cells expressing the MUC1 ectodomain proliferate more rapidly in mouse lungs than those that do not.
Animals were injected on day 0 with 4TO7 cells treated with either doxycycline to induce expression of MUC1ΔCT construct or PBS vehicle (Native). At a given day post injection, mice were anesthetized, administered luciferin by intraperitoneal injection, then imaged using a live animal imaging system. Exogenously administered cells express luciferase and generate photons upon treatment with luciferin. Data shown are mean ±SEM of n = 6 for both groups.
Figure 4—figure supplement 2
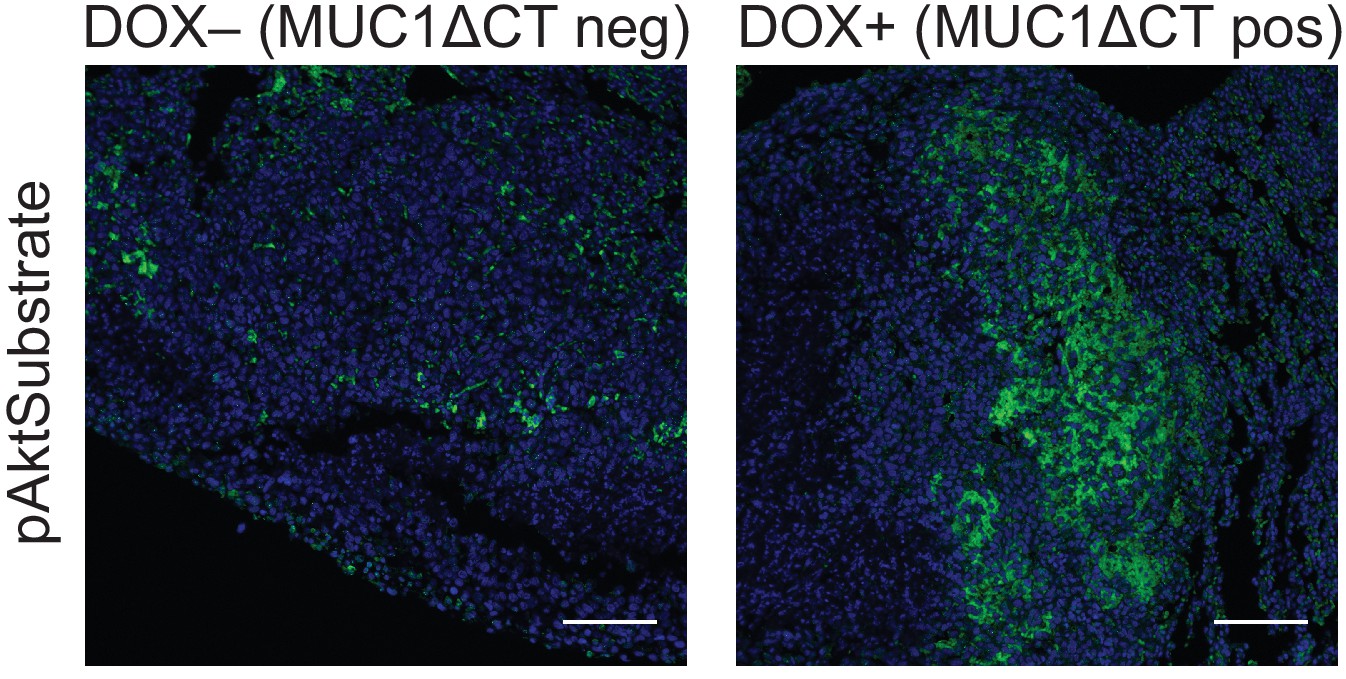
The MUC1 ectodomain increases Akt activity in 4TO7 lung metastases.
Tissue sections from lungs derived from the experiments described in Figure 4 were stained with an anti-pAkt substrate antibody. The antibody is selective for a phosphorylated consensus sequence known to be targeted by pAkt and thereby gives an indirect measure of Akt activity. Shown are fluoromicrographs representative of at least three independent experiments.
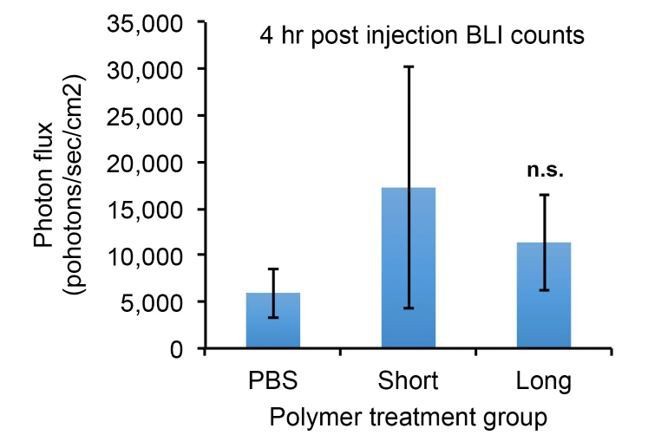
Author response image 1
Additional files
-
Transparent reporting form
- https://doi.org/10.7554/eLife.25752.017
Download links
A two-part list of links to download the article, or parts of the article, in various formats.
Downloads (link to download the article as PDF)
Open citations (links to open the citations from this article in various online reference manager services)
Cite this article (links to download the citations from this article in formats compatible with various reference manager tools)
A bulky glycocalyx fosters metastasis formation by promoting G1 cell cycle progression
eLife 6:e25752.
https://doi.org/10.7554/eLife.25752


