Arid1b haploinsufficient mice reveal neuropsychiatric phenotypes and reversible causes of growth impairment
- University of Texas Southwestern Medical Center, United States
- Máxima Medical Center, The Netherlands
- St George's University Hospitals, NHS Foundation Trust, United Kingdom Caroline Brain, Endocrinology, Great Ormond Street Hospital for Children, United Kingdom
- William Harvey Research Institute, Barts and the London, Queen Mary University of London, United Kingdom
- Children’s Hospital of Philadelphia, and Mahoney Institute of Neuroscience, Perelman School of Medicine, University of Pennsylvania, United States
- Leiden University Medical Center, The Netherlands
Figures
Figure 1 with 2 supplements
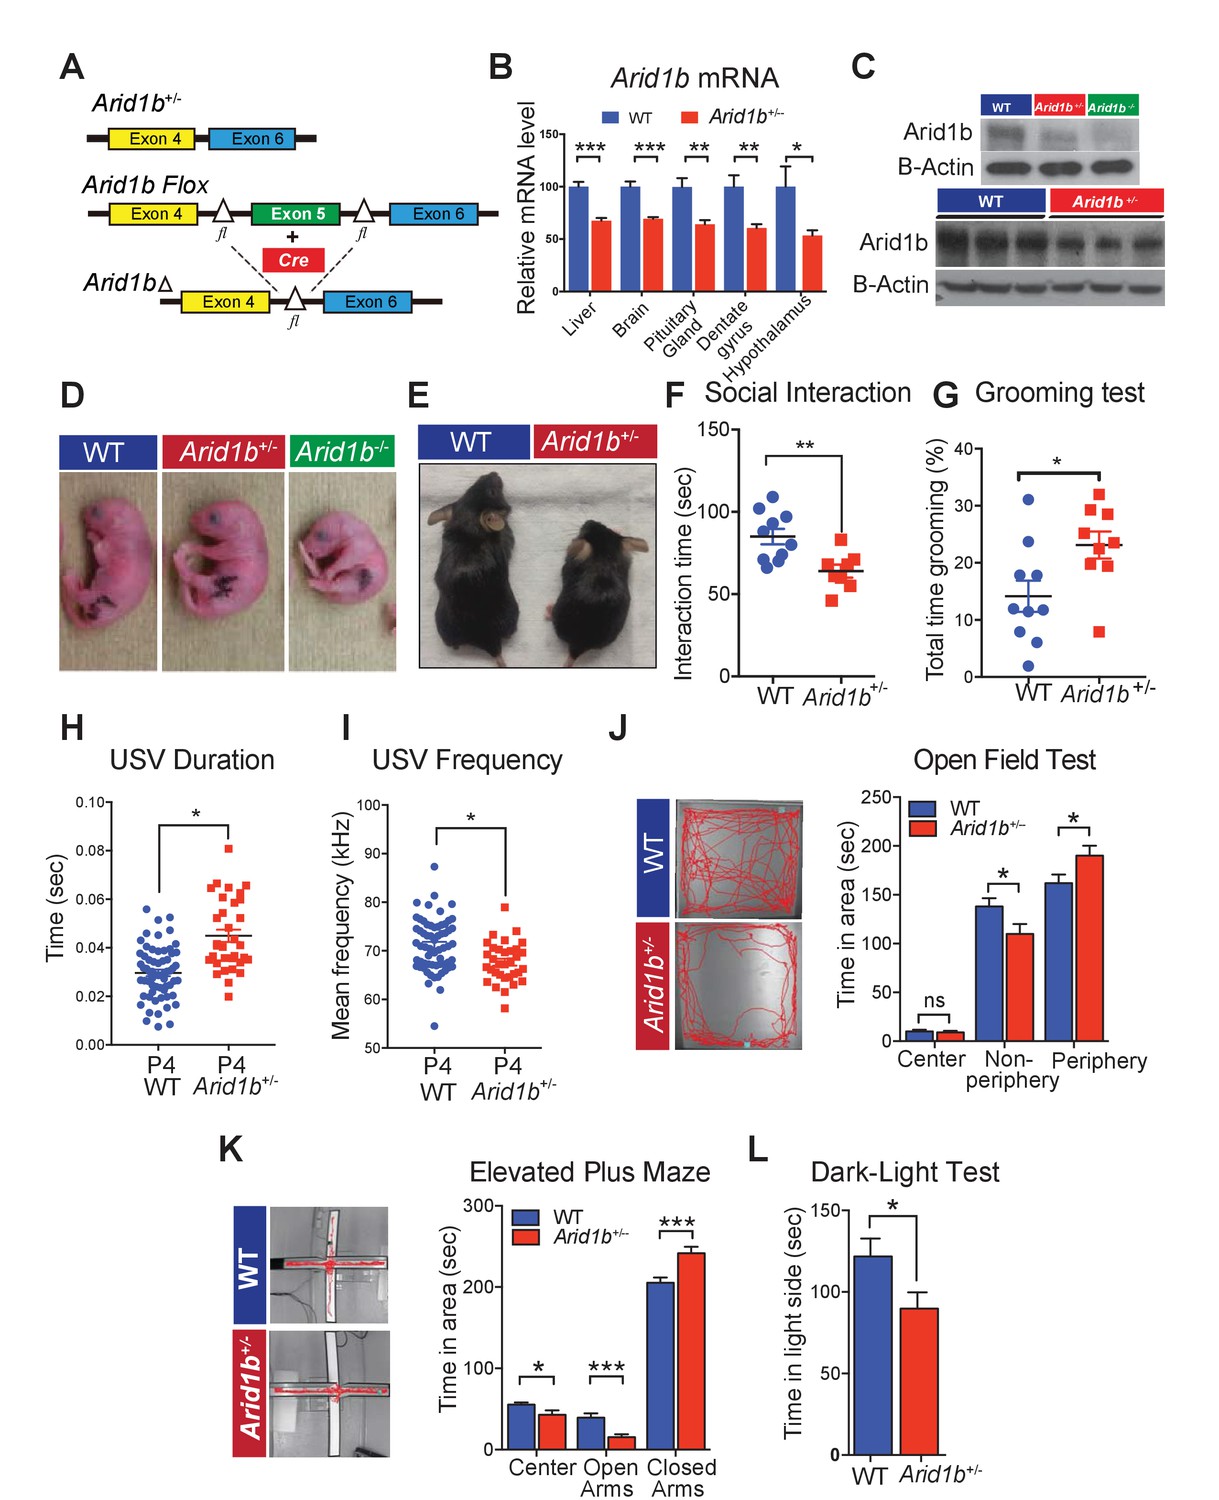
Arid1b+/- mice exhibit physical manifestations of developmental delay, autistic-like features, and abnormal behavioral phenotypes.
(A) Schematic of Arid1b whole body heterozygous mice in which exon five is deleted (hereafter referred as Arid1b+/-) and Arid1b floxed mice. (B) Relative Arid1b mRNA levels in selected organs and brain regions as assessed by qPCR. (C) Relative Arid1b levels in p0 mouse limb (top panel) and whole brain extracts at p45 as assessed by western blot analysis. (D) Appearance of WT and Arid1b+/- mice at postnatal day 0. (E) Appearance of WT and Arid1b+/- littermates at 1 month of age. (F) Juvenile social interaction testing for 10 WT and 9 Arid1b+/- male mice. (G) Grooming test for 10 WT and 9 Arid1b+/- female mice. (H, I) The ultrasonic vocalization (USV) test measuring the duration and frequency of vocal communication in 63 WT and 33 Arid1b+/- male and female mice during separation of pups from dams at postnatal day 4. (J) Representative traces of WT and Arid1b+/- mice in the open field and time spent in the indicated areas for 20 WT and 20 Arid1b+/- 8 week old male mice. (K) Representative traces of WT and Arid1b+/- mice in the elevated plus maze and time spent in the indicated areas for 20 WT and 20 Arid1b+/- 8 week old male mice. (L) Dark-light box testing for 20 WT and 20 Arid1b+/- 8 week old male mice. Values represent mean ± SEM. Asterisks indicate significant differences between indicated littermate genotypes, *p-value ≤ 0.05; **p-value ≤ 0.01; ***p-value ≤ 0.001; ****p-value ≤ 0.0001; ns, not significant. Student’s t-test (two-tailed distribution, two-sample unequal variance) was used to calculate p-values unless otherwise indicated in the figure legend.
-
Figure 1—source data 1
- https://doi.org/10.7554/eLife.25730.004
Figure 1—figure supplement 1
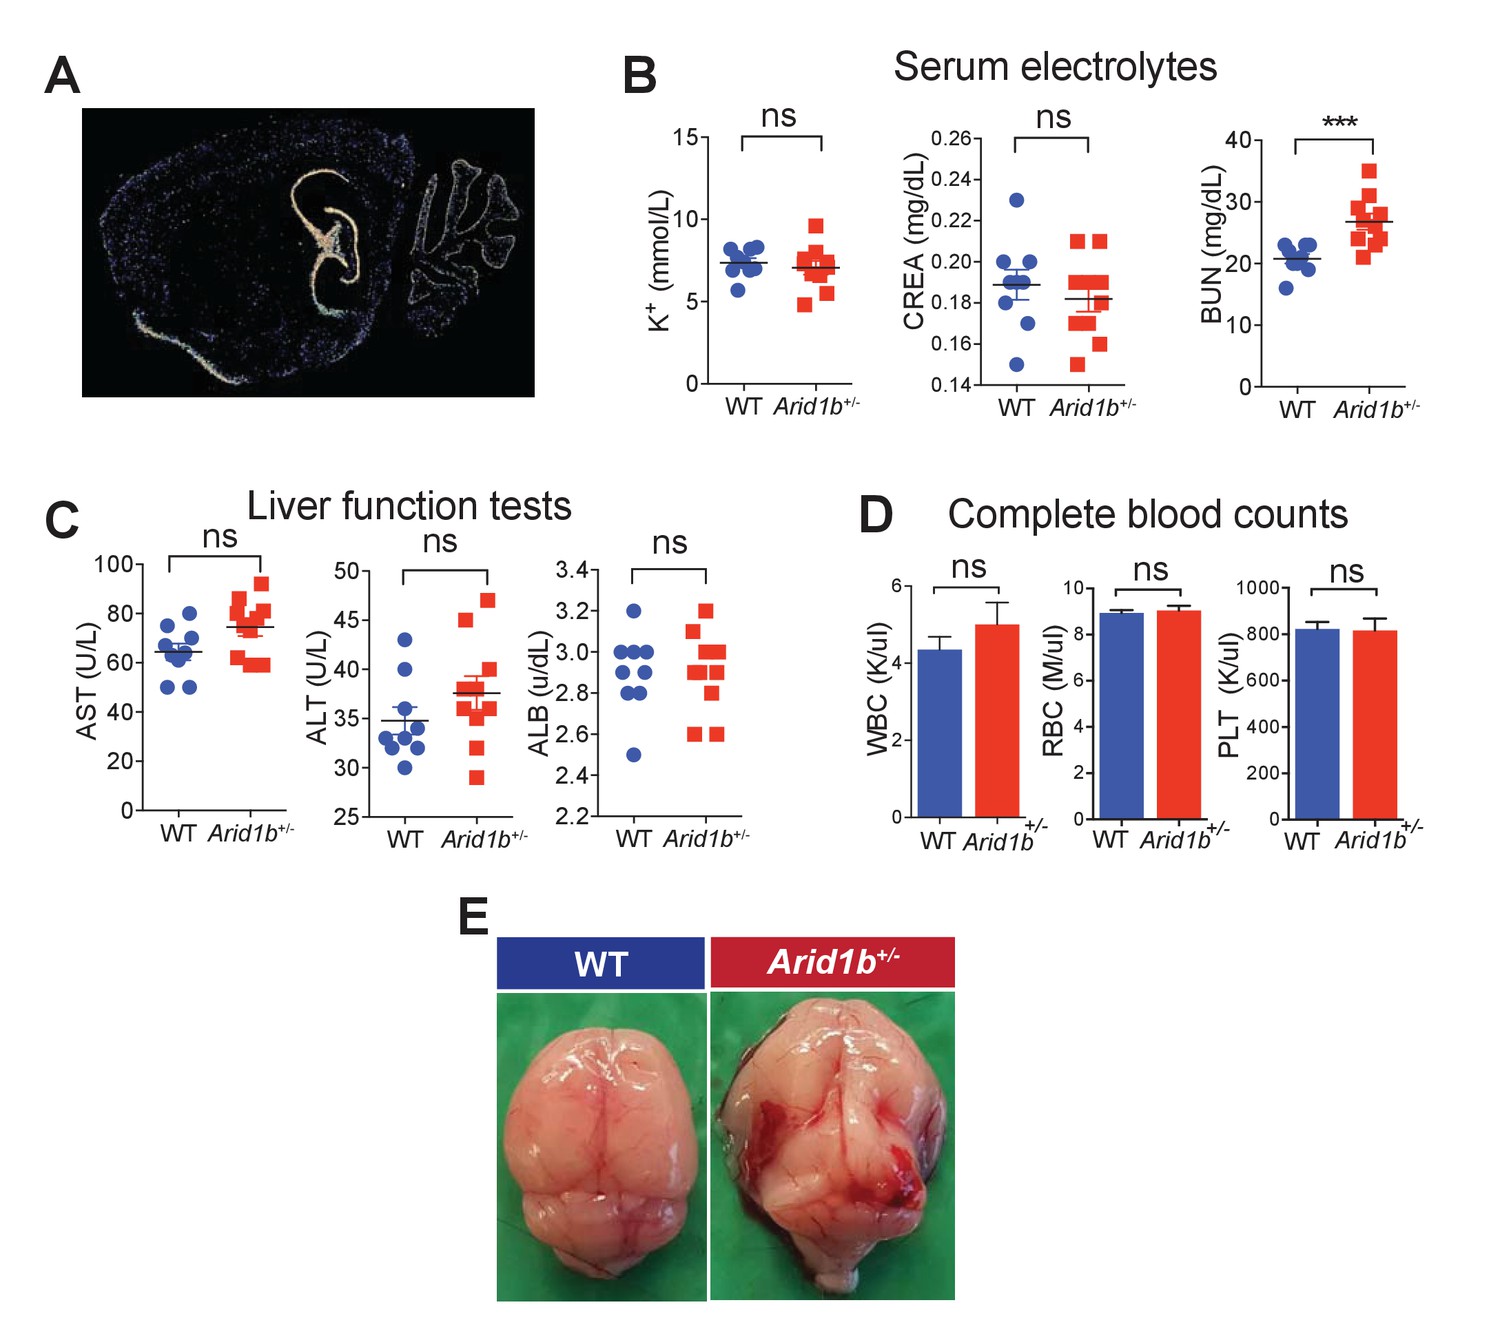
Additional characterization of Arid1b+/- mice.
(A) Arid1b in situ hybridization showing a sagittal brain section from an 8 week old male mouse. Hippocampus and cerebellum showed high levels of signal. Image taken from the Allen Brain Atlas. (B) Serum electrolytes including potassium (K+), creatinine (CREA), and blood urea nitrogen (BUN) measured in 100 day-old females (n = 9 WT and 9 Arid1b+/-). (C) Liver function tests including Aspartate transaminase (AST), Alanine amino transferase (ALT), and Albumin (ALB) in 100 day old females (n = 9 WT and 10 Arid1b+/-). (D) Blood cell counts including white blood cells (WBC), red blood cells (RBC), and platelets (PLT) measured in 100 day old females (n = 9 WT and 10 Arid1b+/-). (E) 0/389 WT and 16/272 (6.6%) Arid1b+/- mice had grossly appreciable hydrocephalus. Values represent mean ± SEM. Asterisks indicate significant differences between indicated littermate genotypes: *p-value ≤ 0.05; **p-value ≤ 0.01; ***p-value ≤ 0.001; ****p-value ≤ 0.0001; ns, not significant. Student’s t-test (two-tailed distribution, two-sample unequal variance) was used to calculate p-values unless otherwise indicated in the figure legend.
-
Figure 1—figure supplement 1—source data 1
- https://doi.org/10.7554/eLife.25730.006
Figure 1—figure supplement 2
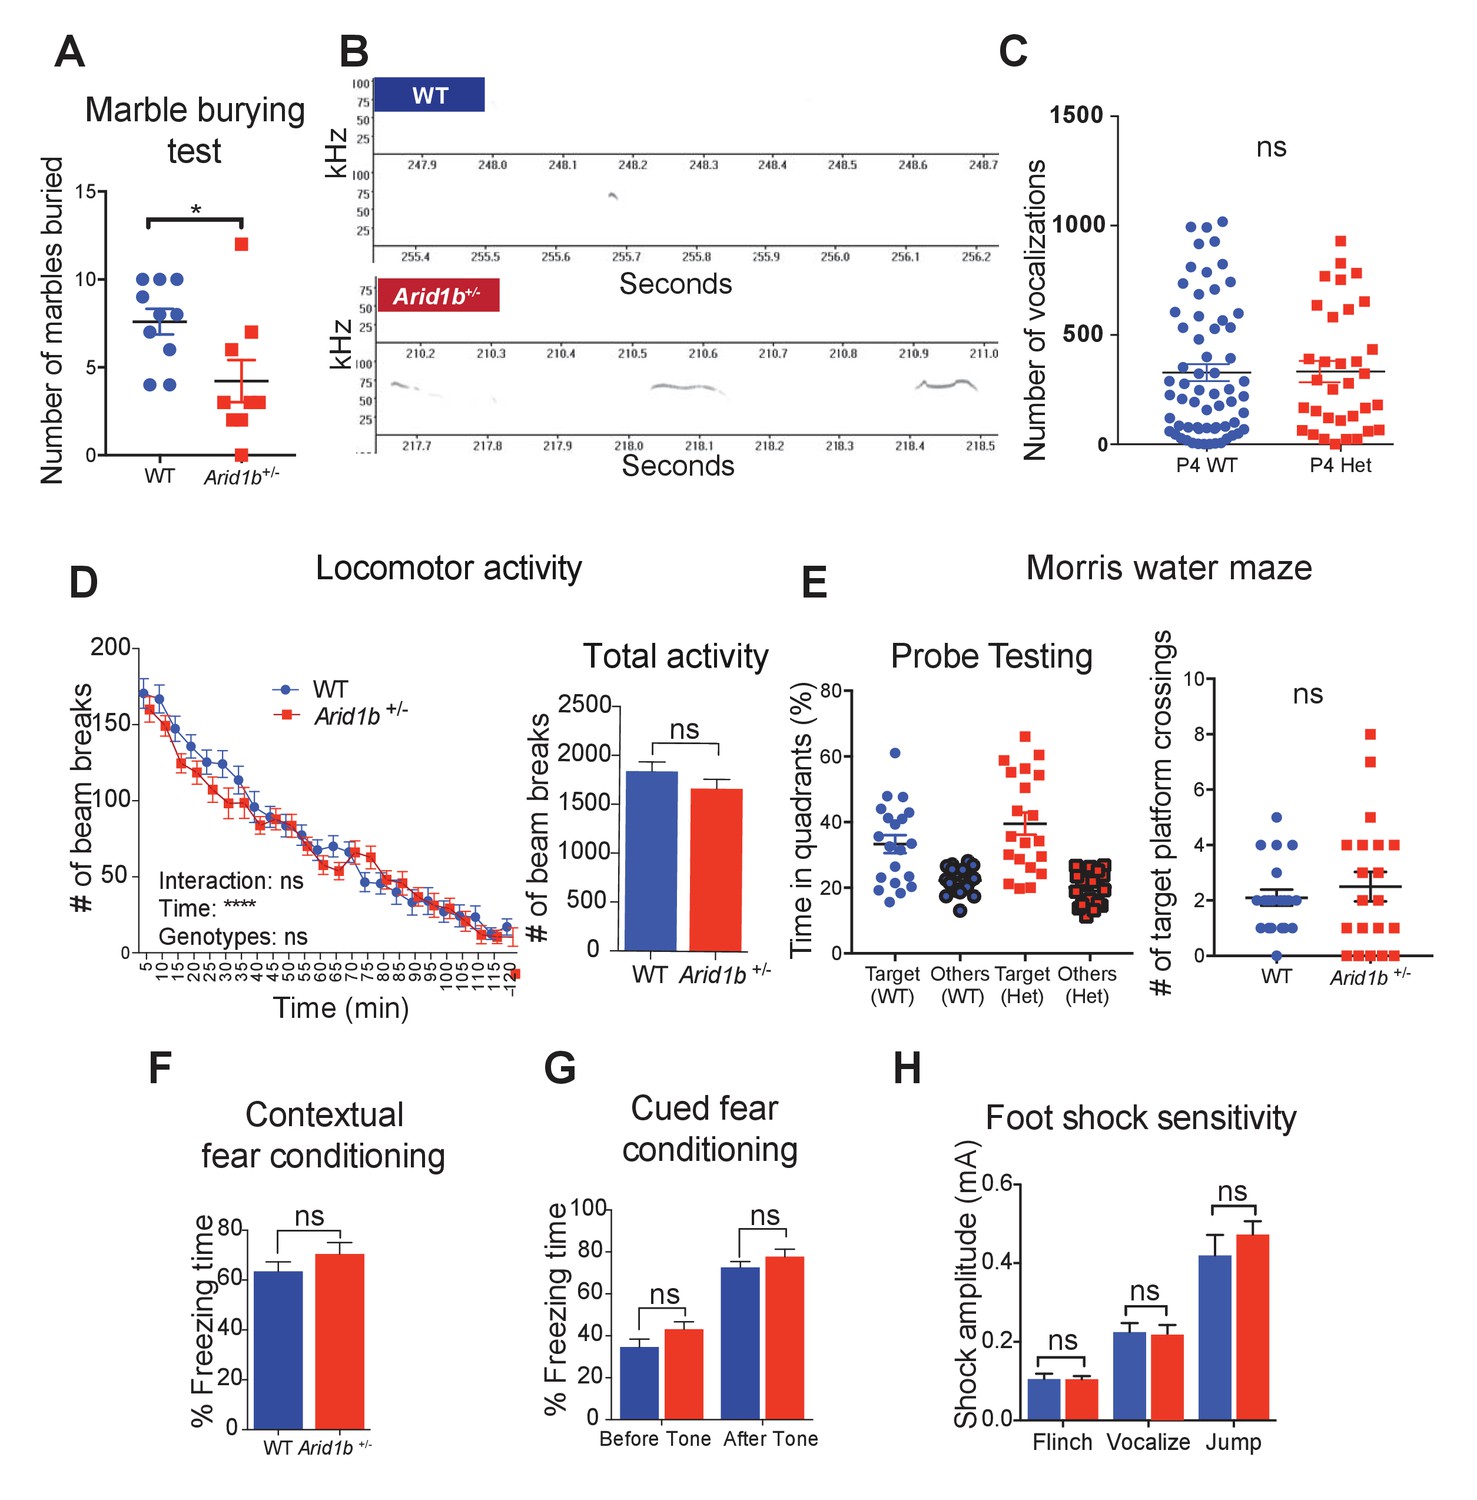
Additional neurobehavioral testing on Arid1b+/- mice.
(A) Marble burying test for 10 WT and 9 Arid1b+/- female mice. (B) Representative spectrograms of WT and Arid1b+/- vocalizations. (C) Number of vocalization calls of 63 WT and 33 Arid1b+/- male and female mice. (D) Locomotor activity quantified by number of beam breaks in a familiar home-cage environment within periodic time intervals over the course of two hours. Two-way repeated measures ANOVA was used to calculate the p-value (left). Total number of beam breaks during two hours, analyzed with Student’s t-test (right). 8 week old male mice (n = 20 WT and 20 Arid1b+/-) were used. (E) Time spent in the target quadrant vs. other quadrants in the probe testing of the water maze test at day 14. The target quadrant contains a hidden platform. 20 WT and 20 Arid1b+/- mice were examined (left). Number of target quadrant crossings in the probe testing of the water maze test at day 14 (right). 20 WT and 20 Arid1b+/- mice were examined. (F) Percent freezing time was quantified in the contextual fear conditioning test (n = 10 WT and 11 Arid1b+/- 8 week old male mice). (G) Percent freezing time was quantified in the cued fear conditioning test (n = 10 WT and 11 Arid1b+/- 8 week old male mice). (H) Foot shock sensitivity testing (n = 10 WT and 11 Arid1b+/- 8 week old male mice). Values represent mean ± SEM. Asterisks indicate significant differences between indicated littermate genotypes: *p-value ≤ 0.05; **p-value ≤ 0.01; ***p-value ≤ 0.001; ****p-value ≤ 0.0001; ns, not significant. Student’s t-test (two-tailed distribution, two-sample unequal variance) was used to calculate p-values unless otherwise indicated in the corresponding figure legend.
-
Figure 1—figure supplement 2—source data 1
- https://doi.org/10.7554/eLife.25730.008
Figure 2 with 1 supplement
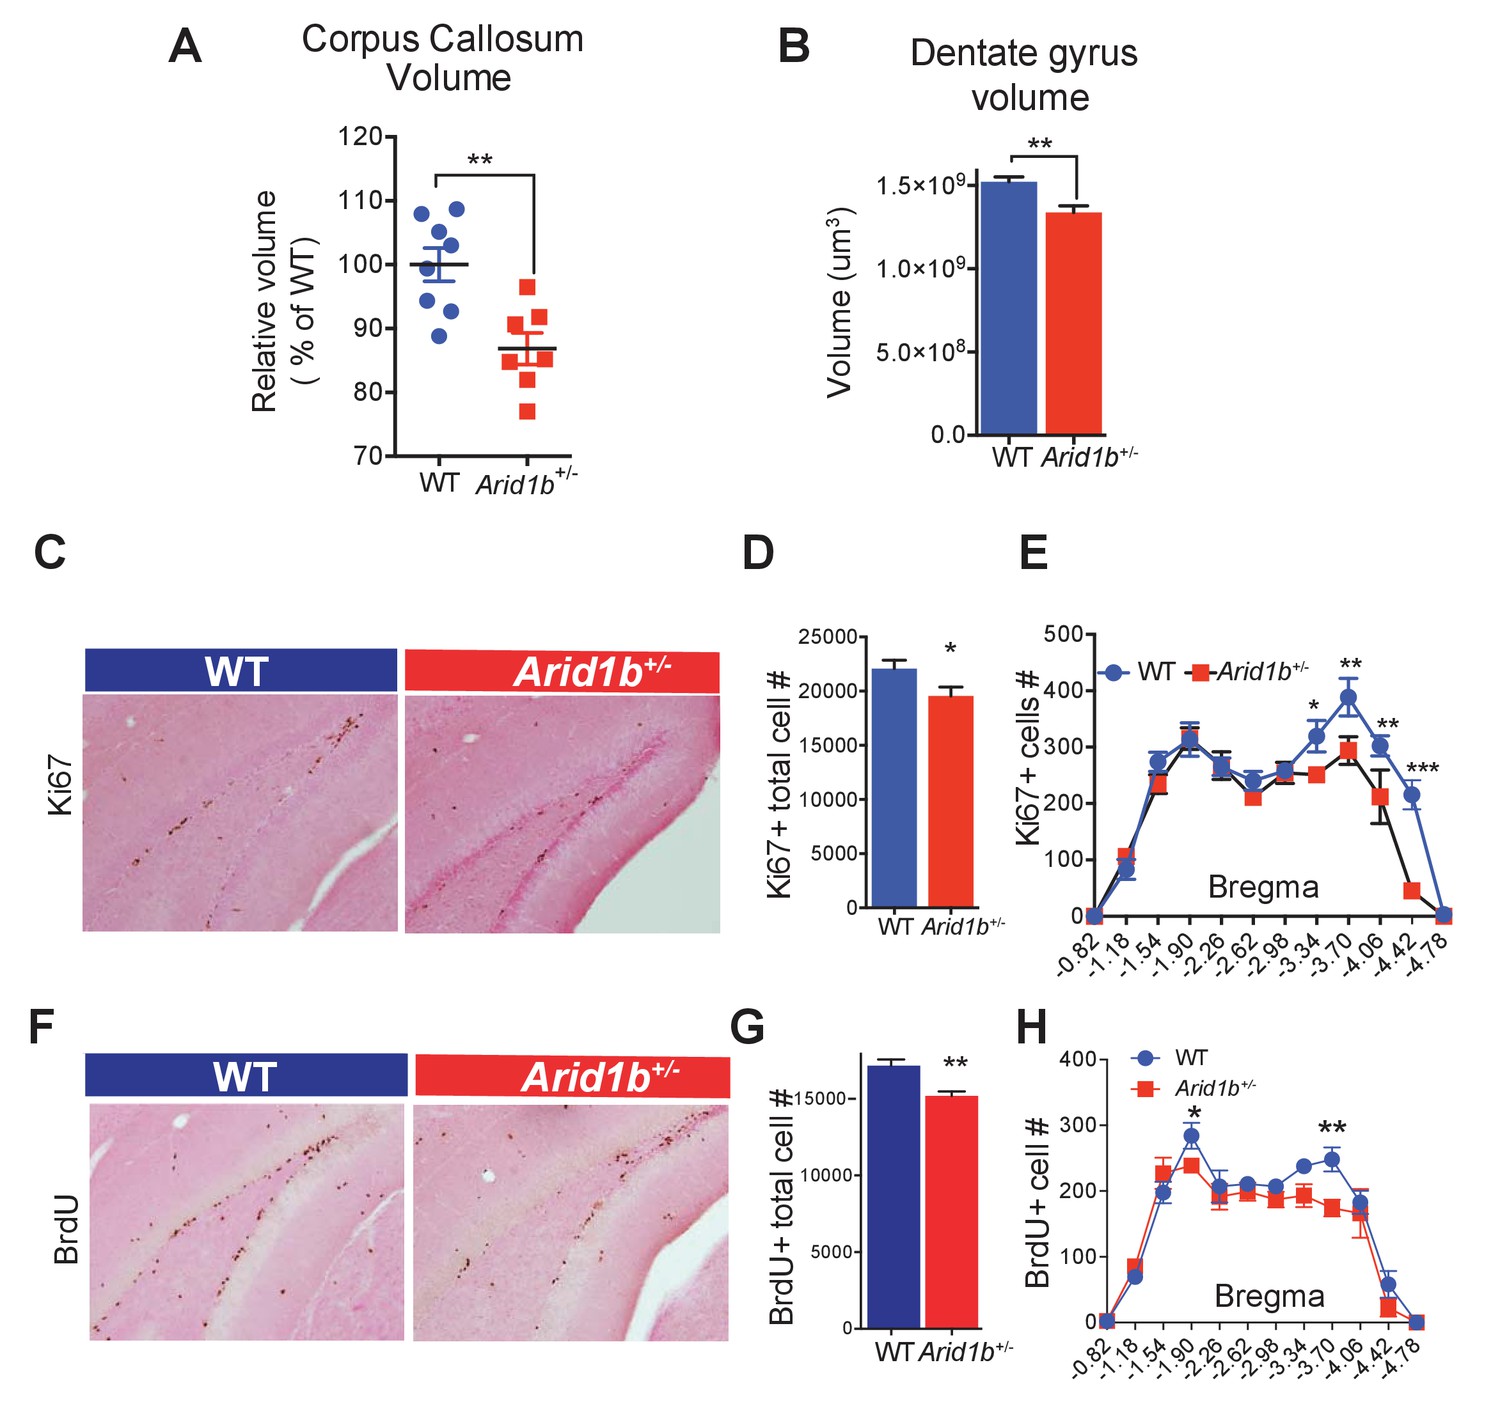
Arid1b haploinsufficiency results in neuroanatomical abnormalities implicated in neuropsychiatric diseases.
(A) Relative corpus callosum volume quantified through Cavalieri analysis (n = 8 WT and 7 Arid1b+/- brains from 50 day old females). (B) Dentate gyrus volume quantified through Cavalieri analysis (n = 7 WT and 7 Arid1b+/- brains from 50 day old females). (C) Representative Ki67 immunostaining. (D) Quantitation of Ki67+ total cell number (8 WT and 7 Arid1b+/- brains from 50 day old females). (E) Bregma analysis was used to determine cell proliferation (Ki67) as a function of location in the subgranular zone of the dentate gyrus. Two-way ANOVA with uncorrected Fischer’s Least Significant Difference (LSD) was used to calculate the statistics. (F) Representative BrdU immunostaining. WT and Arid1b+/- mice received one injection per day of the thymidine analog, bromodeoxyuridine (BrdU), for five days and brains were harvested three days following the last injection (6 WT and 4 Arid1b+/- brains from 50 day old females). (G) Quantification of BrdU+ total cell number. (H) Bregma analysis was used to determine cell proliferation (BrdU) as a function of location in the subgranular zone of the dentate gyrus (n = 6 WT and 4 Arid1b+/-). Values represent mean ± SEM. Asterisks indicate significant differences between indicated littermate genotypes, *p-value ≤ 0.05; **p-value ≤ 0.01; ***p-value ≤ 0.001; ****p-value ≤ 0.0001; ns, not significant. Student’s t-test (two-tailed distribution, two-sample unequal variance) was used to calculate p-values unless otherwise indicated in the figure legend.
-
Figure 2—source data 1
- https://doi.org/10.7554/eLife.25730.010
Figure 2—figure supplement 1
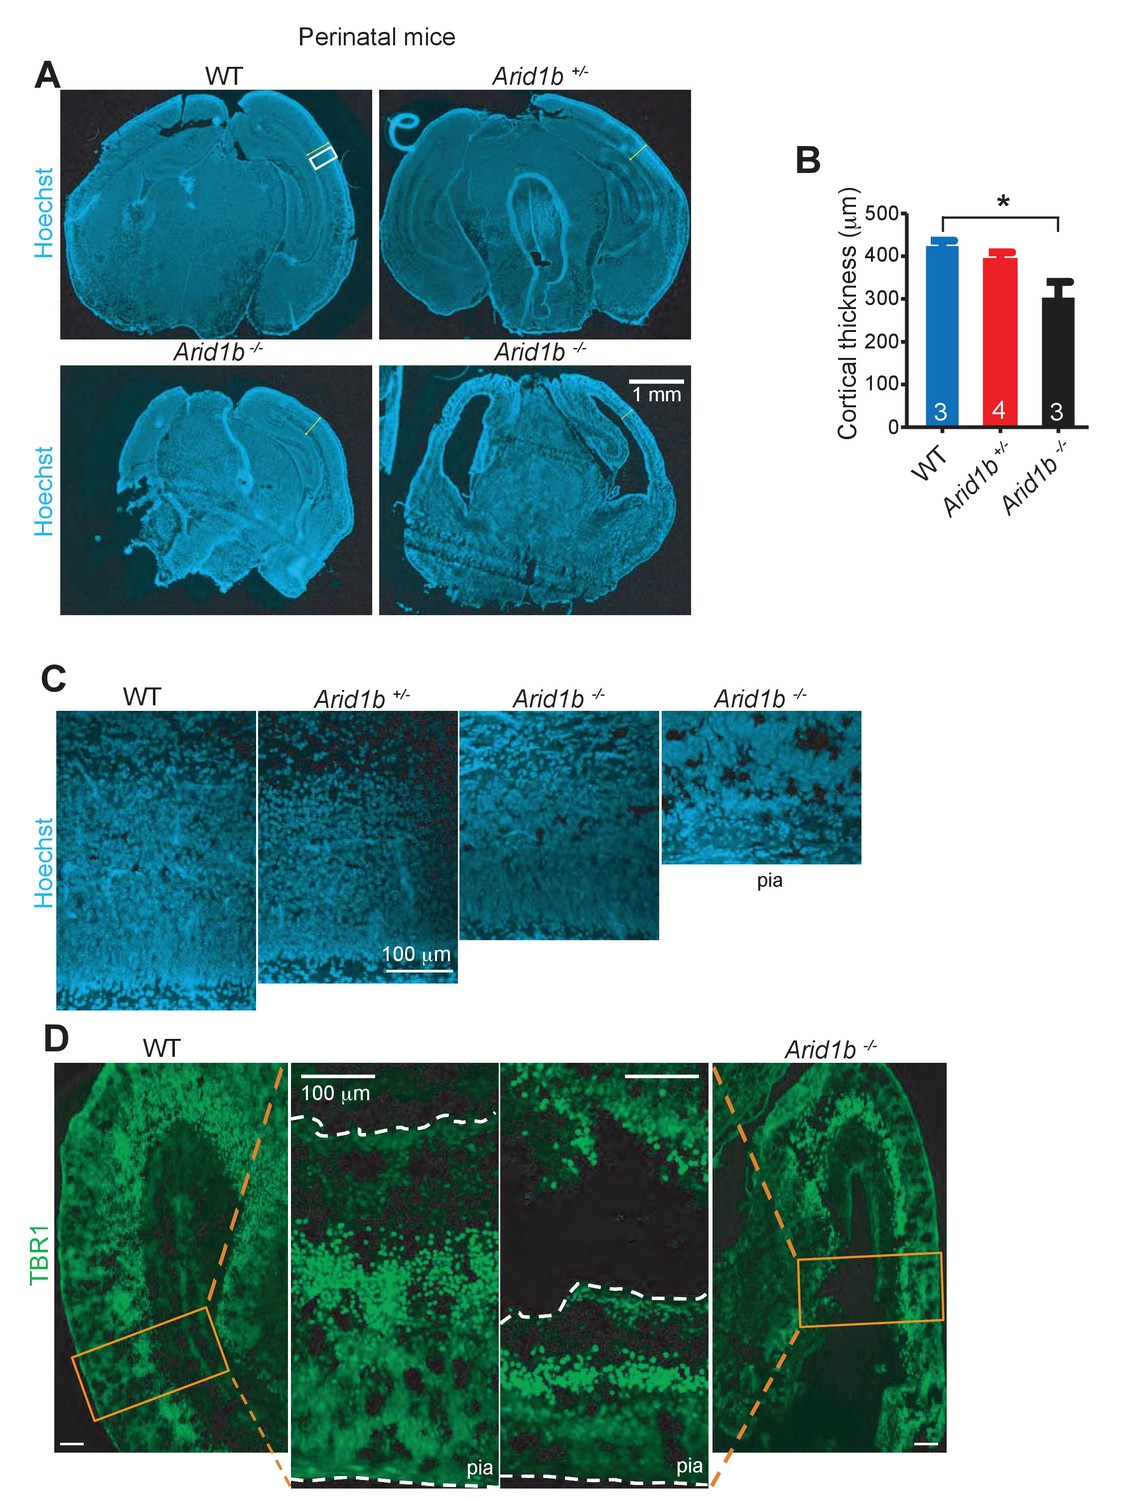
Arid1b+/- and Arid1b-/- brains have defects in cortical development.
(A) Hoechst staining of WT, Arid1b+/-, and Arid1b-/- brain sections showing cortical thickness differences outlined by the region in the white box. (B) Quantification of cortical thickness in WT, Arid1b+/-, and Arid1b-/- brain sections (the n is at the bottom of each bar). (C) Close up view of cortical regions in the white box from (A) above, showing reduced cortical thickness and cellularity. (D) TBR1 staining in WT and Arid1b-/- cortex showing neuron numbers.
-
Figure 2—figure supplement 1—source data 1
- https://doi.org/10.7554/eLife.25730.012
Figure 3
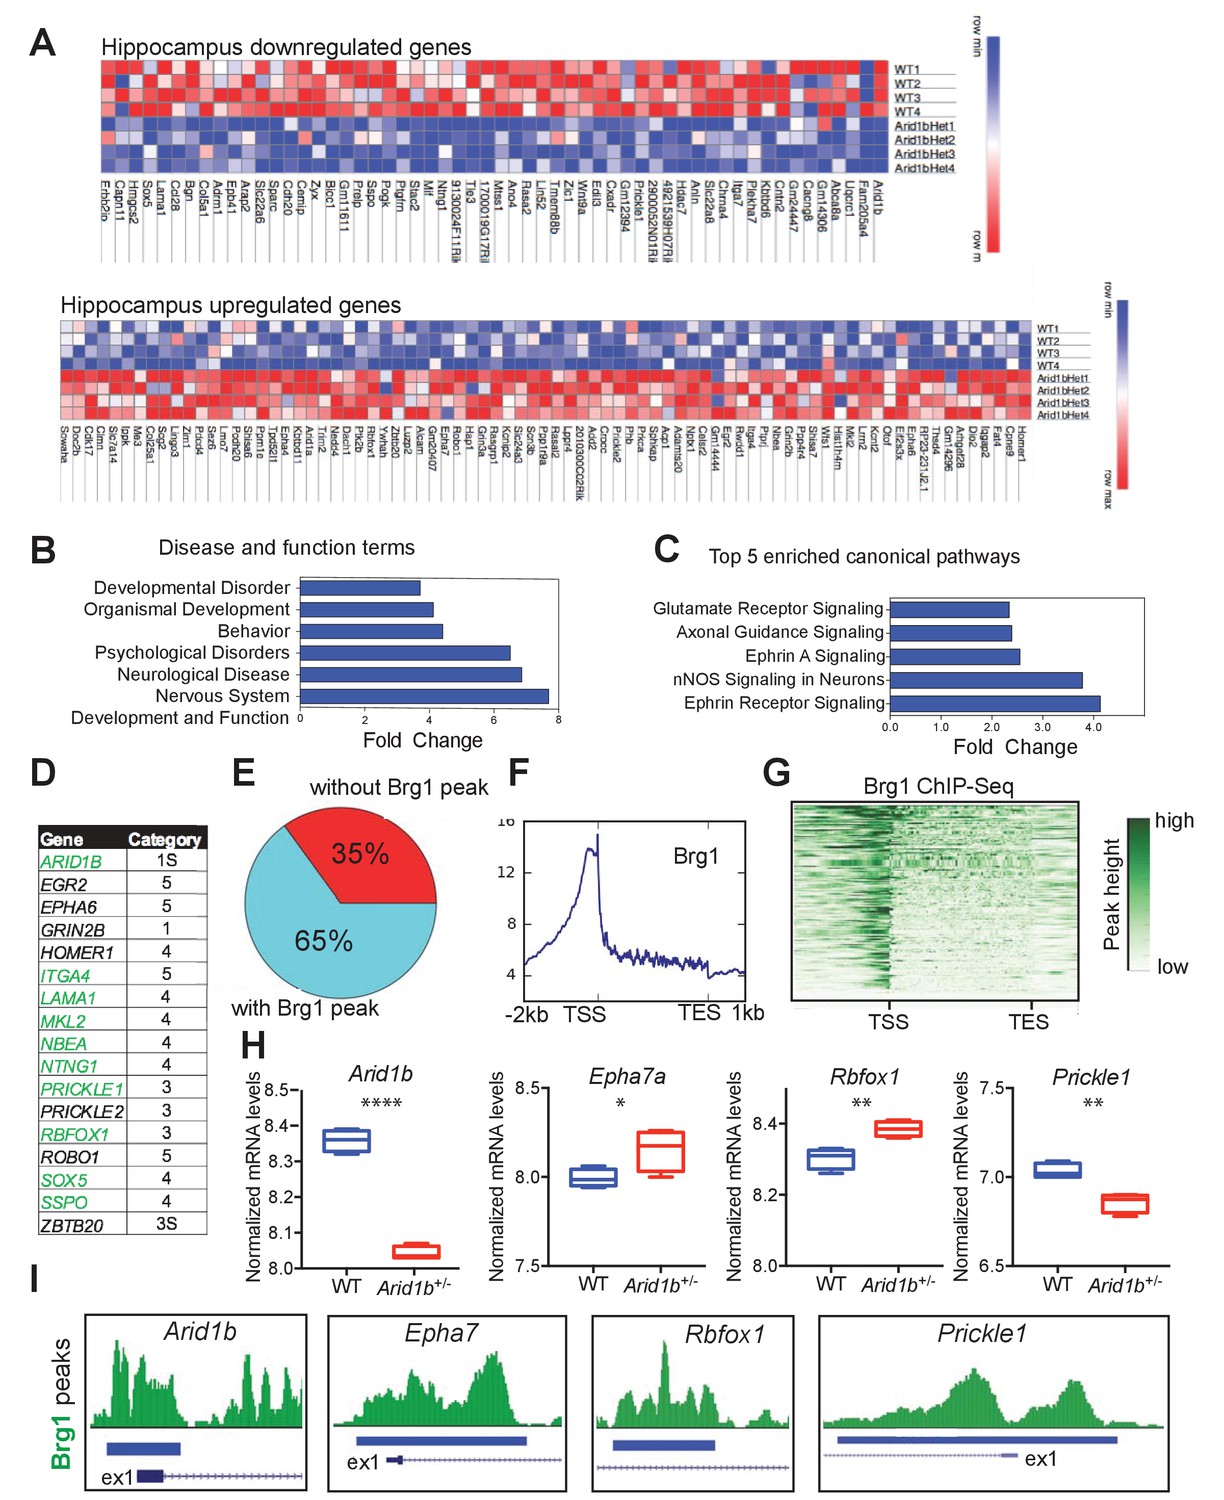
Arid1b haploinsufficiency results in changes in the expression of SWI/SNF regulated genes implicated in neuropsychiatric diseases.
(A) All significantly up- and downregulated genes in the Arid1b+/- hippocampus are ranked according to p-value (least to most significant from left to right). (B) Most enriched diseases and biological functions in hippocampus. (C) Most differentially regulated pathways in the hippocampus. (D) 14 of 140 (10%) differentially regulated genes were among the highest ranking autism risk genes identified in the SFARI database. Category S: syndromic, Category 1: high confidence, Category 2: strong candidate, Category 3: suggestive evidence, Category 4: minimal evidence, Category 5: Hypothesized (Basu et al., 2009). (E) Pie chart showing that 91 of 140 (65%) differentially regulated genes in hippocampus are direct targets of Brg1, a core SWI/SNF complex subunit. Brg1 target genes were identified using ChIP-Seq in mouse e11.5 forebrain (Attanasio et al., 2014). (F) Metaplot showing enrichment of Brg1 at the TSSs of genes regulated by Arid1b. (G) Heatmap showing Brg1 promoter binding in these genes. (H) Differential mRNA expression of representative genes involved in neurodevelopment and ASD (Data from: SFARI database, updated September, 2016) (Basu et al., 2009). (I) Brg1 peaks suggesting direct binding of SWI/SNF at the promoters of ASD-related genes. Values represent mean ± SEM. Asterisks indicate significant differences between indicated littermate genotypes, *p-value ≤ 0.05; **p-value ≤ 0.01; ***p-value ≤ 0.001; ****p-value ≤ 0.0001; ns, not significant. Student’s t-test (two-tailed distribution, two-sample unequal variance) was used to calculate p-values unless otherwise indicated in the corresponding figure legend.
Figure 4 with 1 supplement
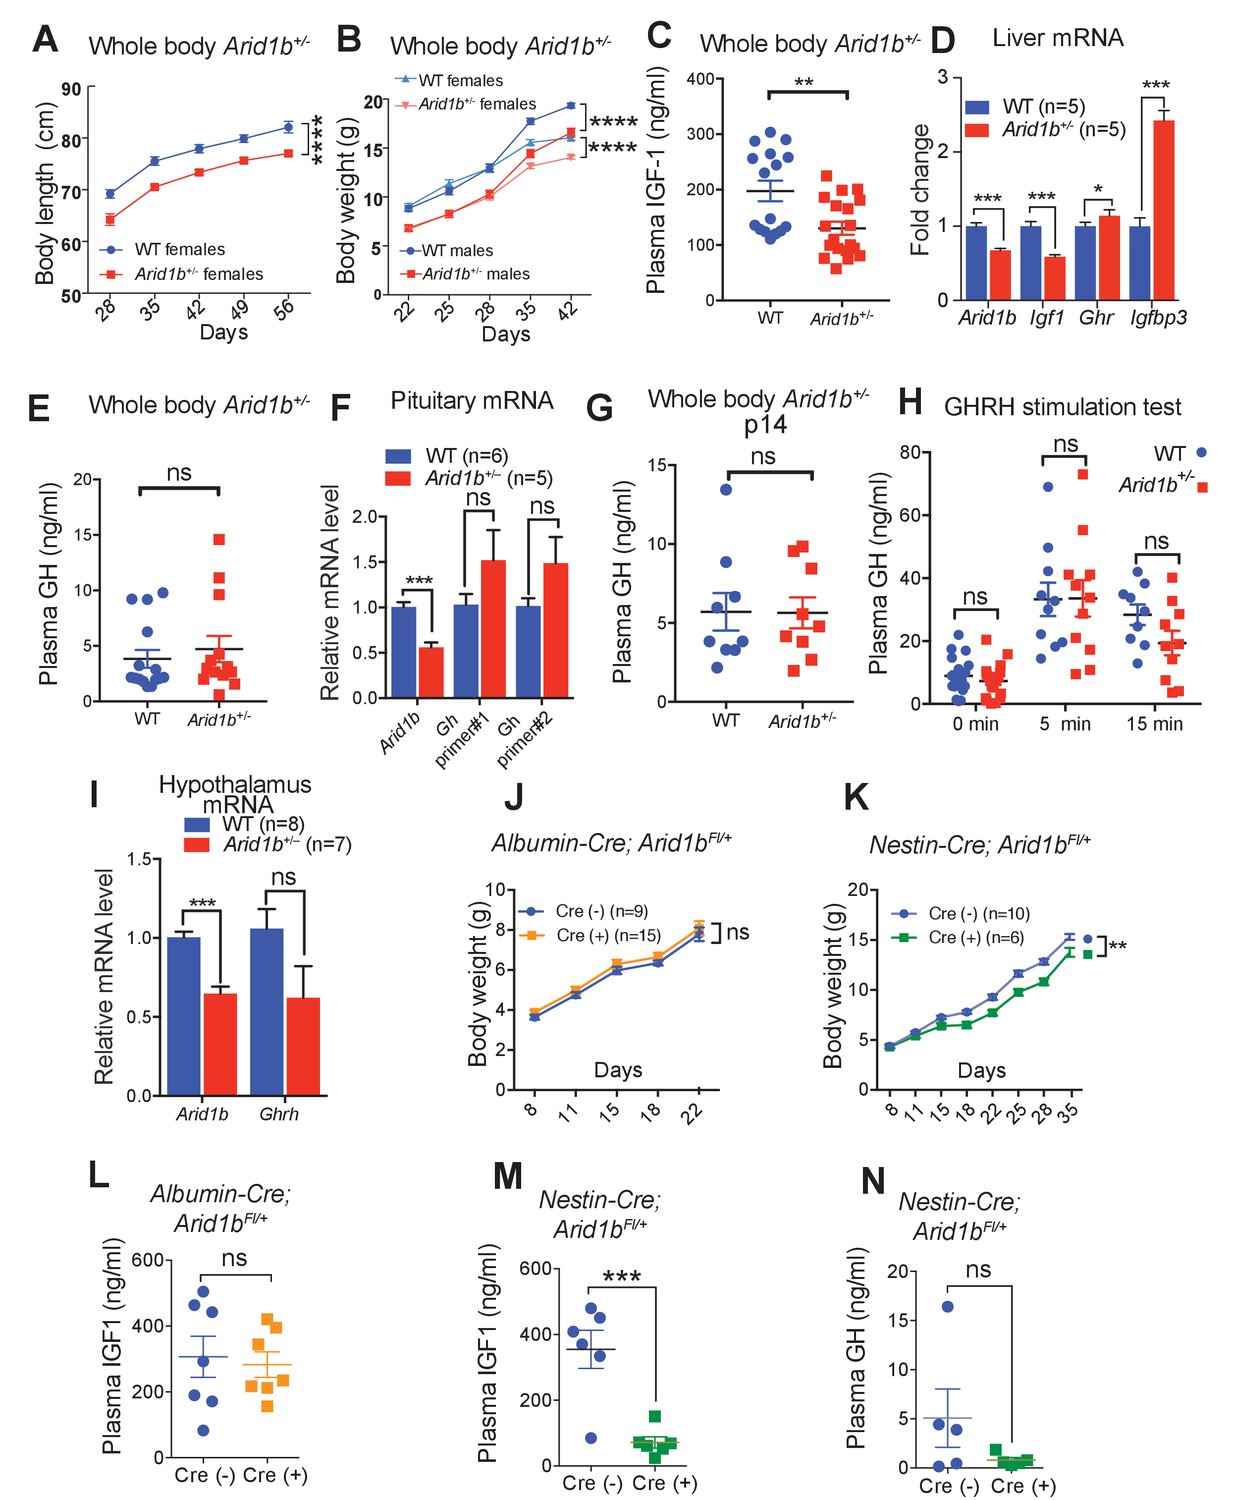
Growth retardation in Arid1b+/- mice is due to GH-IGF1 axis deficiency with a neuronal source.
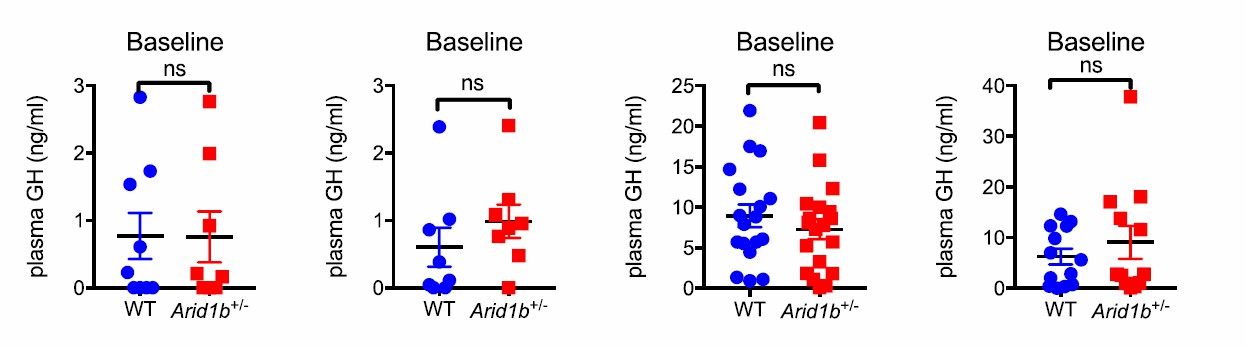
(A) Body length (nose-to-rump) curve of females (n = 9 WT and 9 Arid1b+/-). (B) Body weight growth curve for males (n = 14 WT and 14 Arid1b+/-) and females (n = 20 WT and 20 Arid1b+/-). For (A) and (B), repeated ANOVA with Bonferroni’s post-hoc analysis was used. (C) Plasma IGF1 as measured by ELISA (n = 16 WT and 19 Arid1b+/- 28–41 day old male and female mice). (D) Igf1 mRNA in WT and Arid1b+/- livers as measured by qPCR (n = 5 WT and 5 Arid1b+/- livers from 45 day old female mice). (E) Plasma GH as measured by ELISA (n = 15 WT and 14 Arid1b+/- 28–41 day old male and female mice). (F) Gh mRNA in WT and Arid1b+/- pituitary as measured by qPCR (n = 6 WT and 5 Arid1b+/- pituitary from 33-44 day old female mice). (G) Plasma GH (n = 9 WT and 9 Arid1b+/- 2 week old male mice). (H) Plasma GH before and after stimulation by human GHRH (n = 19 WT and n = 20 Arid1b+/- mice at baseline, n = 11 WT and n = 10 Arid1b+/- mice 5 and 15 min after GHRH administration). (I) Ghrh mRNA in WT and Arid1b+/- mediobasal hypothalamus as measured by qPCR. (n = 8 WT and 7 Arid1b+/- samples from 33-44 day old female mice). (J) Body weight curve for female Arid1bFl/+ (n = 9) and Albumin-Cre; Arid1bFl/+ (n = 15) mice. (K) Body weight curve for female Arid1bFl/+ (n = 10) and Nestin-Cre; Arid1bFl/+ (n = 6) mice. (L) Plasma IGF1 levels for 40–45 day old female Arid1bFl/+ (n = 7) and Albumin-Cre; Arid1bFl/+ (n = 7) mice. (M) Plasma IGF1 levels for 30–45 days old female Arid1bFl/+ (n = 6) and Nestin-Cre; Arid1bFl/+ (n = 6) mice. (N) Plasma GH levels for female Arid1bFl/+ (n = 5) and Nestin-Cre; Arid1bFl/+ (n = 5) mice. Values represent mean ± SEM. Asterisks indicate significant differences between indicated littermate genotypes, *p-value ≤ 0.05; **p-value ≤ 0.01; ***p-value ≤ 0.001; ****p-value ≤ 0.0001; ns, not significant. Student’s t-test (two-tailed distribution, two-sample unequal variance) was used to calculate p-values unless otherwise indicated in the figure legend.
-
Figure 4—source data 1
- https://doi.org/10.7554/eLife.25730.015
Figure 4—figure supplement 1

Growth and metabolic analysis of Arid1b+/- mice.
(A) Arid1b+/- organ/body weight ratios presented as % of WT organ/body weight ratio. (B) Food intake and(C) water consumption was quantified in a metabolic cage over 4 days. The absolute data was normalized to body weight (n = 12 WT and 12 Arid1b+/-8 week old male mice). Values represent mean ± SEM. Asterisks indicate significant differences between indicated littermate genotypes: *p-value ≤ 0.05; **p-value ≤ 0.01; ***p-value ≤ 0.001; ****p-value ≤ 0.0001; ns, not significant. Student’s t-test (two-tailed distribution, two-sample unequal variance) was used to calculate p-values unless otherwise indicated in the figure legend.
-
Figure 4—figure supplement 1—source data 1
- https://doi.org/10.7554/eLife.25730.017
Figure 5 with 1 supplement
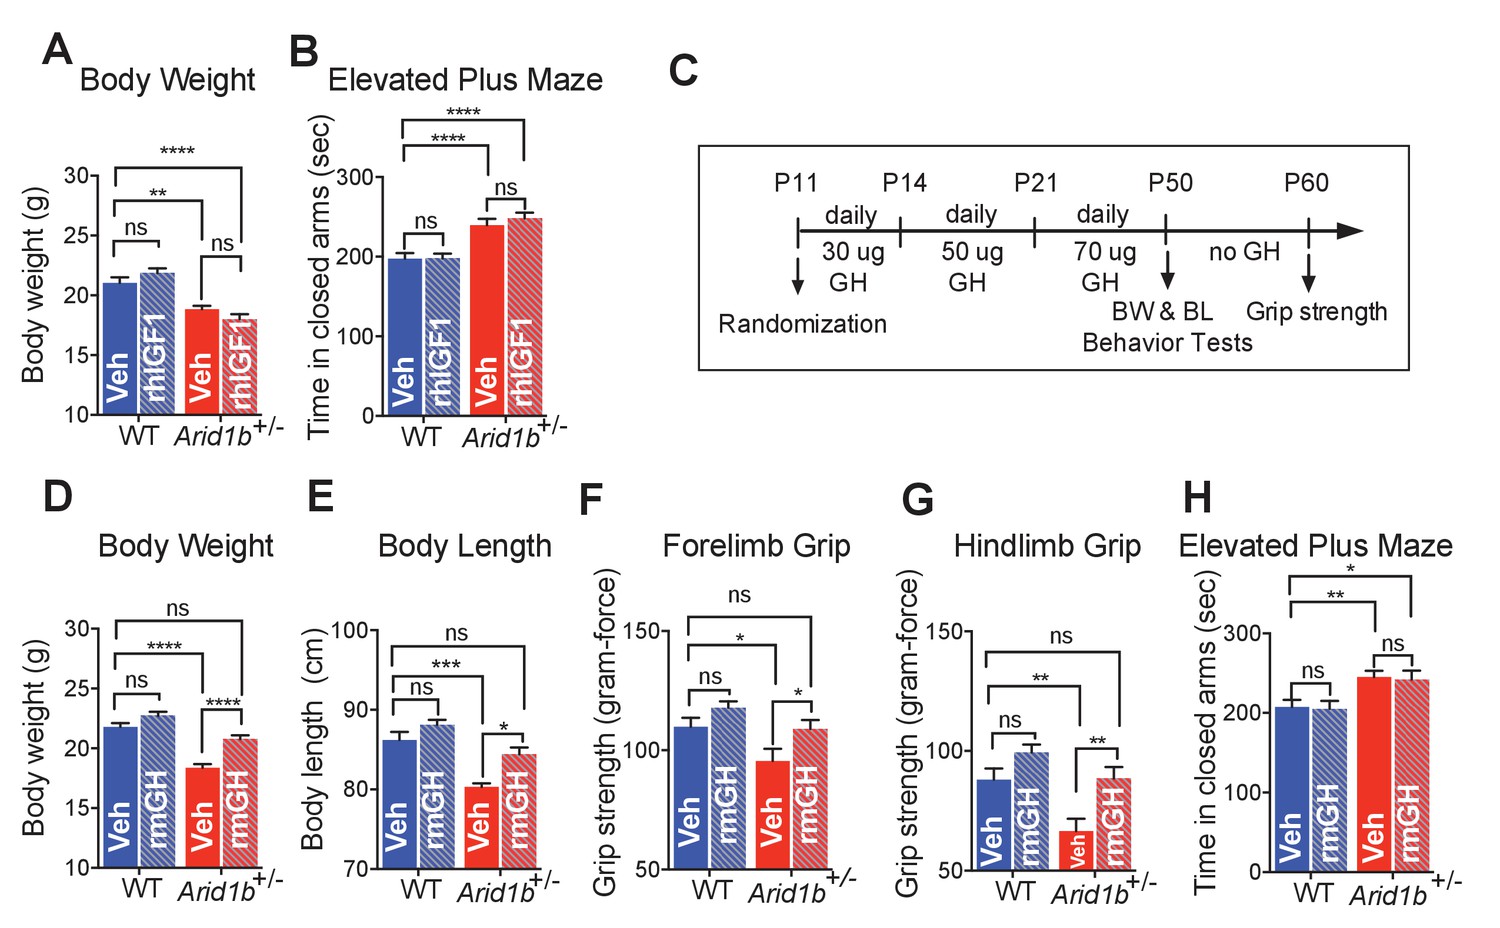
GH therapy reverses growth retardation and muscle weakness.
(A) Body weights at p50 (WT + vehicle (n = 12), WT + rhIGF1 (n = 12), Arid1b+/- + vehicle (n = 13) and Arid1b+/- + rhIGF1 (n = 13)). (B) Time spent in the closed arms of elevated plus maze at p50 (WT + vehicle (n = 27), WT + rhIGF1 (n = 29), Arid1b+/- + vehicle (n = 21) and Arid1b+/- + rhIGF1 (n = 22)). For (A) and (B), 0.5 mg/kg rhIGF1 was administrated daily starting from postnatal day 11. (C) Schema showing the duration and dose of daily recombinant GH treatment. (D) Body weights at p50 (WT + vehicle (n = 20), WT + rmGH (n = 16), Arid1b+/- + vehicle (n = 16) and Arid1b+/- + rmGH (n = 16)). (E) Nose-to-rump lengths at p50 (WT + vehicle (n = 7), WT + rmGH (n = 7), Arid1b+/- + vehicle (n = 6) and Arid1b+/- + rmGH (n = 6)). (F) Forelimb grip strength at p50 (WT + vehicle (n = 9), WT + rmGH (n = 9), Arid1b+/- + vehicle (n = 9) and Arid1b+/- + rmGH (n = 9)). (G) Hindlimb grip strength at p50 (WT + vehicle (n = 9), WT + rmGH (n = 9), Arid1b+/- + vehicle (n = 9) and Arid1b+/- + rmGH (n = 9)). (H) Time spent in the closed arms of elevated plus maze at p50 (WT + vehicle (n = 19), WT + rmGH (n = 16), Arid1b+/- + vehicle (n = 19) and Arid1b+/- + rmGH (n = 16)). Values represent mean ± SEM. Asterisks indicate significant differences between indicated littermate genotypes: *p-value ≤ 0.05; **p-value ≤ 0.01; ***p-value ≤ 0.001; ****p-value ≤ 0.0001; ns, not significant. Two-way ANOVA was used to calculate the p-value.
-
Figure 5—source data 1
- https://doi.org/10.7554/eLife.25730.019
Figure 5—figure supplement 1
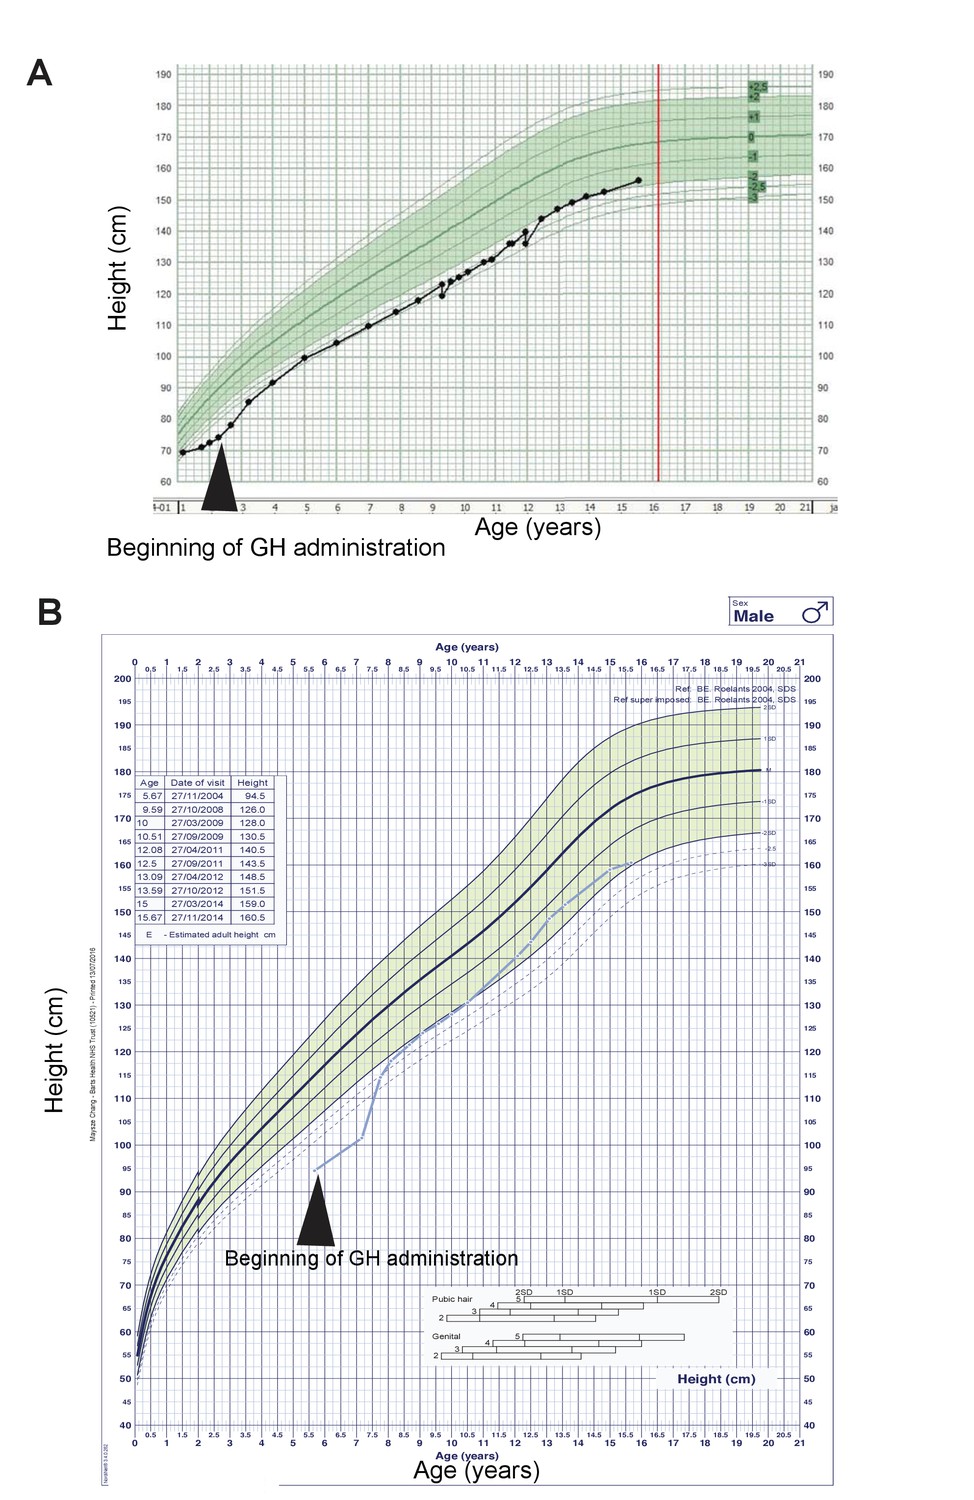
Two ARID1B mutant CSS patients were GH deficient and responsive to GH replacement.
(A) Growth curve of a CSS patient with an ARID1B mutation. GH treatments started at 2 years of age. Green shaded area represents the normal range. (B) Growth curve of a CSS patient with a 6q21.5 deletion, which includes the ARID1B locus. GH treatments started at 5.5 years of age.
Author response image 1
Tables
Table 1
Major clinical features associated with ARID1B mutations and phenotypes seen in Arid1b+/- mice. Abbreviations: CSS: Coffin-siris syndrome, ID: Intellectual disability, ASD: Autism spectrum disorder.
| Human ARID1B features | Diagnosis | References | Mouse |
|---|---|---|---|
| Intellectual/cognitive disability | CSS, ID | (Hoyer et al., 2012; Santen et al., 2012; Halgren et al., 2012) | No |
| Growth retardation | CSS | (Tsurusaki et al., 2012) | Yes |
| Coarse facial features | CSS | (Sim et al., 2015) | Unknown |
| Muscle hypotonia | CSS | (Hoyer et al., 2012) | Yes |
| Hydrocephalus | CSS | (Imai et al., 2001) | Yes |
| Corpus callosum agenesis or hypoplasia | CSS | (Halgren et al., 2012; Santen et al., 2012) | Yes |
| Brachydactyly, hypoplastic nail/finger | CSS | (Hoyer et al., 2012; Santen et al., 2012; Brautbar et al., 2009) | Unknown |
| Abnormal vocalization, speech impairment | ASD, CSS | (Santen et al., 2012) | Yes |
| Anxiety | ASD, CSS | (O'Roak et al., 2012; Deciphering Developmental Disorders Study, 2015) | Yes |
| Social interaction deficits | ASD | (O'Roak et al., 2012; Deciphering Developmental Disorders Study, 2015) | Yes |
| Repetitive behaviors | ASD | (O'Roak et al., 2012; Deciphering Developmental Disorders Study, 2015) | Yes |
Download links
A two-part list of links to download the article, or parts of the article, in various formats.
Downloads (link to download the article as PDF)
Open citations (links to open the citations from this article in various online reference manager services)
Cite this article (links to download the citations from this article in formats compatible with various reference manager tools)
Arid1b haploinsufficient mice reveal neuropsychiatric phenotypes and reversible causes of growth impairment
eLife 6:e25730.
https://doi.org/10.7554/eLife.25730


