Fast two-photon imaging of subcellular voltage dynamics in neuronal tissue with genetically encoded indicators
- Quebec Mental Health Institute, Université Laval, Canada
- Stanford University, United States
- Baylor College of Medicine, United States
Figures
Figure 1 with 4 supplements
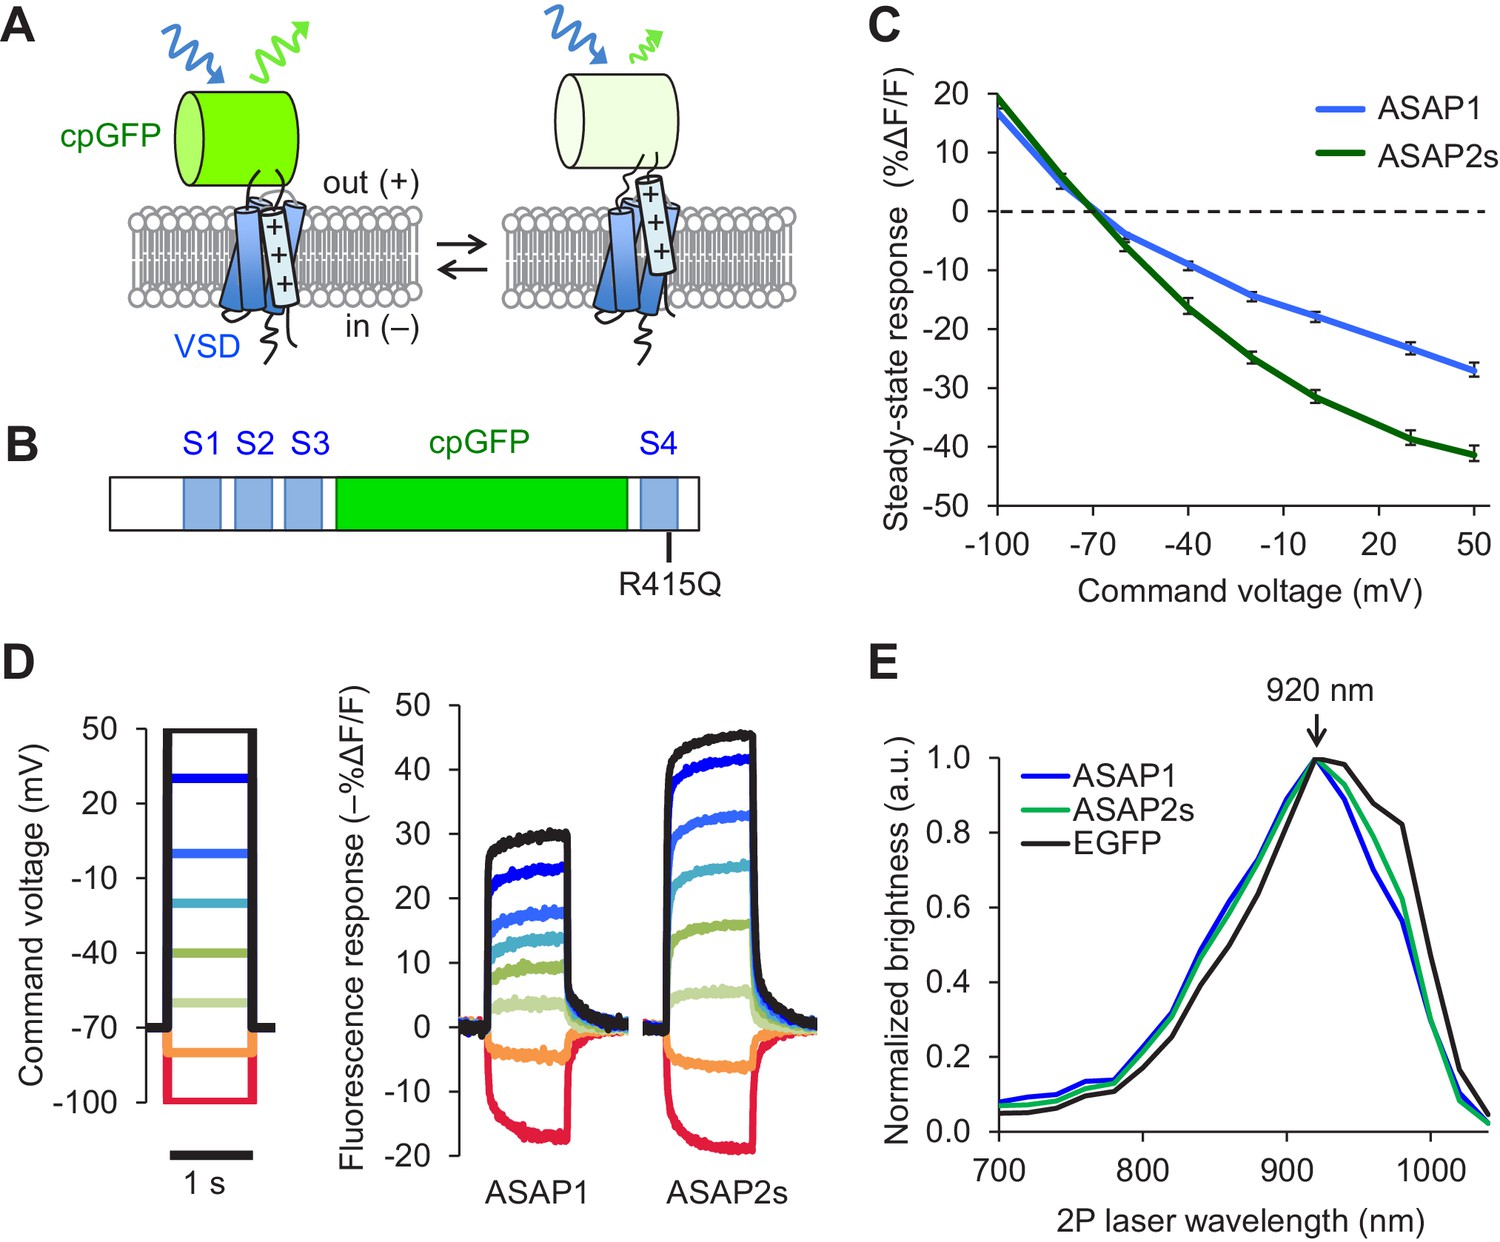
Design and in vitro characterization of ASAP2s.
(A) In ASAP-type sensors, voltage-induced movement of a positively charged transmembrane helix of a voltage-sensing domain (VSD) is thought to perturb the protonation state of a circularly permuted GFP (cpGFP), resulting in changes in fluorescence emission. (B) Schematic diagram of ASAP1, showing the VSD transmembrane domains (S1 to S4, blue), cpGFP, and the location of the new mutation in ASAP2s (R415Q). (C) Mean fluorescence responses to voltage steps (n = 6 HEK293A cells for ASAP1 and n = 5 for ASAP2s). Error bars are standard error of the mean (SEM). Responses are reported as the fluorescence change (ΔF) normalized by the initial fluorescence (F), expressed as a percentage of the initial fluorescence (% ΔF/F). (D) Representative fluorescence responses of ASAP1 and ASAP2s to voltage steps from −100 to 50 mV. Responses were measured at 5 ms intervals and were normalized to the fluorescence at the −70 mV holding potential. (E) Two-photon excitation spectra of ASAP1, ASAP2s, and EGFP. All proteins were expressed in HEK293-Kir2.1 cells with resting membrane potential of ~-77 mV. Brightness was evaluated every 20 nm from 700 to 1040 nm. Each spectrum was normalized to its peak brightness. Traces are the mean of >30 cells.
Figure 1—figure supplement 1
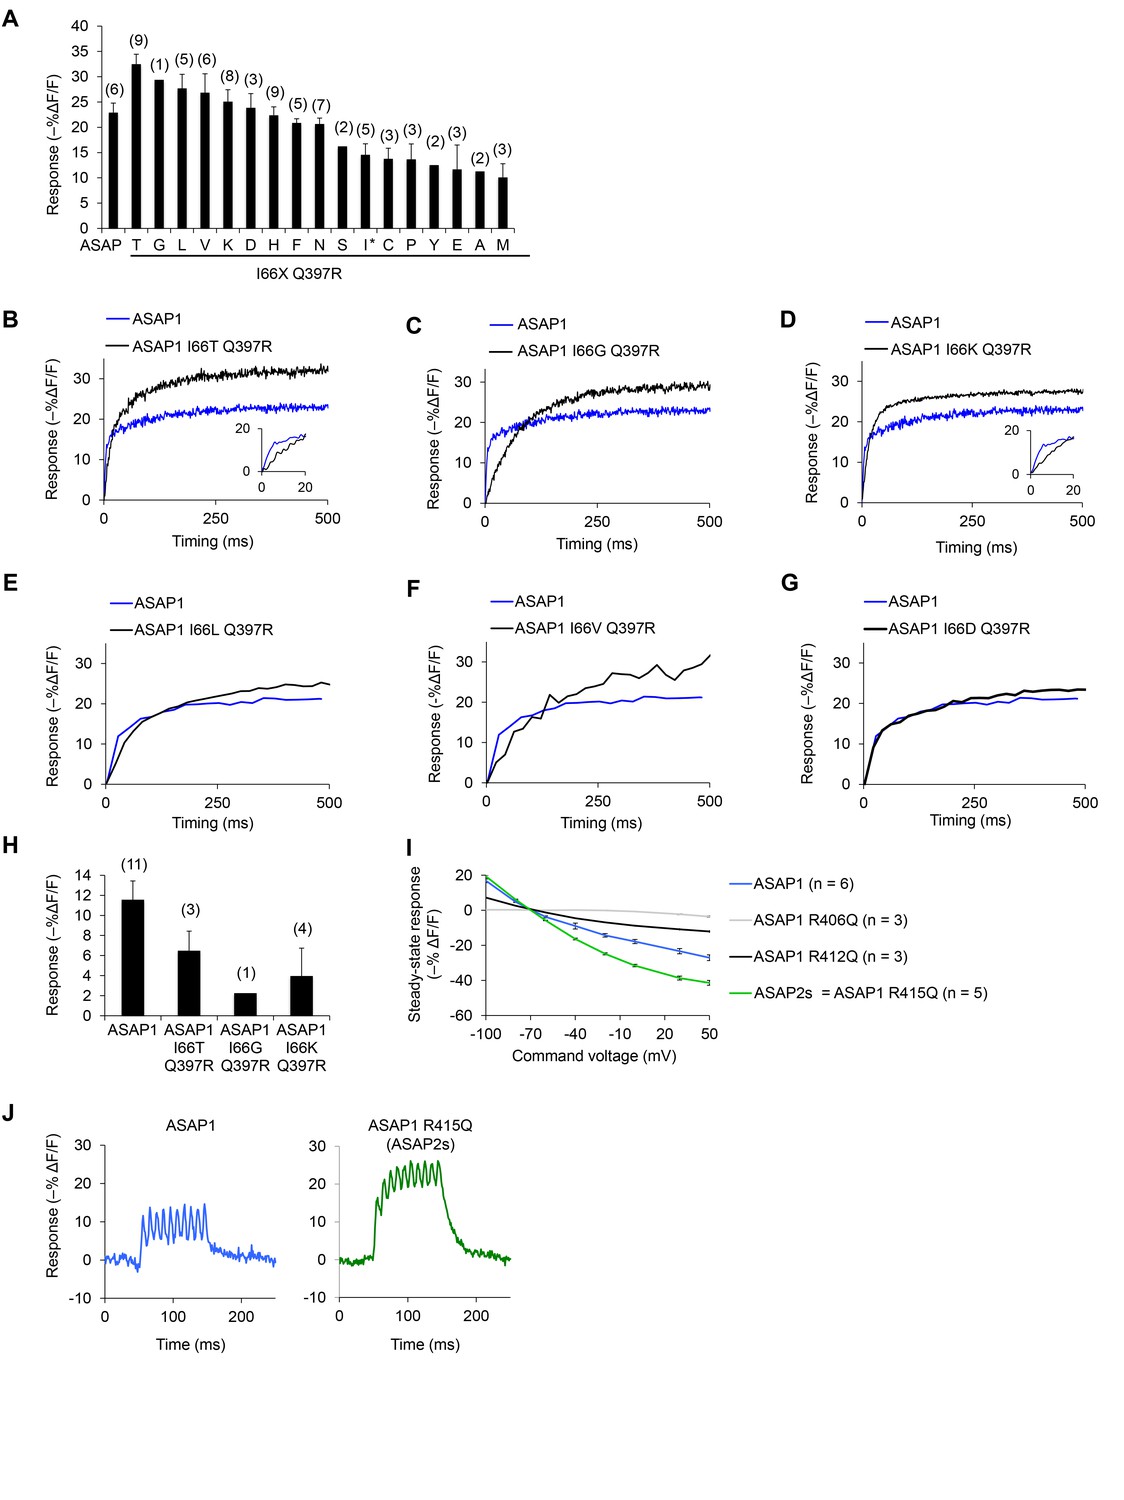
In vitro characterization of candidate GEVIs based on ASAP1.
(A) Mean maximal response of ASAP1 variants to 500 ms, 100 mV steps in HEK293A cells from a holding potential of −70 mV. The x-axis labels represent the amino acid substituted in the place of I66 in ASAP1 I66X Q397R variants. We restored the wild-type amino acid at position 397 (arginine) since this is the genetic background used by Lacroix and colleagues when evaluating the importance of the residue homologous to I66 in the voltage-sensing domain from the sea squirt voltage-sensitive phosphatase (Lacroix and Bezanilla, 2012). The asterisk denotes the original amino acid at position 66 (isoleucine). Variants where isoleucine was replaced with arginine or tryptophan did not produce fluorescence at the membrane. The variant with glutamine (Q) expressed poorly and was not tested. Error bars are ±1 SEM. The number of cells tested is shown in parentheses above the bars. (B–H) The improved response amplitude of variants in panel A is due to a larger slow component. Representative fluorescence responses of selected ASAP1 variants to voltage steps from −70 mV to +30 mV (panels B-D) or −70 mV to −10 mV (panels E-G). Insets, fluorescence response during the first 20 ms. (H) Mean maximal response of selected ASAP1 variants to an artificial action potential waveform (4.0 ms full width at half–maximum, 100 mV peak amplitude) in HEK293A cells from a holding potential of −70 mV. Error bars are ±1 SEM. The number of cells tested is shown in parentheses above the bars. (I) Mean response of ASAP1 variants to transmembrane voltage in HEK293A cells from a holding potential of –70 mV. SEMs are small (0.2–1.2% in ΔF/F). Samples sizes (n) correspond to individual cells. (J) Responses of ASAP1 (left) and ASAP2s (right) to a 100 Hz series of 10 AP waveforms (4.0 ms full width at half–maximum, 100 mV peak amplitude) in HEK293A cells. Responses were collected for six cells (ASAP1) or five cells (ASAP2s), with representative traces shown here.
Figure 1—figure supplement 2
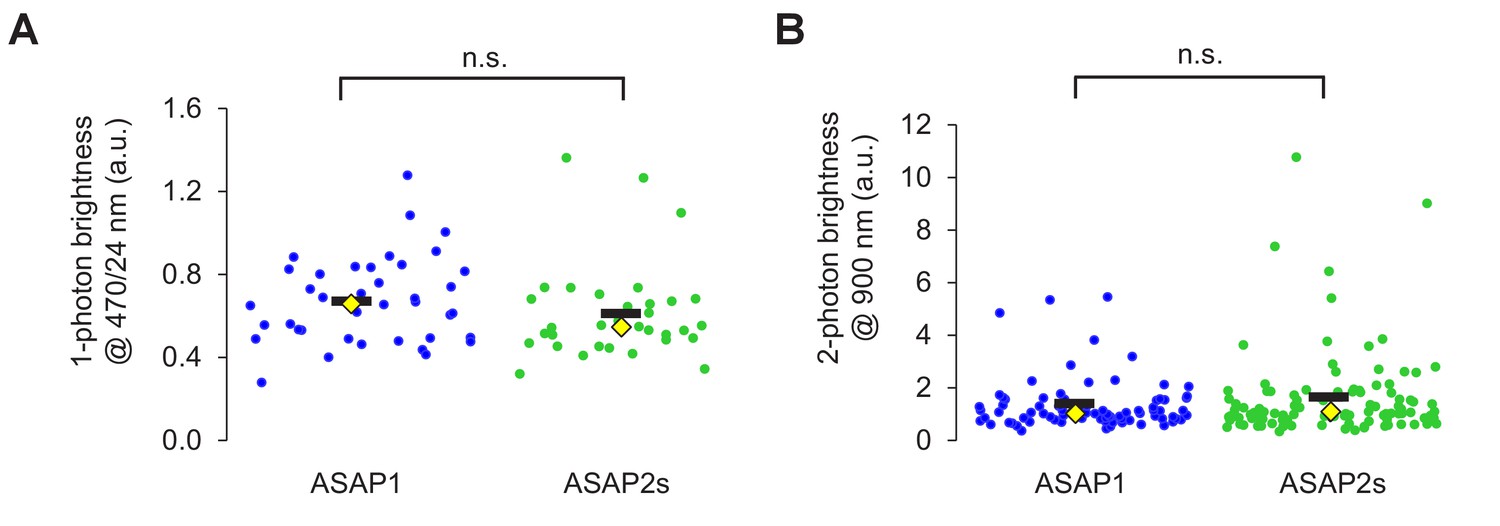
Brightness of ASAP sensors in immortalized cells.
(A) One-photon relative brightness of ASAP1 and ASAP2s transiently expressed in HEK293-Kir2.1 cells. Cells were illuminated with 470/24 nm light, and emitted photons were filtered using a 520/23 nm filter. The brightness of each cell was normalized for variability in expression level by exciting a red fluorescent protein (FusionRed) genetically fused to the C-terminus of each indicator. FusionRed was excited with 555/15 nm light, and emitted photons were collected following a 597/39 nm filter. Individual cells are shown as circles. Black horizontal bars correspond to the mean, yellow lozenges correspond to the median. n = 39 (ASAP1) or 33 (ASAP2s) cells. n.s., p=0.09 (Mann-Whitney U test). (B) Two-photon brightness of ASAP1 and ASAP2s transiently expressed in HEK293-Kir2.1 cells. Cells were illuminated at 900 nm using a femtosecond pulsed Ti:sapphire (two-photon) laser, and emitted photons were filtered using a 525/50 nm filter. As in panel A, the brightness of each cell was normalized for variability in expression level by exciting a red fluorescent protein (FusionRed) genetically fused to the C-terminus of each indicator. FusionRed was excited with 1040 nm light, and emitted photons were filtered using a 605/70 nm filter. Individual cells are shown as circles. Black horizontal bars correspond to the mean, yellow lozenges correspond to the median. n = 81 (ASAP1) or 105 (ASAP2s) cells. n.s., p=0.66 (Mann-Whitney U test).
Figure 1—figure supplement 3
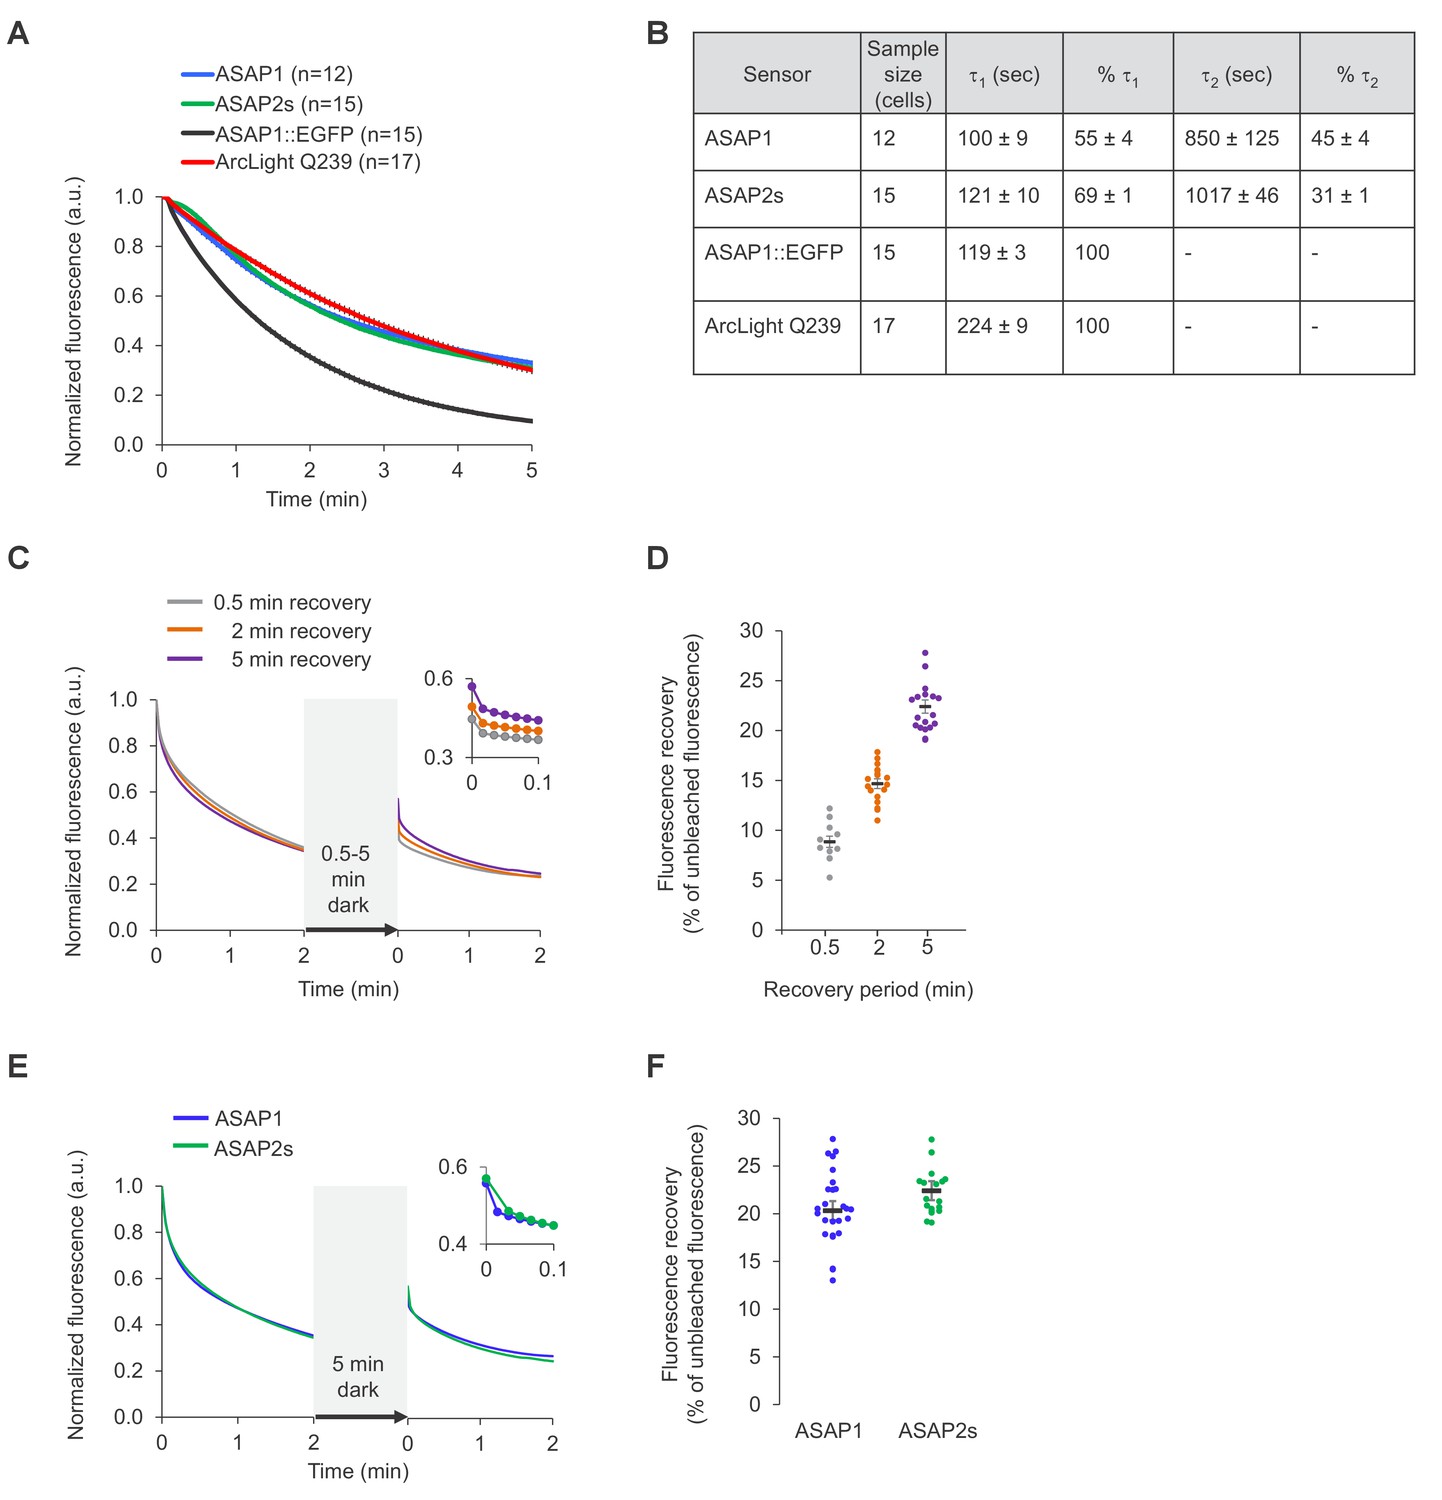
Photostability of ASAP sensors in immortalized cells under one-photon illumination.
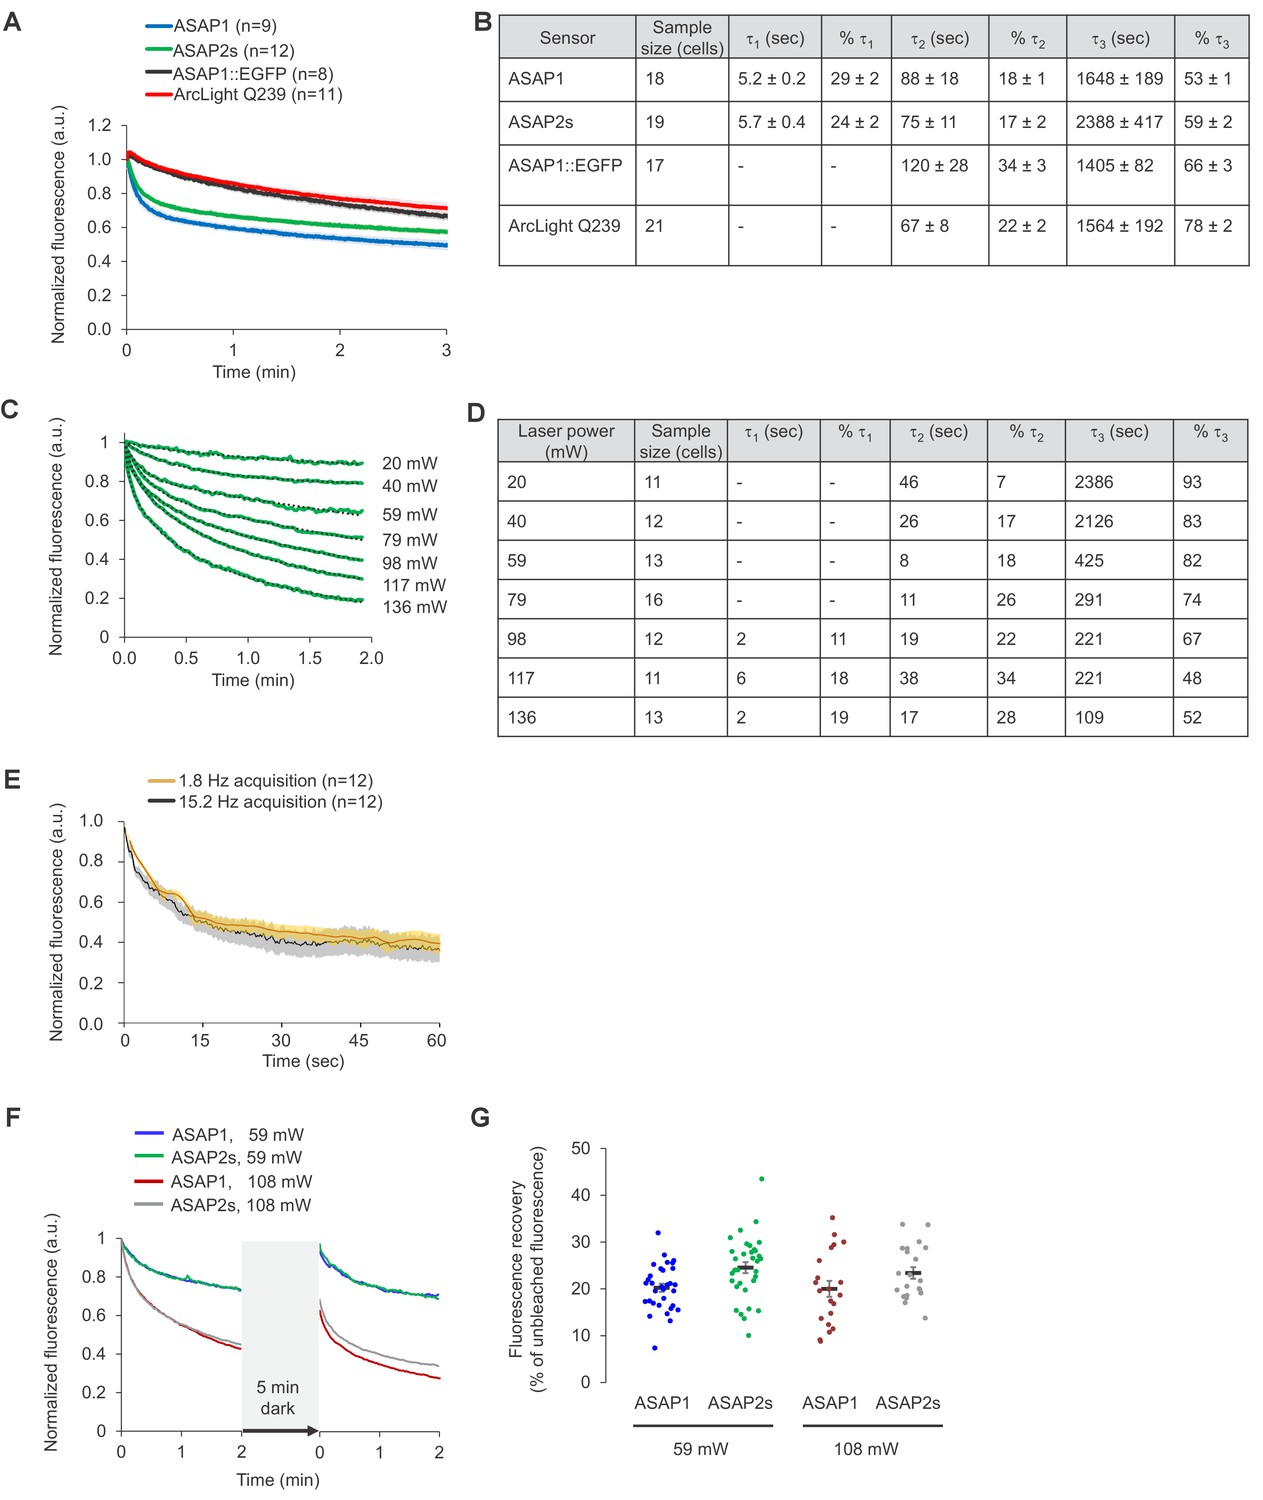
For all panels, HEK293-Kir2.1 cells transiently expressing the voltage indicators or the ASAP1::EGFP control were imaged under widefield one-photon illumination. (A) One-photon photobleaching kinetics. Cells transiently expressing a voltage indicator were continuously illuminated with 470 to 490 nm light at 11 mW/mm2 at the sample plane, and their fluorescence at 525/50 nm monitored. Photobleaching curves for ASAP1::EGFP were also obtained for comparison. Fluorescence was normalized to 1.0 at t = 0 and averaged over all cells (n). Error bars are SEM. (B) Photobleaching time constants for the data in (A). Values are mean ± 1 SEM. (C) Reversibility of one-photon photobleaching. Cells expressing ASAP2s were illuminated for 2 min, incubated in the dark for 0.5–5 min, and illuminated for another 2 min. Illumination was performed with 470/24 nm light at 88 mW/mm2 at the sample plane. Fluorescence was normalized to 1.0 at t = 0. Traces are mean responses. n = 13, 18, and 20 cells for the 0.5, 2 and 5 min incubations, respectively. The inset is a magnification of the first 6 s post-incubation. (D) Quantification of the fluorescence recovery in panel C. Circles are individual cells, black bars are the means, and error bars are the SEM. (E) Comparison of spontaneous fluorescence recovery of ASAP1 and ASAP2s following a 5-min incubation in the dark. The experiment was conducted as described in panel C. n = 26 and 20 cells for ASAP1 and ASAP2s, respectively. ASAP2s data is the same as in panel C. The inset is a magnification of the first 6 s post-incubation. (F) Quantification of the fluorescence recovery in panel C. Circles are individual cells, black bars are the means and error bars are the SEM.
Figure 1—figure supplement 4
Photostability of ASAP sensors in immortalized cells under two-photon illumination.
For all panels, HEK293-Kir2.1 cells transiently expressing the voltage indicators (or the ASAP1::EGFP control) were imaged under two-photon illumination using a femtosecond pulsed Ti:sapphire laser. (A) Two-photon photobleaching kinetics at a power level of 6.4 mW at the objective back aperture, using a 60 × 0.9 NA objective, and an excitation wavelength of 920 nm. Each pixel was sampled at 2.23 Hz with a dwell time of 5.2 μs. Fluorescence was normalized to 1.0 at t = 0 and averaged over all cells (n). Shaded areas correspond to the SEM. (B) Photobleaching time constants for the data in panel A. Values are presented as mean ± 1 SEM. (C) Dependence of photobleaching kinetics on laser power. Cells transiently expressing ASAP2s were imaged with a 20 × 1.0 NA objective and illuminated with the two-photon laser tuned to 900 nm and attenuated to various power levels from 20 to 136 mW. Each pixel was sampled at 1.03 Hz with a dwell time of 1.58 μs. Fluorescence was normalized to 1.0 at t = 0 and averaged over all cells (green traces). Dotted lines correspond to exponential fits. (D) Photobleaching time constants for the data in panel C. (E) Two-photon photobleaching kinetics at 900 nm under two conditions with matched power per pixel. The slow acquisition condition was performed at 1.8 Hz with a 80.2 μs dwell time per pixel and 19.8 mW of power at the sample plane. The fast acquisition condition was performed at 15.2 Hz with a 5.2 μs dwell time per pixel and 36.5 mW of power at the sample plane. Both conditions correspond to 2.9 μW average power per pixel. Cells were imaged using a 20 × 1.0 NA objective. Thick traces are the means; shaded areas correspond to the SEM. The sample size (n) corresponds to individual cells. (F) Cells expressing ASAP1 or ASAP2s were excited using two-photon illumination for 2 min, incubated in the dark for 5 min, and illuminated again for 2 min. Cells were imaged with a 20 x-1.0 NA objective. Frames were acquired at 1.03 Hz and with a 1.58 μs pixel dwell time. The laser was tuned to 900 nm and its power adjusted to 59 or 108 mW at the sample plane, corresponding to 1.0 and 1.8 μW per pixel, respectively. n = 32, 33, 21, and 21 cells for ASAP1s (59 mW), ASAP2s (59 mW), ASAP1 (108 mW), and ASAP2s (108 mW), respectively. (G) Quantification of the fluorescence recovery in panel F. Circles are individual cells, black bars are the means, and error bars are the SEM.
Figure 2 with 3 supplements

Characterization of ASAP2s in cardiomyocytes and neurons.
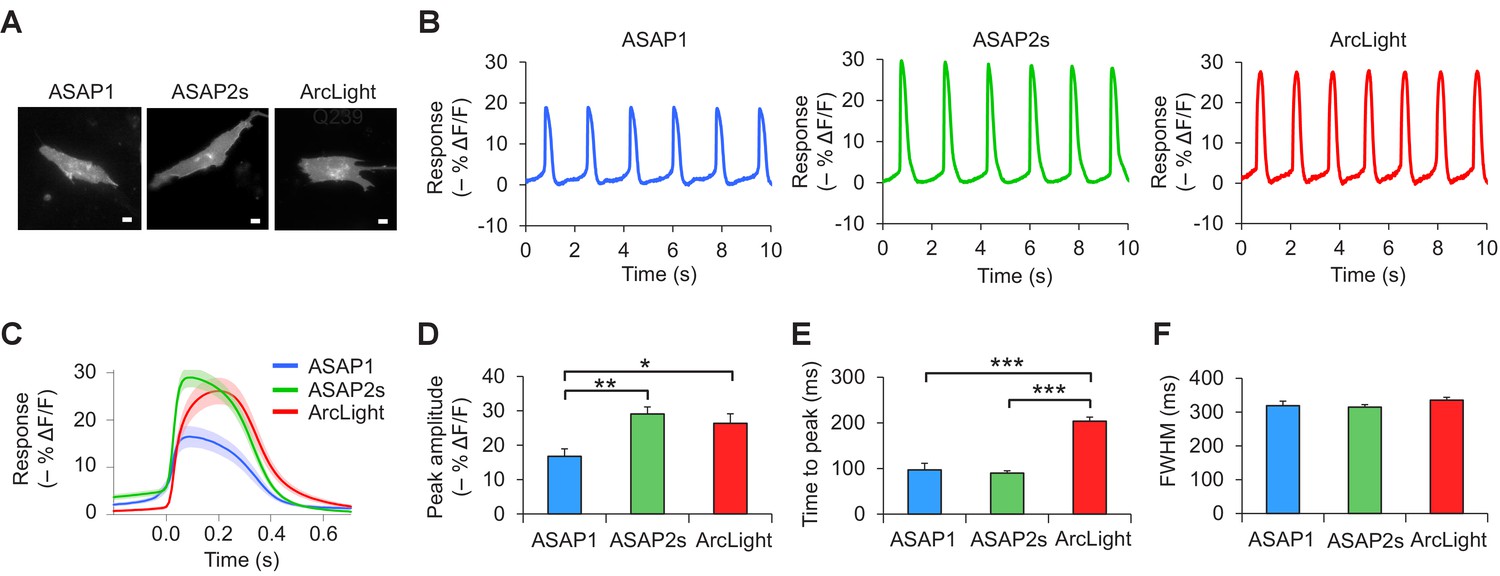
(A) Representative human embryonic stem-cell-derived cardiomyocytes (hESC-CMs) expressing ASAP1, ASAP2s, or ArcLight. Scale bar, 10 μm. (B) Representative single-trial responses to spontaneous cardiac APs from the cells in panel A. (C) Mean fluorescence response to spontaneous APs from hESC-CMs expressing ASAP1 (blue, n = 3 cells), ASAP2s (green, n = 4), or ArcLight (black, n = 4), with 5-15 APs per cell. Shaded areas are ±1 SEM. Prior to averaging, baseline fluorescence was set to the minimum fluorescence value. Because hESC-CMs show variability in beating rate, averaging was performed in a time window that contains only one AP across all cells analyzed. As this window does not include the lowest point of the cardiac cycle in all cells, average traces do not all start at or return to baseline in this window. The same cells were further analyzed in panels D to F. (D) Maximal fluorescence response of ASAP1, ASAP2s, or ArcLight to cardiac APs. (E) Time from the start of the fast-rising phase of the AP to the fluorescence peak. (F) Full-width at half-maximum (FWHM) of the fluorescence trace. (G) ASAP2s fluorescence is well localized at the plasma membrane in a representative cultured rat cortical neuron imaged by confocal microscopy. Bottom, magnified image of the boxed regions. Scale bar, 10 μm. (H) Responses of ASAP1 and ASAP2s to APs in representative cultured hippocampal neurons. Thick traces are mean responses over all APs for a given representative neuron. Single-trial traces are shown in gray (n = 11 APs per neuron), with single examples shown in Figure 2—figure supplement 3A. (I) Mean peak response to current-triggered APs in cultured hippocampal neurons. n = 8 (ASAP1) and 5 (ASAP2s) neurons. For each neuron, we measured 2 to 25 APs (n = 118 total APs for ASAP1, n = 56 for ASAP2s). AP peak voltage was 9.5 ± 2.0 mV for ASAP1 and 15.2 ± 2.0 mV for ASAP2s (mean ± SEM). (J) Widths of the optical spikes at half-maximal height. AP widths in the voltage traces were 4.2 ± 0.2 and 4.6 ± 0.1 ms for ASAP1 and ASAP2s, respectively (mean ± SEM). The data is from the same neurons as panel I. (K) Areas under the curve of fluorescence responses. The data is from the same neurons as panel I. For all panels: comparisons were performed using the t-test with Bonferroni correction for multiple comparisons, except for panel I, where the Mann-Whitney U-test was used. *p<0.05, **p<0.01, ***p<0.001.
Figure 2—figure supplement 1
Voltage imaging of cardiomyocytes derived from induced pluripotent stem cells.
(A) Representative human-induced pluripotent stem cell-derived cardiomyocytes (iPSC-CMs) expressing ASAP1, ASAP2s, or ArcLight. Scale bar, 10 μm. (B) Representative single-trial responses to spontaneous cardiac APs from the cells in panel A. (C) Mean fluorescence response to spontaneous APs from iPSC-CMs expressing ASAP1 (n = 10 cells), ASAP2s (n = 11), or ArcLight (n = 11), with >15 APs per cell. Lighter shading is ±1 SEM. Prior to averaging, baseline fluorescence was set to the minimum fluorescence value. Because iPSC-CMs show variability in beating rate, averaging was performed in a time window that contains only one AP across all cells analyzed. As this window does not include the lowest point of the cardiac cycle in all cells, average traces do not all start at or return to baseline in this window. The same cells were further analyzed in panels D to F. (D) Maximal fluorescence response of ASAP1, ASAP2s, or ArcLight to cardiac APs. (E) Time from the start of the fast-rising phase of the AP to the fluorescence peak. (F) Full-width at half-maximum (FWHM) of the fluorescence trace. For panels D to F, comparisons were performed using the t-test with Bonferroni correction for multiple comparisons, except for the comparison between ASAP1 and ArcLight in panel E, where the Mann-Whitney U-test was used. *p<0.05, **p<0.01, ***p<0.001.
Figure 2—figure supplement 2
Plasma membrane localization of the ASAP indicators in cultured hippocampal neurons.
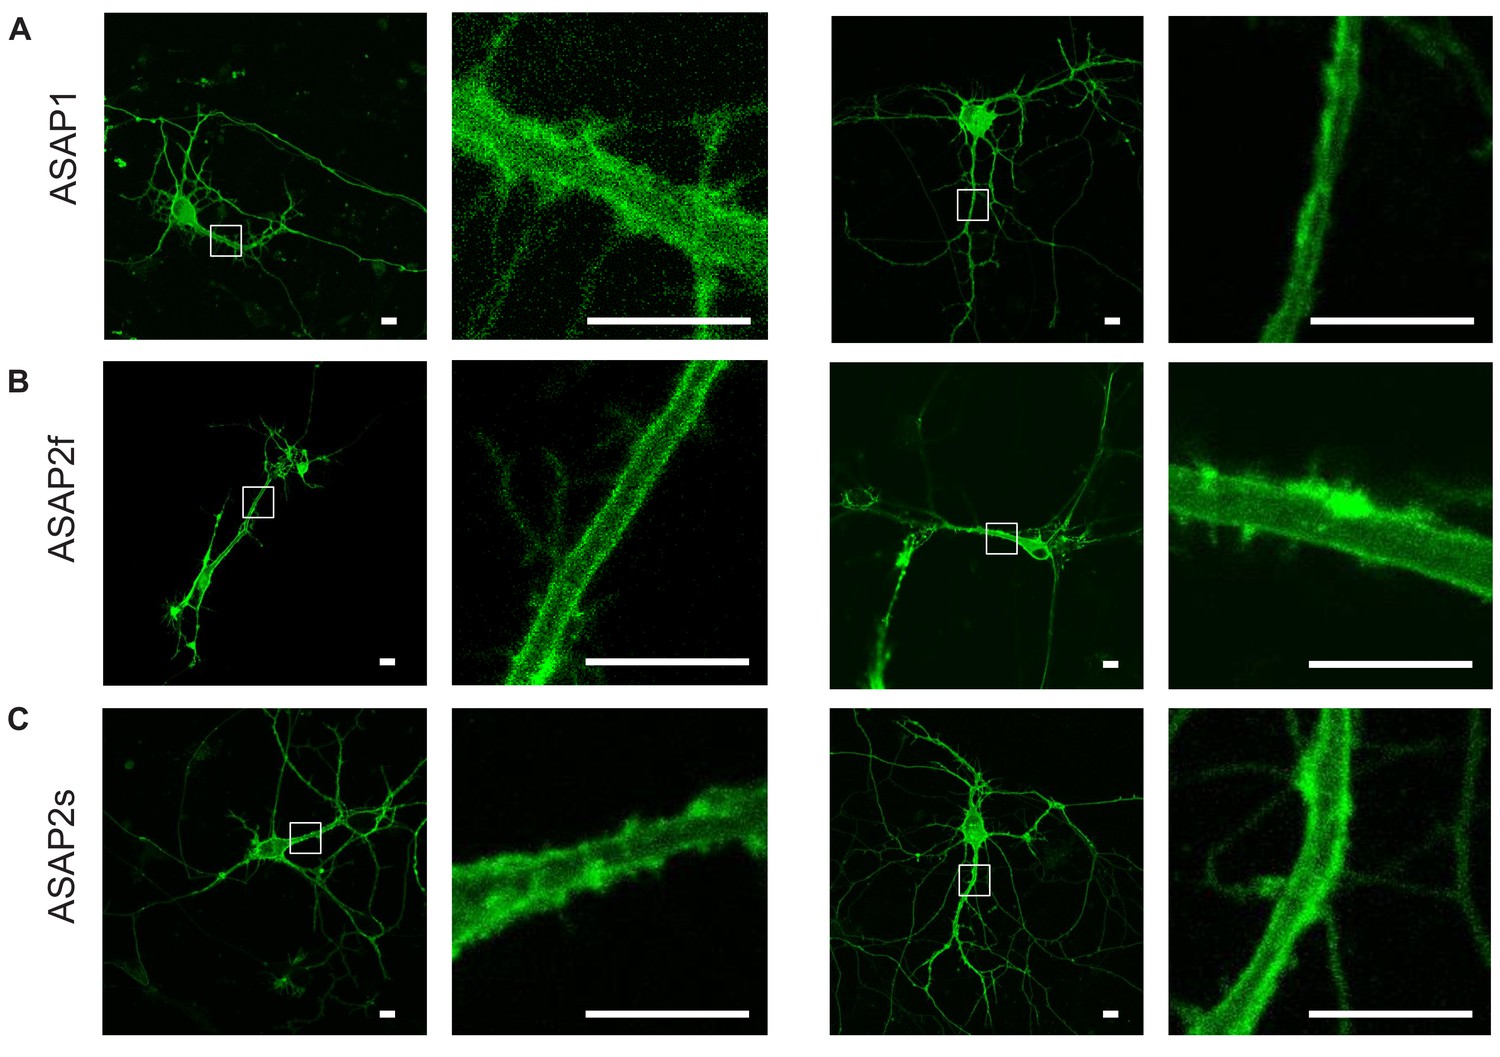
Confocal microscopy images of ASAP1 (A), ASAP2f (B), and ASAP2s (C). For each indicator, images of two representative cells are shown, along with magnified views of the boxed regions. Scale bars, 10 μm.
Figure 2—figure supplement 3
Characterization of ASAP2s in cultured hippocampal neurons.
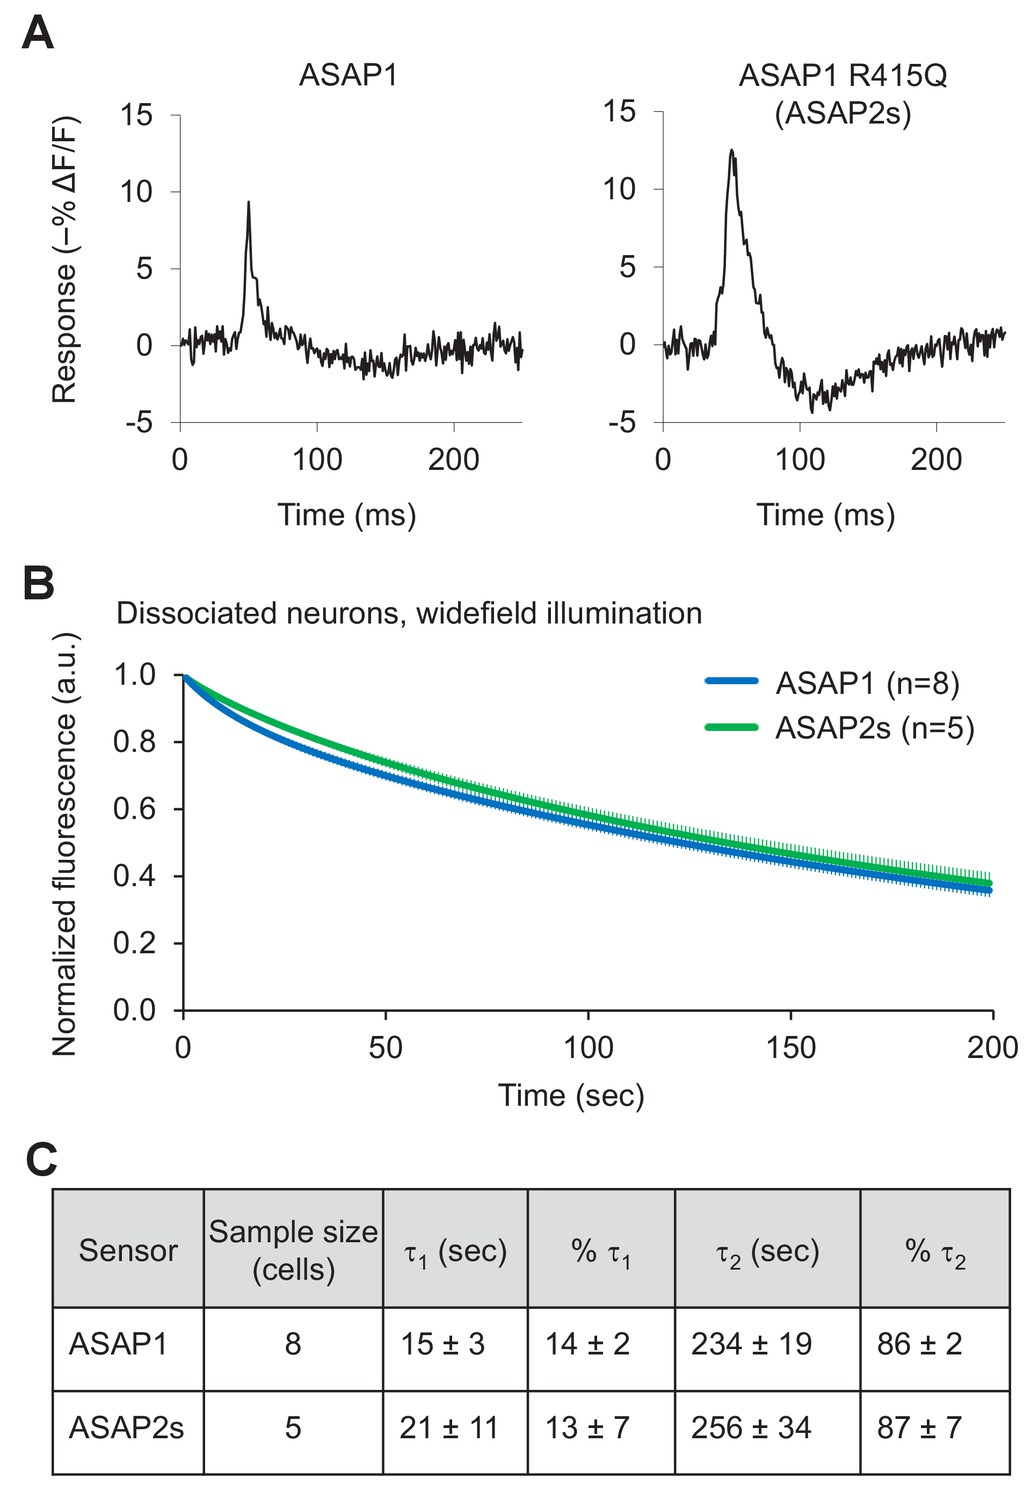
(A) Representative single-trial responses of ASAP1 (left) and ASAP2s (right) to APs in a cultured hippocampal neuron. These responses are from the same experiment as Figure 2H. (B) One-photon photobleaching kinetics in dissociated neurons. Cells expressing a voltage sensor were continuously illuminated with 470- to 490 nm light at 24 mW/mm2 at the sample plane. Fluorescence at 525/25 nm was monitored, normalized to 1.0 at t = 0 and averaged over all cells. The sample size (n) corresponds to individual cells. Error bars are ±1 SEM. (C) Photobleaching time constants for the data in panel B. Values are presented as mean ± 1 SEM.
Figure 3 with 2 supplements
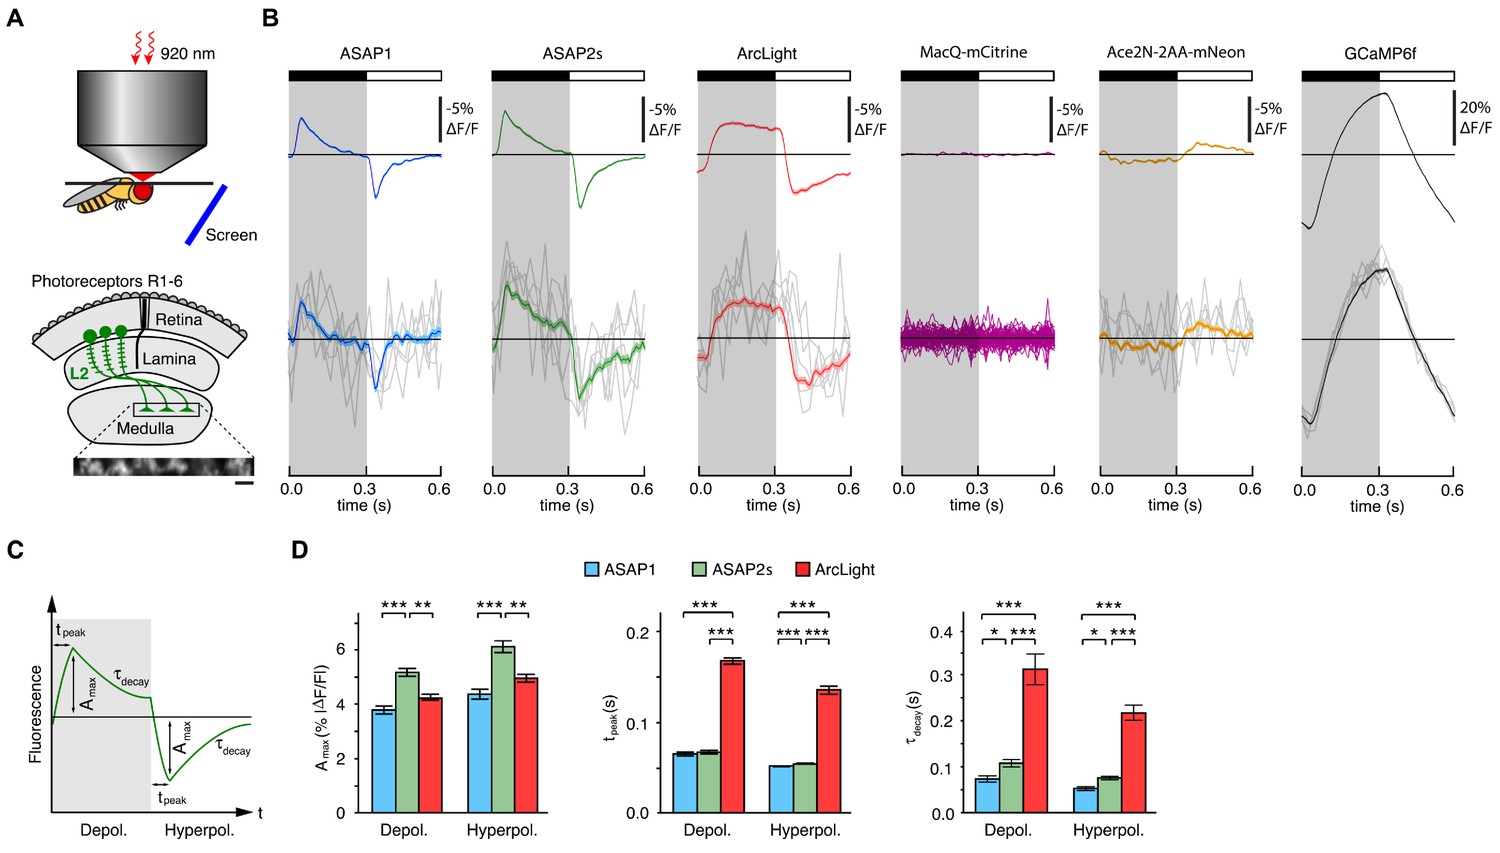
Two-photon imaging of subcellular voltage responses to physiological stimuli in Drosophila.
(A) Schematic illustration of the imaging setup (top) and the fruit fly visual system around L2 cells (bottom). Inset, example of the region imaged, with six L2 terminals expressing ASAP2s. Expression of the other sensors was comparable. Scale bar, 5 μm. (B) L2 responses to alternating 300 ms dark and light flashes, as measured with different indicators. The black bar indicates the dark period and the white bar indicates the light period. Top, mean response across all cells (n = 44 cells from 3 flies for ASAP1, 111 cells from 5 flies for ASAP2s, 65 cells from 5 flies for ArcLight, 64 cells from 3 flies for MacQ-mCitrine, 23 cells from 4 flies for Ace2N-2AA-mNeon, and 232 cells from 10 flies for GCaMP6f). Each cell contributes its average response across 100 trials (one trial = 1 dark flash and one light flash). Horizontal black lines are the mean fluorescence per trial; indicators with slow or asymmetric responses to dark and light flashes can produce traces that do not begin or end at the mean fluorescence. Bottom, for ASAP1, ASAP2s, ArcLight, Ace2N-2AA-mNeon, and GCaMP6f, five exemplar single-trial responses from a single representative L2 cell (gray) and the same cell’s mean response over all trials (colored, n = 100 trials). Solid line is mean; lighter shading is ±1 SEM. Because MacQ-mCitrine didn’t produce an apparent stimulus-evoked response when averaging across all cells (top trace), we plotted the mean optical traces of individual cells (bottom traces) to illustrate that stimulus-evoked responses were also not apparent in any cells. (C) Schematic illustrating the response parameters quantified in panel D. Amax, the maximal amplitude of the fractional fluorescence change (|ΔF/F|); tpeak, the time at which Amax occurs, relative to the start of the flash; τdecay, the time constant of the decay from Amax. (D) For each voltage sensor, Amax, tpeak, and τdecay are plotted for depolarizations (left) and hyperpolarizations (right). Sample sizes are the same as in panel B, except for some measurements of τdecay that did not meet our inclusion criterion (see Materials and methods). Amax and τdecay were analyzed with the t-test, while tpeak was analyzed with the Mann-Whitney U-test. We used the Bonferroni method to correct for multiple pairwise comparisons between ASAP1, ASAP2s, and ArcLight values for a given response parameter (Amax, tpeak, and τdecay) and sign of voltage change (depolarization or hyperpolarization). *p<0.05, **p<0.01, ***p<0.001.
Figure 3—figure supplement 1
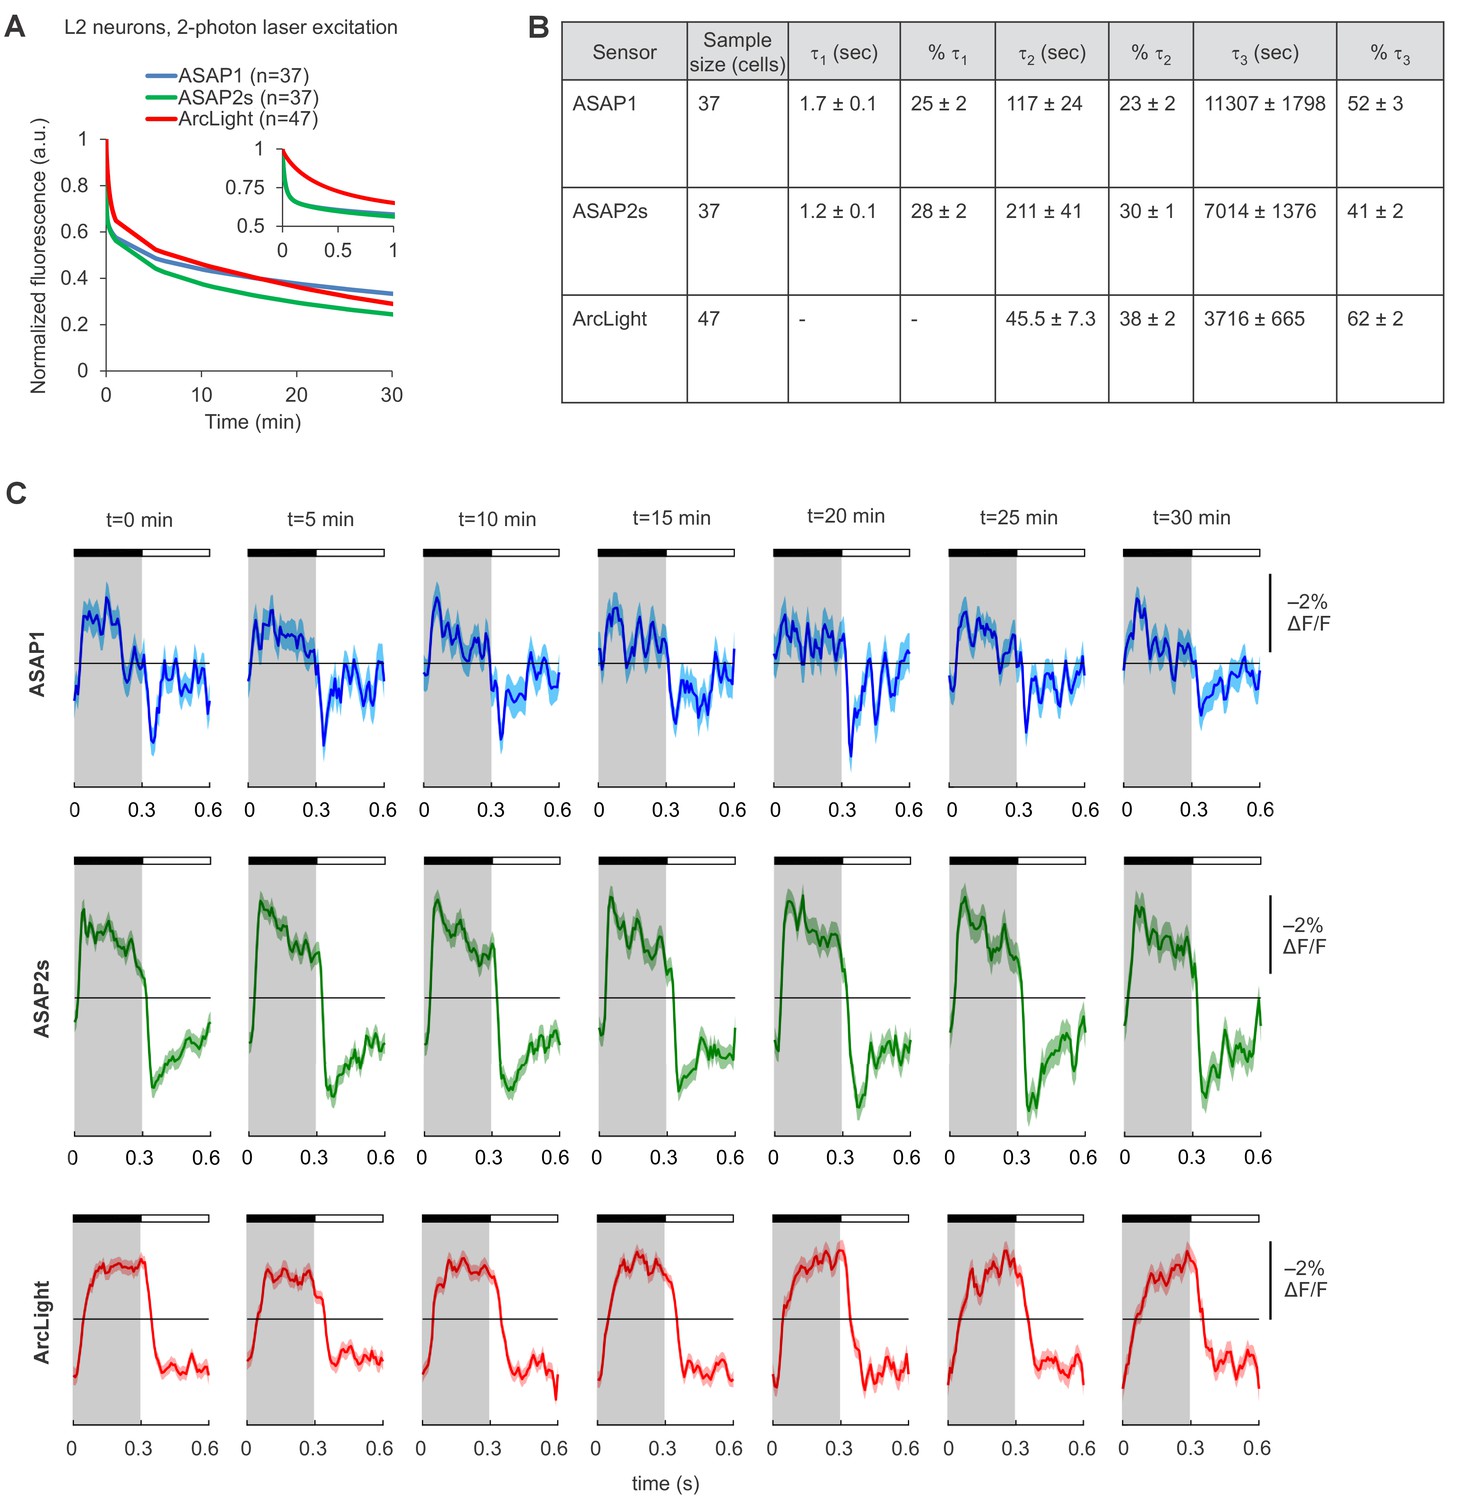
Photostability of ASAP1, ASAP2s, and ArcLight in Drosophila L2 axon terminals under two-photon illumination.
(A) Two-photon photobleaching kinetics. L2 terminals were excited (920 nm, 14 mW) for 30 min at an identical scan rate to the experiments in Figure 3. Illumination was continuous except for 10 s lapses every 5 min due to a software limitation. The recorded fluorescence was normalized to 1.0 at t = 0 and averaged over all cells. The sample size (n) corresponds to individual cells. The absolute magnitude of the SEMs are small (≤0.02). The inset is a magnification of the data over the first minute of photobleaching. In that inset, the ASAP1 and ASAP2s traces strongly overlap. (B) Photobleaching time constants for the data in panel A. Values are presented as mean ± 1 SEM. (C) ASAP1, ASAP2s, and ArcLight can report L2 responses to alternating 300 ms-long dark and light flashes over 30 min of continuous illumination. For each sensor, we show the mean responses from a representative L2 axon terminal over one-minute segments at the indicated time from the start of illumination. The black bar indicates the dark period and the white bar indicates the light period. Illumination conditions were identical to those used in panel A and Figure 3. Lighter shading is ±1 SEM.
Figure 3—figure supplement 2
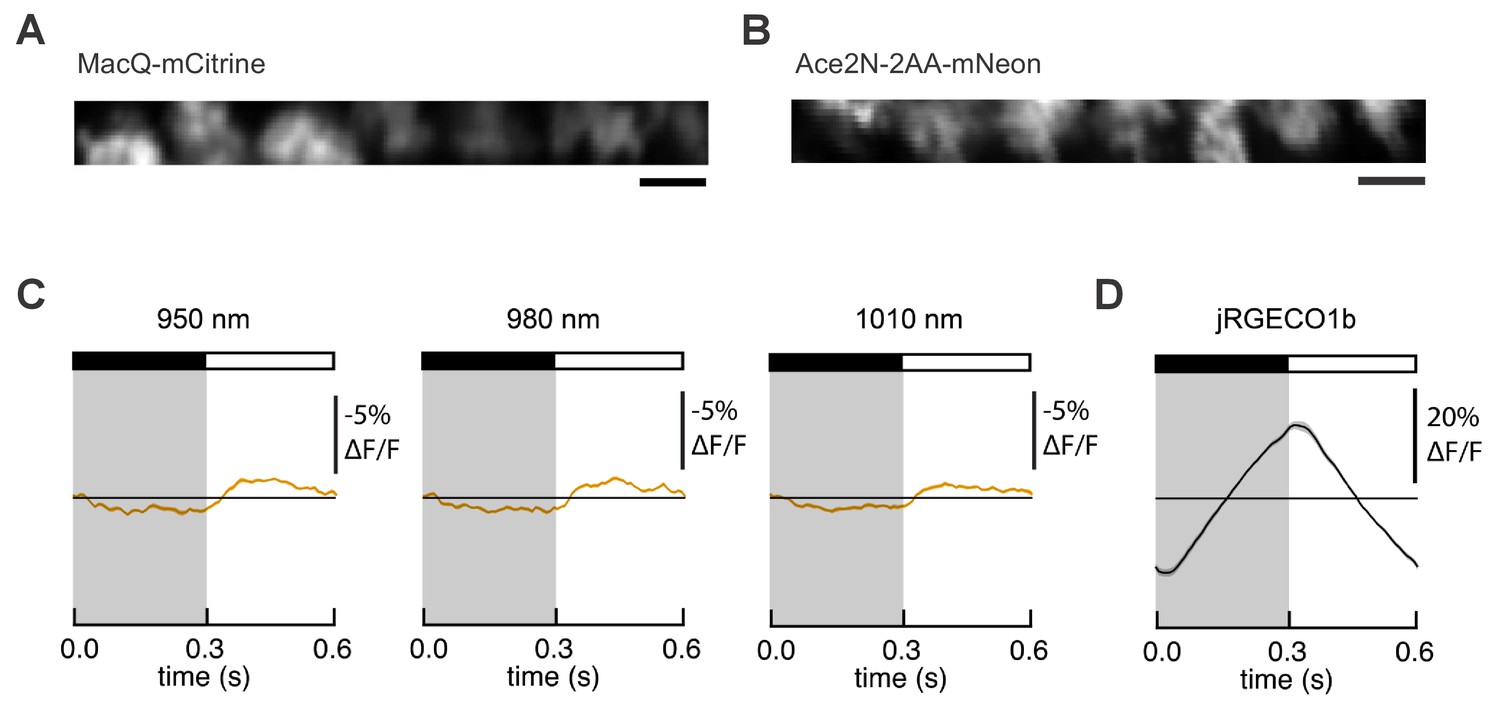
Expression and responses of FRET-opsin voltage indicators in Drosophila L2 axon terminals.
MacQ-mCitrine (A) and Ace2N-2AA-mNeon (B) are expressed in L2 axon terminals and visible under two-photon illumination. Imaging conditions were identical to those used in Figure 3B. Scale bar, 5 μm. (C) L2 responses to alternating 300 ms dark and light flashes, as measured with Ace2N-2AA-mNeon with different excitation wavelengths. The black bar indicates the dark period and the white bar indicates the light period. The mean response across all cells is plotted. Each cell contributes its average response across 100 trials (one trial = 1 dark flash and one light flash). Solid line is mean; lighter shading is ±1 SEM, but is small and therefore not easily visible from the graph. The same cells were used for each panel and for Figure 3B (n = 23 cells from four flies). (D) L2 responses as measured with the red calcium indicator jRGECO1b, which was co-expressed with Ace2N-2AA-mNeon. The excitation wavelength was 1050 nm, and the emission filter was 585/40 nm.
Figure 4 with 4 supplements
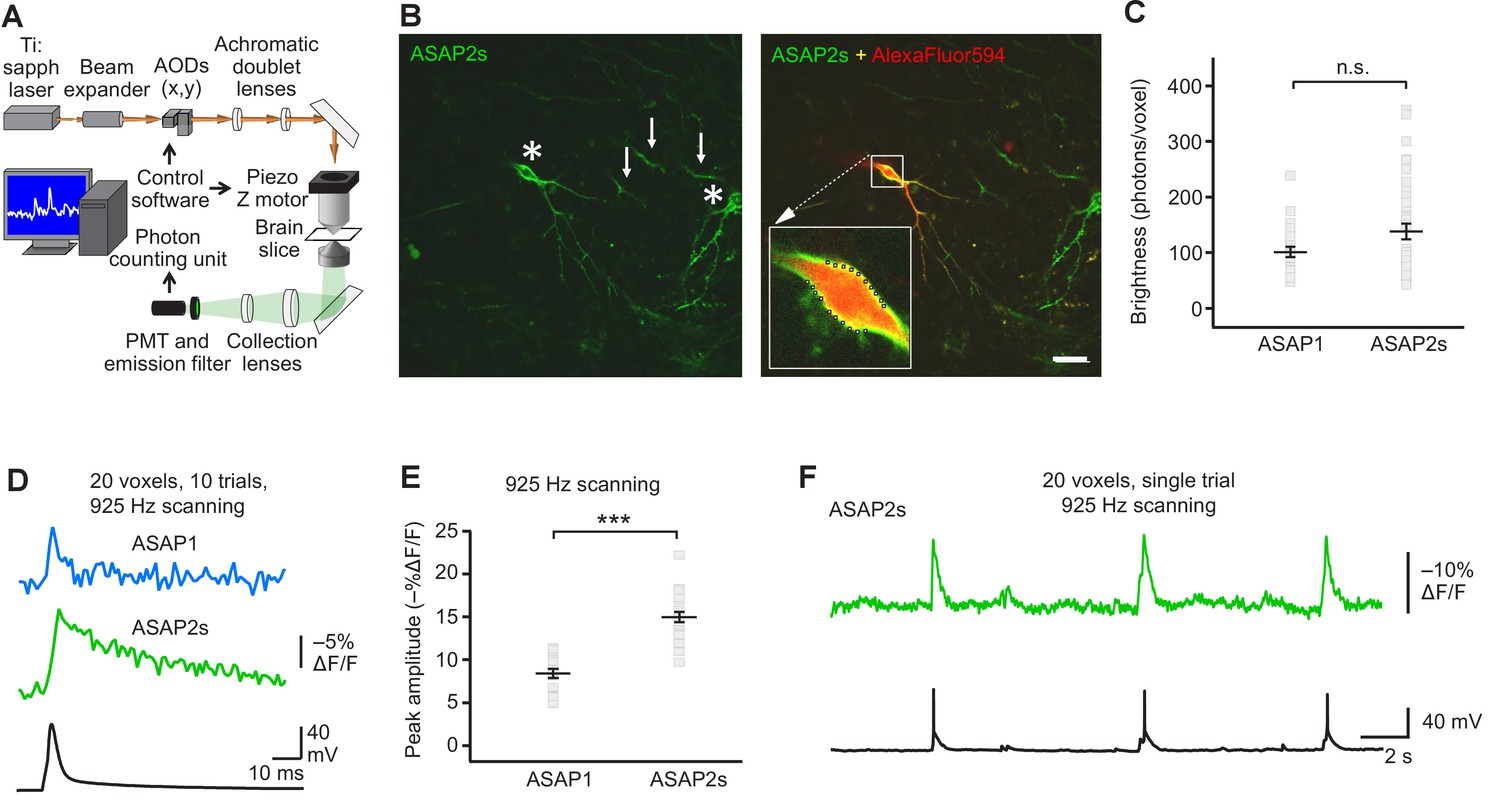
FEVIR: fast random-access two-photon imaging of GEVI responses in organotypic hippocampal slice cultures.
(A) Schematic of our random-access multi-photon (RAMP) imaging system. (B) Representative two-photon single-plane image of ASAP2s-expressing neurons in an organotypic hippocampal slice culture. Left, two neurons can be seen (asterisks), together with processes belonging to ASAP2s-expressing neurons in different planes (arrows). Right, overlay of ASAP2s and AlexaFluor594 fluorescence identifies the neuron recorded in whole-cell configuration. Inset shows how 20 individual voxels (squares) can be selected along the plasma membrane when imaging at 925 Hz. Scale bar, 20 μm. (C) Mean number of photons emitted per voxel during a 50 μs exposure (n = 23 neurons for ASAP1, n = 40 for ASAP2s). Data obtained at a holding potential of –70 mV. Individual neurons are shown as gray squares. Black horizontal bars are the means, and error bars are the SEM (p>0.05, Mann-Whitney U-test). (D) Representative ASAP2s and ASAP1 responses to a single current-evoked AP (black trace). Optical recordings were acquired at 925 Hz with 20 voxels per neuron. Traces are the average of 10 trials. (E) Peak response amplitudes at the soma induced by single current-triggered APs were significantly larger with ASAP2s (n = 17 neurons for ASAP1, n = 23 for ASAP2s, ***p<0.001, t-test). Each data point (gray squares) corresponds to the mean response amplitude to 10 APs per neuron. Black horizontal bars are the means, and error bars are the SEM. (F) Representative single-trial ASAP2s response to spontaneous APs. The voltage trace (bottom) was obtained by simultaneous patch clamping.
Figure 4—figure supplement 1
Plasma membrane excitability of the ASAP indicators.
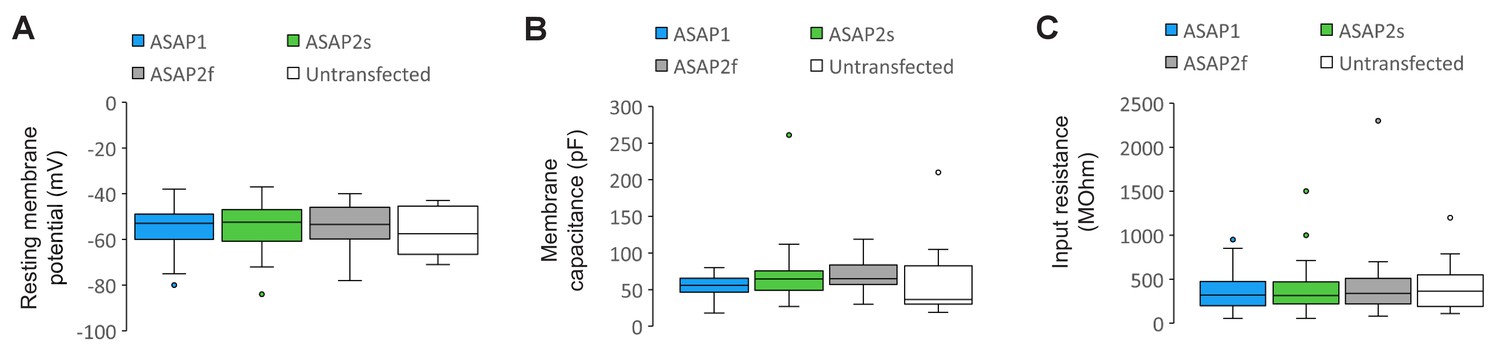
(A–C) Box and whisker plots of the resting membrane potential (A), membrane capacitance (B), and input resistance (C) of neurons expressing ASAP1 and ASAP2s in organotypic hippocampal slice cultures. All values are statistically indistinguishable from those of untransfected neurons (p>0.05, Mann-Whitney U-test with Bonferroni correction for multiple comparisons). The bottom and top of each box correspond to the first and third quartile, respectively. When the number of data points (neurons) was odd, quartiles were calculated excluding the median value. The midline inside each box is the median. Circles are outliers, defined as datapoints greater than 1.5-fold the interquartile range less than the first quartile or greater than the third quartile. Error bars (‘whiskers’) correspond to the range of data in the first and last quartile, excluding outliers. n = 23 neurons for ASAP1, 56 for ASAP2s, 24 for ASAP2f, and 16 untransfected cells.
Figure 4—figure supplement 2
Detecting spontaneous APs using ASAP2s.
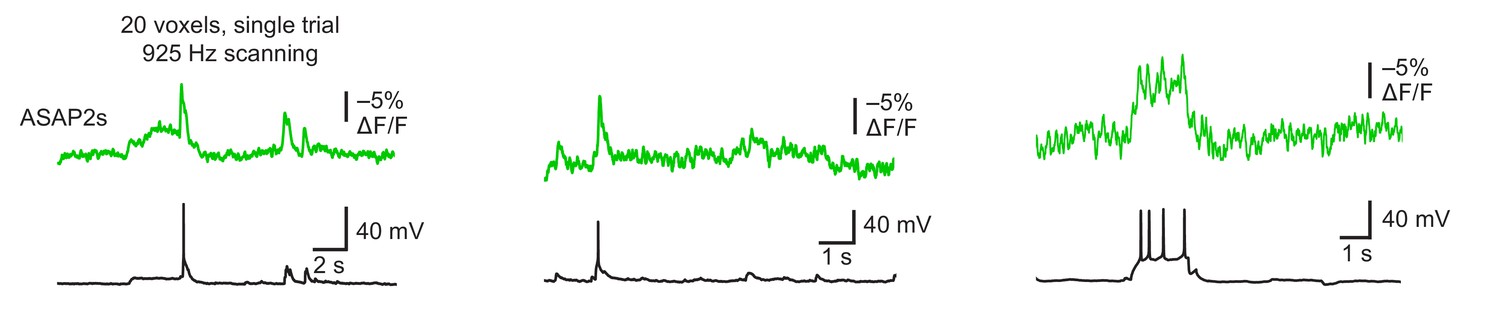
Representative single-trial ASAP2s responses to spontaneous APs inorganotypic hippocampal slice cultures imaged at 925 Hz by RAMP microscopy. Twenty voxels were imaged per neuron. Voltage traces were simultaneously obtained by patch clamping. Each example is from a different cell.
Figure 4—figure supplement 3
Detecting evoked APs using ASAP2f.
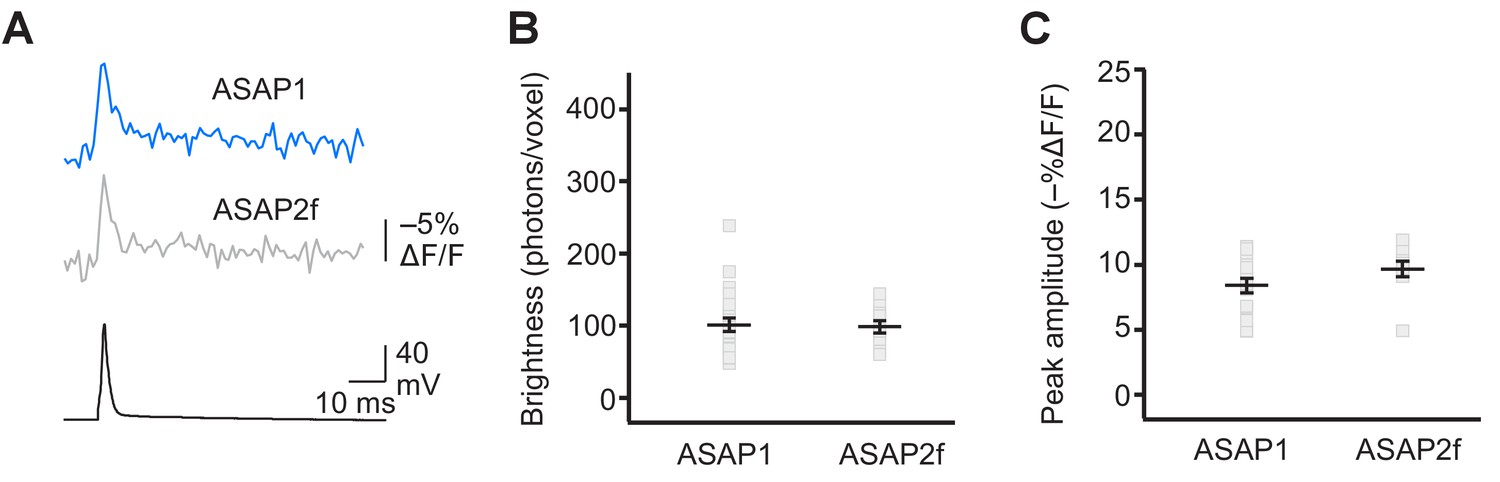
(A) Representative ASAP1 and ASAP2f responses to a single current-evoked AP (black trace). Optical recordings were acquired at 925 Hz with 20 voxels per neuron. Traces are the average of 10 trials. (B) Mean number of photons emitted per voxel during a 50 μs exposure (n = 23 neurons for ASAP1 and n = 10 for ASAP2f). Data obtained at a holding potential of –70 mV. Individual neurons are shown as gray squares. Black horizontal bars are the means, and error bars are the SEM. (C) Peak response amplitudes to single current-triggered APs. Each data point (gray squares) corresponds to the mean response amplitude to 10 APs per neuron. n = 23 neurons for ASAP1 and n = 10 for ASAP2f. Black horizontal bars are the means, and error bars are the SEM. Data shown for ASAP1 in B and C is the same data shown in Figure 4C and E, respectively.
Figure 4—figure supplement 4
Plasma membrane localization and RAMP imaging of Ace2N-4AA-mNeon in organotypic hippocampal slice cultures.
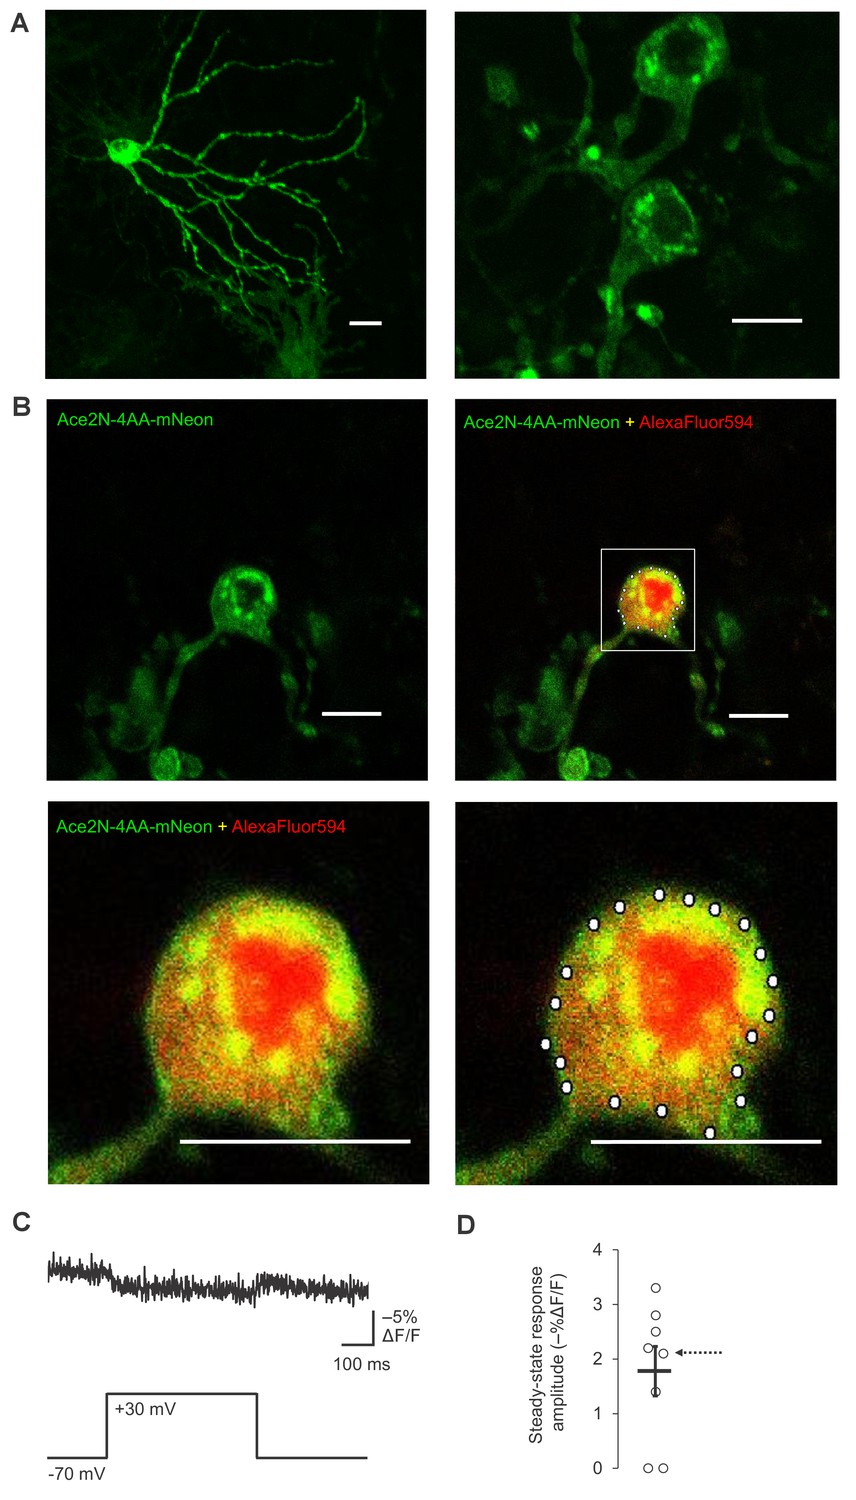
(A) Two-photon images of two representative neurons expressing Ace2N-4AA-mNeon, displayed as maximal intensity Z-projections. Scale bar, 20 μm. (B) Representative two-photon single-plane image of a neuron expressing Ace2N-4AA-mNeon (top row, left). Overlay image of Ace2N-4AA-mNeon and AlexaFluor594 fluorescence are also shown (top row, right; magnified image: bottom row, left). The bottom right image shows the 20 voxels selected for RAMP imaging experiments with this neuron. Scale bar, 20 μm. (C) Fluorescence responses from a representative neuron to a 100 mV step depolarization. The data corresponds to the neuron shown in panel B. The trace was averaged over all 20 voxels and over 10 trials. (D) Steady-state fluorescence responses to a 100 mV step depolarization from n = 8 neurons expressing Ace2N-4AA-mNeon. The arrow points to the data collected from the neuron imaged in panels B and C. Black horizontal bars are the means, and error bars are the SEM.
Figure 5
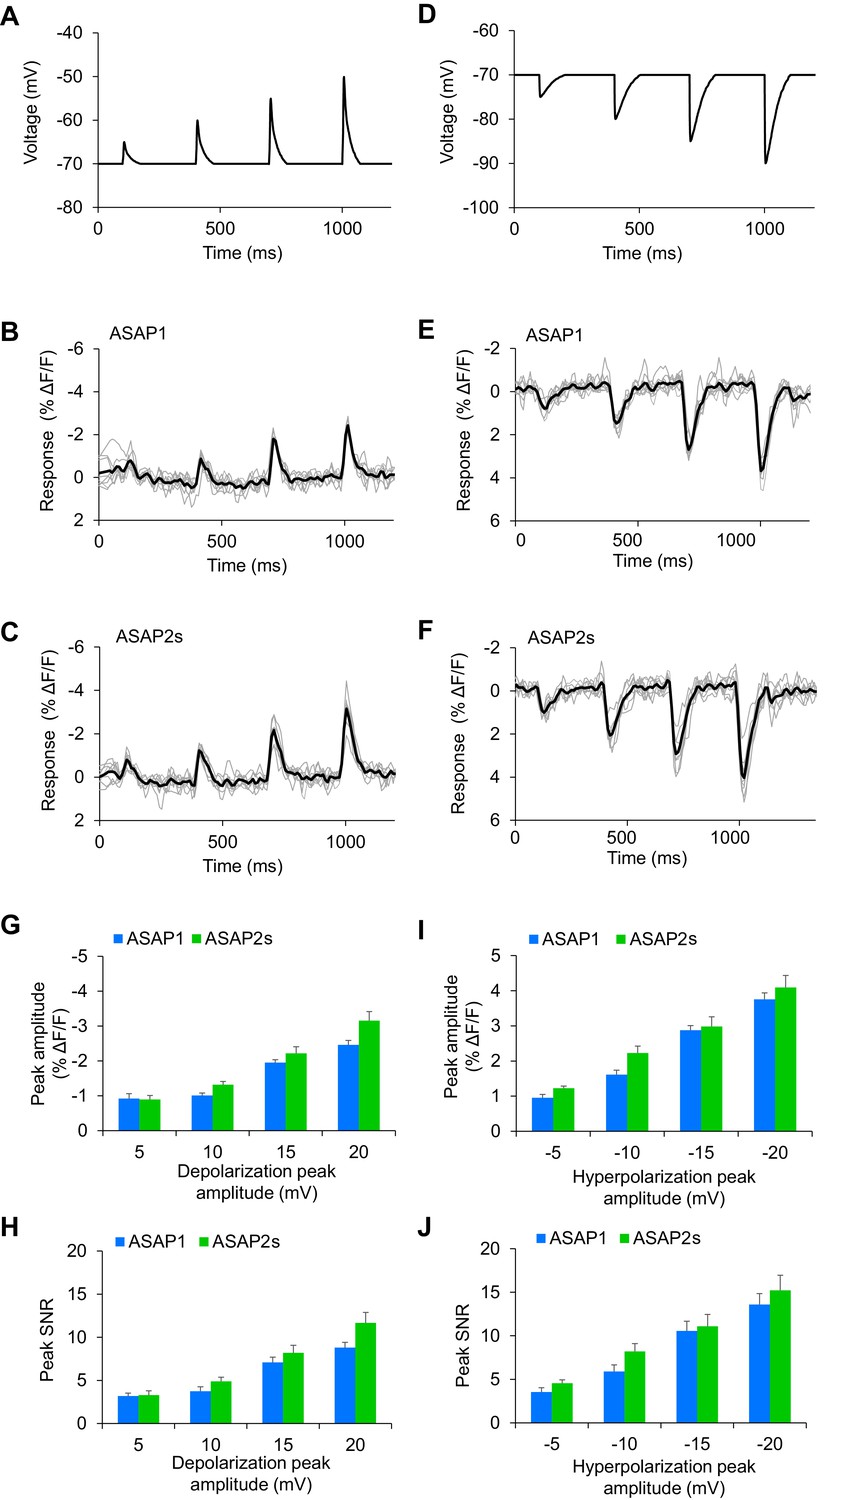
Detecting subthreshold depolarizations and hyperpolarizations in single trials.
(A–F) ASAP1 and ASAP2s can detect subthreshold potential and hyperpolarization waveforms in single trials in organotypic hippocampal slice cultures. Optical recordings were acquired at 462 Hz. (A) Subthreshold depolarization waveforms had peak amplitudes of 5, 10, 15, and 20 mV; a time-to-peak of 8 ms; and full width at half maximum of 14.5 ms. (B,C) Responses to subthreshold depolarization waveforms using ASAP1 (B) and ASAP2s (C). The mean response is shown in black, and single-trial responses are in gray (n = 8 neurons per indicator). (D) Hyperpolarization waveforms had peak amplitudes of −5,–10, −15, and −20 mV; a time-to-peak of 5 ms; and full width at half maximum of 39 ms. (E,F) Responses to hyperpolarization waveforms using ASAP1 (E) and ASAP2s (F). The mean response is shown in black, and single-trial responses are in gray (n = 8 neurons per indicator). For panels B,C,E,F, raw traces were smoothed with a window size of 10 time points. (G,H) Quantification of the fluorescence response amplitudes (G) and SNR (H) to subthreshold depolarizations. (I,J) Quantification of the fluorescence response amplitudes (I) and SNR (J) to hyperpolarizations. Differences in peak fluorescence responses and SNR between ASAP1 and ASAP2s were not statistically significant (p>0.05, t-test with Bonferroni correction for multiple comparisons).
Figure 6 with 2 supplements
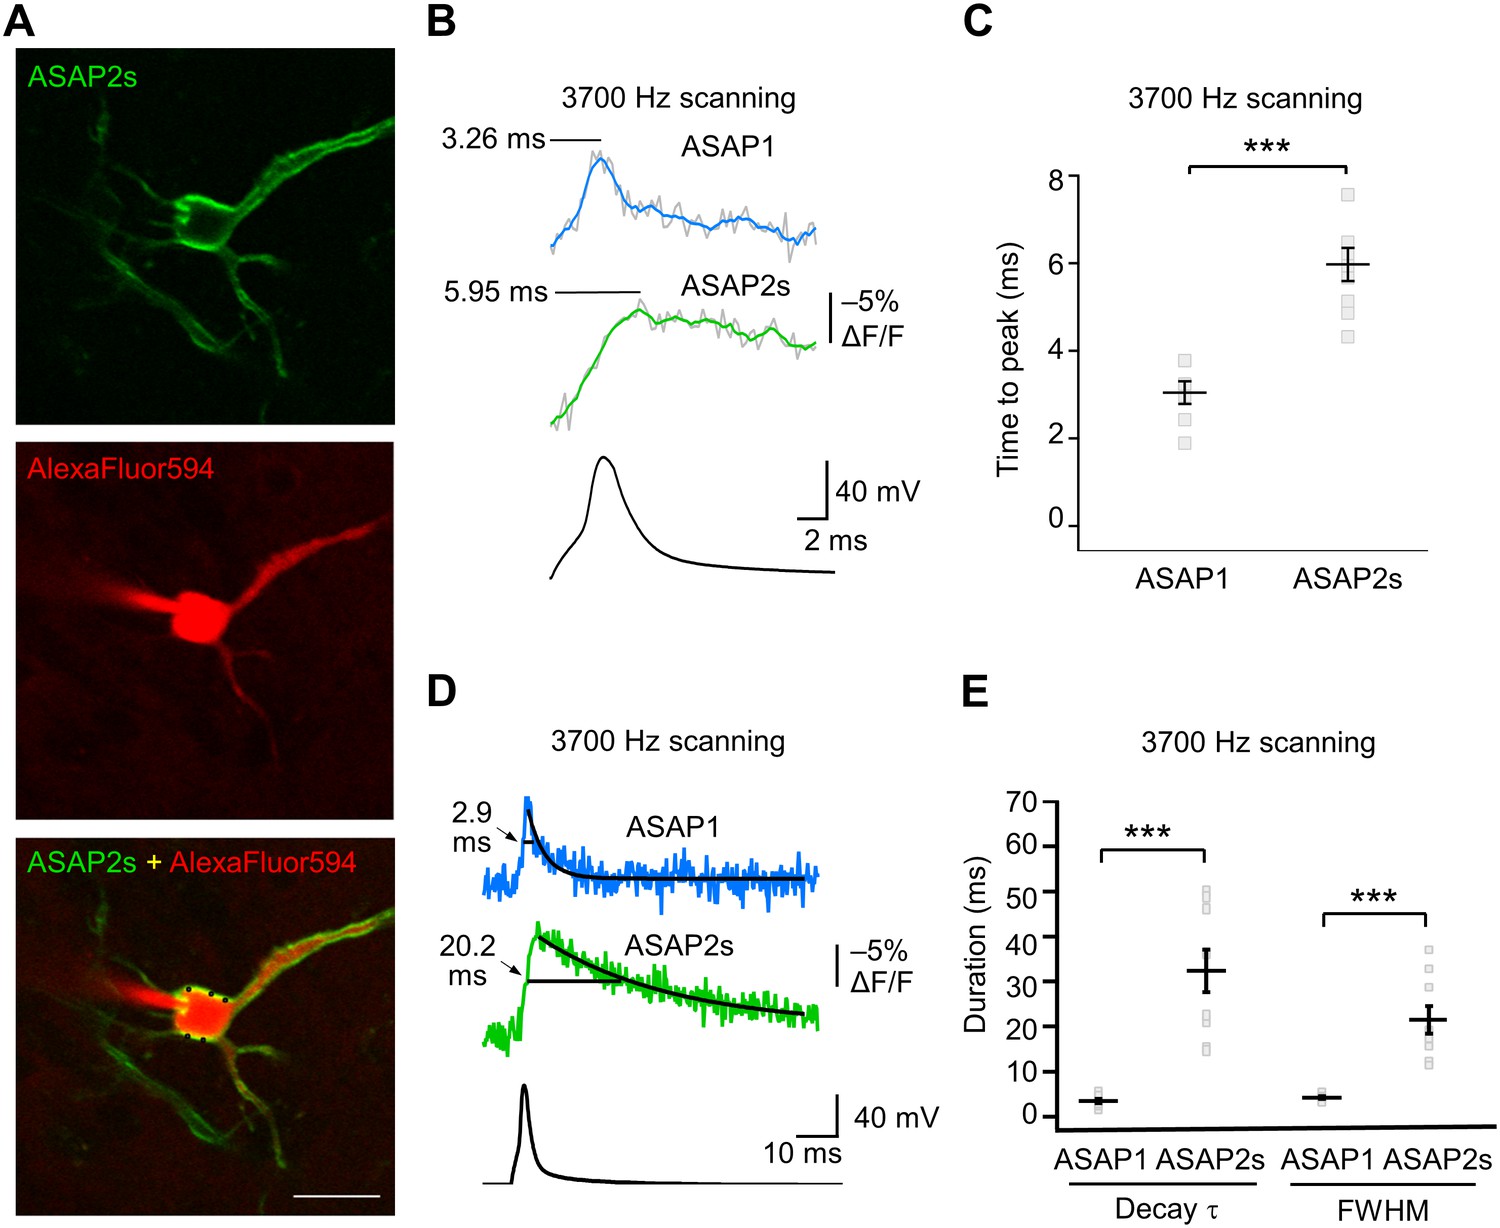
GEVI response kinetics to action potentials in organotypic hippocampal slice culture.
(A) ASAP2s and AlexaFluor594 fluorescence from a representative neuron. Overlay shows the five positions (black squares) selected for imaging at 3700 Hz. Scale bar, 20 μm. (B) Representative ASAP1 and ASAP2s responses to current-triggered APs. The indicated time values correspond to the time of the peak response from the beginning of the AP. Optical recordings were acquired at 3700 Hz with five voxels per neuron. The mean of 10 traces is shown (gray trace) along with a five-point moving average (colored traces). The electrophysiological trace was obtained from the same neuron as the ASAP1 optical trace. (C) Time-to-peak measured with ASAP1 and ASAP2s (n = 9 neurons for ASAP1, n = 7 for ASAP2s). Black horizontal bars are the means, and error bars are the SEM. ***p<0.001 (t-test). (D) Optical spike width (full width at half maximum) of representative ASAP1 and ASAP2s responses to current-triggered APs. The traces are from panel B and shown here over a longer time scale. Decay time constants (τ) were obtained from single-exponential fits. (E) Mean decay time constants (τ) and full width at half maximum (FWHM) of ASAP2s and ASAP1 responses to action potentials. n = 7 neurons for ASAP1, n = 9 for ASAP2, ***p<0.001 (t-test).
Figure 6—figure supplement 1
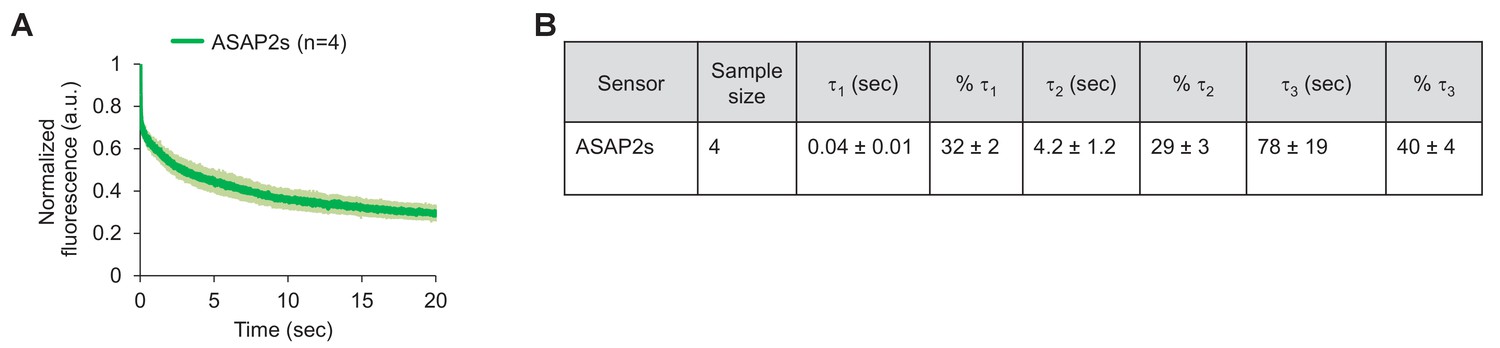
Photostability of ASAP2s imaged by RAMP microscopy.
(A) ASAP2s-expressing cells in an organotypic hippocampal slice culture were illuminated with a Ti:sapphire laser tuned to 900 nm and set to a power level of 25 mW at the sample plane. Each pixel was sampled at 463 Hz with a dwell time of 50 μs. Cells were imaged with a 25 × 0.95 NA objective. Fluorescence was normalized to 1.0 at t = 0 and averaged over all cells. Lighter shading is ±1 SEM. The sample size (n) corresponds to individual neurons. (B) Photobleaching time constants for the data in panel A. Values are presented as mean ± 1 SEM.
Figure 6—figure supplement 2
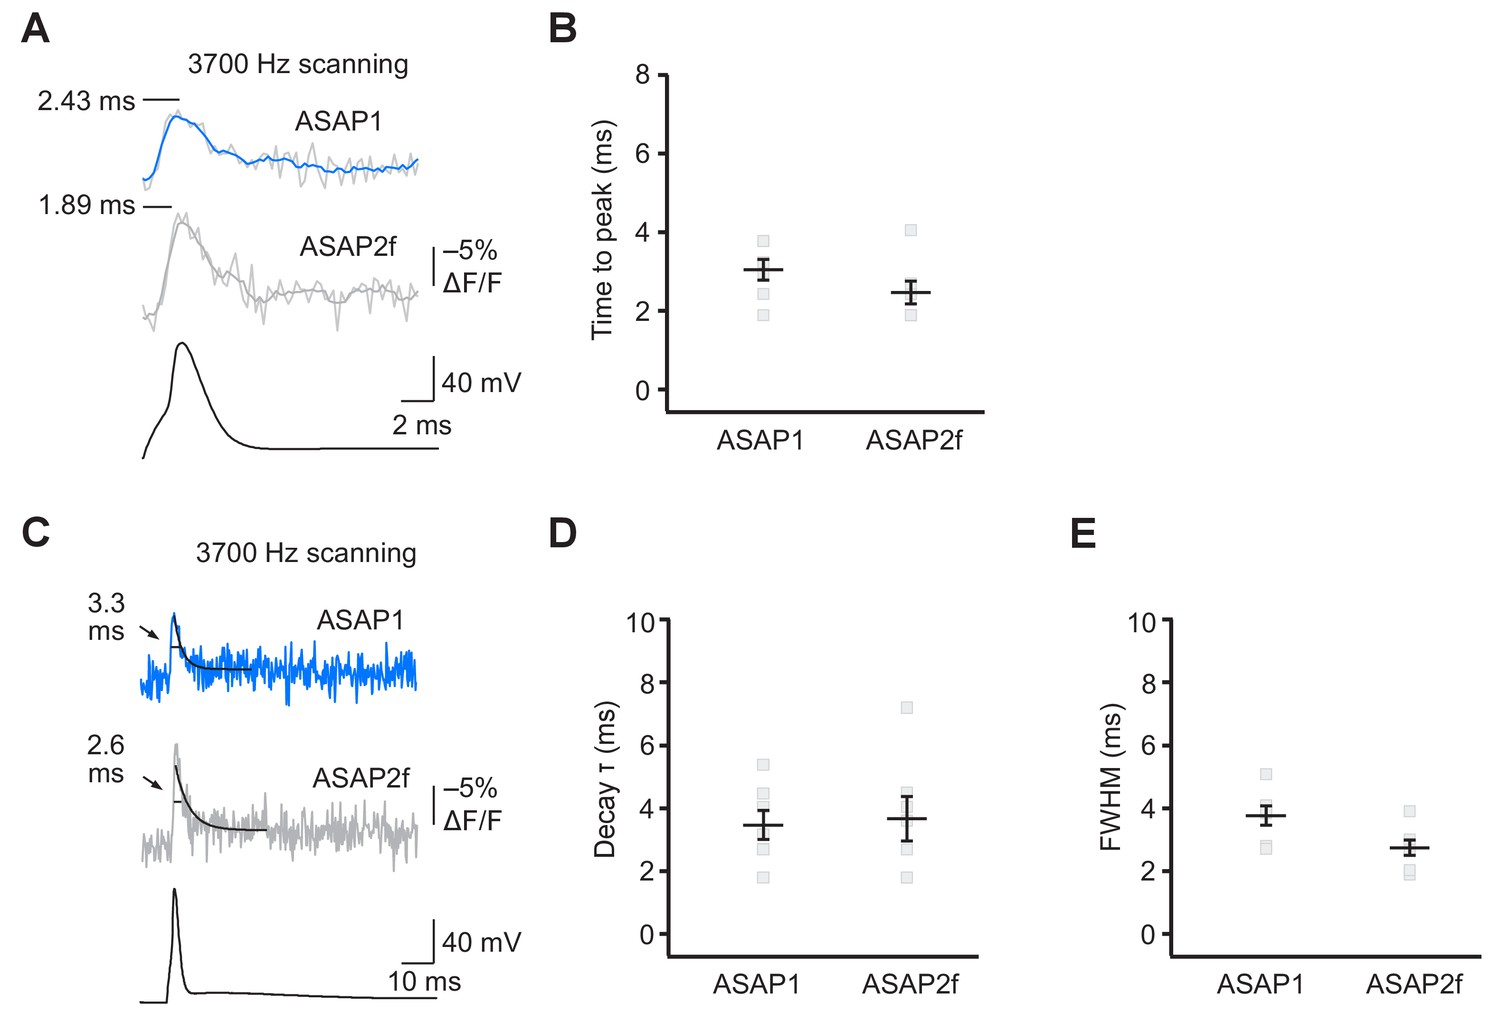
ASAP2f and ASAP1 report APs in organotypic hippocampal slice cultures with similar kinetics.
(A) Representative optical responses of ASAP1 and ASAP2f to a single current-evoked AP. The AP voltage trace corresponds to the ASAP2f trace. For each neuron, 10 trials were conducted, each imaging 5 voxels at 3700 Hz. Raw and five point-box smoothed traces are overlaid. The black horizontal bar illustrates the measurement of the time to peak. (B) Time to peak of ASAP1 and ASAP2f. Individual gray squares correspond to single neurons. Black horizontal bars are the means, and error bars are the SEM. (n = 7 neurons per GEVI). (C) The traces from panel A are shown over a longer time scale. Measurements of the full width at half maximum (FWHM) are indicated. Single-exponential fits to fluorescence decay are also shown (black lines). (D,E) Decay time constants (panel D) and FWHM (panel E) of ASAP1 and ASAP2f. Decay time constants (τ) were obtained from single-exponential fits. Gray squares show individual neurons. Black horizontal bars are the means, and error bars are the SEM. n = 7 neurons per GEVI. The ASAP1 data in this figure is also shown in Figure 6.
Figure 7 with 1 supplement
Dependence of action potential detection on scanning frequency.
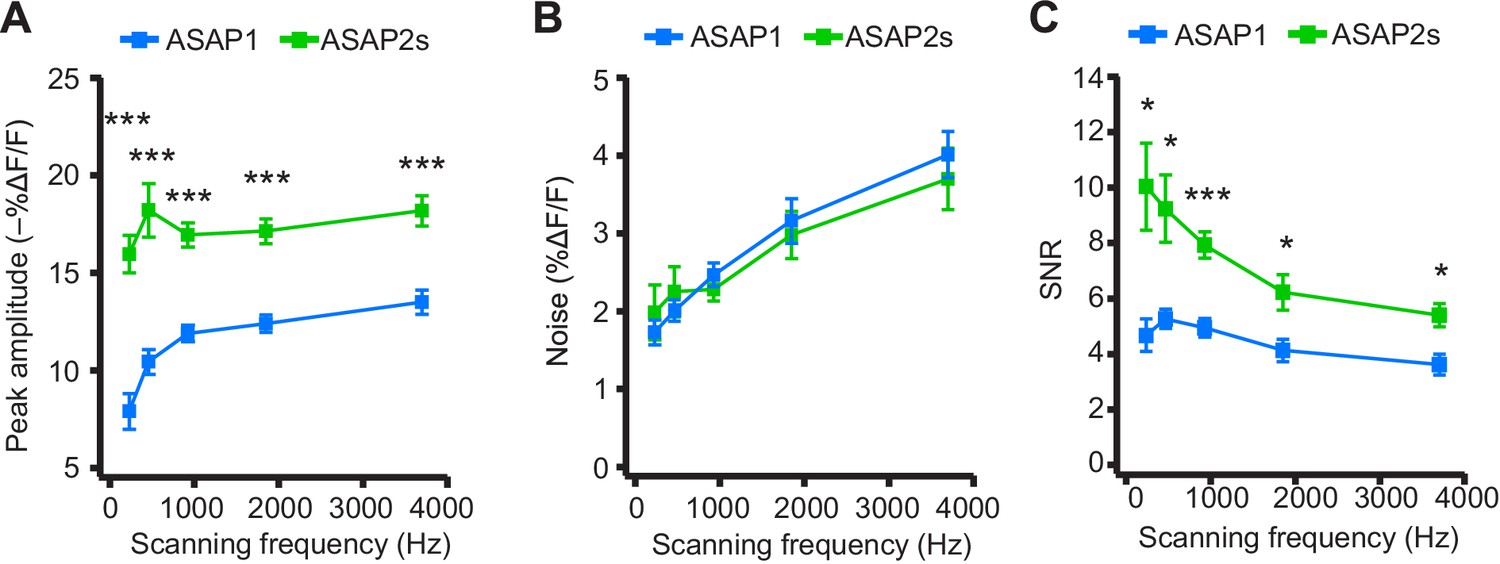
(A) Peak amplitude of current-evoked APs as a function of the scanning frequency for ASAP2s and ASAP1 in single trials. Voxel dwell time was kept constant at 50 μs, and the number of voxels scanned was maximized at each frequency: 5 voxels at 3700 Hz, 10 at 1850 Hz, 20 at 925 Hz, 40 at 462 Hz, and 80 at 231 Hz. For ASAP1 and ASAP2s, respectively, sample sizes at each frequency are as follows: 231 Hz, n = 8 and 9 neurons; 462 Hz, n = 7 and 9, 925 Hz, n = 8 and 22; 1850 Hz, n = 7 and 9; 3700 Hz, n = 6 and 14. All comparisons are between ASAP1 and ASAP2s. ***p<0.001 (t-test with Holm-Bonferroni correction for multiple comparisons). Symbols indicate the mean and error bars show the SEM. (B) Noise, defined as the standard deviation of baseline fluorescence, as a function of the scanning frequency in single trials. Sample sizes are the same as in panel A. All comparisons are between ASAP1 and ASAP2s. No significant difference observed between ASAP2s and ASAP1 (Mann-Whitney U-test with Holm-Bonferroni correction for multiple comparisons). Symbols indicate the mean and error bars show the SEM. (C) The signal-to-noise ratio (SNR) of single-trial optical responses to current-triggered APs was higher for ASAP2s than ASAP1 at all scanning frequencies. The SNR was calculated as the peak amplitude of optical transients divided by the standard deviation of baseline fluorescence. Sample sizes are the same as in panel A. *p<0.05, ***p<0.001 (t-test with Holm-Bonferroni correction for multiple comparisons). Symbols indicate the mean and error bars show the SEM.
Figure 7—figure supplement 1
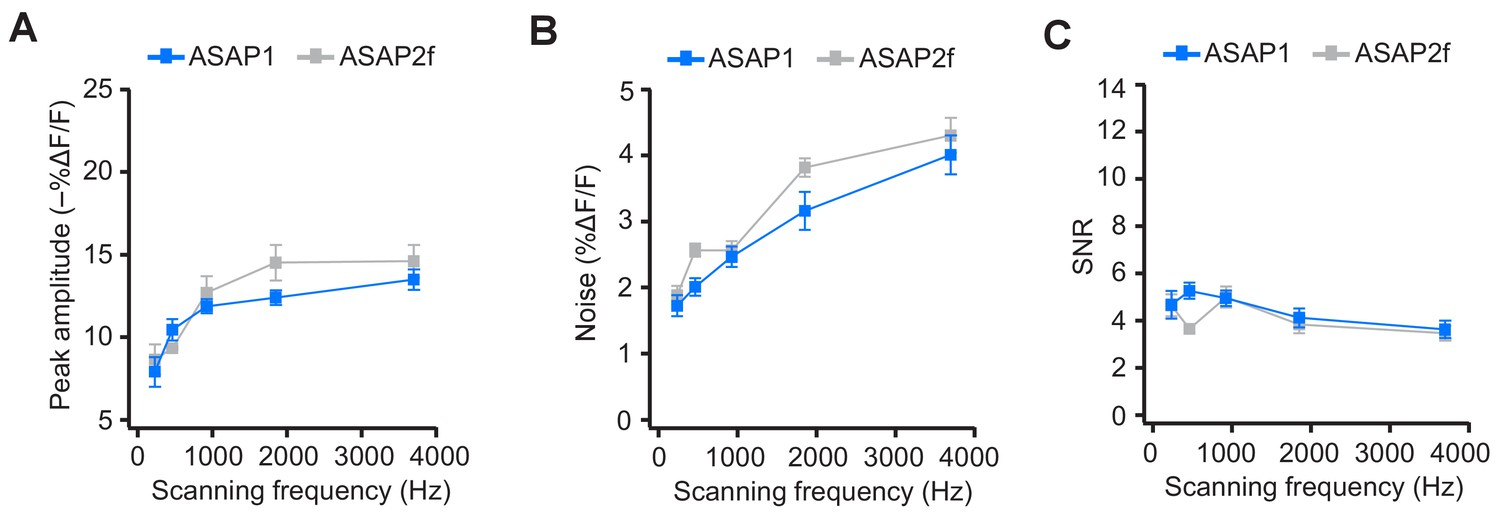
ASAP2f and ASAP1 exhibit a similar dependence on scanning frequency for AP detection.
(A) Peak amplitude of current-evoked APs as a function of scanning frequency for ASAP1 and ASAP2f in single trials. Both ASAP1 and ASAP2f show a similar pattern with a drop in the amplitude for slower scanning frequencies. This is due to the fact that slow scanning frequencies cannot fully capture the fast time courses of ASAP1 and ASAP2f. Experiments were performed as in Figure 7A, where the dwell time per pixel was kept constant at 50 μs and the number of voxels was maximized at each frequency For ASAP1 and ASAP2f, respectively, sample sizes at each frequency are as follows: 231 Hz, n = 8 and 6 neurons; 462 Hz, n = 7 and 4; 925 Hz, n = 8 and 9; 1850 Hz, n = 7 and 4; 3700 Hz, n = 6 and 8. Symbols indicate the mean and error bars show the SEM. (B) Noise, defined as the standard deviation of baseline fluorescence, as a function of the scanning frequency in single trials. Symbols indicate the mean and error bars show the SEM. Sample sizes are as in panel A. (C) Signal-to-noise ratio (SNR) of single-trial optical responses to current-evoked APs as a function of scanning frequency for ASAP1 and ASAP2f. The SNR was calculated as the peak amplitude of optical transients divided by the standard deviation of baseline fluorescence. Symbols indicate the mean and error bars show the SEM. Sample sizes are as in panel A. The ASAP1 data in this figure is also shown in Figure 7.
Figure 8 with 2 supplements
Detecting individual spikes in trains of action potentials.
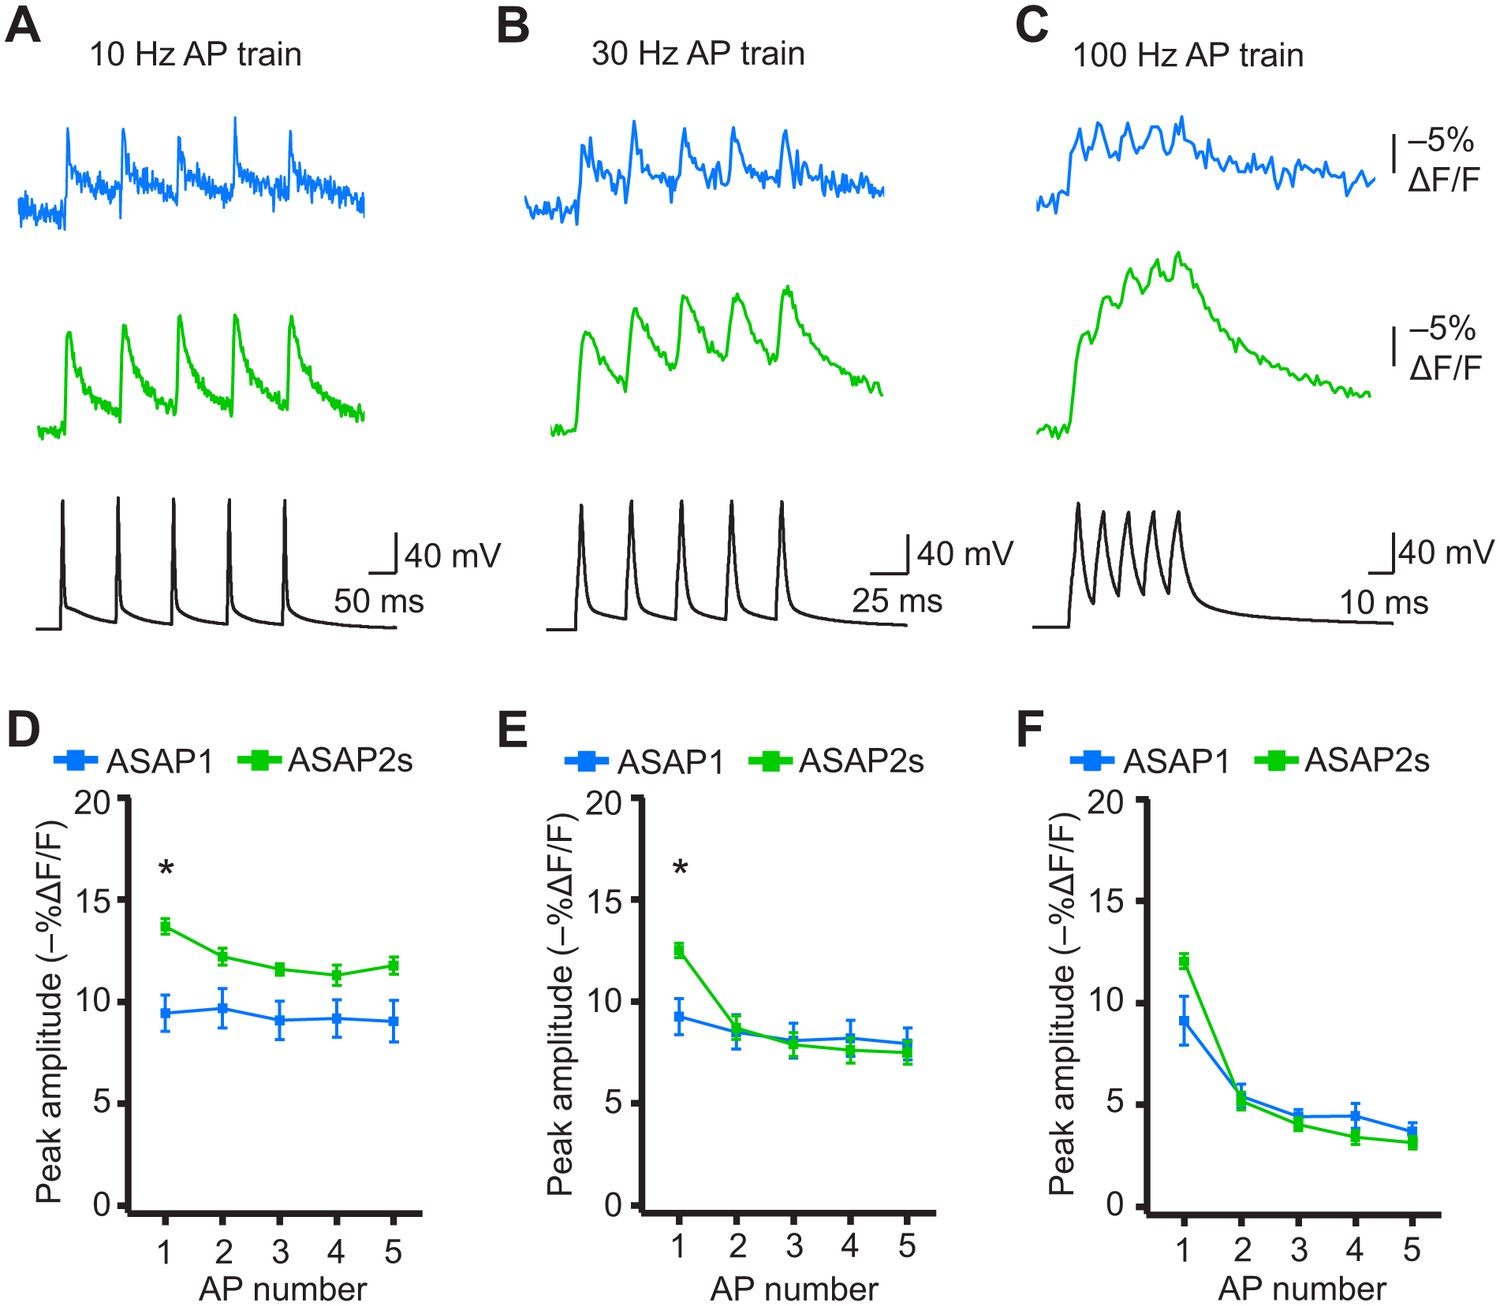
(A–C) Representative responses to trains of five APs were evoked by current injection at 10 Hz (A), 30 Hz (B), or 100 Hz (C) in organotypic hippocampal slice cultures. Optical recordings were acquired at 925 Hz with 20 voxels per neuron. Traces are the average of 10 trials and were corrected for photobleaching. Blue, ASAP1; green, ASAP2s. (D–F) Peak amplitude of ASAP1 and ASAP2s responses to each spike of a train of five APs evoked at 10 Hz (D), 30 Hz (E), and 100 Hz (F) with n = 7 neurons per GEVI. *p<0.05 (t-test corrected with Holm-Bonferroni method for multiple comparisons). Comparisons are between ASAP1 and ASAP2s. Symbols indicate the mean and error bars show the SEM.
Figure 8—figure supplement 1

Single-trial spike detectability in trains of action potentials.
Trains of current-evoked APs were triggered in bursts of five APs at different frequencies in organotypic hippocampal slice cultures. The 1 Hz condition corresponds to a single AP. GEVI responses were imaged using RAMP microscopy at 925 Hz with 20 voxels per neuron. For each neuron, the detectability metric d’ was calculated using a single trial per train frequency. Since there are five APs per train, the d’ shown here is the average of the d’ values of individual spikes. For ASAP1 and ASAP2s, respectivity, samples sizes are: 1 Hz: n = 15 and 23 neurons; 10 Hz: n = 5 and 9; 20 Hz: n = 10 and 14; 30 Hz: n = 5 and 9; 100 Hz: n = 5 and 9. Symbols show the means and error bars indicate the SEM.
Figure 8—figure supplement 2

Detecting individual spikes in trains of action potentials using ASAP2f.
(A–C) Trains of five APs were evoked by current injection at 10 Hz (A), 30 Hz (B), or 100 Hz (C) in organotypic hippocampal slice cultures. Optical recordings were acquired at 925 Hz with 20 voxels per neuron. Traces are the average of 10 trials and were corrected for photobleaching. Blue, ASAP1; gray, ASAP2f. (D–F) Peak amplitude of ASAP1 and ASAP2f responses to each spike of a train of five APs evoked at 10 Hz (D), 30 Hz (E), or 100 (Hz). n = 7 neurons for ASAP1 and n = 8 for ASAP2f. The ASAP1 data in this figure is also shown in Figure 8. Symbols indicate the mean and error bars show the SEM.
Figure 9 with 1 supplement
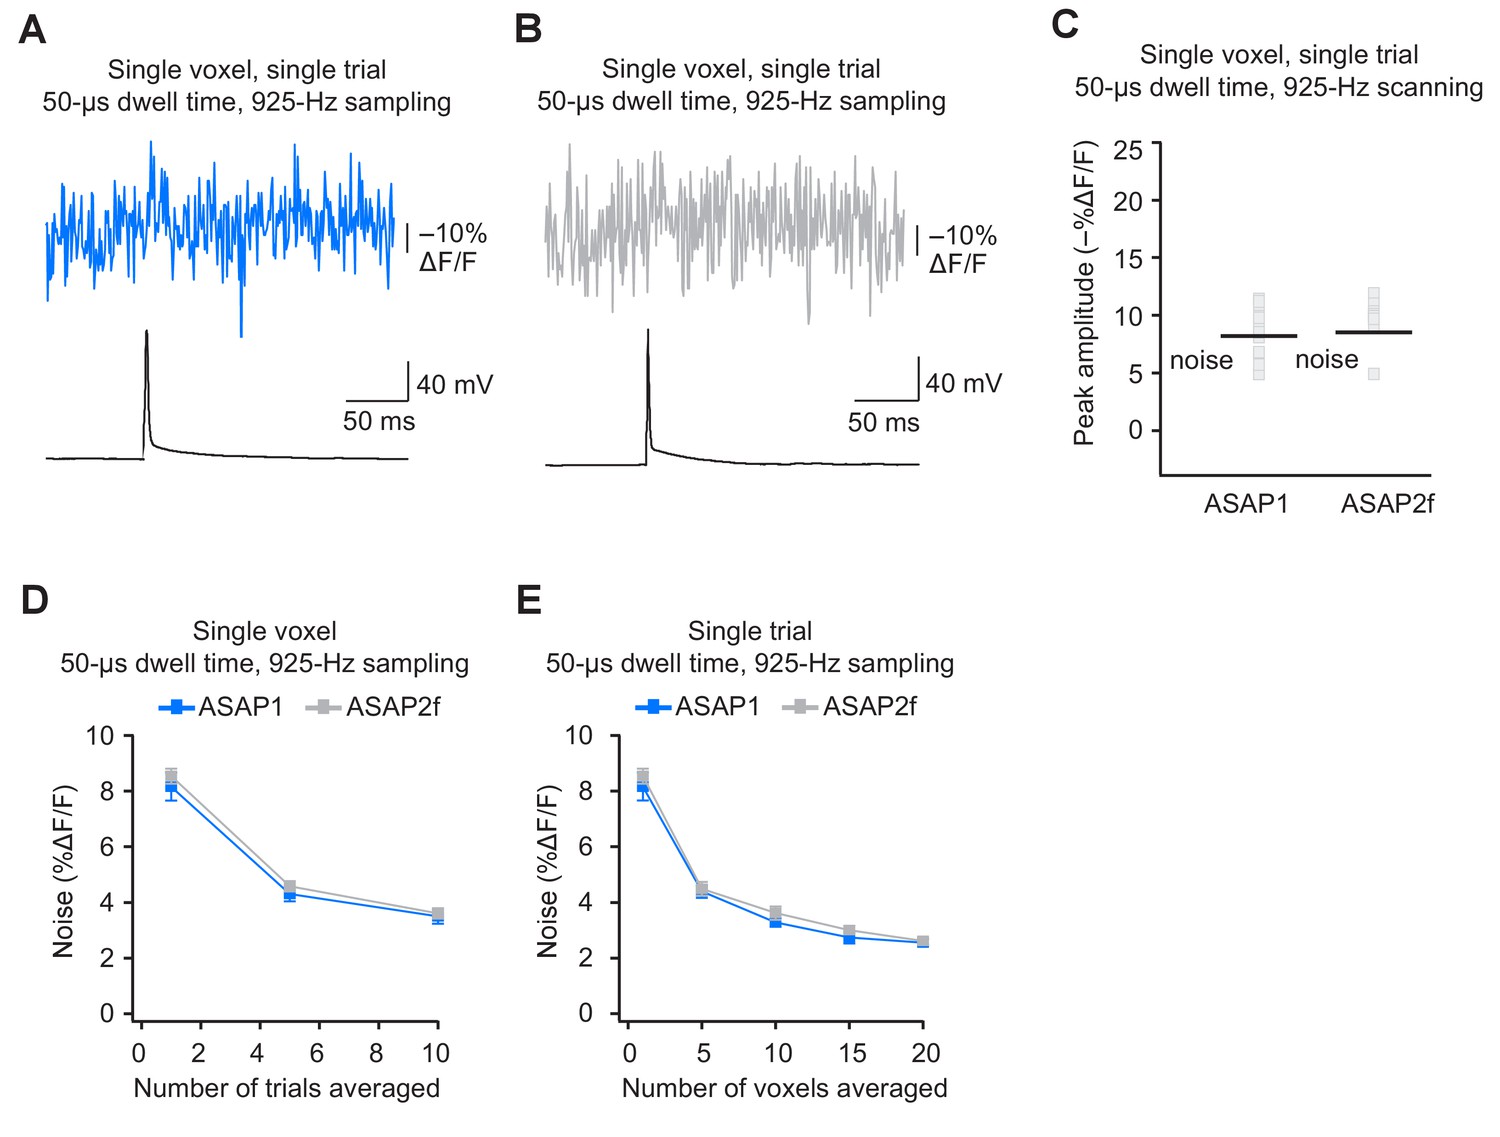
Detecting action potentials in single voxels and single trials.
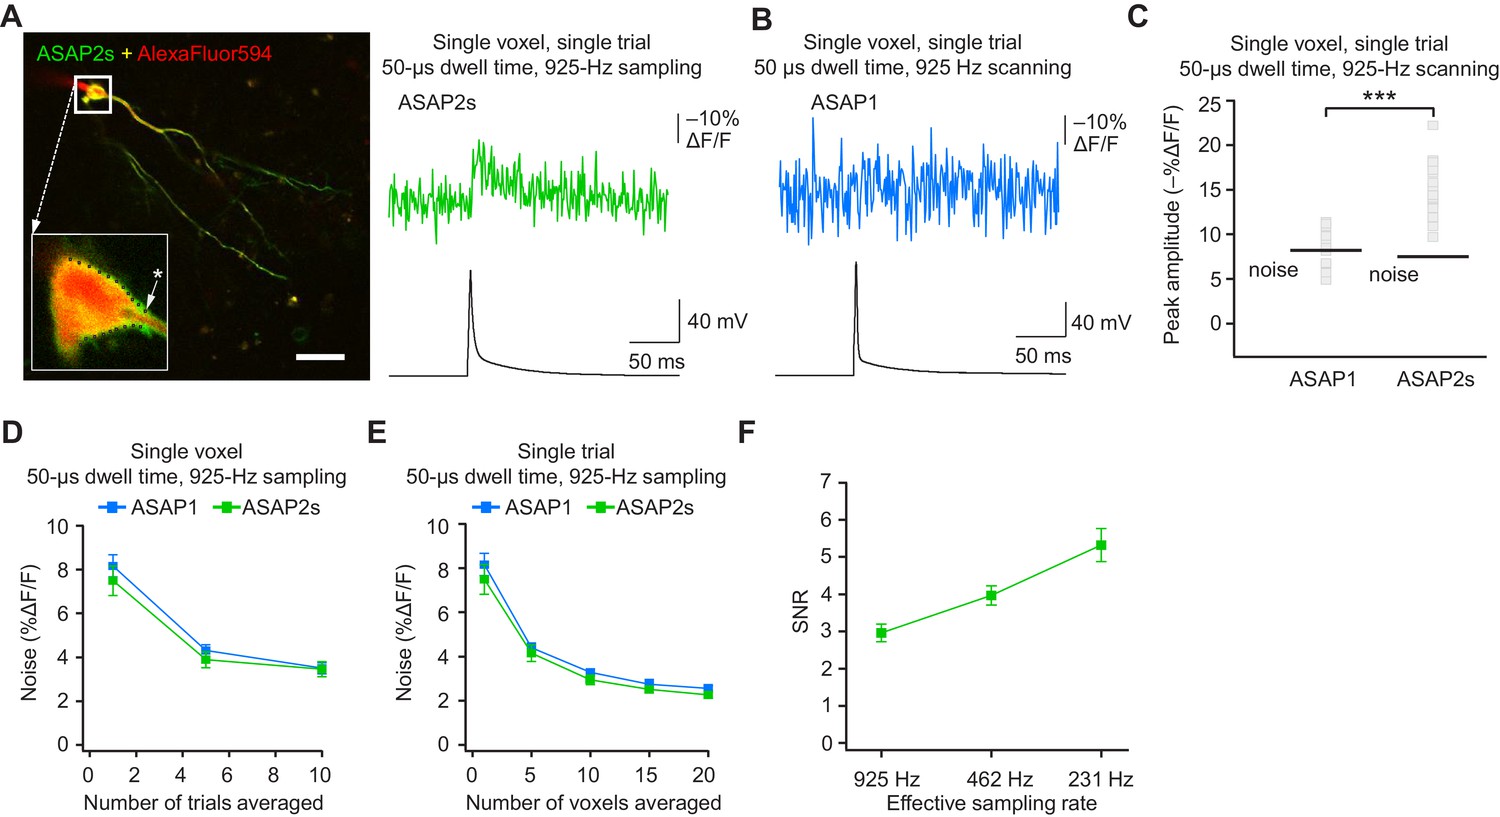
(A) Left, overlay image of ASAP2s and AlexaFluor594 fluorescence from a representative neuron in an organotypic hippocampal slice culture. The recording site for this example is shown with an asterisk in the inset. Right, example of a single-trial, single-voxel ASAP2s response to a single current-evoked AP. (B) Example of single-trial, single-voxel ASAP1 response to a single current-evoked AP. (C) Single-trial, single-voxel peak amplitude of ASAP1 and ASAP2s responses compared with the noise level. For each neuron, the peak amplitude was independently measured for all 20 imaged voxels; the mean peak response amplitude for each neuron is shown as a gray square. Black bars correspond to the mean noise level over all cells. n = 15 (ASAP1) and 23 (ASAP2s) neurons. ***p<0.001 (t-test). (D) Single-voxel noise as a function of the number of trials averaged. Symbols indicate the mean and error bars show the SEM. No significant difference was observed between ASAP1 and ASAP2s. n = 15 (ASAP1) and 23 (ASAP2s) neurons. p>0.05 (Mann-Whitney U-test with Holm-Bonferroni correction for multiple comparisons). (E) Single-trial noise as a function of the number of voxels averaged. Symbols indicate the mean and error bars show the SEM. No significant difference was observed between ASAP1 and ASAP2s. n = 15 (ASAP1) and 23 (ASAP2s) neurons. p>0.05 (Mann-Whitney U-test with Holm-Bonferroni correction for multiple comparisons). (F) Resampling ASAP2s responses by binning adjacent timepoints increases the SNR for single-trial single-voxel AP detection. Original timepoints were sampled at 925 Hz with dwell times of 50 μs. Only one voxel was analyzed per neuron, resulting in a slight difference in mean SNR compared with the value derived from the data in panel C and reported in the main text. n = 15 (ASAP1) and 23 (ASAP2s) neurons. For panels D-F, symbols indicate the mean and error bars show the SEM.
Figure 9—figure supplement 1
Detecting action potentials in single voxels and single trials using ASAP2f.
(A,B) Representative examples of single-trial, single-voxel responses to a single current-evoked AP in an organotypic hippocampal slice culture using ASAP1 (panel A) or ASAP2f (panel B). (C) Single-voxel peak amplitude of ASAP1 and ASAP2f responses compared with the noise level (black bar). n = 15 (ASAP1) and 10 (ASAP2f) neurons. Black bars correspond to mean noise level over all cells. (D) Single-voxel noise as a function of the number of trials averaged. Symbols indicate the mean and error bars show the SEM. n = 15 (ASAP1) and 10 (ASAP2f) neurons. (E) Single-trial noise as a function of the number of voxels averaged. Symbols indicate the mean and error bars show the SEM. n = 15 (ASAP1) and 10 (ASAP2f) neurons. The ASAP1 data is also shown in Figure 8.
Figure 10 with 1 supplement
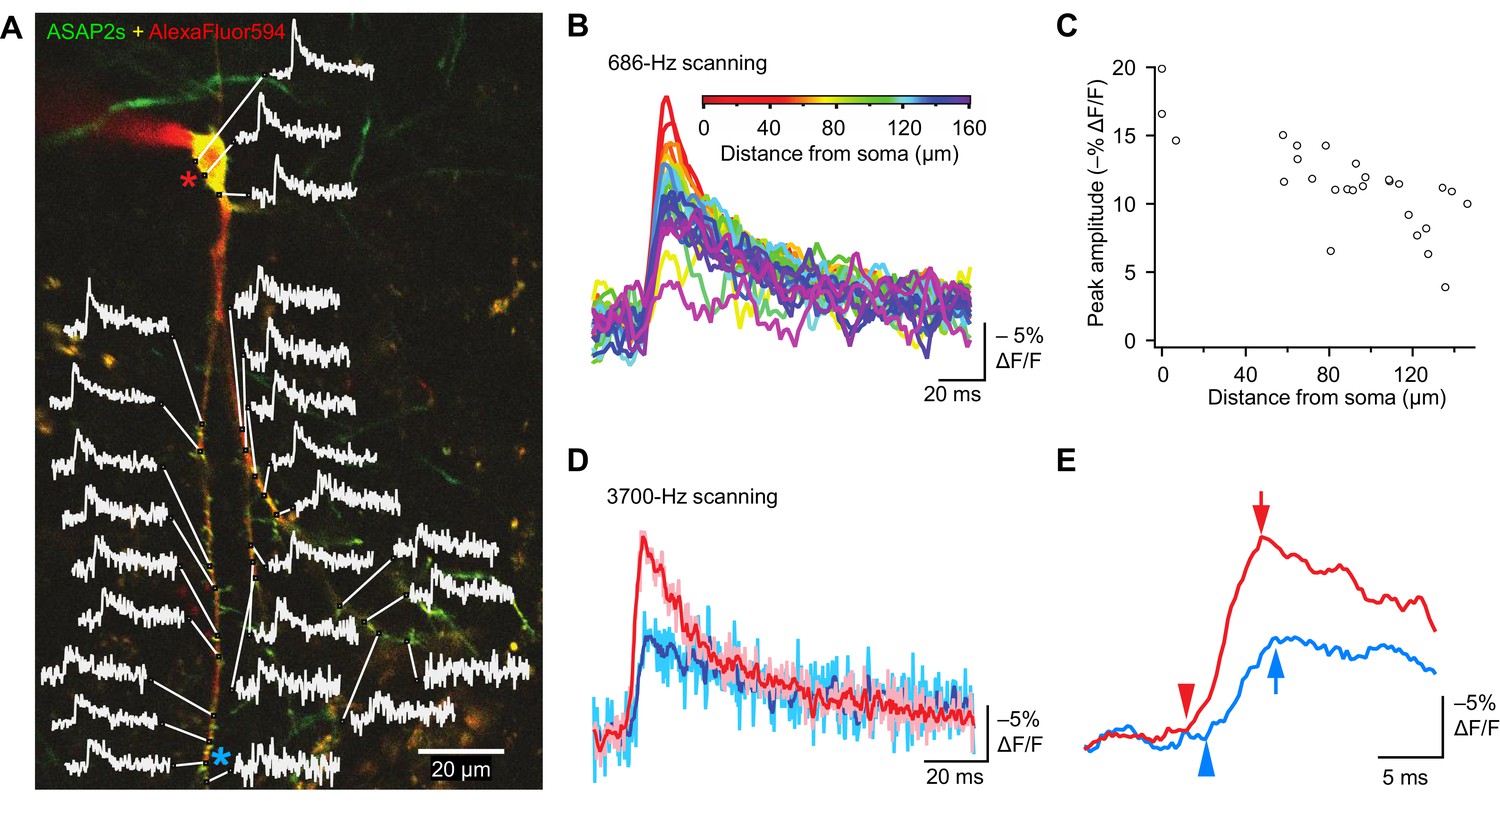
Tracking spike propagation in organotypic hippocampal slice cultures with ASAP2s and RAMP imaging.
(A) Optical responses to a backpropagating, current-evoked AP were recorded at multiple sites in the dendritic arbor. Recorded points at different distances from the cell body are shown with their corresponding traces. Traces are from single voxels imaged at 686 Hz and averaged over 31 trials. This image is an overlay of ASAP2s and AlexaFluor594 fluorescence from a representative neuron. (B) Overlay of traces from the points recorded in panel A, color coded to show the distance from the cell body. A five-point moving average was applied to the traces to improve clarity when superimposed. (C) Peak response amplitude as a function of distance from the cell body. Each point corresponds to a unique spatial location (voxel) from the neuron shown in panel A. (D) Comparison of optical responses to a current-evoked AP recorded at the soma and distal dendrites. The soma trace (light red) is an average of two voxels (near the red star in panel A), while the distal dendrite trace (light blue) is an average of three voxels (near the blue star). Both traces are averages of 23 trials. The darker traces are smoothened traces (five-point moving average). (E) The optical traces from panel D were rescaled and aligned to show the delay in initiation time (arrowheads) and peak amplitude (arrows) of the AP in distal dendrites.
Figure 10—figure supplement 1
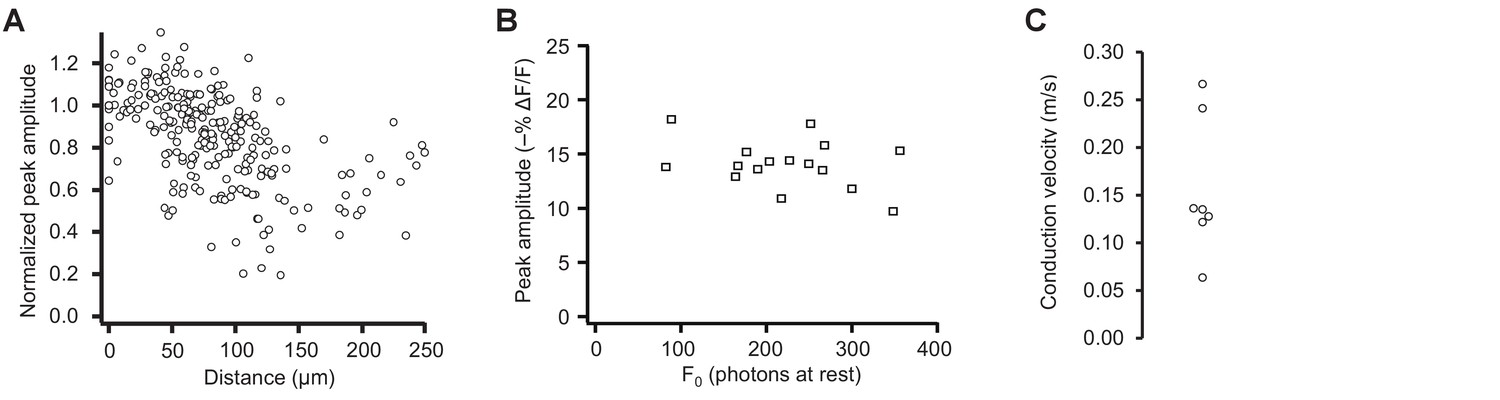
Pooled data from optical tracking of spike propagation in multiple neurons using ASAP2s.
(A) Normalized peak amplitude as a function of distance from the cell body shows a large decrease in amplitude with distance (n = 7 neurons, 27 to 41 spatial locations recorded per neuron). Each marker (circle) corresponds to a unique spatial location (voxel) on a neuron, averaged over 9 to 31 trials. (B) The change in peak amplitude is independent of the number of photons measured at rest (F0), indicating that optical responses at locations with different F0 can be compared. Data measured at the cell body in n = 16 neurons. r = −0.33; p>0.2 (Pearson’s rank correlation). (C) Conduction velocity of backpropagating APs calculated by comparing the timing of APs between the soma and dendritic locations located 74–195 μm from the soma (n = 7 neurons).
Videos
Video 1
ASAP2s optical response to cardiac APs in a human embryonic stem cell-derived cardiomyocyte (hESC-CM).
A hESC-CM was transfected with ASAP2s at 27 days post-differentiation and was imaged three days later at 100 Hz and with a power density of 11 mW/mm2 at the sample plane. Quantification of the fluorescence response during the first 10 s is shown in Figure 2B. The movie corresponds to a single trial without filtering, smoothing, or photobleaching correction.
Video 2
ASAP2s responses to step voltages in a patch-clamped cultured hippocampal neuron.
ASAP2s fluorescence was captured while its transmembrane voltage was stepped from –70 to 0, 30, or 50 mV as labelled. Frames were acquired at 20 Hz and played back in real time. The movie corresponds to a single trial without filtering, smoothing, or photobleaching correction.
Tables
Table 1
Response kinetics of ASAP indicators and ArcLight Q239 in HEK293A cells at 22°C.
| ASAP1 | ASAP2s | ArcLight Q239 | |
|---|---|---|---|
| Depolarization (–70 to 30 mV) | |||
| τfast (ms) | 2.9 ± 0.3 | 5.2 ± 0.4 | 20 ± 2 |
| τslow (ms) | 161 ± 33 | 63 ± 11 | 267 ± 13 |
| % fast | 74 ± 5 | 56 ± 7 | 37 ± 7 |
| Repolarization (30 to –70 mV) | |||
| τfast (ms) | 2.3 ± 0.4 | 24 ± 7 | 113 ± 11 |
| τslow (ms) | 177 ± 38 | 106 ± 47 | 367 ± 32 |
| % fast | 63 ± 6 | 49 ± 17 | 53 ± 8 |
| Hyperpolarization (–70 to –100 mV) | |||
| τfast (ms) | 11 ± 3 | 8.2 ± 0.6 | 20 ± 5 |
| τslow (ms) | 131 ± 16 | 104 ± 10 | 208 ± 23 |
| % fast | 59 ± 3 | 53 ± 2 | 49 ± 3 |
| Repolarization (–100 to –70 mV) | |||
| τfast (ms) | 15 ± 3 | 13 ± 1 | 42 ± 12 |
| τslow (ms) | 131 ± 14 | 114 ± 10 | 265 ± 75 |
| % fast | 52 ± 2 | 51 ± 1 | 57 ± 3 |
-
n = 4–5 cells per sensor. Data are presented as mean ± SEM.
Download links
A two-part list of links to download the article, or parts of the article, in various formats.
Downloads (link to download the article as PDF)
Open citations (links to open the citations from this article in various online reference manager services)
Cite this article (links to download the citations from this article in formats compatible with various reference manager tools)
Fast two-photon imaging of subcellular voltage dynamics in neuronal tissue with genetically encoded indicators
eLife 6:e25690.
https://doi.org/10.7554/eLife.25690


