Full length RTN3 regulates turnover of tubular endoplasmic reticulum via selective autophagy
- Goethe University School of Medicine, Germany
- University of Groningen, University Medical Center Groningen, Netherlands
- Goethe University Frankfurt, Germany
- Lerner Research Institute, The Cleveland Clinic Foundation, United States
Figures
Figure 1 with 5 supplements
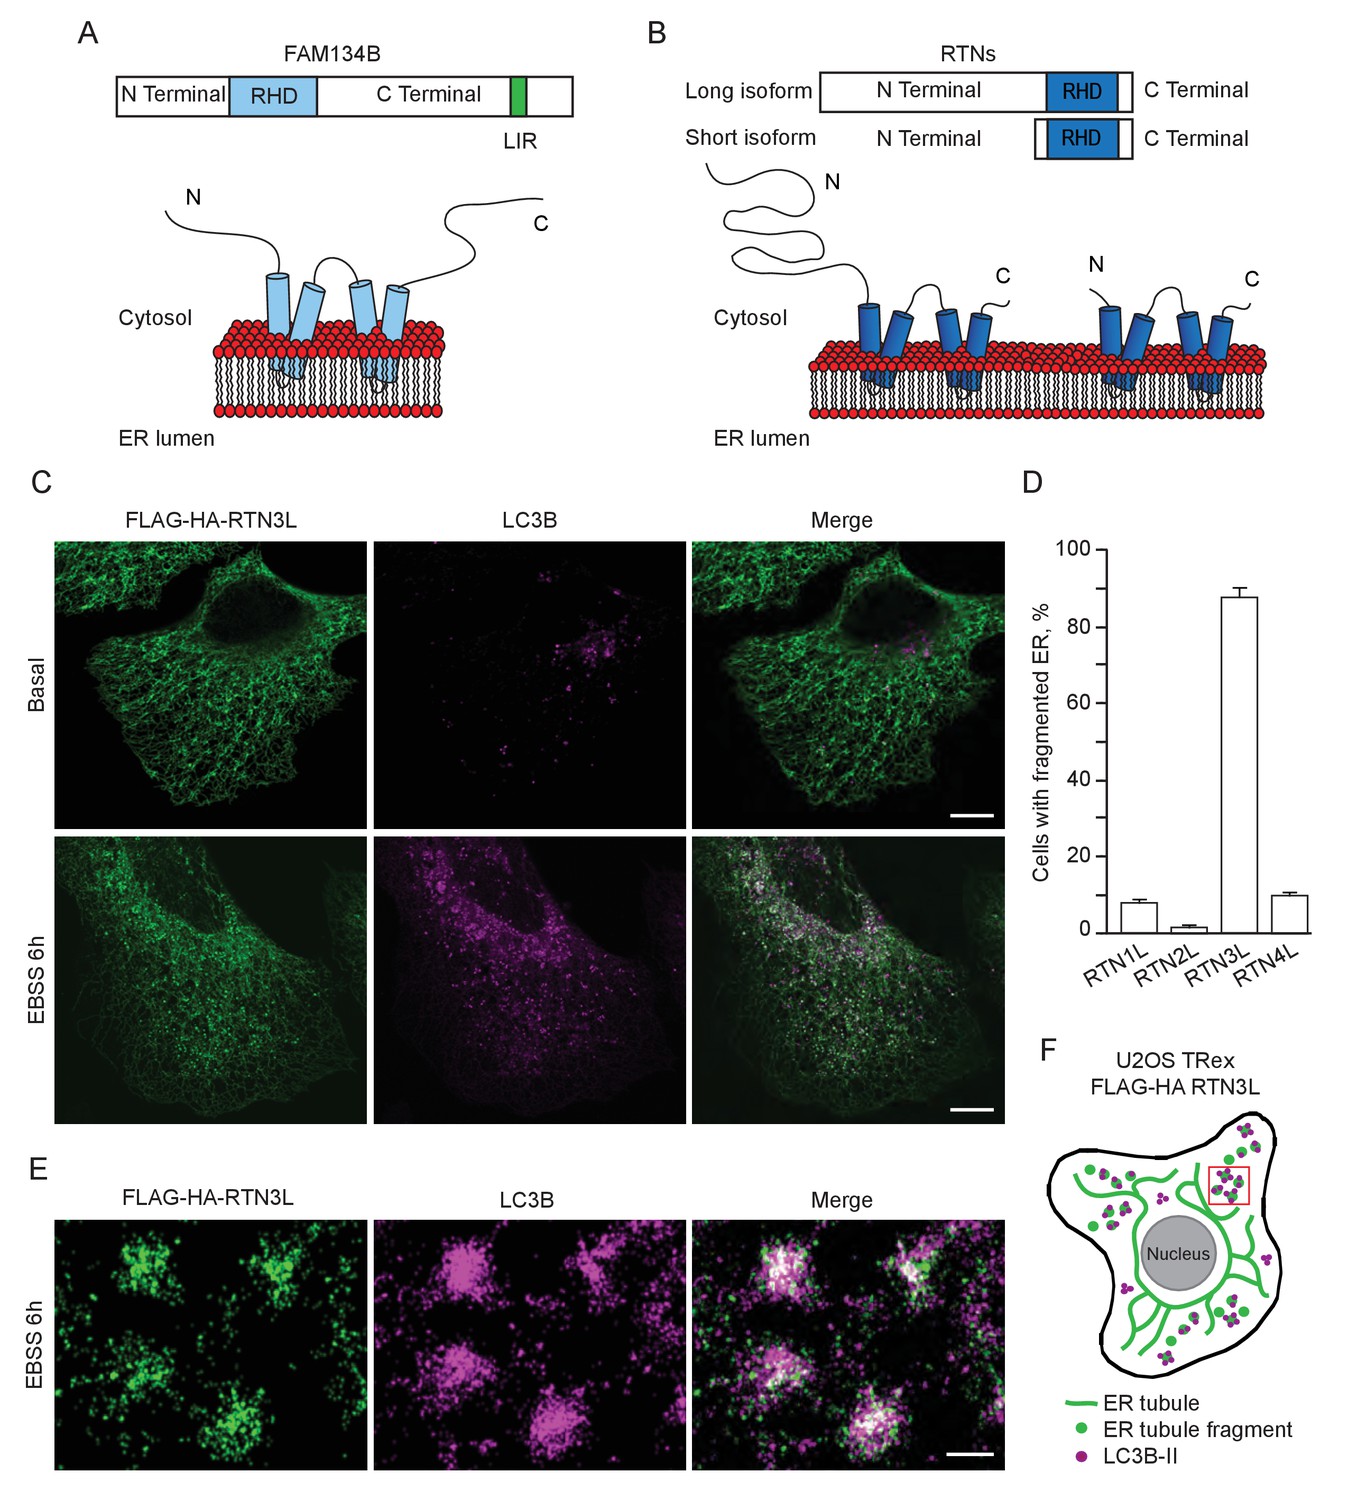
RTN3 over-expression induces ER tubules fragmentation during starvation.
(A, B) Schematic representation of the protein structure and topology of FAM134B (A) and RTN3 long and short isoforms (B). (C) Immunofluorescence of HA and LC3B in U2OS TRex stable cell lines expressing FLAG-HA-RTN3L after 24 hr treatment with 1 µg/ml of doxycycline. Cells were kept in standard growing condition (DMEM with 10% FBS) or starved with EBSS for 6 hr. RTN3L was monitored using anti HA antibody, while autophagy induction was visualized using anti-LC3B antibody. Bafilomycin A1 was added at a final concentration of 200 ng/ml. Scale bars: 10 µm. (D) Quantification of U2OS TRex FLAG-HA-RTN1-4L cells with ER tubule fragment after 6 hr starvation with EBSS plus Bafilomycin A1, 200 ng/ml. Number of cells >100 for each condition. Data are representative of three independent biological replicates. Error bars indicate s.d. (E) Super-resolution fluorescence microscopy (dSTORM) of ER fragments in U2OS TRex FLAG-HA-RTN3L cells stained with anti HA and anti LC3B antibodies after 6 hr starvation with EBSS plus Bafilomycin A1, 200 ng/ml. Scale bar: 0.5 µm. (F) Schematic representation of ER tubules fragmentation and LC3 labeling in U2OS TRex FLAG-HA-RTN3L cells. The red square indicates the level of high resolution represented in panel E.
Figure 1—figure supplement 1

Reticulon family members.
(A) Schematic representation of RTN1-4 genes and relative isoforms. Red asterisks (*) indicate the presence of mutations inside the RHD of RTN3. (B) RTNs short and long isoforms nomenclature as indicated in PubMed (Gene) and Ref-Seqs. For simplicity, the long isoforms are indicated as RTN#L the short isoform as RTN#S. (C) Schematic representation for the U2OS TRex FLAG-HA-RTNs stable and inducible cell lines.
Figure 1—figure supplement 2
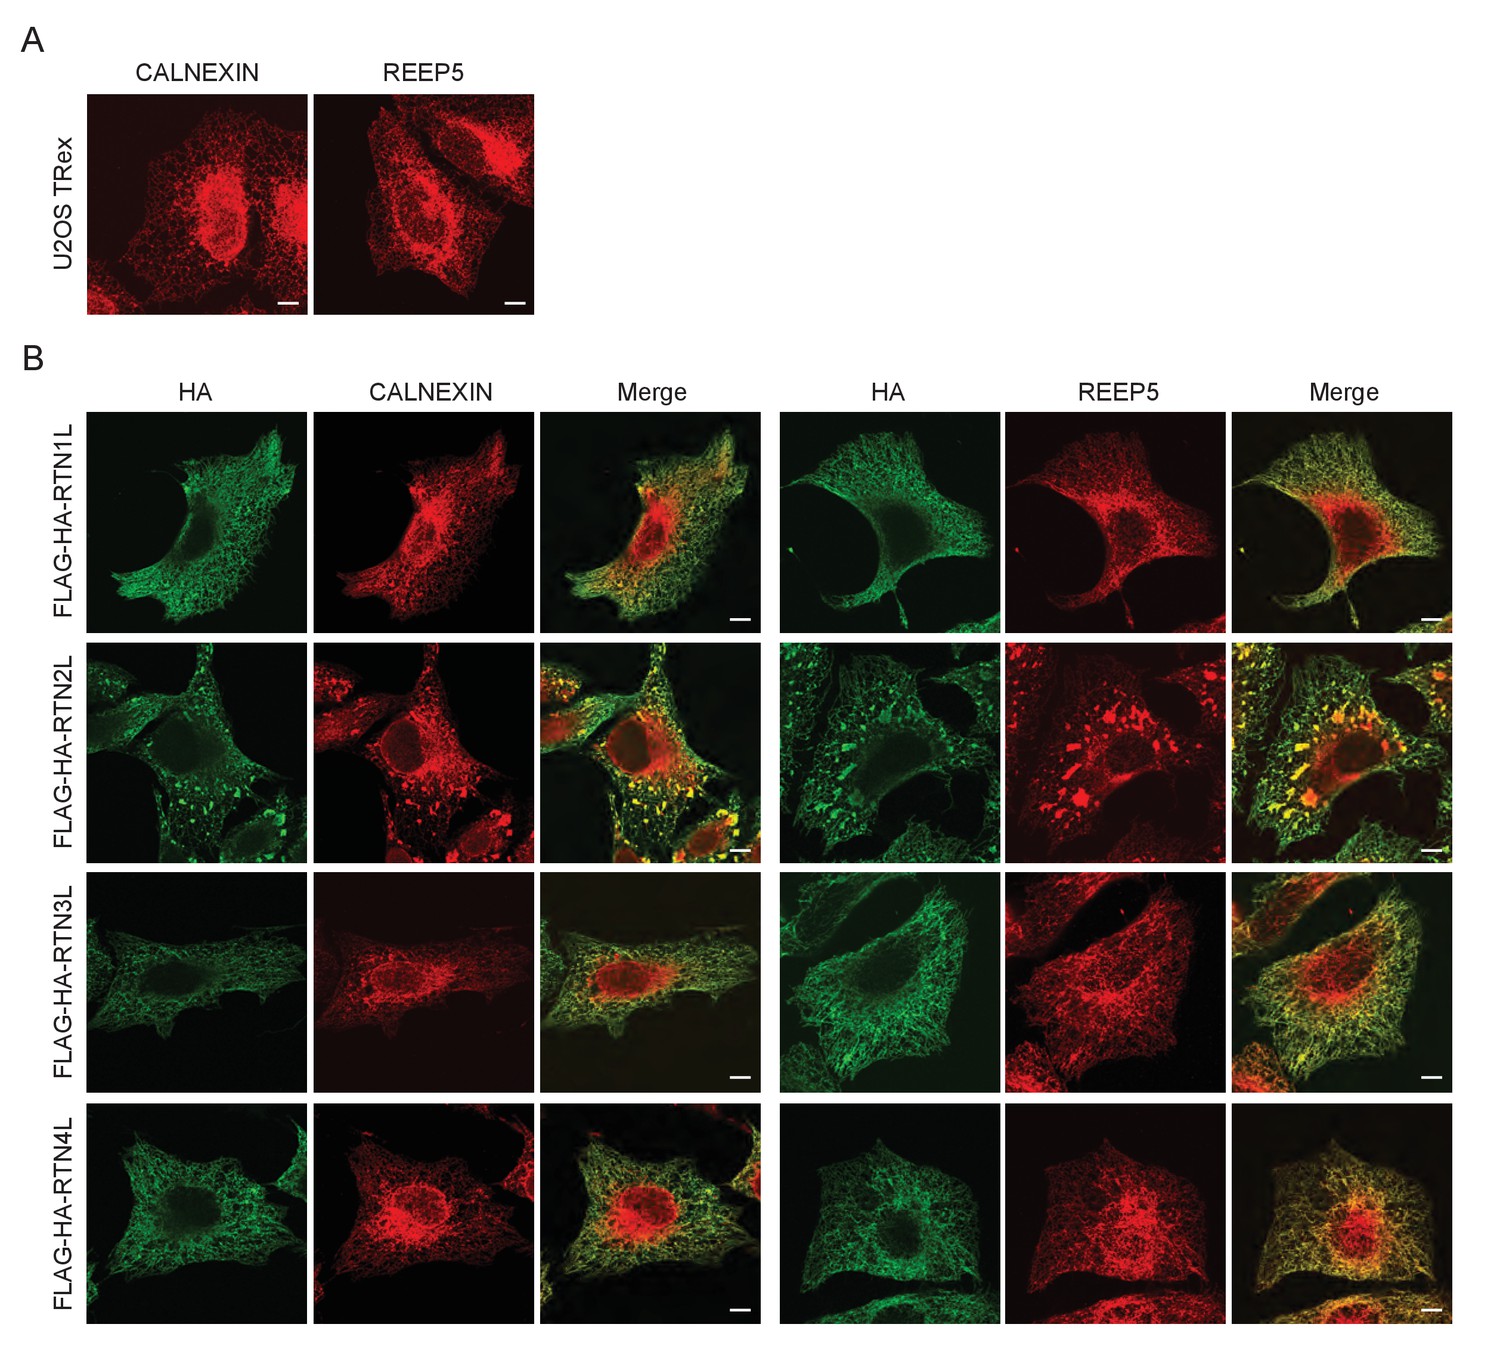
ER tubules morphology in U2OS TRex cells after over-expression of full length RTN proteins.
(A) Endogenous labeling of CALNEXIN and REEP5 in U2OS TRex cells. (B) Endogenous labeling of CALNEXIN and REEP5 in U2OS TRex cells after over-expression of long RTN isoforms. Scale bars: 10 µm.
Figure 1—figure supplement 3
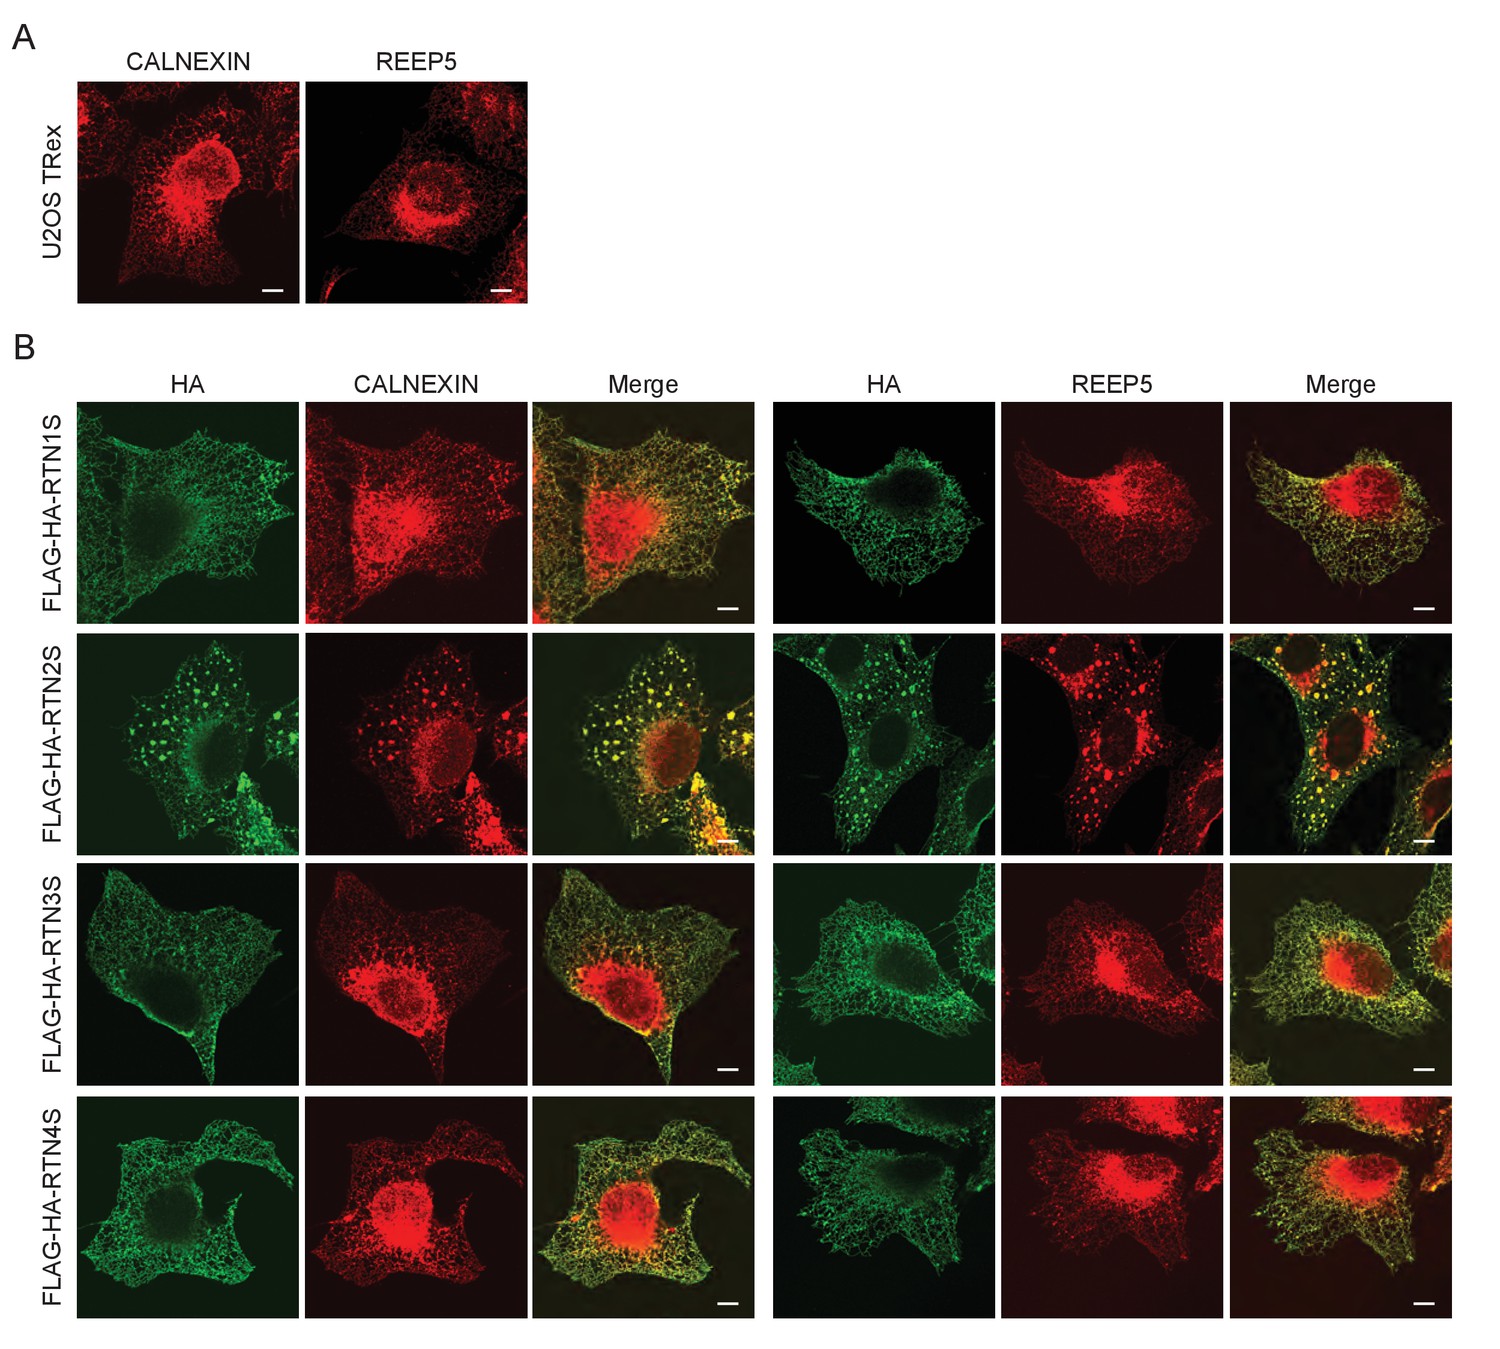
ER tubules morphology in U2OS TRex cell after over-expression of short RTN variants.
(A) Endogenous labeling of CALNEXIN and REEP5 in U2OS TRex cells. (B) Endogenous labeling of CALNEXIN and REEP5 in U2OS TRex cells after over-expression of short RTN isoforms. Scale bars: 10 µm.
Figure 1—figure supplement 4
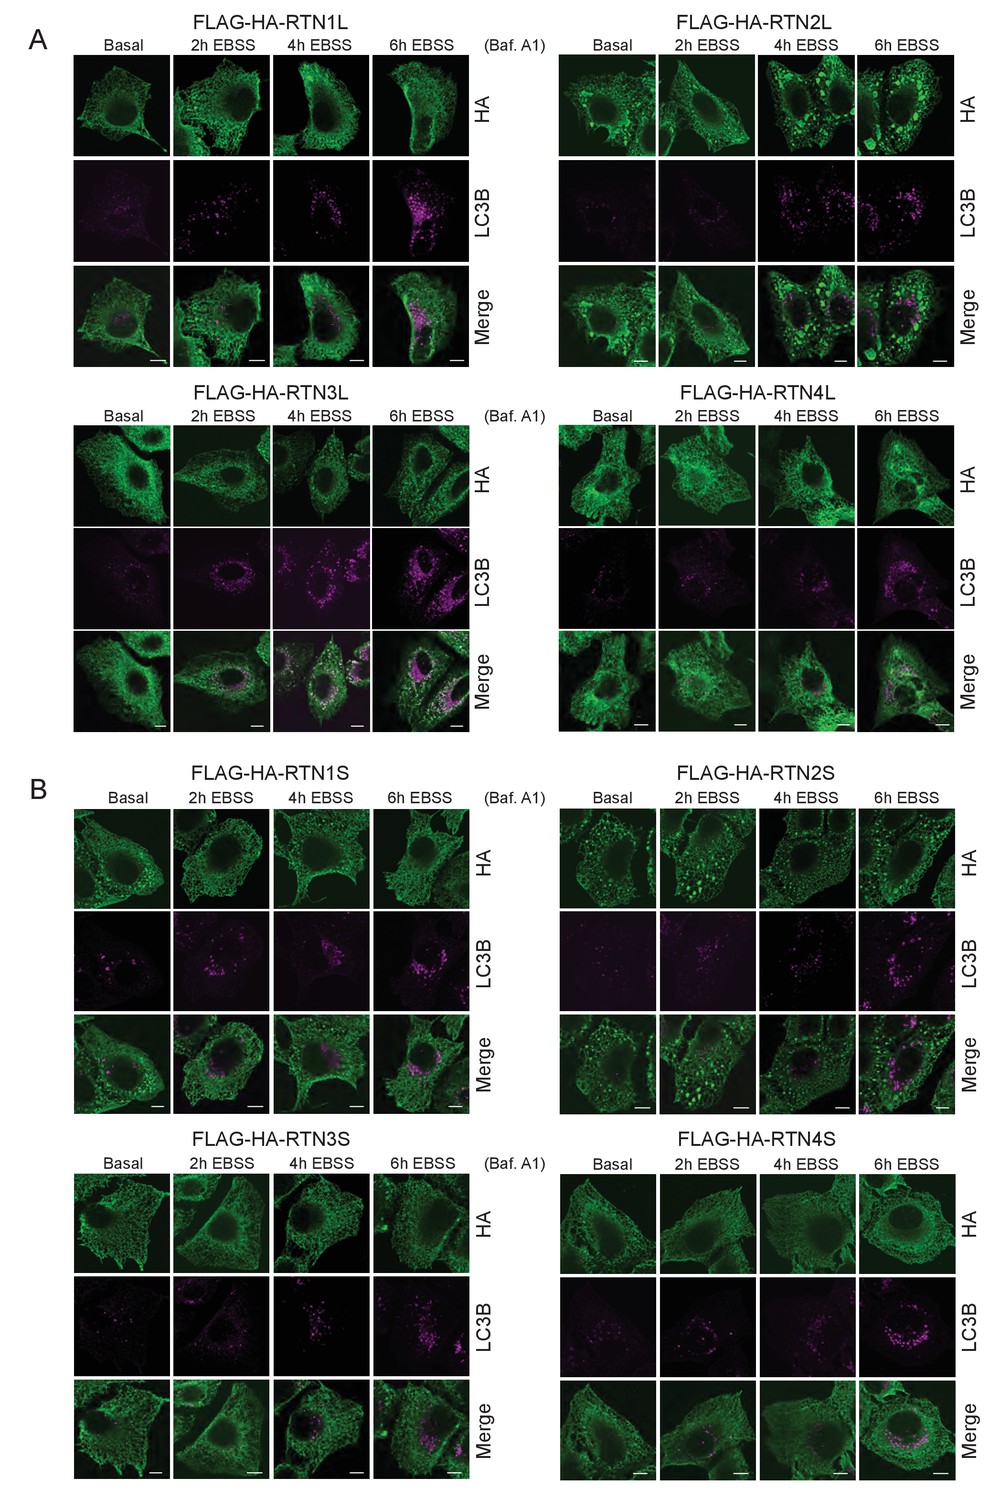
ER tubules morphology in U2OS TRex RTNs cell lines after autophagy induction via EBSS starvation.
(A) Immunofluorescence of HA and LC3B in U2OS TRex RTN1-4L (B) and RTN1-4S after 24 hr treatment with 1 µg/ml of doxycycline. Cells were kept in standard growing condition (DMEM with 10% FBS) or starved with EBSS for the indicated time. RTNs were monitored using anti-HA antibody, while autophagy induction was visualized using anti-LC3B antibody. Bafilomycin A1 was added at a final concentration of 200 ng/ml. Scale bars: 10 µm.
Figure 1—figure supplement 5

RTN3L over-expression promotes ER tubules fragmentation during autophagy induction.
(A) Super-resolution fluorescence microscopy (dSTORM) of ER fragments in U2OS TRex FLAG-HA-RTN3L cells stained with anti HA and anti LC3B antibodies after 6 hr starvation with EBSS plus Bafilomycin A1, 200 ng/ml. Scale bar: 5 µm. The white box indicates the magnification reported in Figure 1E. (B) Co-localization of endogenous RTN3 with SEC63, in U2OS cells over-expressing GFP-SEC63, in standard growing conditions and after EBSS treatment for 6 hr. (C) Co-staining of endogenous RTN3 and LC3B in U2OS cells in standard growing conditions (DMEM with 10% FBS) and after nutrient deprivation (EBSS). (D) Co-staining of HA and CALNEXIN, BSCL2, REEP5 and CLIMP-63 in U2OS TRex FLAG-HA-RTN3L cells in standard growing conditions and after EBSS starvation. Scale bars: 10 µm.
Figure 2 with 2 supplements

RTN3L homo-dimerization induces ER tubules fragmentation.
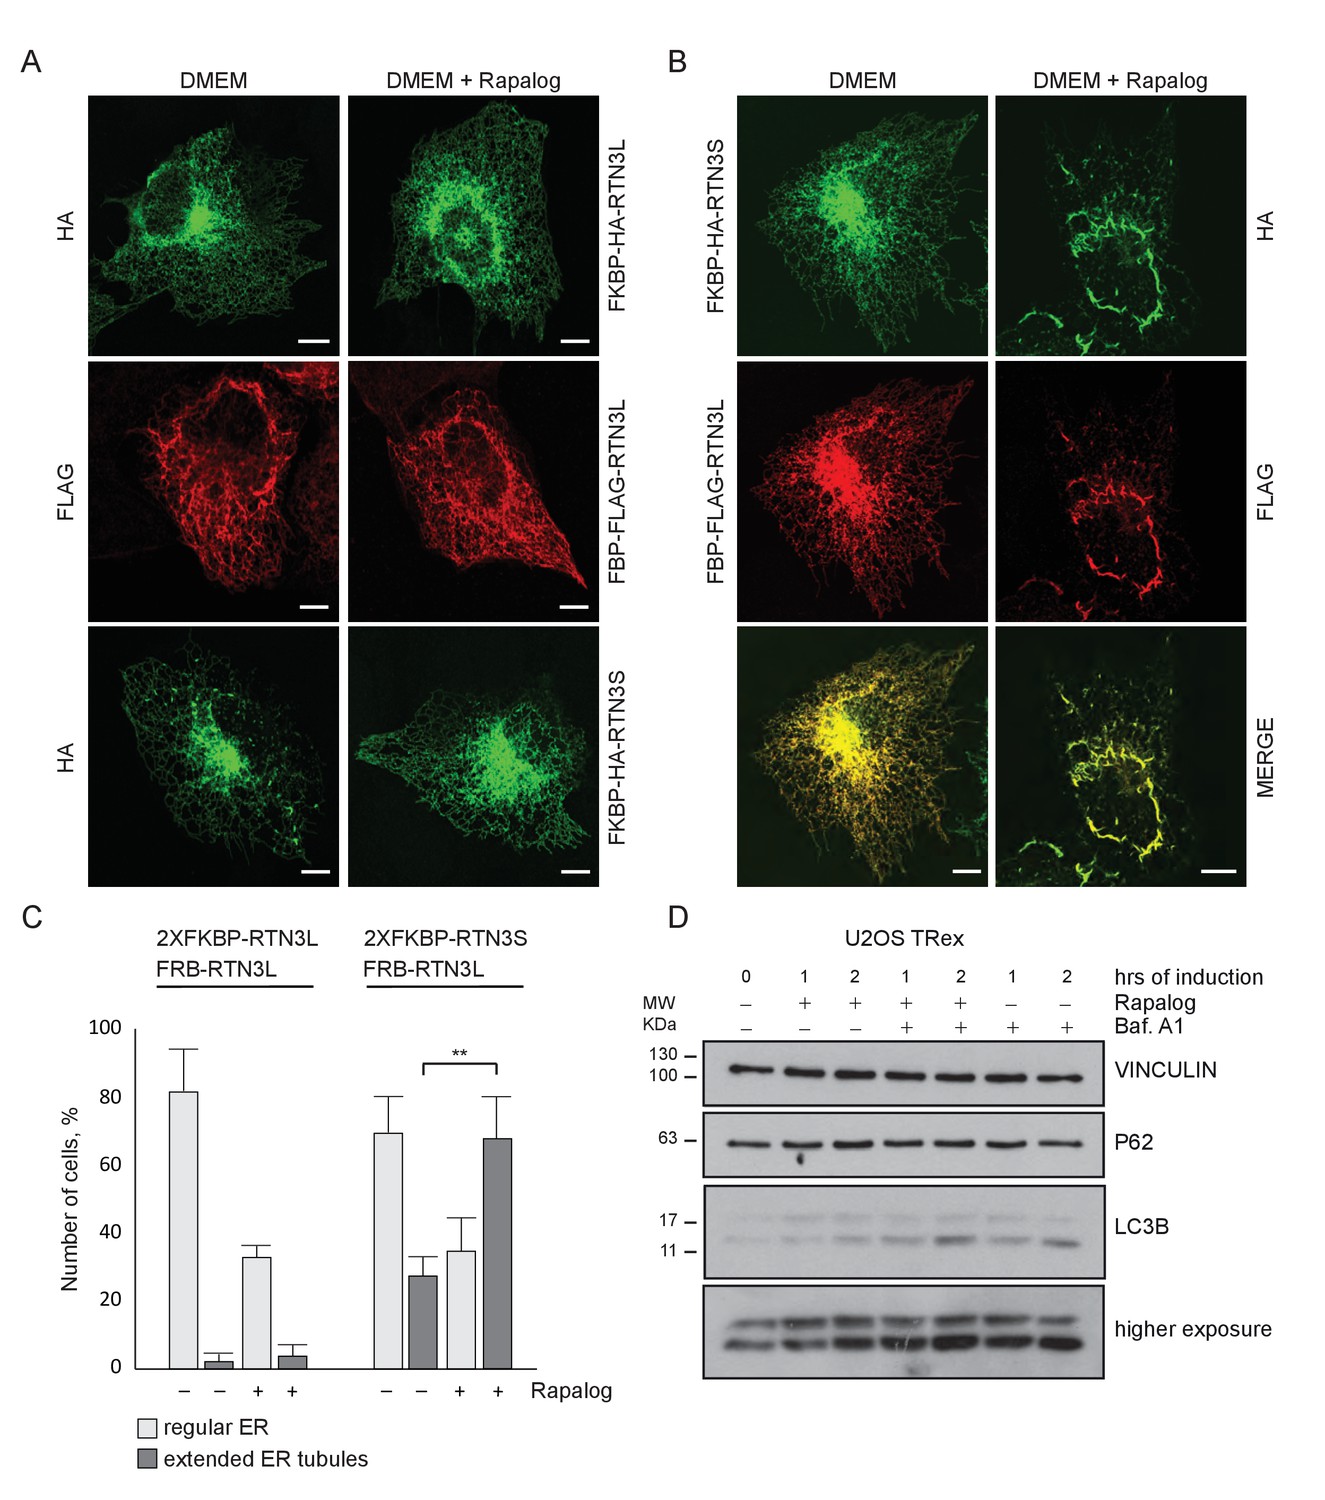
(A) Schematic representation of 2XFKBP-HA-RTN3L, 2XFKBP-HA-RTN3S and FRB-FLAG-RTN3L plasmids. (B) Working model for the RTN3 homo/hetero-dimerization assay. (C) Quantification of cells presenting ER tubule fragmentation after transient co-transfection with FKBP-FKBP-HA-RTN3L/FRB-FLAG-RTN3L or 2XFKBP-HA-RTN3S/FRB-FLAG-RTN3L plasmids in standard conditions and after Rapalog treatment. Number of cells >100 for each condition. Data are representative of three independent biological replicates, *p<0.05; **p<0.01. Error bars indicate s.d. (D,E) U2OS TRex transiently expressing 2XFKBP-HA-RTN3L and FRB-FLAG-RTN3L. 24 hr after transfection, 500 nM Rapalog was added for 2 hr and cells were (D) double stained with antibodies against HA and FLAG and (E) triple stained with HA, FLAG and LC3B after 1 hr EBSS treatment plus 200 ng/ml Bafilomycin A1. Scale bars: 10 µm.
Figure 2—figure supplement 1
Homo- and hetero-dimerization of RTN3 affects ER morphology independently from autophagy.
(A) Immunofluorescence of HA and FLAG in U2OS TRex cells transiently expressing FKBP-HA-RTN3L or FRB-FLAG-RTN3L or FKBP-HA-RTN3S. (B) Immunofluorescence of HA and FLAG in U2OS TRex transiently co-expressing FKBP-HA-RTN3S and FRB-FLAG-RTN3L. After 24 hr, 500 nM Rapalog was added for 2 hr. Scale bars: 10 µm. (C) Quantification of cells presenting extended ER tubules after transient co-transfection with 2XFKBP-HA-RTN3L/FRB-FLAG-RTN3L or 2XFKBP-HA-RTN3S/FRB-FLAG-RTN3L plasmids in standard conditions and after Rapalog treatment. Number of cells >100 for each condition. Data are representative of three independent biological replicates. **p<0.01. Error bars indicate s.d. (D) Western blot analysis of LC3B lipidation and p62 degradation in U2OS TRex cells treated with Rapalog for the indicated time.
Figure 2—figure supplement 2
Dimerization of RTN3 modifies ER tubules structure.
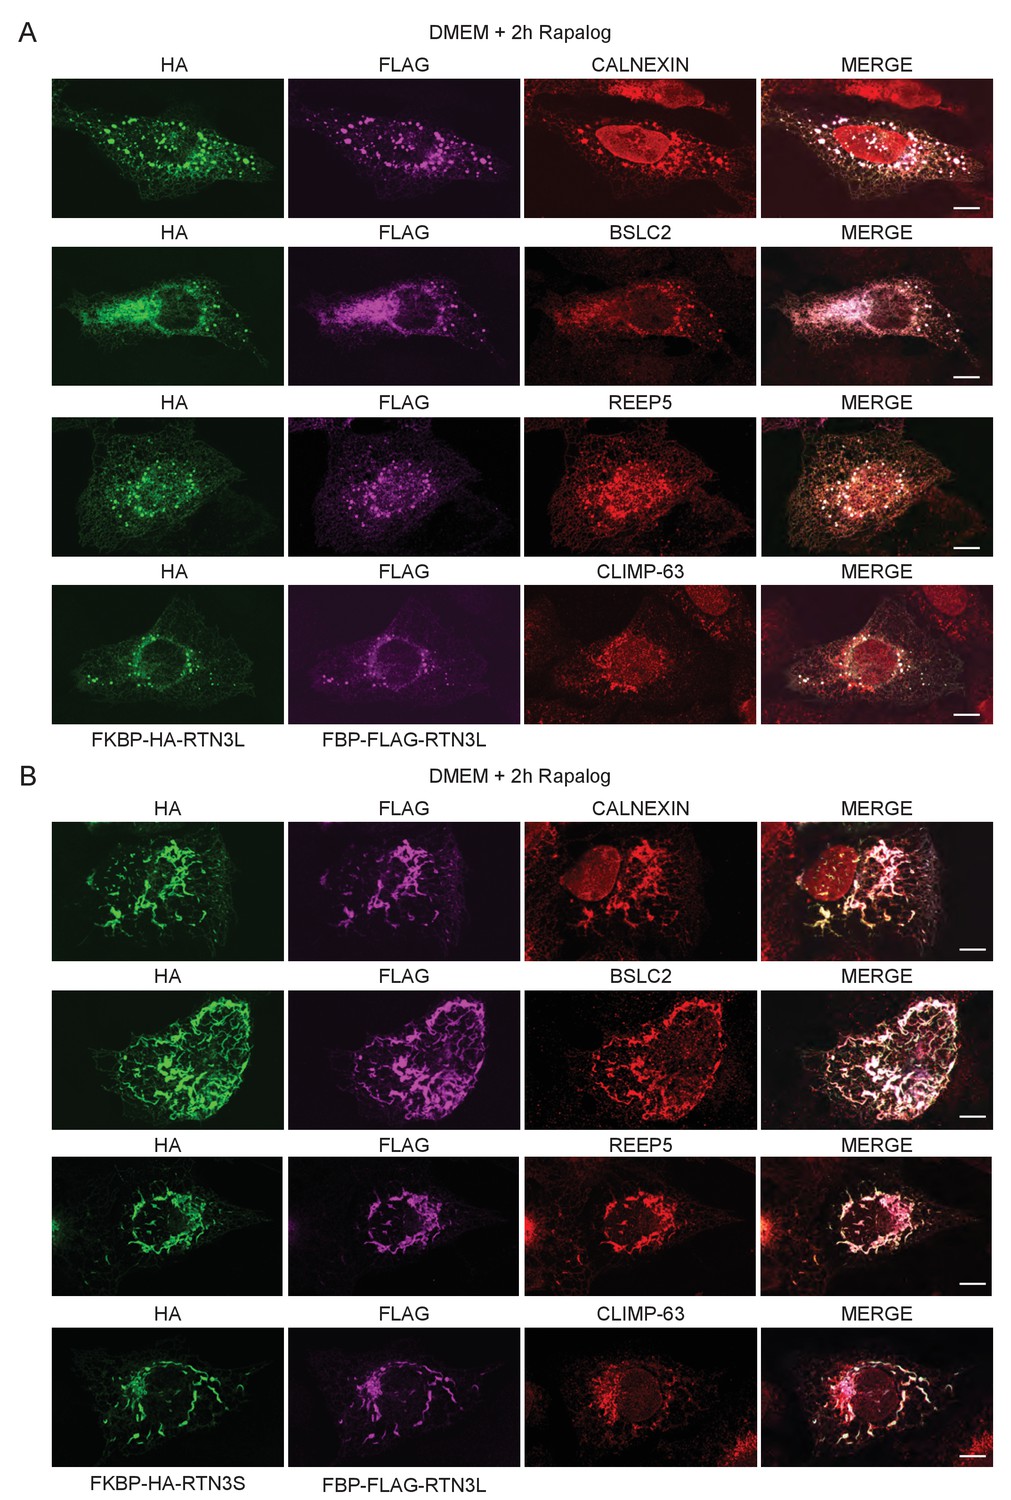
(A,B) Immunofluorescence of HA, FLAG in U2OS TRex transiently co-expressing 2XFKBP-HA-RTN3L and FRB-FLAG-RTN3L (A) or 2XFKBP-HA-RTN3S and FRB-FLAG-RTN3L (B). ER was labelled using antibodies against endogenous: CALNEXIN, BSCL2, REEP5 and CLIMP-63. After 24 hr from transfection, 500 nM Rapalog was added for 2 hr. Scale bars: 10 µm.
Figure 3 with 5 supplements
ER tubules fragments are delivered to lysosomes.
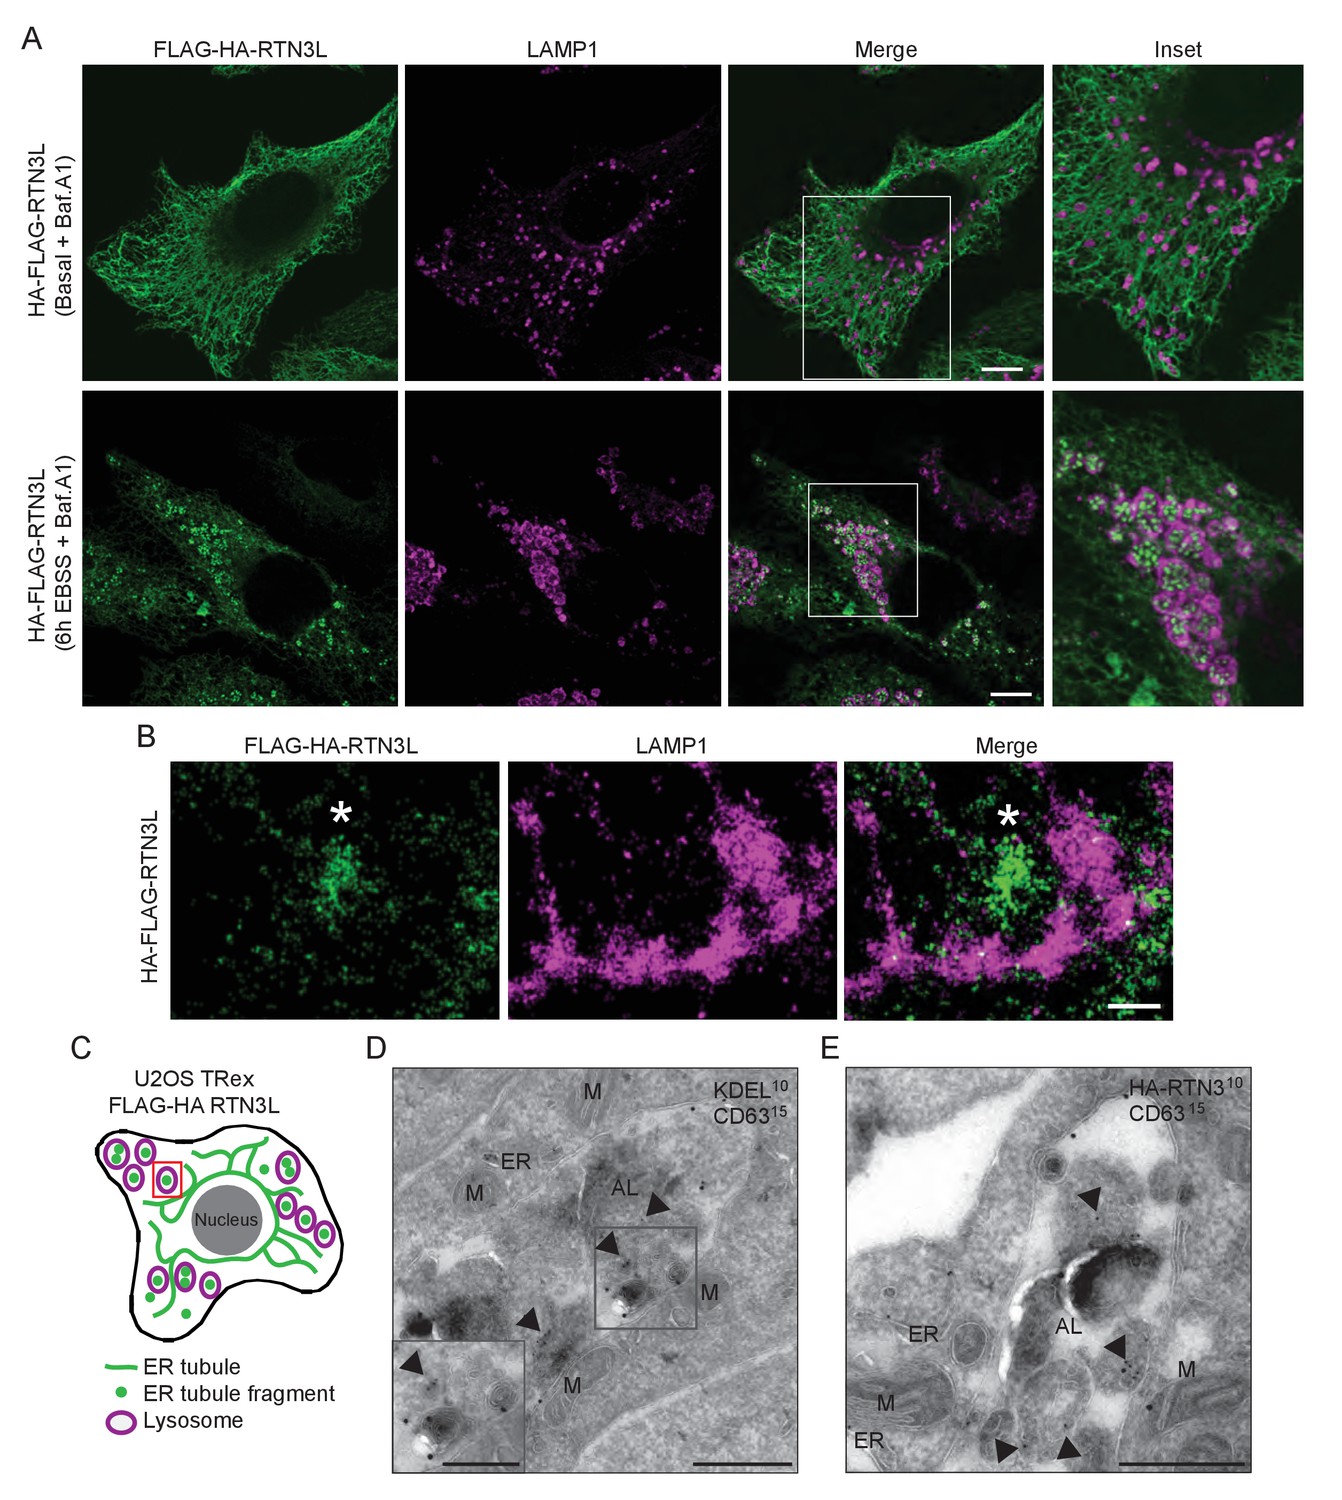
(A) Immunofluorescence of HA and LAMP1 in U2OS TRex stable cell lines expressing FLAG-HA-RTN3L in basal growing conditions and after 6 hr starvation with EBSS plus Bafilomycin A1 200 ng/ml. RTN3L level was monitored using an anti HA antibody, while lysosomes were visualized using anti-LAMP1 antibody. Scale bars: 10 µm. (B) Super-resolution fluorescence microscopy (dSTORM) of ER fragments in U2OS TRex FLAG-HA-RTN3L cells stained with anti-HA and anti-LAMP1 antibodies after 6 hr starvation with EBSS plus Bafilomycin A1, 200 ng/ml. Asterisk indicates RTN3L positive ER tubule fragment. Scale bar: 0.5 µm. (C) Schematic representation of ER tubules fragmentation and their delivery to lysosome. The red square indicates the level of high resolution represented in panel B. (D,E) Immuno-gold labelling of cryo-sections using antibodies against CD63 (large dots, diameter 15 nm) and against either the KDEL peptide (D) or the HA tag (E) (small dots, diameter 10 nm). U2OS RTN3L cells were nutrient starved in EBSS for 6 hr in the presence of Bafilomycin A1 before being processed for IEM. AL, autolysosome; M, mitochondrion; ER, endoplasmic reticulum; Arrowheads indicates KDEL-positive ER fragments (D) or HA-RTN3L (E). Scale bar, 500 nm. Enlargement in D shows a detail of a KDEL-positive ER fragment inside an autolysosome. Scale bar, 200 nm.
Figure 3—figure supplement 1
EBSS treatment induces fragmentation of the ER and subsequent delivery of the fragments to lysosomes.
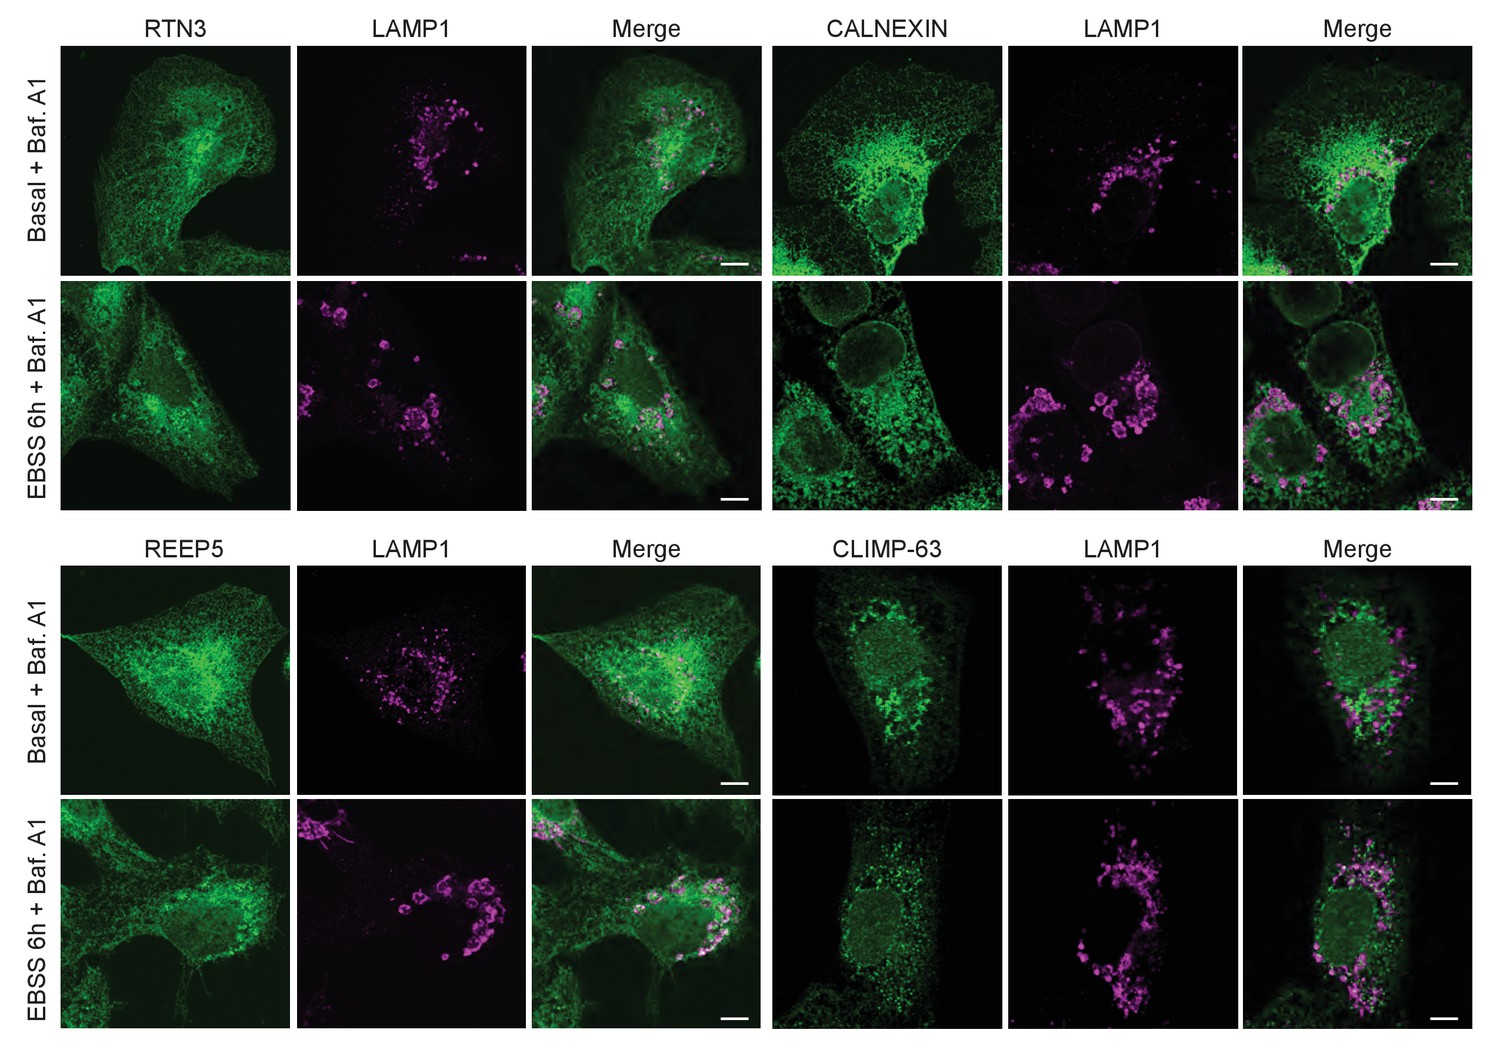
Co-staining of U2OS TRex cells with endogenous RTN3, CALNEXIN, REEP5 or CLIMP-63 with the lysosomal marker LAMP1. Cells were grown in standard growing conditions (DMEM with 10% FBS) or treated with EBSS for 6 hr. Scale bars: 10 µm.
Figure 3—figure supplement 2
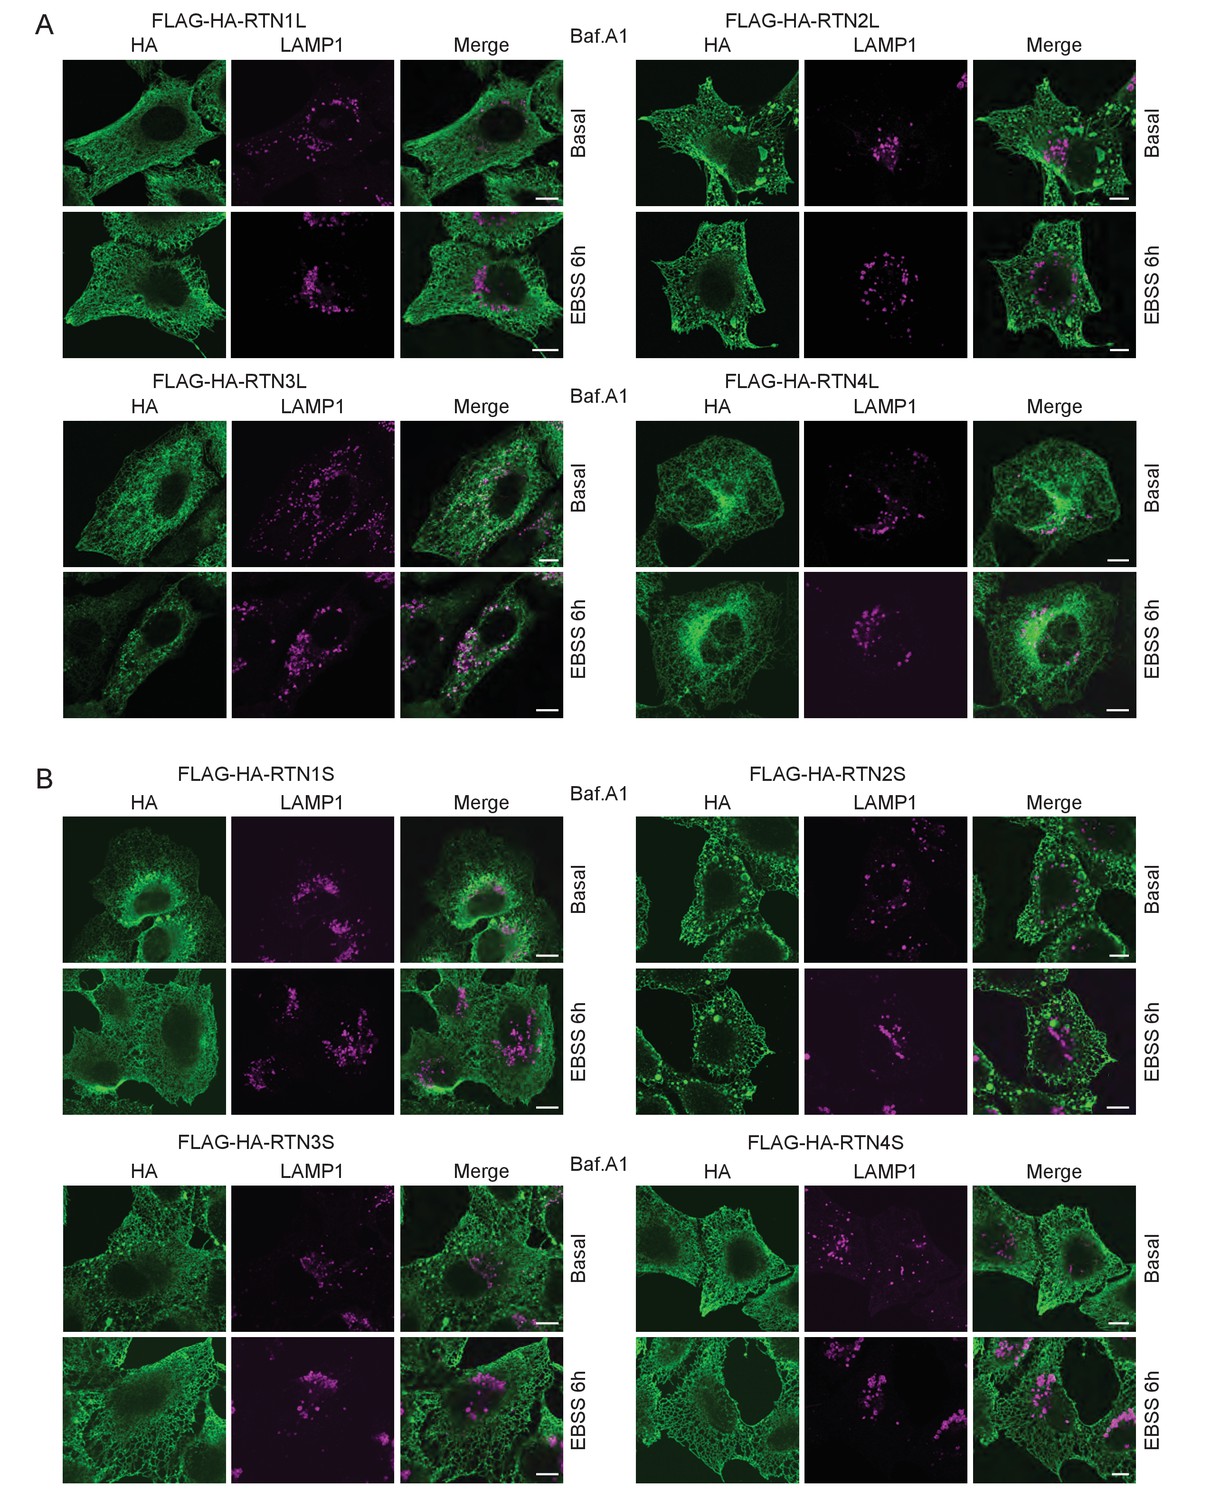
ER tubule fragments are delivered to lysosomes after autophagy induction.
(A) Immunofluorescence of HA and LAMP1 in U2OS TRex RTN1-4L and (B) the RTN1-4S cells after 24 hr treatment with 1 µg/ml of doxycycline. Cells were kept in standard growing condition (DMEM with 10% FBS) or starved for 6 hr in EBSS. RTNs were monitored using anti HA antibody, while lysosomes were visualized using LAMP1 antibody. Bafilomycin A1 was added at the final concentration of 200 ng/ml. Scale bars: 10 µm.
Figure 3—figure supplement 3
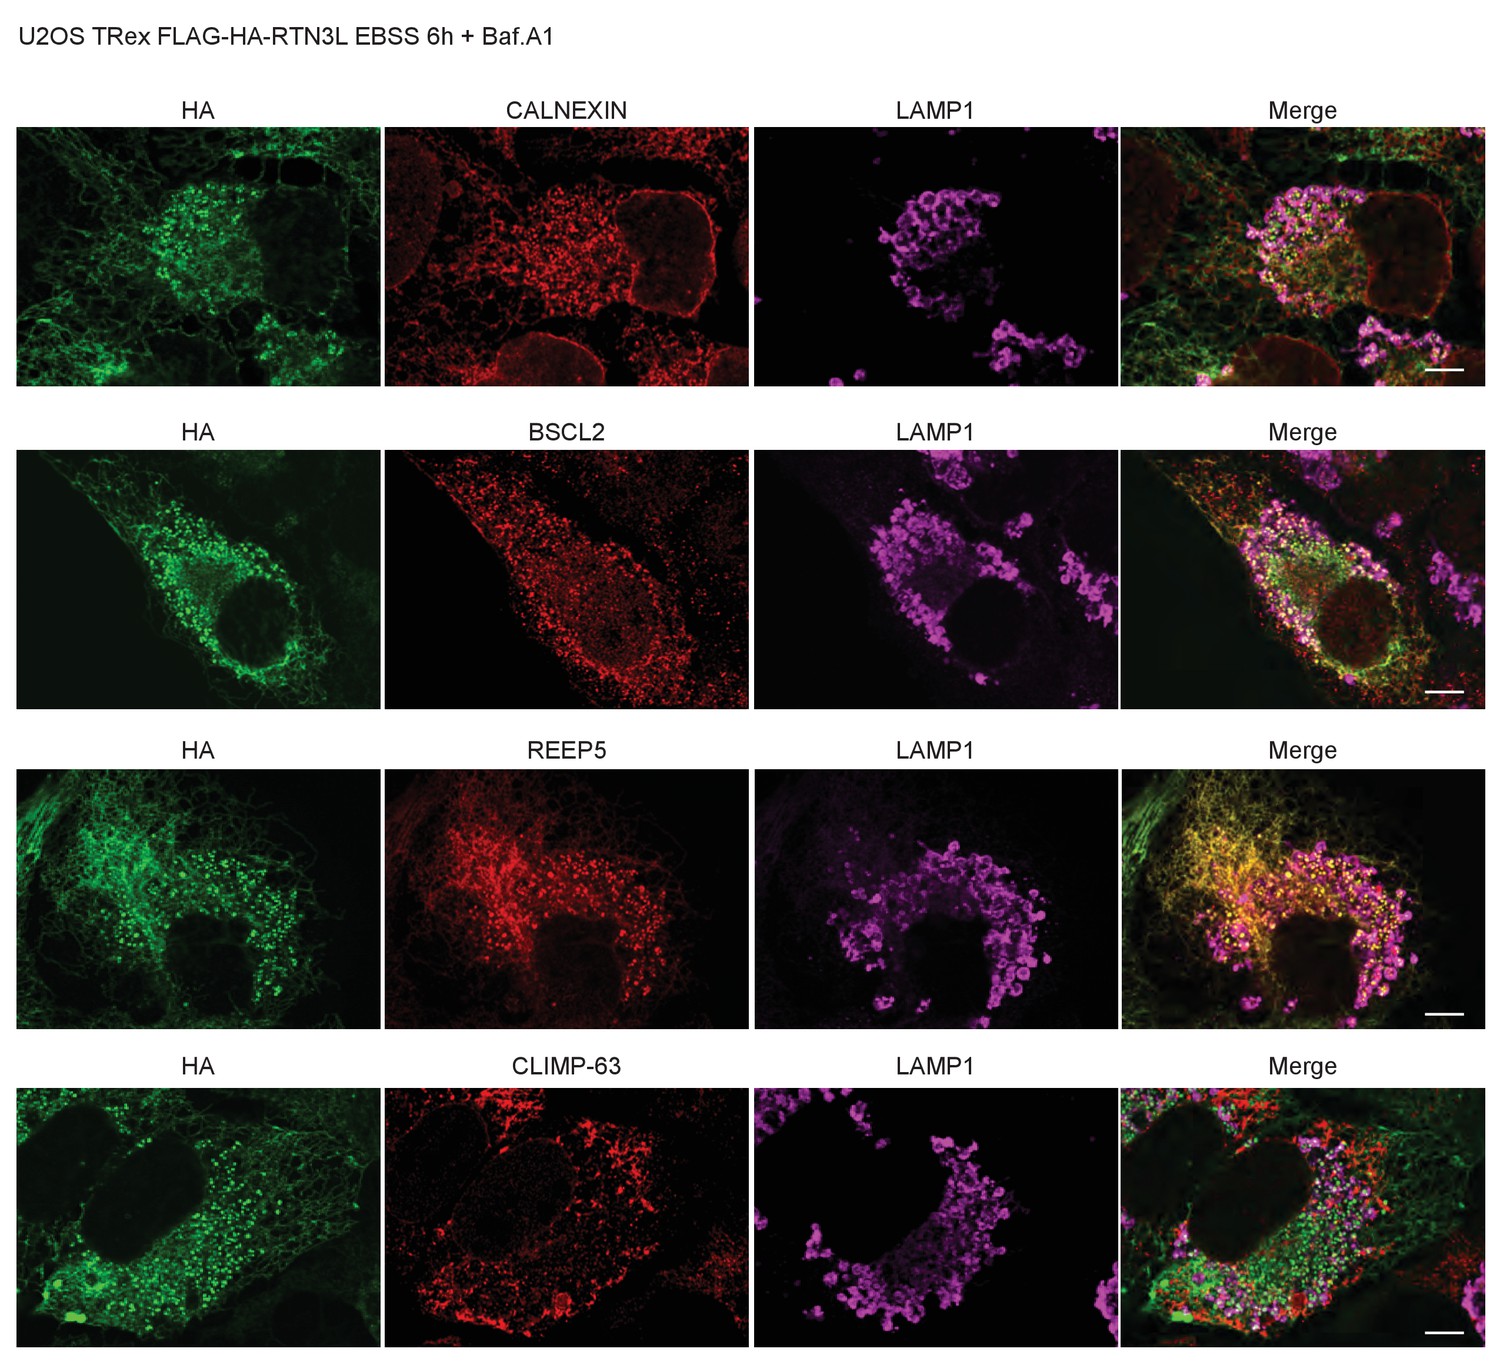
RTN3L fragments ER tubules and mediates their delivery to lysosomes.
Immunofluorescence of HA and endogenous CALNEXIN, BSCL2, REEP5, CLIMP-63 and LAMP1 in U2OS TRex RTN3L cells after 24 hr treatment with 1 µg/ml of doxycycline and 6 hr EBSS starvation in the presence of Bafilomycin A1, 200 ng/ml. Scale bars: 10 µm.
Figure 3—figure supplement 4
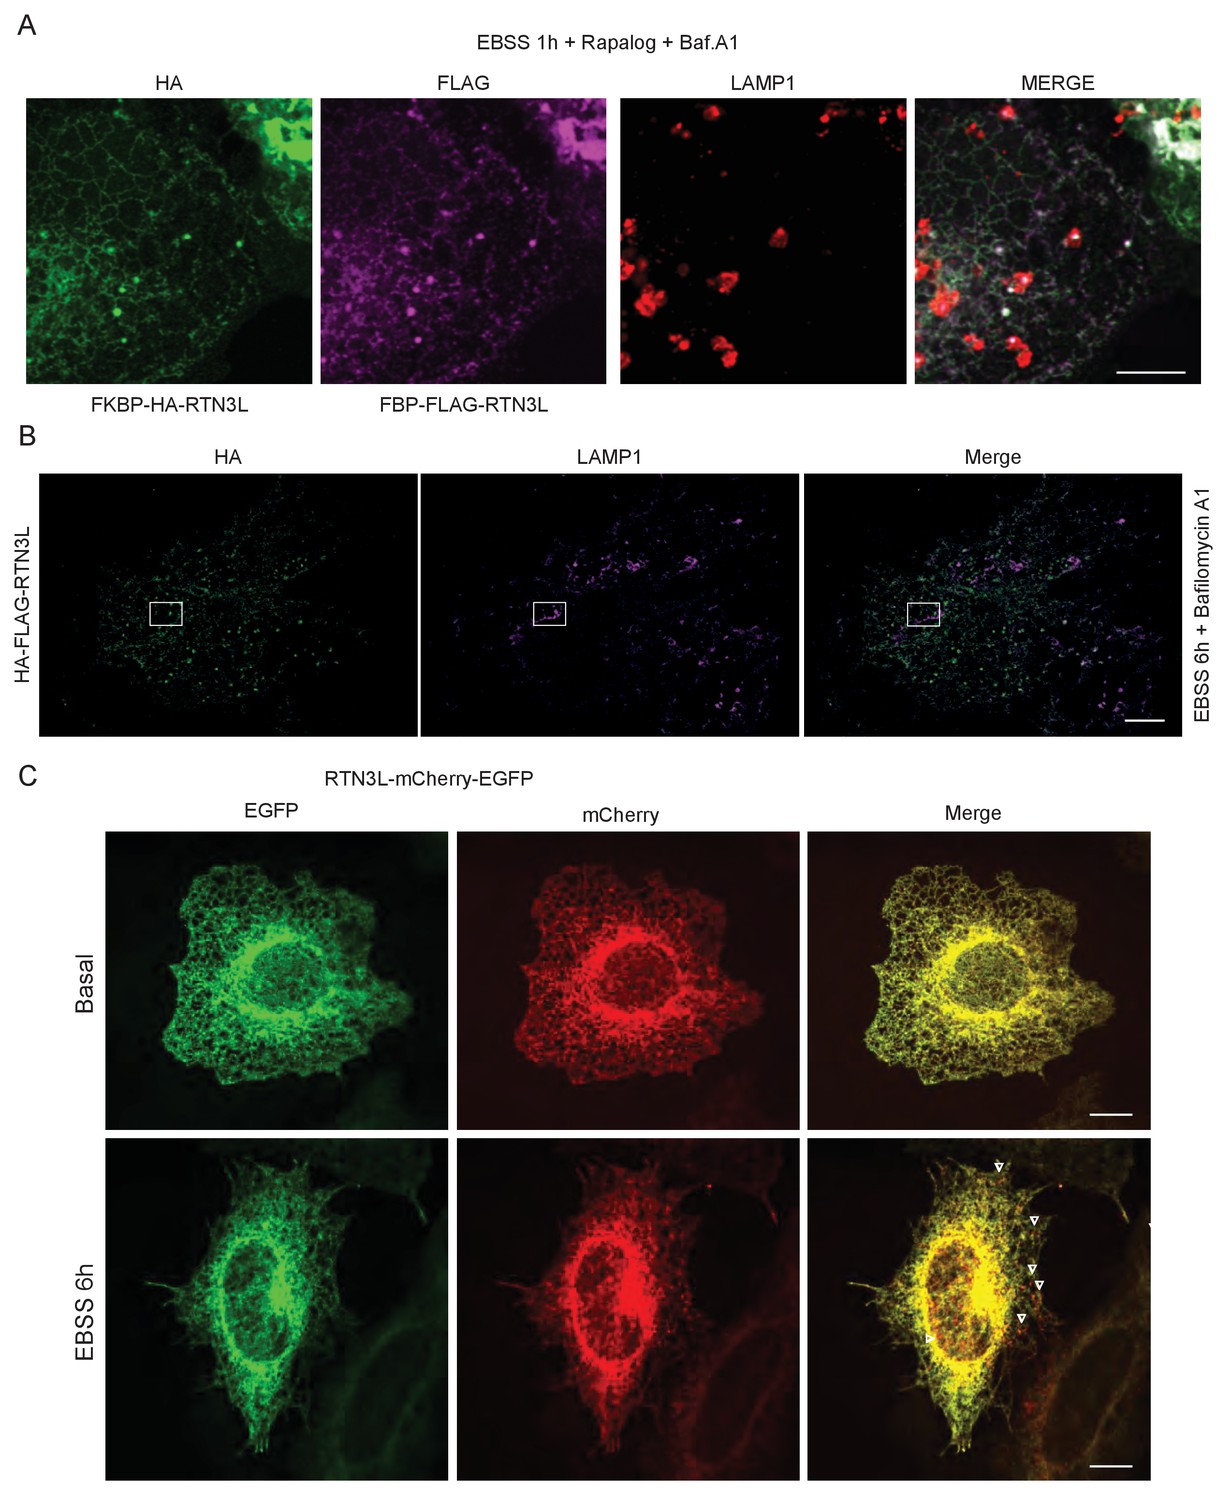
RTN3L is degraded via lysosomes during starvation.
(A) U2OS TRex transiently expressing 2XFKBP-HA-RTN3L and FRB-FLAG-RTN3L. 24 hr after transfection, 500 nM Rapalog was added for 2 hr and cells were triple stained with HA, FLAG and LAMP1 after 1 hr EBSS treatment plus 200 ng/ml Bafilomycin A1. Scale bars: 10 µm. (B) Super-resolution fluorescence microscopy (dSTORM) of ER fragments in U2OS TRex FLAG-HA-RTN3L cells stained with anti HA and anti LAMP1 antibodies after 6 hr starvation with EBSS plus Bafilomycin A1, 200 ng/ml. Scale bar 5 µm. The white box indicates the magnification reported in Figure 3B. (C) HeLa TRex mCherry-EGFP-RTN3L cells were treated with 1 µg/ml doxycycline for 24 hr and starved with EBSS for 6 hr in the absence of Bafilomycin A1. Scale bars: 10 µm.
Figure 3—figure supplement 5

ER membranes and RTN3L are present in autolysosomes.
U2OS RTN3L cells were nutrient starved in EBSS for 6 hr in the presence of Bafilomycin A1, 200 ng/ml. (A) Immuno-gold labelling of cryo-sections using antibodies against the KDEL peptide. (B) Immuno-gold labelling for the HA tag peptide. (C) Double immuno-gold labelling against CD63 (large dots, diameter 15 nm) and the HA tag (small dots, diameter 10 nm). AL, autolysosome; N, nucleus; ER, endoplasmic reticulum; MVB, multi-vesicular bodies; A, autophagosome. Scale bar 500 nm.
Figure 4 with 1 supplement
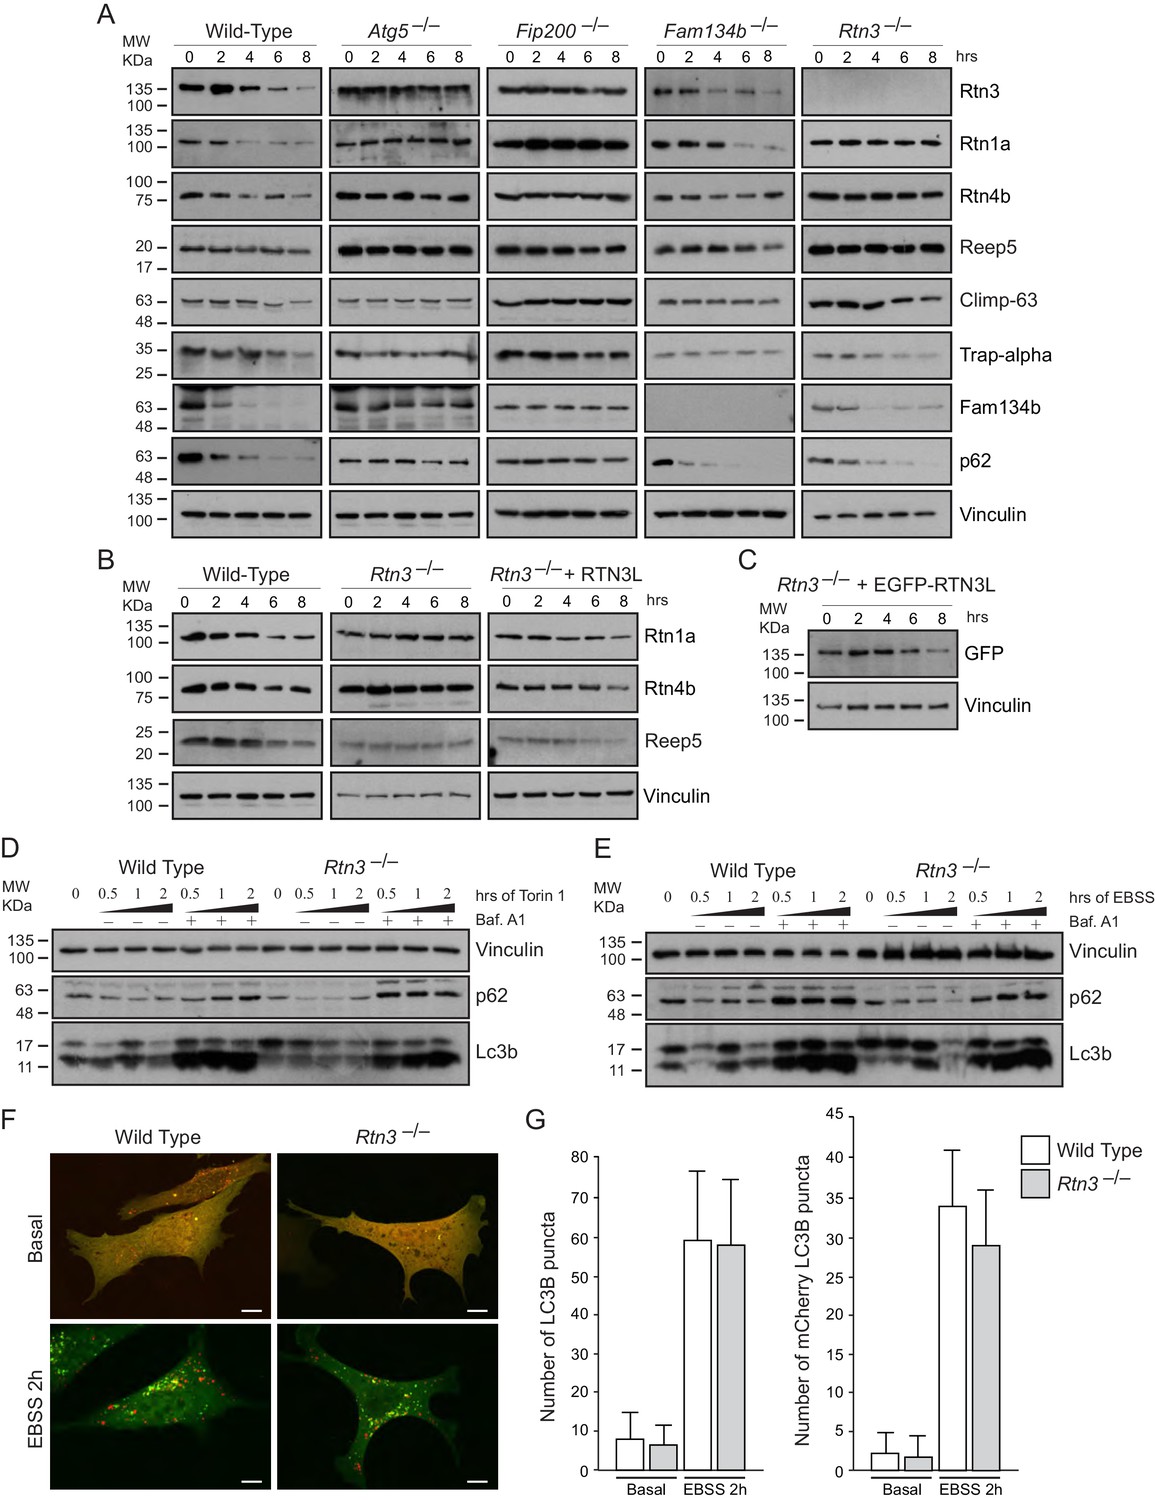
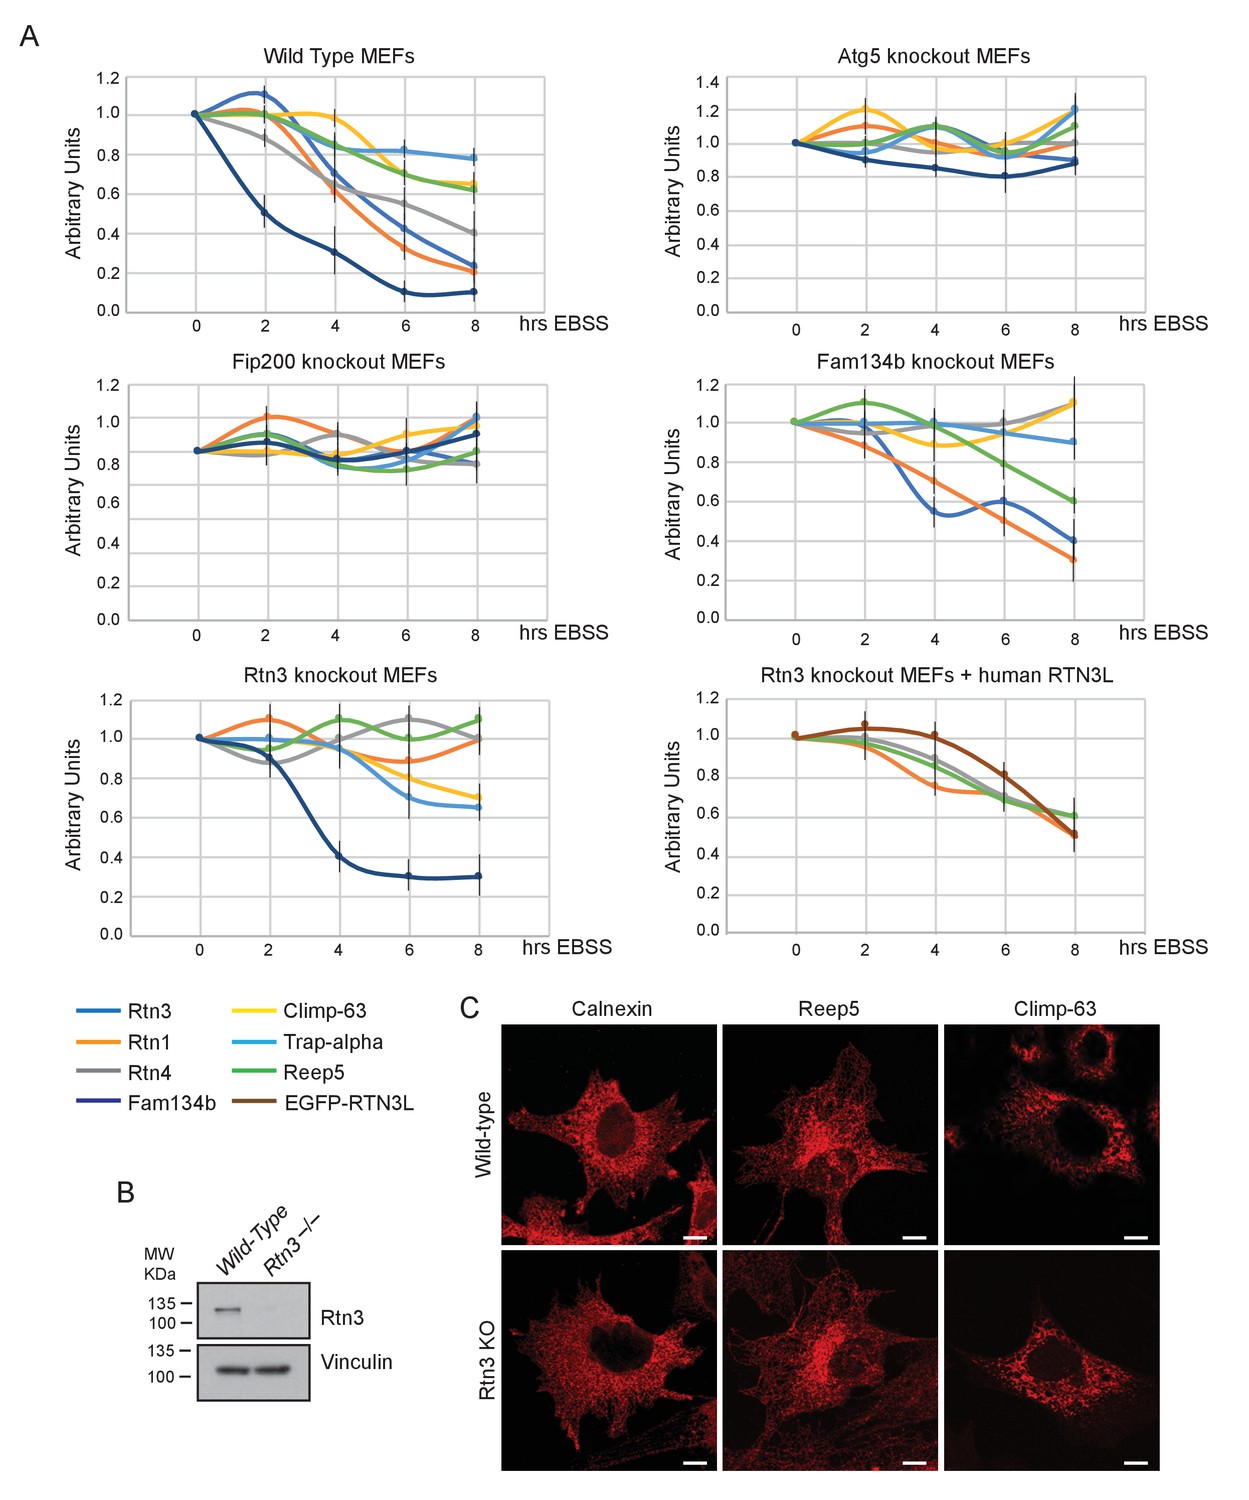
RTN3 absence impairs ER tubules turnover but not macro-autophagy flux.
(A) Western blot analysis of ER protein turnover in wild-type, Atg5–/–, Fip200–/–, Fam134b–/– and Rtn3–/– MEFs. Cells were starved with EBSS for the indicate time in the presence of 100 µM cicloheximide. SQSTM1 (p62) has been used as positive control for autophagy induction. (B) Western blot analysis of ER tubules markers in wild-type, Rtn3–/– MEFs and Rtn3–/– MEFs reconstituted with the human EGFP-RTN3L. (C) Western blot for GFP in Rtn3–/– MEFs transfected with human EGFP-RTN3L. (D,E) Western blot analysis of Lc3b and p62 in wild-type and Rtn3–/– MEFs. Cells were treated with 250 nM Torin1 (D) or EBSS (E) in the presence or absence of Bafilomycin A1, 200 ng/ml, for the indicated time. (F) Representative confocal imagines of wild-type and Rtn3 knockout MEFs, transfected with mCherry-EGFP-LC3B, in standard conditions (DMEM with 10% FBS) and after 6 hr EBSS treatment. Scale bars: 10 µm. (G) Quantification of LC3B positive autophagy puncta in wild-type and Rtn3–/– MEFs transfected with mCherry-EGFP-LC3B. Cells were grown in standard conditions or treated with EBSS for 2 hr. Number of cells >50 for each condition. Data are representative of three independent biological replicates. Error bars indicate s.d. No significant differences were detected between wild-type and Rtn3–/– MEFs.
Figure 4—figure supplement 1
Rtn3 absence affects ER tubules degradation but not macro-autophagy or ER morphology.
(A) Densitometry analysis of Western Blot bands represented in Figure 4A–C. Values represent the average of three experiments. (B) Western blot for Rtn3 protein in wild type and Rtn3 knockout MEFs. (C) Immunofluorescence of Calnexin, Reep5 and Climp-63 in wild-type and Rtn3 knockout MEFs. Scale bars: 10 µm.
Figure 5 with 3 supplements
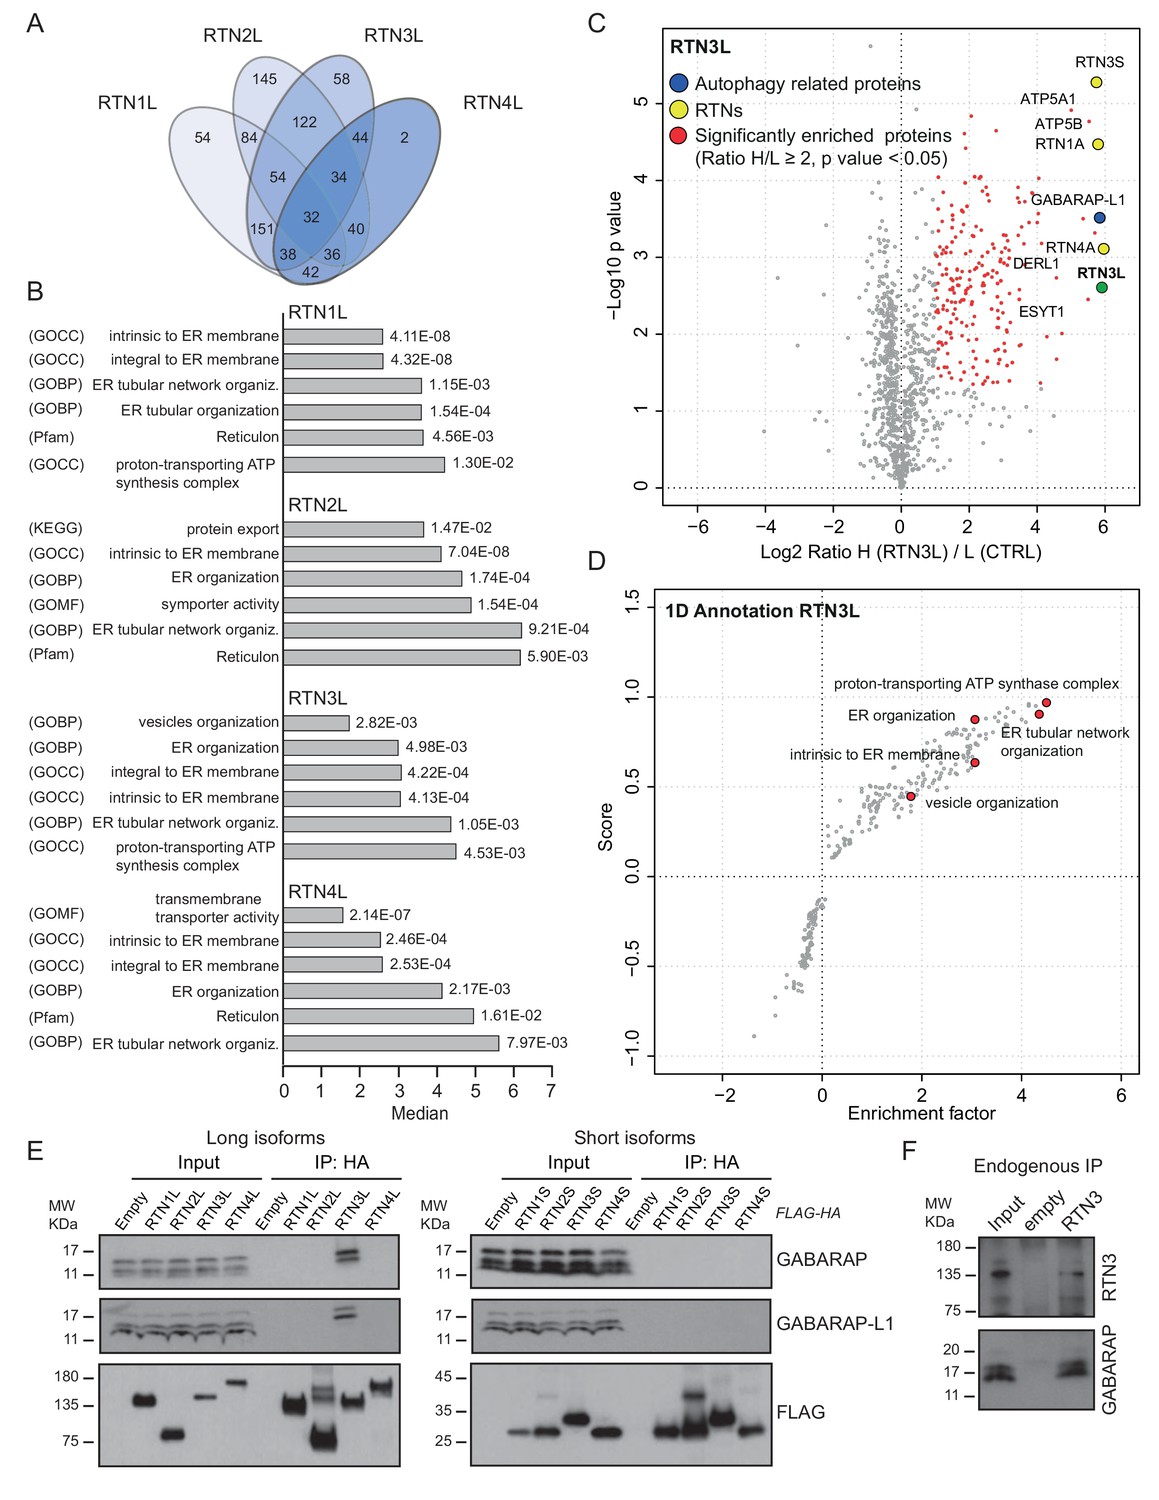
RTN3 interacts with the autophagy modifiers.
(A) Venn diagrams of the interactors of the four RTNs. Numbers represent the identified peptides significantly enriched in three IP and mass spectrometry replicates for each RTN. (B) Annotation enrichment analysis of the interactors of long RTN1-4 isoforms. Bars represent the significantly enriched gene ontology biological process (GOBP), the gene ontology cellular components (GOCC), the gene ontology molecular function (GOMF), the over-expressed pathways (KEGG) and the domain enrichment (Pfam). The numeric value on the right side of the bar shows the Benjamini-Hochberg FDR value. (C) Scatter-plot for 1D annotation enrichment analysis of RTN3L interactor partners significantly enriched in three different IPs. (D) Volcano-plot for RTN3L SILAC-based interactome. Peptides with and Log2 Ratio H/L ≥1 and –Log10 p value > 1.3 are labeled in red. Three biological replicates were analyzed. (E) Co-IP of endogenous GABARAP and GABARAP-L1 with over-expressed long and short isoforms of RTN1-4. Over-expression was induced for 24 hr in U2OS TRex stable cell lines using 1 µg/ml of doxycycline. Bafilomycin A1 was added at the final concentration of 200 ng/ml for 2 hr. (F) Endogenous Co-IP of RTN3 with GABARAP in A549 cells. The ‘empty’ lane represents unconjugated beads. Bafilomycin A1, 200 ng/ml, was added for 2 hr.
-
Figure 5—source data 1
IP-interactome of RTN1, RTN2, RTN3 and RTN4 long isoforms.
IP-interactome analyses were performed using the SILAC-labeling strategy in U2OS after 24-hr treatment with 1 µg/ml of doxycycline. Bafilomycin A1, 200 ng/ml, was added for 2 hr. Peptides with Log2 (Heavy/Light [H/L]) ratios ≥1 and a p value ≤ 0.05 were considered significantly enriched.
- https://doi.org/10.7554/eLife.25555.020
-
Figure 5—source data 2
IP-interactome of RTN1, RTN2, RTN3 and RTN4 short isoforms.
IP-interactome analyses were performed using the SILAC labeling strategy in U2OS after 24-hr treatment with 1 µg/ml of doxycycline. Bafilomycin A1, 200 ng/ml, was added for 2 hr. Peptides with Log2 (Heavy/Light [H/L]) ratios ≥ 1 and a p value ≤ 0.05 were considered significantly enriched.
- https://doi.org/10.7554/eLife.25555.021
Figure 5—figure supplement 1

Interactome analysis of RTN1-4L.
(A) Schematic representation for the SILAC-based mass spectrometric analysis of RTNs interactomes. (B) Scatter plot for 1D annotation enrichment analysis of RTN1L, RTN2L and RTN4L interactors significantly enriched in three different IP analyzed by mass spectrometry. (C) Volcano-plot for RTN1L, RTN2L and RTN4L SILAC-based interactomes. Interacting partners of each RTNs with and Log2 Ratio H/L >1 and –Log10 p value > 1.3 are labeled in red. Each volcano-plot represents three independent experiments.
Figure 5—figure supplement 2
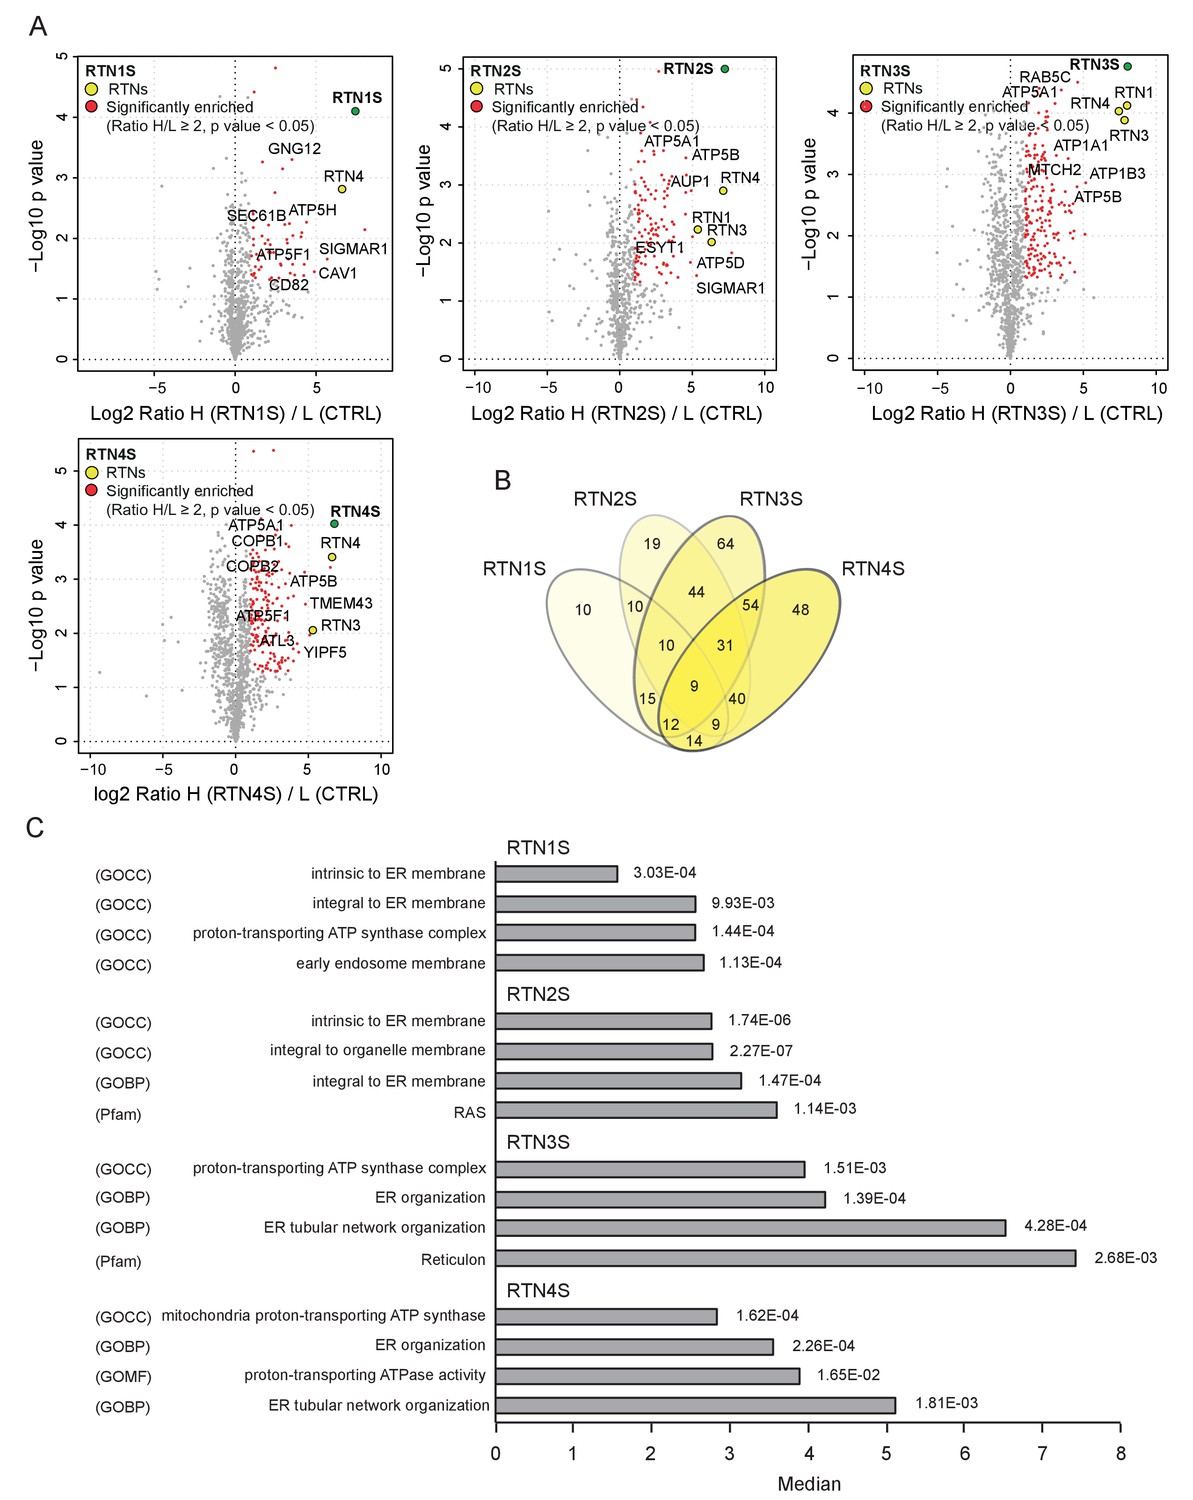
Interactome analysis of RTN1-4S.
(A) Volcano-plot for RTN1-4 short isoforms SILAC-based interactomes. Interactors of each RTNs with and Log2 Ratio H/L >1 and –Log10 p value > 1.3 are labeled in red. Each volcano-plot represents three independent experiments. (B) Venn diagrams of the interacting partners for the four RTNs. Numbers represent the identified proteins significantly enriched in three IP and mass spectrometry replicates for each RTN. (C) Annotation enrichment analysis of RTN1-4S interacting partners. The bars represent the significantly enriched gene ontology biological process (GOBP), the gene ontology cellular components (GOCC), the gene ontology molecular function (GOMF) and the domain enrichment (Pfam). The numeric value on the right side of the bar shows the Benjamini-Hochberg FDR.
Figure 5—figure supplement 3
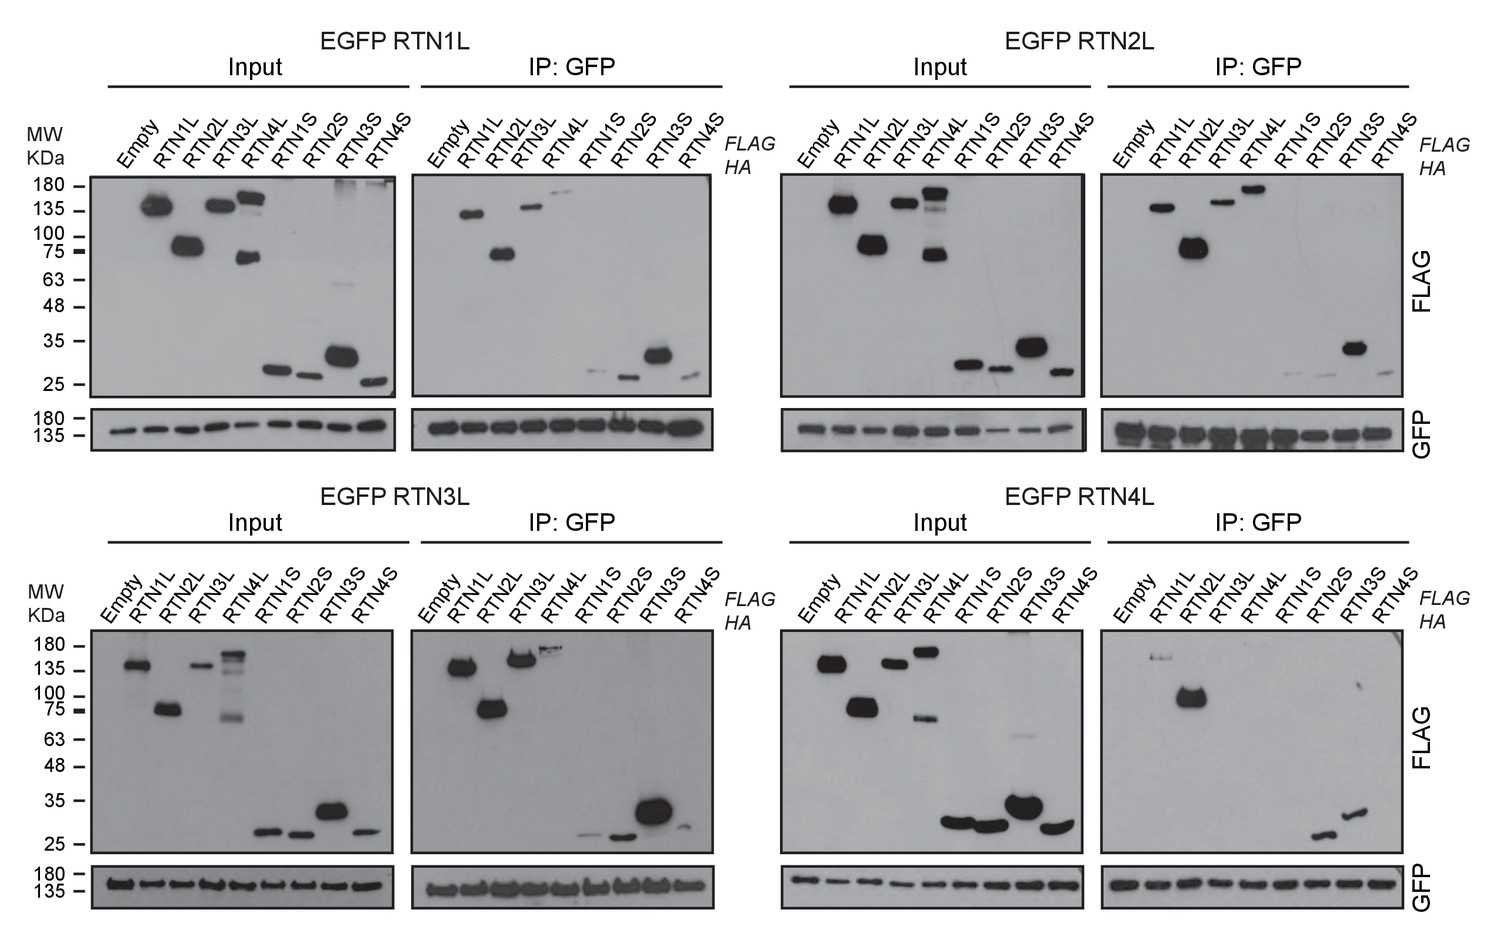
RTN1-4 strongly interact amongst themselves.
Co-immuno-precipitation of RTN1-4L indicates the interactions of each RTN with long and short isoforms of the other family members. Proteins were co-overexpressed in HEK293T cells for 24 hr.
Figure 6 with 3 supplements
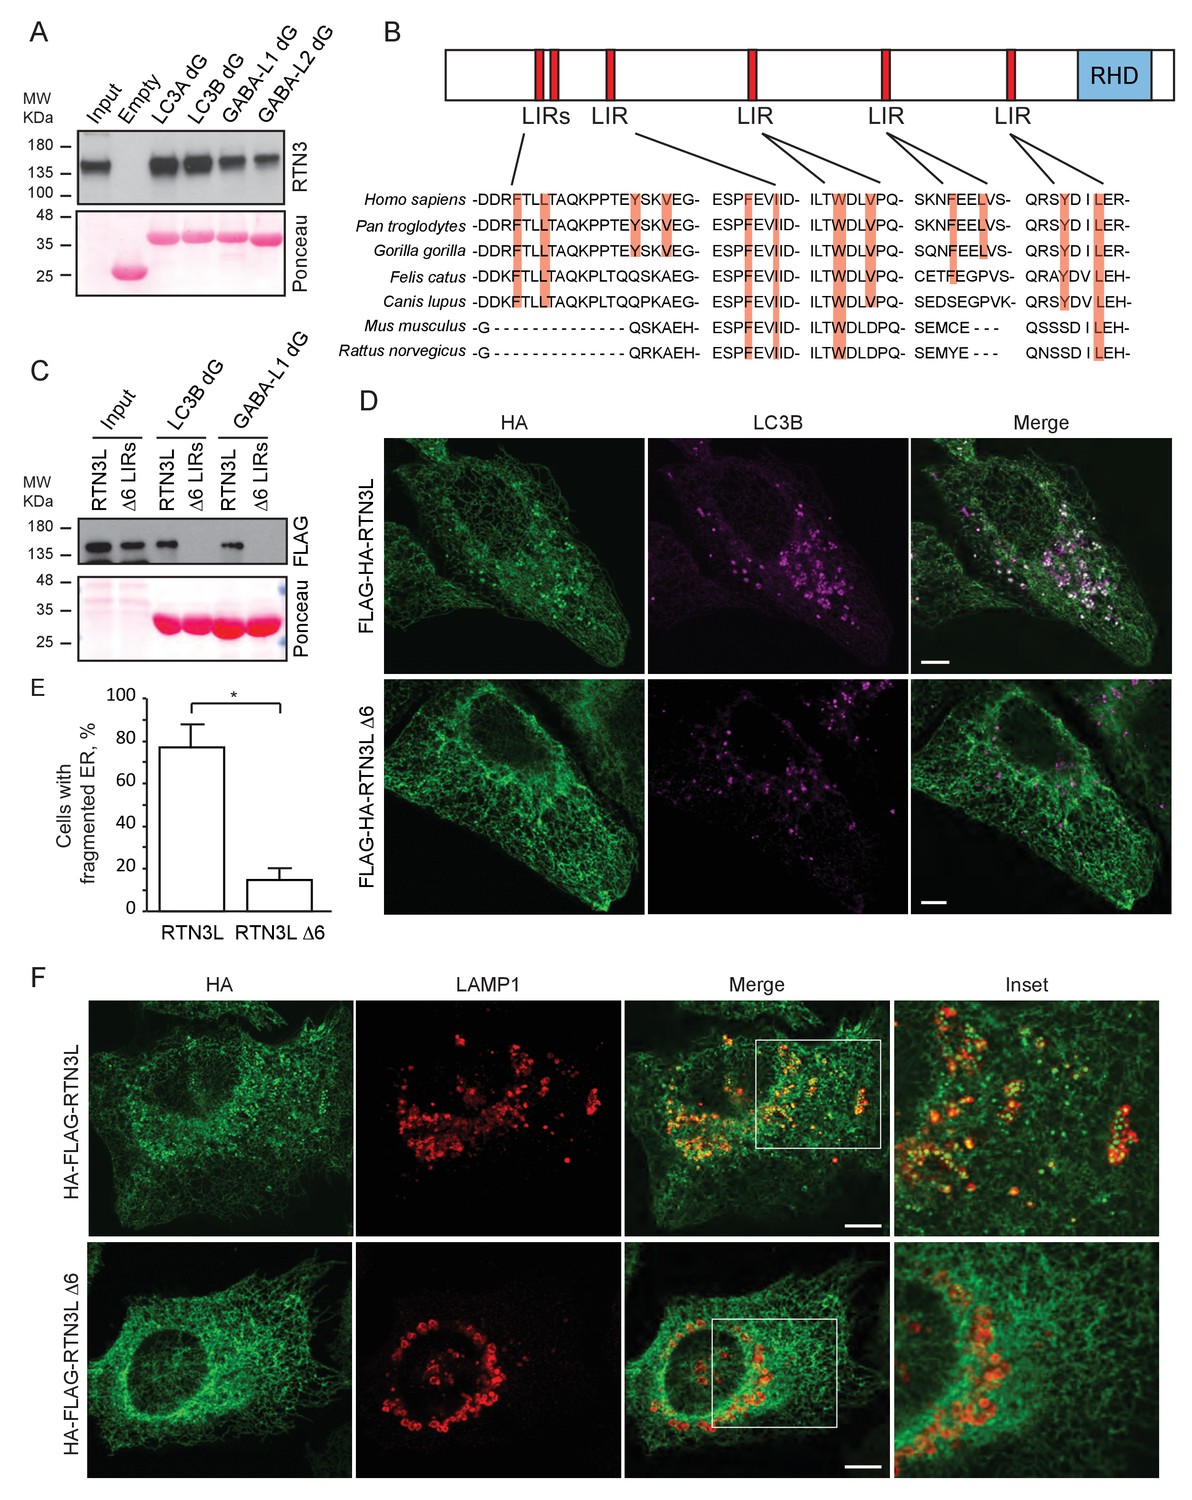
RTN3 LIR motifs are required for ER tubules fragmentation.
(A) A549 cell lysates were added to beads with immobilized GST fusion LC3-like modifiers: GST, GST-LC3A, GST-LC3B, GST-GABARAP-L1, GST-GABARAP-L2), followed by WB using an antibody against endogenous RTN3. (B) Domain architecture of RTN3L and alignment of the LIR motifs. Blue: reticulon homology domain (RHD), red: LC3-interacting region (LIR). (C) RTN3L lacking all six LIR domains (∆6) fails to bind to GST fusion LC3-like modifiers when over-expressed in HEK-293T cells. (D) Immunofluorescence of HA and LC3B in U2OS TRex FLAG-HA-RTN3L and FLAG-HA-RTN3L∆6LIRs after 24 hr treatment with 1 µg/ml of doxycycline and starved for 6 hr with EBSS plus Bafilomycin A1, 200 ng/ml. RTN3L was monitored using an anti HA antibody, while autophagy induction was visualized using anti-LC3B antibody. Scale bars: 10 µm. (E) Quantification of cells presenting at least one ER tubule fragment after 6 hr starvation with EBSS plus Bafilomycin A1, 200 ng/ml. Number of cells >500 for each condition. Data are representative of three independent biological experiments. *p<0.01. Error bars represent s.d. (F) Immunofluorescence of HA and LAMP1 in U2OS TRex FLAG-HA-RTN3L or FLAG-HA-RTN3L∆6LIRs cells induced 24 hr with 1 µg/ml of doxycycline and subsequently starved for 6 hr with EBSS plus Bafilomycin A1, 200 ng/ml. RTN3L was monitored using an anti-HA antibody, while lysosomes are visualized using anti-LAMP1 antibody. Scale bars: 10 µm.
Figure 6—figure supplement 1
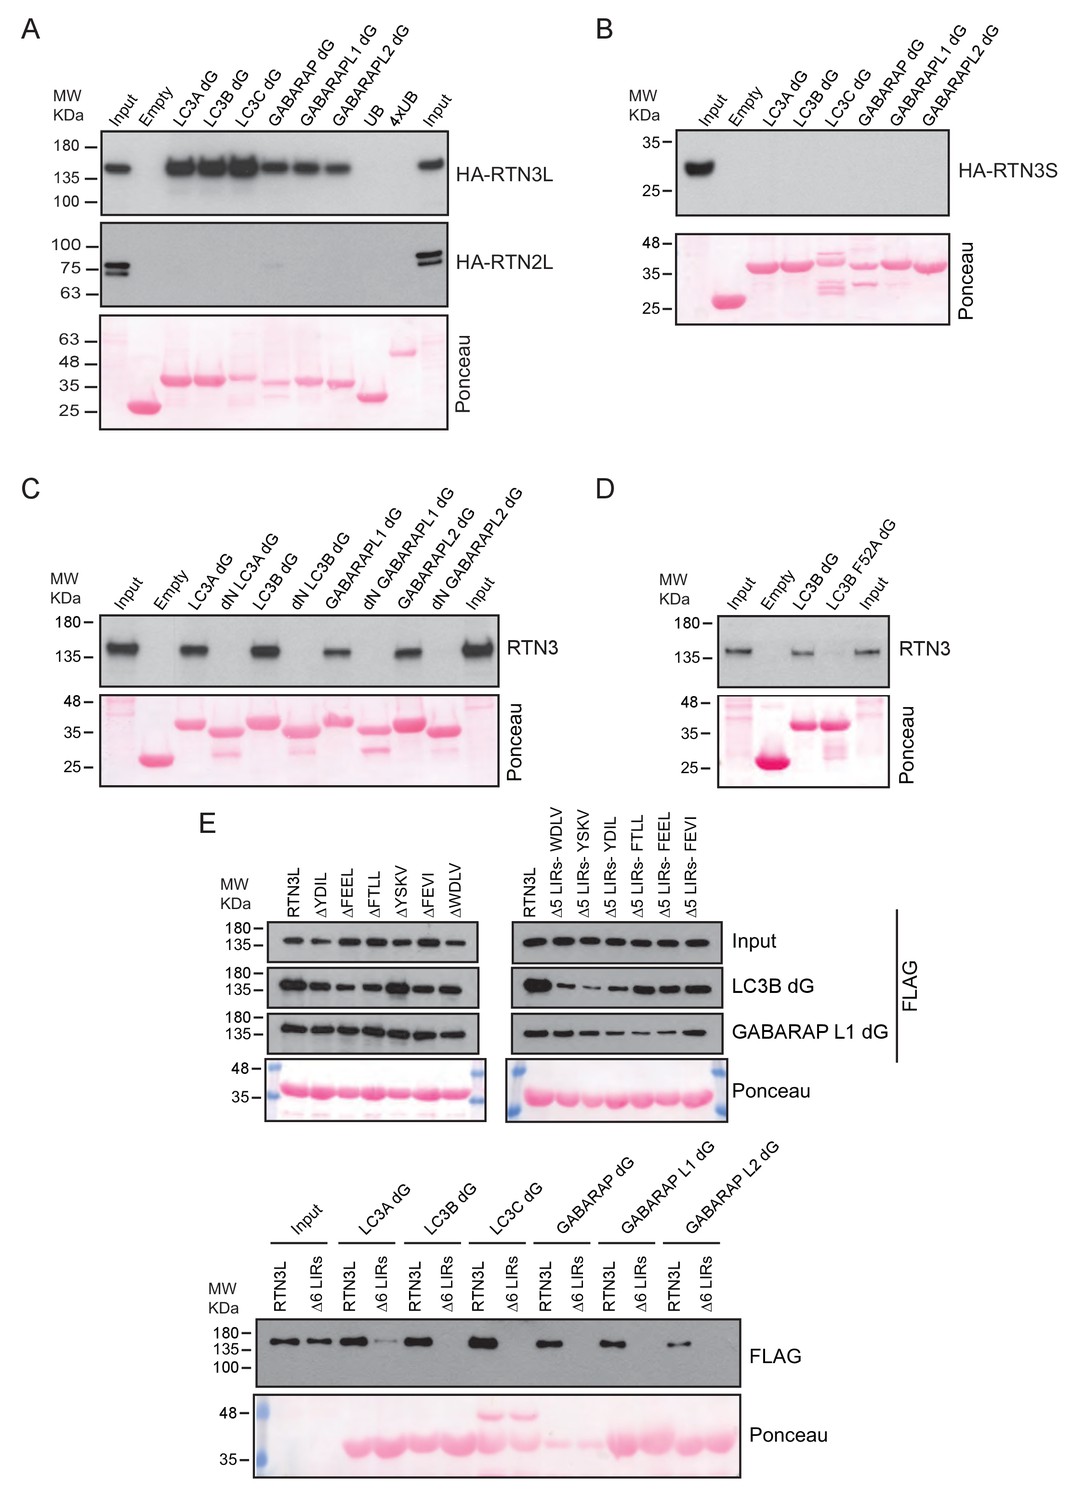
RTN3L directly binds to the LC3s/GABARAPs modifiers.
(A,B) HEK293T cells were transfected with the HA tagged RTN3L and RTN2L (A) and RTN3S (B). Cell lysates were added to beads with immobilized GST-fusion LC3-like modifiers (GST, GST-LC3A, GST-LC3B, GST-LC3C, GST-GABARAP, GST-GABARAP-L1, GST-GABARAP-L2, GST-Ub, GST-4XUb), followed by WB using an antibody against HA tag. (C) A549 cell lysates were added to beads with immobilized GST-fusion LC3-like modifiers or the LC3 like modifiers lacking the unique N-Terminus, followed by WB using an antibody against endogenous RTN3. (D) A549 cell lysates were added to beads with GST-LC3B or GST-LC3BF52A-V53A mutant and followed by WB using an antibody against endogenous RTN3. (E) HEK293T were transfected with the FLAG tagged RTN3L with mutation in one, five or six LIR domains mutated. Cell lysates were added to beads with immobilized GST-fusion LC3-like modifiers, followed by WB using an antibody against FLAG tag.
Figure 6—figure supplement 2

LIR motifs are required to deliver RTN3L to lysosomes.
(A,B) Immunofluorescence of HA, GABARAP-L1 (A) and LC3B (B) and LAMP1 in U2OS TRex FLAG-HA-RTN3L and FLAG-HA-RTN3L∆6LIRs cells after 24-hr treatment with 1 µg/ml of doxycycline. Cells were kept in standard growing condition (DMEM with 10% FBS) or starved with EBSS for 6 hr. RTN3L was monitored using anti HA antibody, while autophagy induction is monitored using GABARAP-L1 (A) and (B) lysosomes were visualized using anti-LAMP1 antibody. Bafilomycin A1 was added at a final concentration of 200 ng/ml. Scale bars: 10 µm. (C) HeLa TRex mCherry-EGFP-RTN3 or mCherry-EGFP-RTN3∆6LIRs were treated with 1 µg/ml doxycycline for 24 hr and starved with EBSS for 6 hr in the absence of Bafilomycin A1. Scale bars: 10 µm. (D) Endogenous labeling of CALNEXIN and REEP5 in U2OS TRex cells and in U2OS TRex cells after RTN3L∆6LIRs over-expression. Scale bars: 10 µm.
Figure 6—figure supplement 3
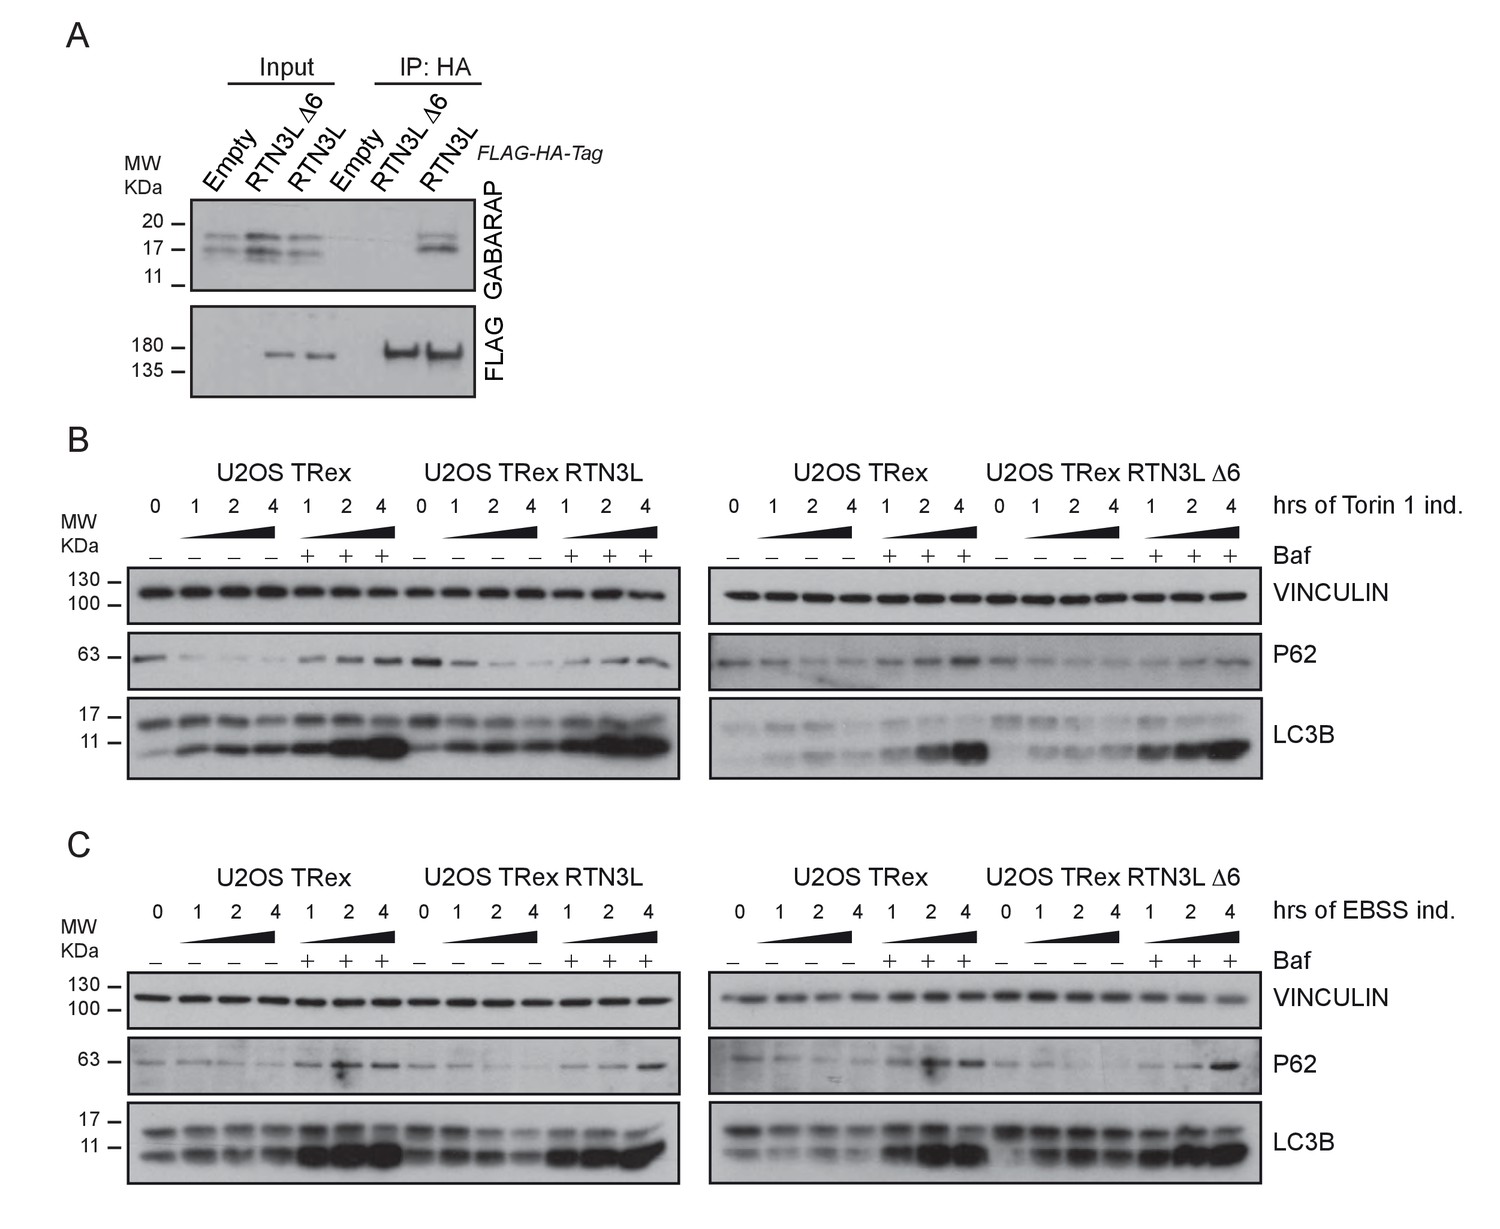
RTN3L over-expression does not affect autophagy flux.
(A) Co-immuno-precipitation of endogenous GABARAP with RTN3L and RTN3L∆6LIRs in U2OS TRex cells. (B,C) Western blot analysis of LC3B lipidation and p62 degradation in U2OS TRex FLAG-HA-RTN3L and FLAG-HA-RTN3L∆6LIRs cells after Torin1, 250 nM (B) or EBSS (C) treatment for the indicated time.
Figure 7
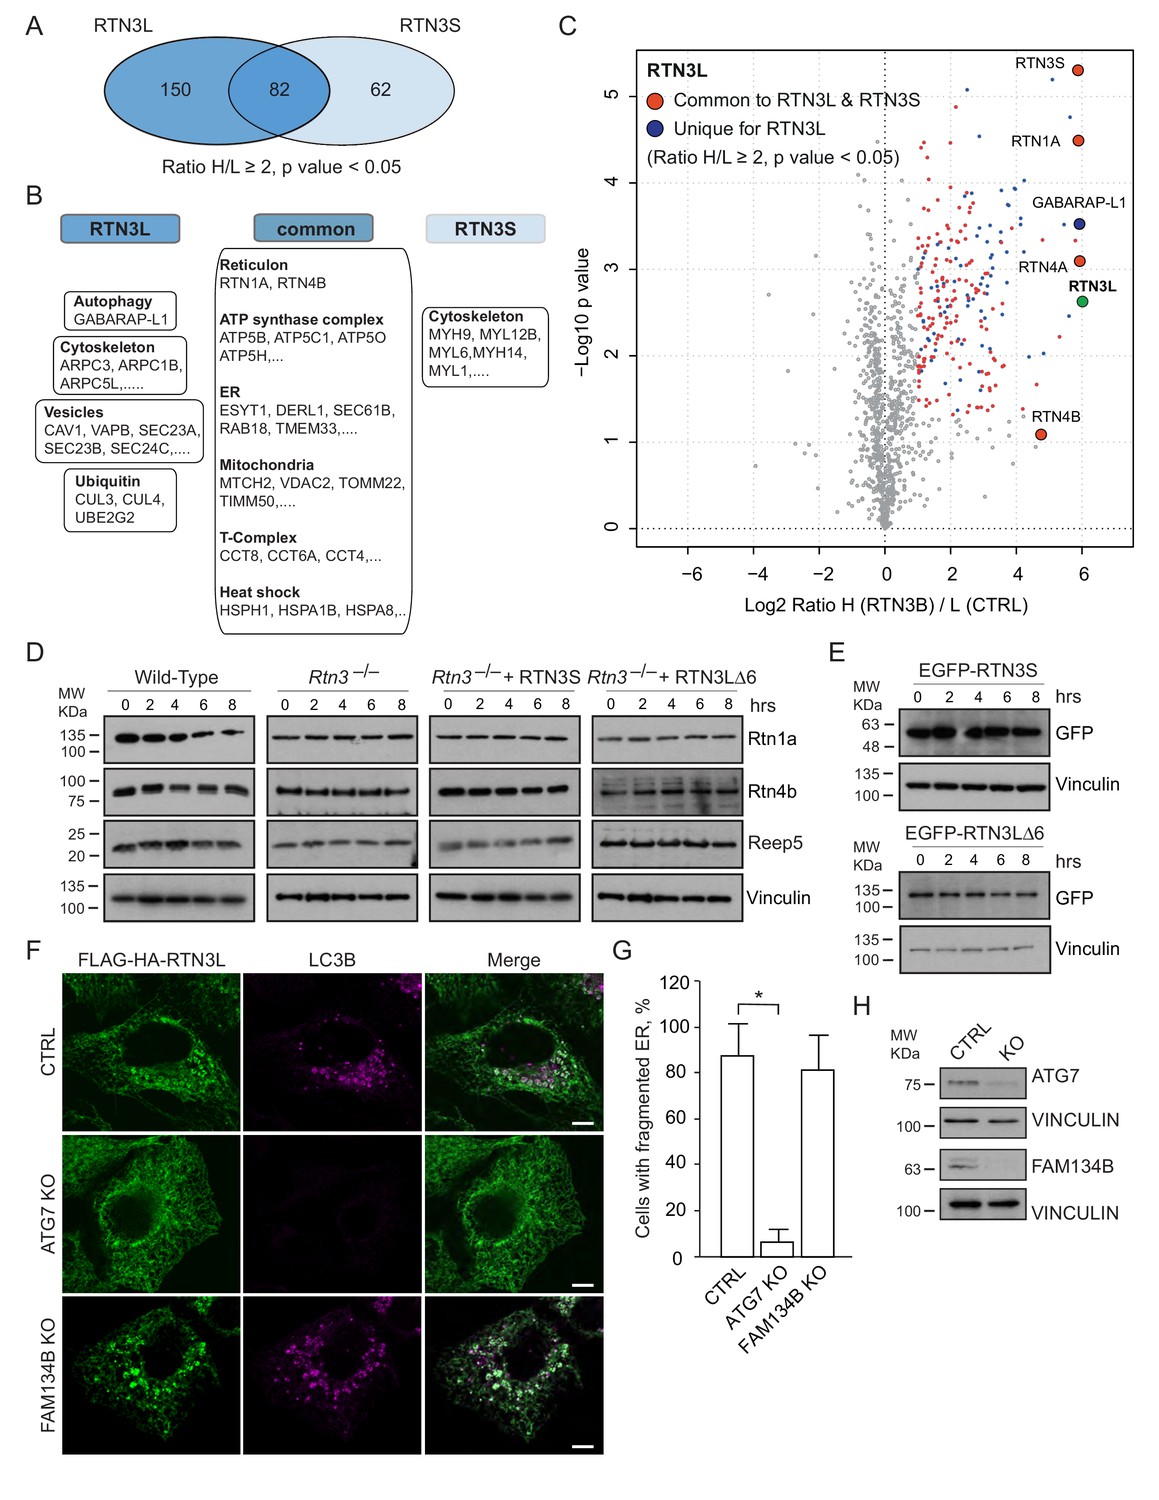
Autophagy machinery influences RTN3 ability to fragment ER tubules.
(A) Venn diagrams of the interacting partners for RTN3L and RTNS. Numbers represent the identified proteins significantly enriched in three IP and mass spectrometry replicates for each isoform. (B) Schematic representation of the common and unique significantly enriched peptides for RTN3L and RTN3S. (C) Volcano-plot for RTN3L SILAC-based interactome. The interactors partners of RTN3L with and Log2 Ratio H/L >1 and –Log10 p value > 1.3 are labeled in dark blue. The common peptides between RTN3L and RTN3S, with and Log2 Ratio H/L >1 and –Log10 p value > 1.3, are labeled in red. Data represent three independent biological replicates. (D) Western blot analysis of ER tubules markers in wild-type, Rtn3–/– MEFs and Rtn3–/– MEFs reconstituted with the human EGFP-RTN3S or EGFP-RTN3L∆6LIRs. (E) Western blot for GFP in Rtn3–/– MEFs transfected with human EGFP-RTN3S or EGFP-RTN3L∆6LIRs. (F) Immunofluorescence of HA and LC3B in U2OS TRex FLAG-HA-RTN3L; FAM134B or ATG7 knockout cells induced for 24 hr with 1 µg/ml of doxycycline and starved for 6 hr with EBSS plus Bafilomycin A1, 200 ng/ml. RTN3L was monitored using anti HA antibody, while autophagy induction was visualized using anti-LC3B antibody. Scale bars: 10 µm. (G) Quantification of cells presenting ER tubule fragments after 6 hr starvation with EBSS plus Bafilomycin A1, 200 ng/ml. Number of cells >500 for each condition. Data are representative of three independent biological replicates. *p<0.01. Error bars indicate s.d. (H) Western blot analysis for ATG7 and FAM134B protein level in U2OS TRex FLAG-HA-RTN3L cells after ATG7 or FAM134B gene knockout by CRISPR-CAS9 technology.
-
Figure 7—source data 1
Comparison of the IP-interactome of RTN3L and RTN3S.
Comparison of the IP-interactomes analyses were performed using the SILAC-labeling strategy in U2OS after 24 hr treatment with 1 µg/ml of doxycycline. Bafilomycin A1, 200 ng/ml, was added for 2 hr. Peptides with Log2 (Heavy/Light [H/L]) ratios ≥1 and a p value ≤ 0.05 were considered significantly enriched.
- https://doi.org/10.7554/eLife.25555.030
Figure 8 with 1 supplement
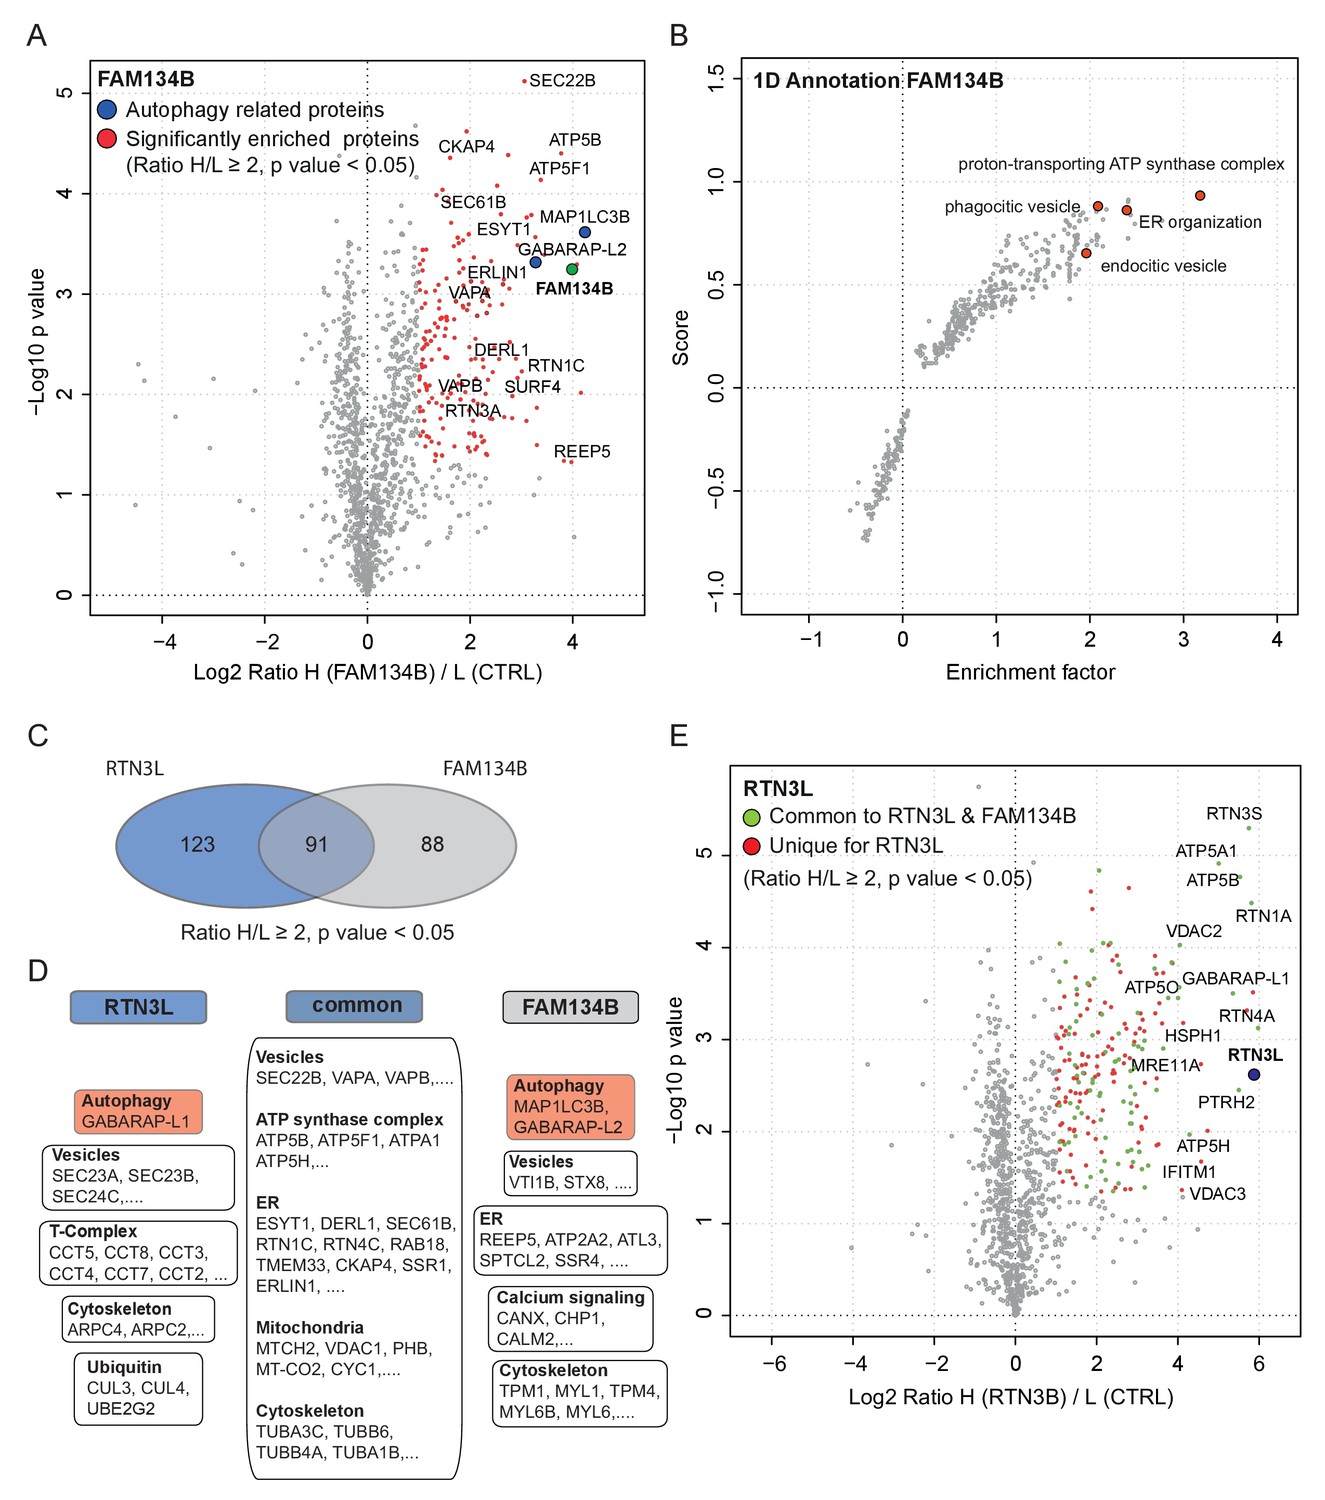
Similarities and differences between RTN3L and FAM134B.
(A) Volcano-plot for FAM134B SILAC-based interactome. Peptides with and Log2 Ratio H/L >1 and –Log10 p value >1.3 are labeled in red. Data represent three biological replicates. (B) Scatter plot for 1D annotation enrichment analysis of FAM134B interacting partners significantly enriched in three different IP analyzed by mass spectrometry. (C) Venn diagrams of RTN3L and FAM134B interactors. Numbers represent the identified peptides significantly enriched in three IP and mass spectrometry replicates for the two baits. (D) Schematic representation of the common and unique interacting partners of RTN3L and FAM134B interactors (E) Volcano-plot for RTN3L SILAC-based interactome. RTN3L interactors with and Log2 Ratio H/L >1 and –Log10 p value >1.3 are labeled in dark blue. The common peptides between RTN3L and FAM134B with and Log2 Ratio H/L >1 and –Log10 p value > 1.3 are labeled in red. Data represent three biological replicates.
-
Figure 8—source data 1
Comparison of the IP-interactome of RTN3L and FAM134B.
Comparison of the IP-interactomes analyses were performed using the SILAC-labeling strategy in U2OS after 24 hr treatment with 1 µg/ml of doxycycline. Bafilomycin A1, 200 ng/ml, was added for 2 hr. Peptides with Log2 (Heavy/Light [H/L]) ratios ≥1 and a p value ≤ 0.05 were considered significantly enriched.
- https://doi.org/10.7554/eLife.25555.032
Figure 8—figure supplement 1
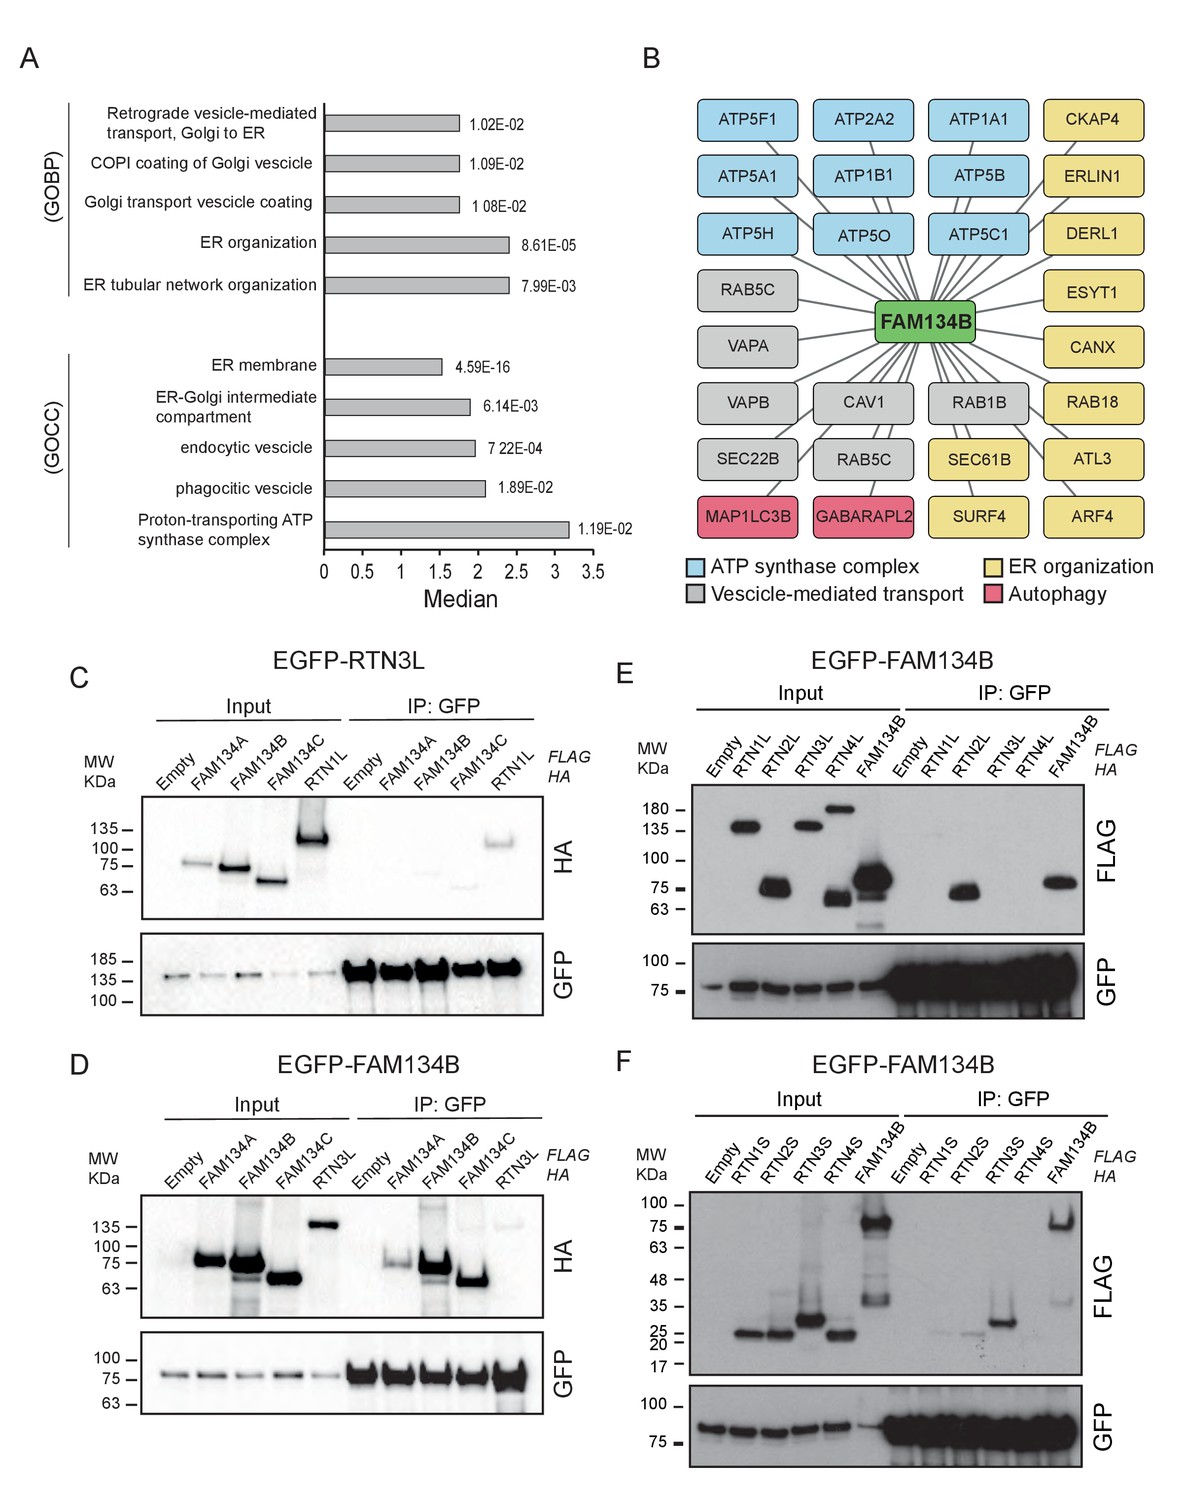
RTN3L and FAM134B are two independent ER-phagy receptors.
(A) Annotation enrichment analysis of FAM134B interactors. Bars represent the significantly enriched gene ontology biological process (GOBP) and the gene ontology cellular components (GOCC). The numeric value on the right side of the bar shows the Benjamini-Hochberg FDR value. (B) Cytoscape scheme for some FAM134B interactors. (C) Co-IP of RTN3L with the three members of the FAM134 protein family. Proteins were co-overexpressed in HEK293T cells for 24 hr. RTN1L was used as positive control. (D) Co-IP of FAM134B with three members of the FAM134 protein family and RTN3L. Proteins were co-overexpressed in HEK293T cells for 24 hr. (E) Co-IP of FAM134B with the long isoforms of RTN1-4. Proteins were co-overexpressed in HEK293T cells for 24 hr. (F) Co-IP of FAM134B with the short isoforms of RTN1-4. Proteins were co-overexpressed in HEK293T cells for 24 hr.
Figure 9
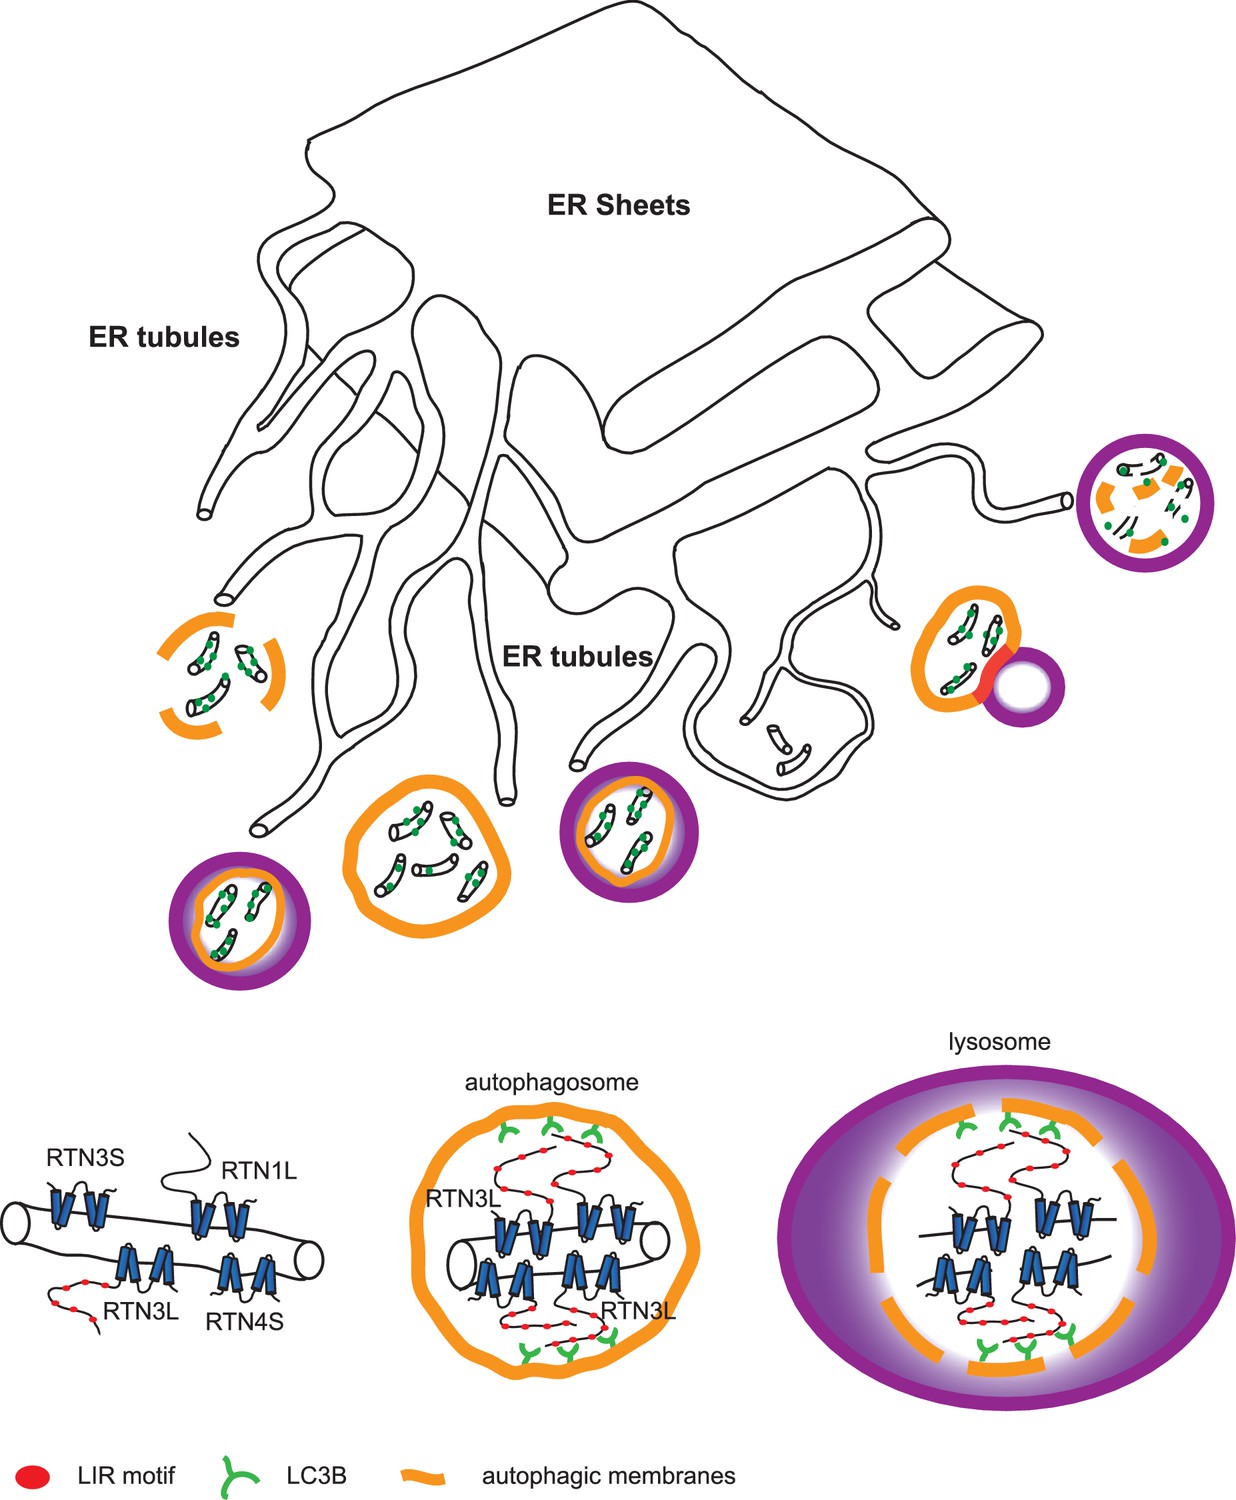
Model for ER tubules degradation.
To drive ER tubules turnover, local RTN3L homo-dimerizes and leads to the recruitment of autophagic membranes and ER tubules fragmentation. Autophagosomes containing ER tubules as cargo, subsequently fuse with lysosomes.
Tables
Table 1
Plasmids and cDNAs related to the experimental procedures. Plasmids used in the manuscript are listed below.
| Plasmid/epitope-tag | Gene/Mutation | Reference |
|---|---|---|
| pGEX-4T1 alone | GST only | (Kirkin et al., 2009) |
| pGEX-4T1 LC3A dG | Deletion of terminal glycine | (Kirkin et al., 2009) |
| pGEX-4T1 LC3B dG | Deletion of terminal glycine | (Kirkin et al., 2009) |
| pGEX-4T1 LC3C dG | Deletion of terminal glycine | (Kirkin et al., 2009) |
| pGEX-4T1 GABARAP dG | Deletion of terminal glycine | (Kirkin et al., 2009) |
| pGEX-4T1 GABARAP-L1 dG | Deletion of terminal glycine | (Kirkin et al., 2009) |
| pGEX-4T1 GABARAP-L2 dG | Deletion of terminal glycine | (Kirkin et al., 2009) |
| pGEX-4T1 Ub | Human Ubiquitin | (Kirkin et al., 2009) |
| pGEX-4T1 4XUb | Human 4 X linear Ubiquitin | (Kirkin et al., 2009) |
| pGEX-4T1 dN LC3A dG | Lacking unique N-terminus and deletion of terminal glycine | This study |
| pGEX-4T1 dN LC3B dG | Lacking unique N-terminus and deletion of terminal glycine | This study |
| pGEX-4T1 dN GABARAP-L1 dG | Lacking unique N-terminus and deletion of terminal glycine | This study |
| pGEX-4T1 dN GABARAP-L2 dG | Lacking unique N-terminus and deletion of terminal glycine | This study |
| pGEX-4T1 LC3B F52A-V53A dG | Mutated LIR binding pocket | This study |
| RTN1A cDNA | Human RTN1A, long isoform (NM_021136.2) | Open Biosystem (BC090862) |
| pCMV-SPORT6-RTN2A | Human RTN2A, long isoform (NM_005619.4) | Source Bioscience (IRATp970B0996D) |
| pReceiver-M06-RTN3B | Human RTN3B, long isoform (NM_201428.2) | Genocopoeia, TebuBio (EX-Z3044-M06) |
| pcDNA3.1-RTN4A-myc | Human RTN4A, long isoform (NM_020532.4) | Provided by S. Strittmatter (GrandPré et al., 2000) |
| pcDNA3.1-RTN4C-myc | Human RTN4C, short isoform (NM_007008.2) | Provided by S. Strittmatter (GrandPré et al., 2000) |
| RTN3A cDNA | Human RTN3A, short isoform (NM_006054.3) | Open Biosystem (BC011394) |
| pDONR223-RTN1L | Human RTN1A, long isoform | This study |
| pDONR223-RTN2L | Human RTN2A, long isoform | This study |
| pDONR223-RTN3L | Human RTN3B, long isoform | This study |
| pDONR223-RTN4L | Human RTN4A, long isoform | This study |
| pDONR223-RTN1S | Human RTN1C, short isoform | This study |
| pDONR223-RTN2S | Human RTN2C, short isoform | This study |
| pDONR223-RTN3S | Human RTN3A, short isoform | This study |
| pDONR223-RTN4S | Human RTN4C, short isoform | This study |
| iTAP-FLAG-HA-RTN1L | Human RTN1A, long isoform | This study |
| iTAP-FLAG-HA-RTN2L | Human RTN2A, long isoform | This study |
| iTAP-FLAG-HA-RTN3L | Human RTN3B, long isoform | This study |
| iTAP-FLAG-HA-RTN4L | Human RTN4A, long isoform | This study |
| iTAP-FLAG-HA-RTN1S | Human RTN1C, short isoform | This study |
| iTAP-FLAG-HA-RTN2S | Human RTN2C, short isoform | This study |
| iTAP-FLAG-HA-RTN3S | Human RTN3A, short isoform | This study |
| iTAP-FLAG-HA-RTN4S | Human RTN4C, short isoform | This study |
| pHAGE-EGFP-RTN1L | Human RTN1A, long isoform | This study |
| pHAGE-EGFP-RTN2L | Human RTN2A, long isoform | This study |
| pHAGE-EGFP-RTN3L | Human RTN3B, long isoform | This study |
| pHAGE-EGFP-RTN4L | Human RTN4A, long isoform | This study |
| pHAGE-EGFP-RTN3S | Human RTN3A, short isoform | This study |
| pHAGE-EGFP-RTN3L∆6LIRs | Human RTN3B, long isoform all mutant LIRs | This study |
| pcDNA3.1-FLAG-RTN3L | Human RTN3B, long isoform | This study |
| pcDNA3.1-FLAG-RTN3L LIR mutant ΔFTLL | Human RTN3B, long isoform DDRFTLLTA/DDRATLATA aa202-210 | This study |
| pcDNA3.1-FLAG-RTN3L LIR mutant ΔYSKV | Human RTN3B, long isoform PTEYSKVEG/PTEASKAEG aa214-222 | This study |
| pcDNA3.1-FLAG-RTN3L LIR mutant ΔFEVI | Human RTN3B, long isoform ESPFEVIID/ESPAEVAID aa245-253 | This study |
| pcDNA3.1-FLAG-RTN3L LIR mutant ΔWDLV | Human RTN3B, long isoform ILTWDLVPQ/ILTADLAPQ aa339-347 | This study |
| pcDNA3.1-FLAG-RTN3L LIR mutant ΔFEEL | Human RTN3B, long isoform SKNFEELVS/SKNAEEAVS aa552-561 | This study |
| pcDNA3.1-FLAG-RTN3L LIR mutant ΔYDIL | Human RTN3B, long isoform QRSYDILER/QRSADIAER aa787-795 | This study |
| pcDNA3.1-FLAG-RTN3L∆5LIRs-WDLV | Human RTN3B, long isoform all mutant LIRs except WDLV | This study |
| pcDNA3.1-FLAG-RTN3L∆5LIRs-YSKV | Human RTN3B, long isoform all mutant LIRs except YSKV | This study |
| pcDNA3.1-FLAG-RTN3L∆5LIRs-YDIL | Human RTN3B, long isoform all mutant LIRs except YDIL | This study |
| pcDNA3.1-FLAG-RTN3L∆5LIRs-FTLL | Human RTN3B, long isoform all mutant LIRs except FTLL | This study |
| pcDNA3.1-FLAG-RTN3L∆5LIRs-FEEL | Human RTN3B, long isoform all mutant LIRs except FEEL | This study |
| pcDNA3.1-FLAG-RTN3L∆5LIRs-FEVI | Human RTN3B, long isoform all mutant LIRs except FEVI | This study |
| pcDNA3.1-FLAG-RTN3L∆6LIRs | Human RTN3B, long isoform all mutant LIRs | This study |
| pDONR223-RTN3L∆6LIRs | Human RTN3B, long isoform all mutant LIRs | This study |
| iTAP-FLAG-HA-RTN3L∆6 LIRs | Human RTN3B, long isoform all mutant LIRs | This study |
| pcDNA5 FRT-TO mCherry-EGFP-RTN3L | Human RTN3B, long isoform | This study |
| pcDNA5 FRT-TO mCherry-EGFP-RTN3L∆6LIRs | Human RTN3B, long isoform all mutant LIRs | This study |
| pDONR223-FAM134A | Human FAM134A | This study |
| pDONR223-FAM134B | Human FAM134B | (Khaminets et al., 2015) |
| pDONR223-FAM134C | Human FAM134C | This study |
| iTAP-FLAG-HA-FAM134A | Human FAM134A | This study |
| iTAP-FLAG-HA-FAM134B | Human FAM134B | (Khaminets et al., 2015) |
| iTAP-FLAG-HA-FAM134C | Human FAM134C | This study |
| pC4-RhE FRB (T2098L) | Provided by R. Youle | |
| pC4M-F2E FKBP | Provided by R. Youle | |
| pC4-RhE FRB (T2098L)-FLAG-RTN3L | Human RTN3B, long isoform | This study |
| pC4M-F2E FKBP-HA-RTN3L | Human RTN3B, long isoform | This study |
| pC4M-F2E FKBP-HA-RTN3S | Human RTN3A, short isoform | This study |
| mCherry-EGFP LC3B | Human LC3B | (Khaminets et al., 2015) |
| GFP-SEC63 | Human SEC63 | Provided by H. Farhan |
Table 2
Antibodies related to the experimental procedures. Antibodies used for immuno-blot and immuno-staining are listed below.
| Antigen | Company | RRID | Application |
|---|---|---|---|
| GABARAP | AbCam (Cambridge,UK) (Ab109364) | AB_10861928 | WB |
| GABARAP-L1 | Proteintech (Manchester, UK) (11010–1-AP) | AB_2294415 | WB, IF |
| FLAG | Sigma Aldrich (F7425-2MG) | AB_439687 | WB |
| FLAG | Sigma Aldrich (F1804) | AB_262044 | IF |
| HA | Roche (Mannheim, Germany) (11867423001) | AB_10094468 | IF |
| HA | Covance (Princeton, NJ, USA) (MMS-101P-1000) | AB_291259 | WB |
| LC3B | MBL (Woburn, MA, USA) (M152-3) | AB_1279144 | IF |
| LC3B | MBL (PM036) | AB_2274121 | IF |
| LC3B | CST (Danvers, MA, USA) (#2775) | AB_915950 | WB |
| RTN3 (human) | Bethyl (Montgomery, TX,USA) (A302-860A) | AB_10631136 | WB, IP |
| RTN3 | TebuBio (Offenbach am Main, Germany) (PA2256) | AB_2665372 | WB, IF |
| LAMP1 | DSHB (University of Iowa) (H4B4) | AB_528129 | IF |
| LAMP1 | DSHB (1D4B) | AB_2134500 | IF |
| LAMP1 | AbCam (Ab24170) | AB_775978 | IF |
| p62 | ENZO Life Science (Farmingdale, NY, USA) (PW9860) | AB_2196009 | WB |
| VINCULIN | Sigma-Aldrich (V9264) | AB_10603627 | WB |
| CALNEXIN | AbCam (Ab22595) | AB_2069006 | IF |
| REEP5 | Proteintech (14643–1-AP) | AB_2178440 | IF, WB |
| CLIMP-63 | Proteintech (16686–1-AP) | AB_2276275 | IF, WB |
| BSLC2 | AbCam (Ab106793) | AB_10974250 | IF |
| RTN1 | AbCam (Ab9274) | AB_307128 | WB |
| RTN4 | AbCam (Ab47085) | AB_881718 | WB |
| FAM134B | Gift from C. Hubner | Jena University | WB |
| ATG7 | CST (#8558) | AB_10831194 | WB |
| TRAP alpha | AbCam (Ab133238) | AB_11157579 | WB |
| KDEL | Merck-Millipore (10C3) | AB_212090 | IEM |
| CD63 | Ancell (Stillwater, MN, USA) (AHN16.1/46-4-5) | AB_2665375 | IEM |
| HA | Gift from G.Bu | Mayo Clinic, Jacksonville, FL,USA. | IEM |
| GFP | Santa Cruz (sc-9996) | AB_627695 | WB |
Table 3
CRISPR-CAS9 guides sequences. CRISPR-CAS9 guide sequences used to generate KO cell lines in the manuscript are listed below.
| Gene | sgRNA sequence | Guide N° |
|---|---|---|
| hATG7 | CACC GAGAAGAAGCTGAACGAGTAT | 1 |
| hATG7 | CACC GCTGCCAGCTCGCTTAACA | 2 |
| hATG7 | CACC GTAAACTCTCTGGAAGACAGA | 3 |
| hFAM134B | CACC GATATCATTACATTTAAACAA | 1 |
| hFAM134B | CACC GCTTCCAGCTCAGCAGCTCGT | 2 |
| hFAM134B | CACC GCAATACAGTGGCTGAGCCT | 3 |
Download links
A two-part list of links to download the article, or parts of the article, in various formats.
Downloads (link to download the article as PDF)
Open citations (links to open the citations from this article in various online reference manager services)
Cite this article (links to download the citations from this article in formats compatible with various reference manager tools)
Full length RTN3 regulates turnover of tubular endoplasmic reticulum via selective autophagy
eLife 6:e25555.
https://doi.org/10.7554/eLife.25555


