Synchronized HIV assembly by tunable PIP2 changes reveals PIP2 requirement for stable Gag anchoring
- University Hospital Heidelberg, Germany
- Partner site Heidelberg, Germany
- European Molecular Biology Laboratory, Germany
- Oregon Health and Science University, United States
Figures
Figure 1 with 1 supplement
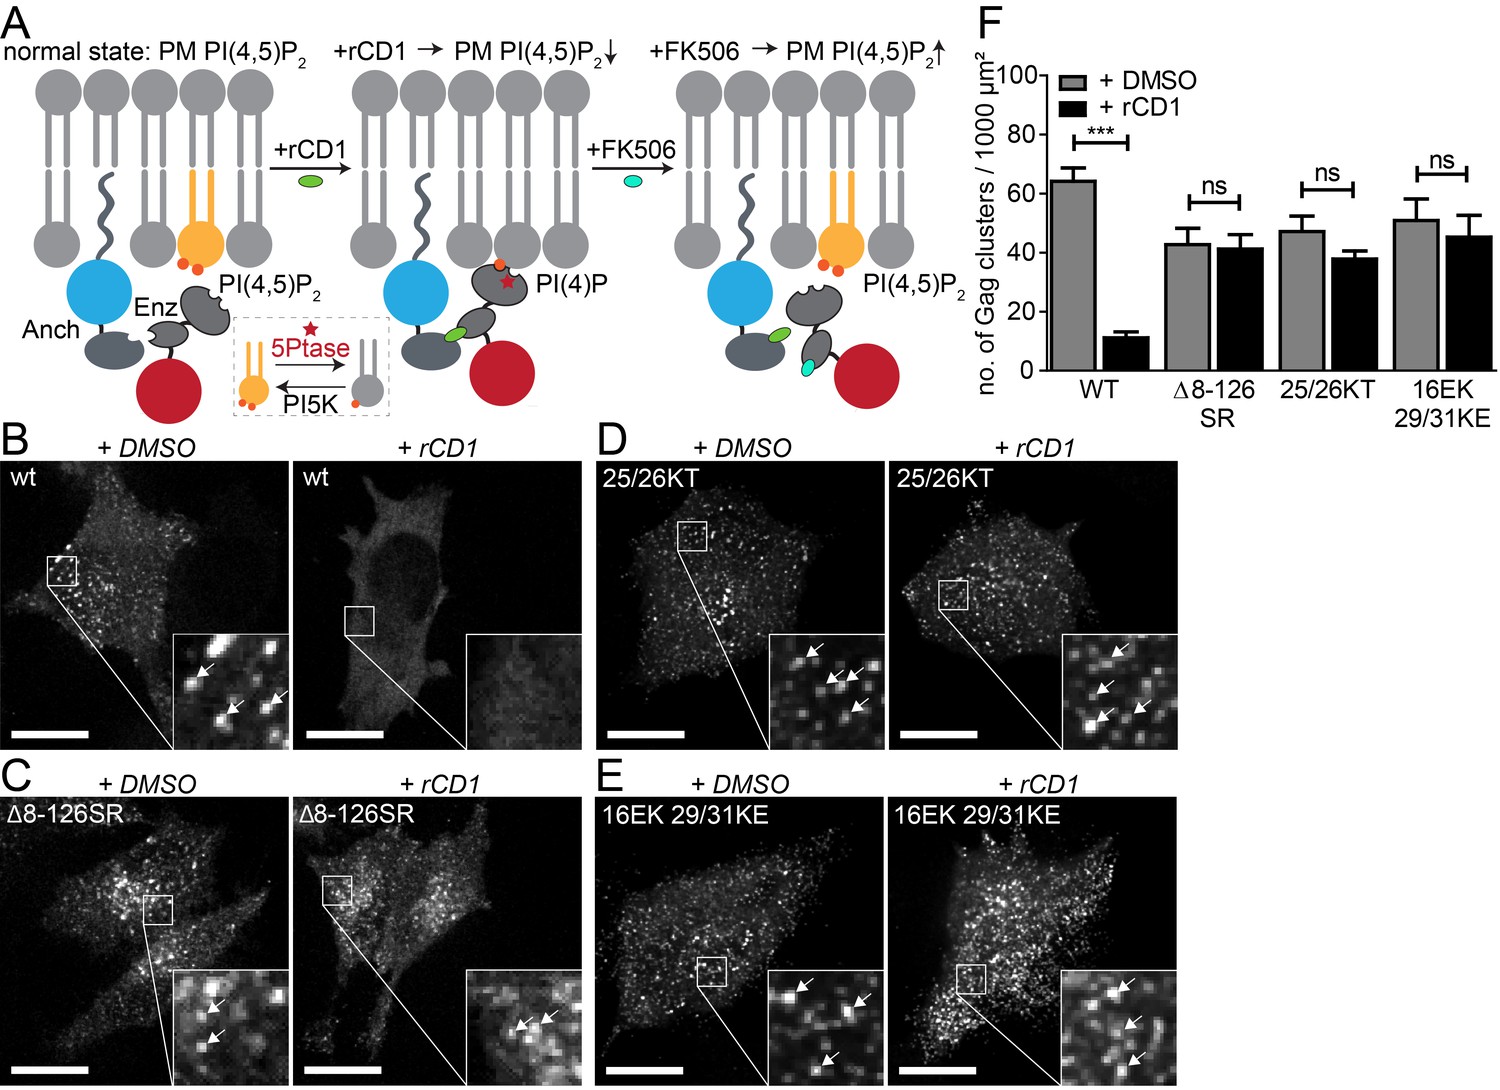
PI(4,5)P2 is required for Gag assembly in living cells in an MA-dependent manner.
(A) Principle of the reversible chemical dimerizer system (rCDS). Translocation of the Enzyme 5Ptase to the PM by the reversible chemical dimerizer rCD1 leads to breakdown of PI(4,5)P2 to PI(4)P. Addition of the competing ligand FK506 displaces the enzyme from the PM, which restores PI(4,5)P2 levels rapidly. See also Figure 1—figure supplement 1 and Video 1, which show reversible PI(4,5)P2 depletion by the rCDS in living cells. (B–E) Representative SDC fluorescence images of the ventral PM of HeLa Kyoto cells transfected with the Anchor (LCK-ECFP-SNAP), Enzyme (mRFP-FKBP-5Ptase) and the indicated HIV-1 derived constructs. Cells were treated with 1% DMSO (left panels) or 1 µM rCD1 (right panels) at 4 hpt. Gag was detected at 22 hpt at the ventral membranes of cells via EGFP (in living cells, pCHIV derived constructs in (B) and (C)) or by indirect immunolabeling (in fixed cells, NL4-3 derived constructs in (D) and (E)). Arrows indicate Gag clusters. Scale bar represents 20 µm. (F) Number of Gag clusters detected at the ventral membrane per 1000 µm² membrane area. Error bars represent the standard error of the mean (statistical significance was assessed with the two-tailed unpaired Student‘s t-test; ***p≤0.001) of n = 27/26; 15/18; 35/33; 29/22 cells (from n = 3; 2; 2; 2 independent experiments), respectively.
Figure 1—figure supplement 1
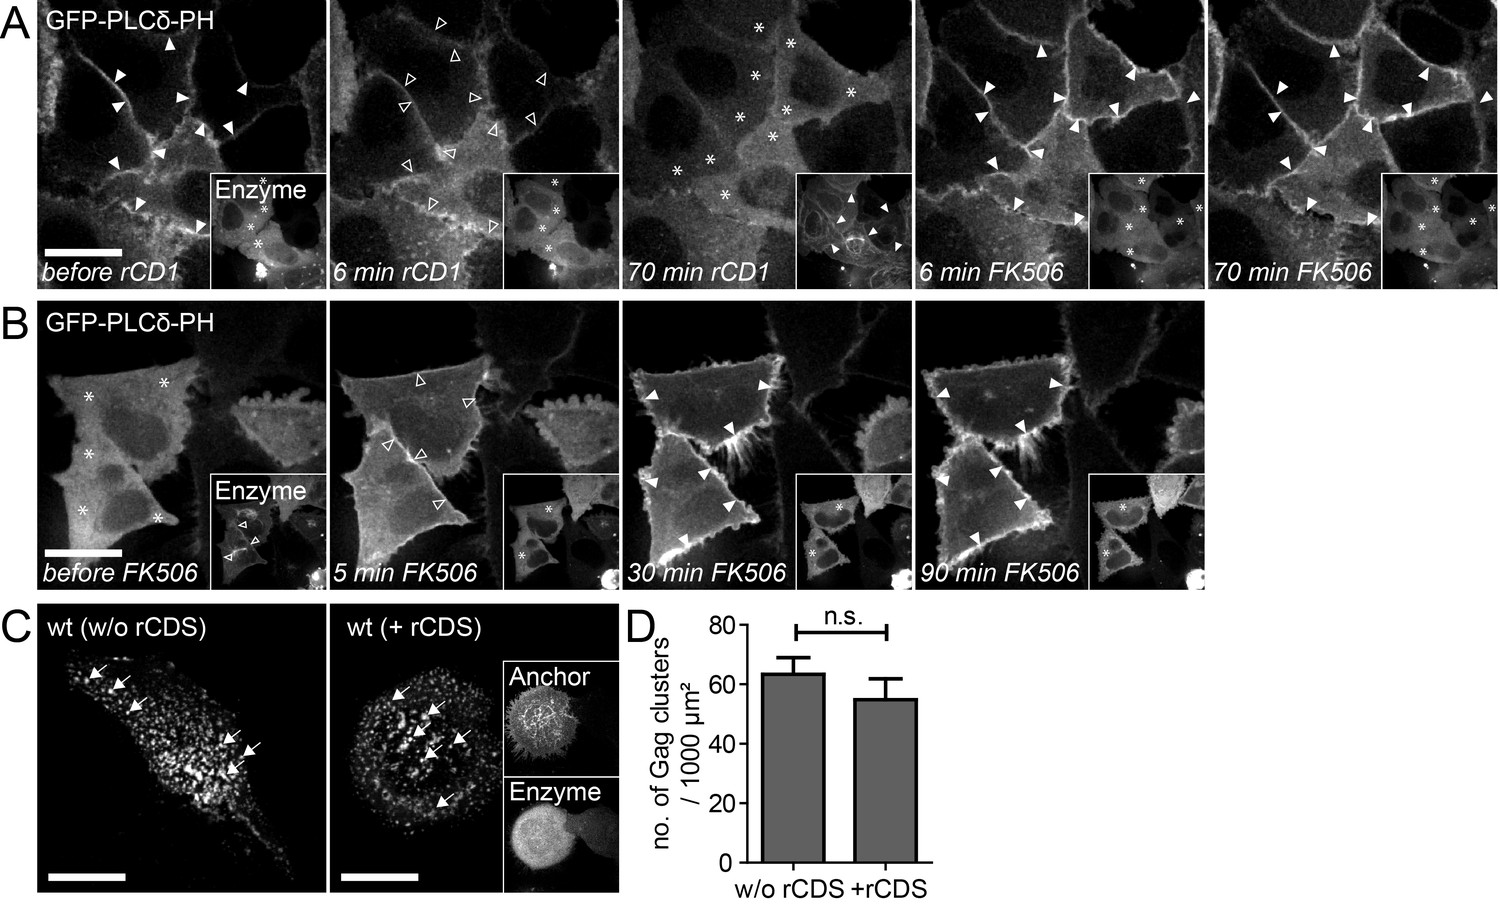
Reversible PI(4,5)P2 depletion from the PM by the rCDS.
(A, B) Representative time-lapse SDC fluorescence images of the central volume of HeLa Kyoto cells transfected with the plasmids expressing the rCDS and the PI(4,5)P2 reporter (EGFP-PLCδ-PH). Maximum intensity projections of four focal planes acquired with an axial spacing of 0.5 μm are shown. (A) Treatment with 1 μM rCD1 at 22 hpt induced translocation of the Enzyme from the cytosol (*) to the PM (arrowheads in insets), and dissociation of EGFP-PLCδ –PH from the PM (arrowheads in main panel). Subsequent addition of 1 μM FK506 released the Enzyme from the PM (see insets) and restored EGFP-PLCδ –PH PM binding. (B) Treatment with 1 μM rCD1 at 4 hpt led to a translocation of the Enzyme to the PM. This translocation was stable over a long time (left panel; 22 hpt) and thereby allowed the depletion of PM PI(4,5)P2 up to 22 hpt. Subsequent addition of 1 μM FK506 led to a loss of the Enzyme from the PM and rescued PM PI(4,5)P2 levels. (C) HeLa Kyoto cells were transfected with the HIV-1 derived constructs pCHIV and pCHIVEGFP alone (left panel) or together with the rCDS (right panel). Gag clusters (indicated by arrows) at the ventral membrane of the cells were monitored at 22 hpt in living cells. Scale bars in A-C represent 20 μm. (D) Number of Gag-GFP clusters per 1000 μm2 membrane in the absence (w/o rCDS) or presence (+ rCDS) of the rCDS. Error bars represent the SEM of data from n = 14 cells and n = 7 cells, respectively (statistical significance was assessed with the two-tailed unpaired Student‘s t-test; differences were considered statistically significant when p≤0.05).
Figure 2 with 1 supplement

Gag assembly can be induced by PI(4,5)P2 reconstitution.
(A, B) Representative time-lapse SDC fluorescence images of the ventral PM of HeLa Kyoto cells transfected with plasmids expressing the rCDS and HIV-1 derived constructs pCHIV and pCHIVEGFP. Cells were treated with 1 µM rCD1 at 4 hpt and PI(4,5)P2 rescue was induced at 22 hpt by addition of 1 µM FK506 (A) or 1% DMSO solvent control was added (B). Arrows indicate Gag-EGFP clusters. Scale bar represents 20 µm. (See also Videos 2 and 3) (C) Quantitative analysis of the increase in number of Gag-EGFP clusters at the PM following DMSO (grey) or FK506 (black) treatment. Error bars represent the standard error of the mean of n = 37 FK506 treated cells from four independent experiments and n = 16 DMSO treated cells from two independent experiments.
Figure 2—figure supplement 1
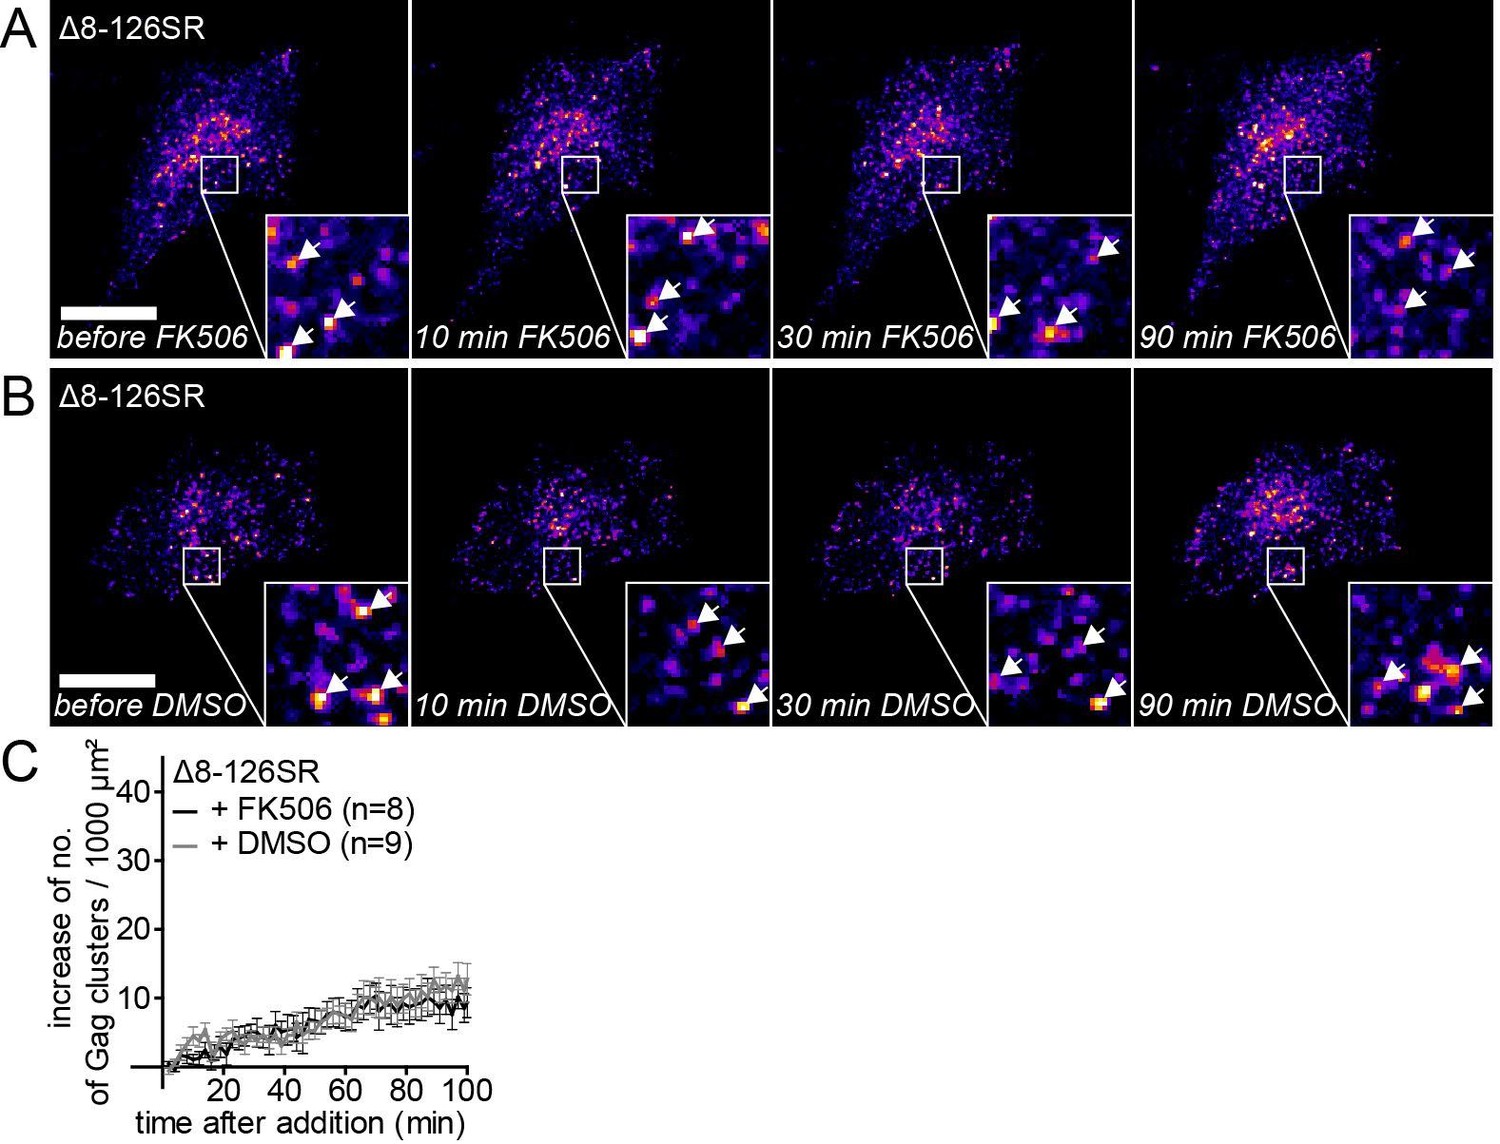
The MA deletion mutant Δ8–126 SR does not respond to PI(4,5)P2 depletion.
(A,B) Representative time-lapse fluorescence images of the ventral membrane of HeLa Kyoto cells transfected with the plasmids expressing the rCDS and HIV-1 MA deletion constructs pCHIVΔ8–126 SR and pCHIVEGFP(Δ8–126 SR). Cells were treated with 1 μM rCD1 at 4 hpt and 1 μM FK506 (A) or 1% DMSO solvent control (B) was added at 22 hpt. Arrows indicate Gag-EGFP clusters. Scale bar represents 20 μm. (C) Quantitative analysis of the increase in number of Gag(Δ8–126 SR) clusters at the PM following DMSO (grey) or FK506 (black) treatment. Error bars represent SEM of data from n = 8 and n = 9 FK506 and DMSO treated cells, respectively.
Figure 3 with 1 supplement
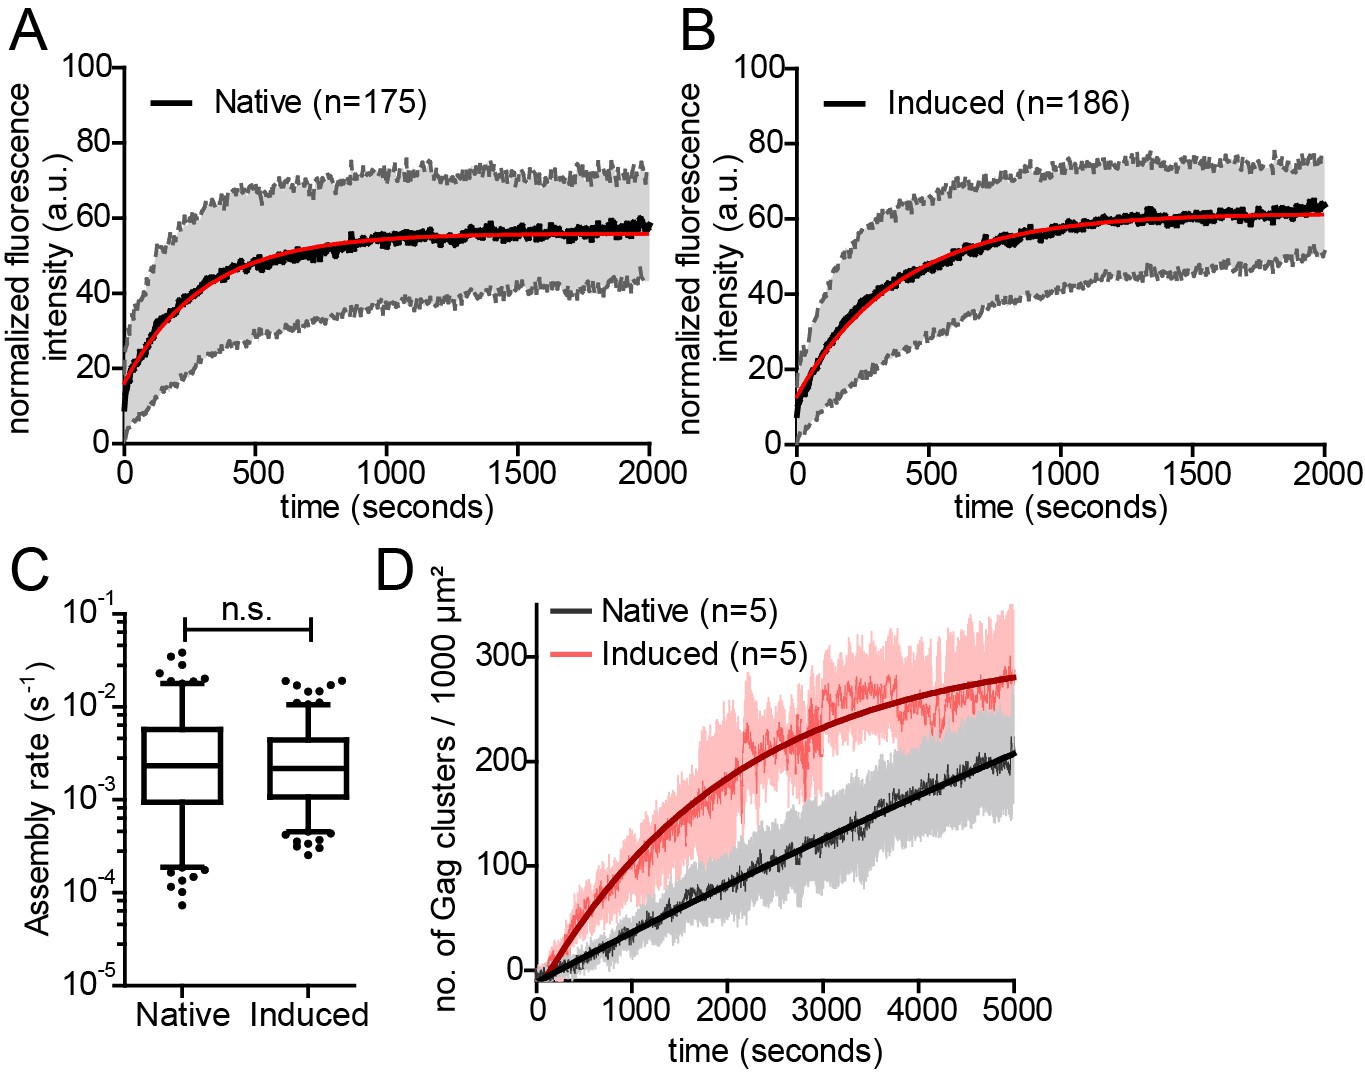
Kinetics of native and induced Gag assembly do not differ significantly.
(A, B) Normalized and averaged HIV-1 assembly traces of 175 individual native (A) and 186 individual induced (B) assembly sites at the ventral PM of n = 3 cells each. The standard deviation is shown in grey, while a single exponential fit is shown in red. (C) Assembly rate constants derived from the individual assembly traces by fitting to single exponential equations. Mean assembly rate constants for native and induced assembly were 4.5 ± 0.47*10−3 s−1 and 3.49 ± 0.26*10−3 s−1, respectively. Whiskers plots represent 5–95 percentile (statistical significance was assessed with the Mann-Whitney U test; differences were considered significant when p≤0.05). (D) Quantitative analysis of nascent native and induced Gag clusters (imaged by high time-resolution TIRF microscopy) forming at the ventral membrane over time. Numbers represent the mean amount of Gag-GFP clusters per 1000 µm² membrane. Error bars represent SEM. (See also Figure 3—figure supplement 1 for relative frequency distributions of assembly rates and Videos 4 and 5).
Figure 3—figure supplement 1
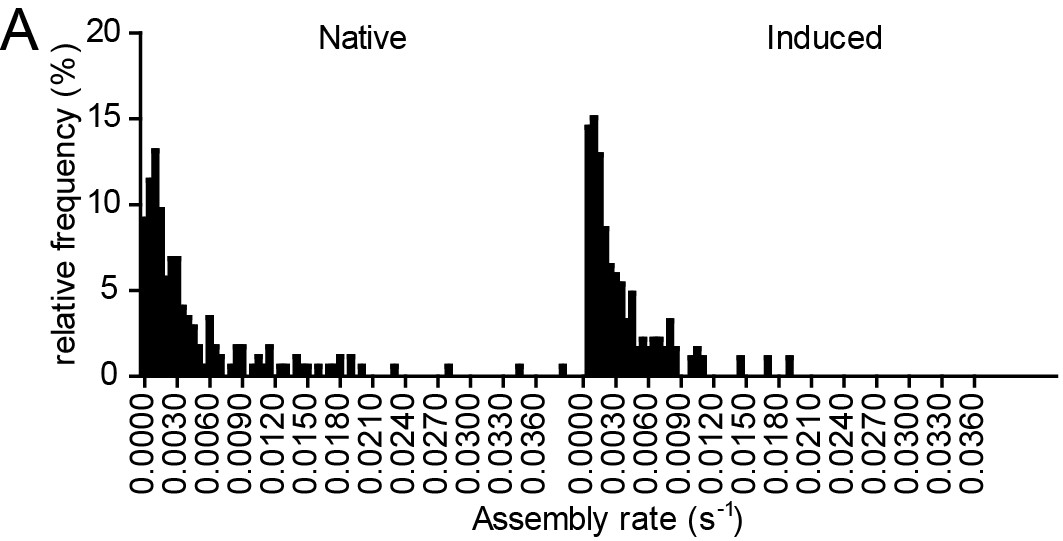
Relative frequency distributions of assembly rates do not differ between native and induced assembly.
(A, B) Relative frequency distribution of native and induced assembly rates k extracted from HIV-1 assembly traces of 175 individual native (left) and 186 individual induced (right) assembly sites at the ventral membrane from n = 3 cells each, fitted to single exponential equations. The frequency distribution was plotted using a bin width of 0.0005 s−1.
Figure 4

Native and induced HIV-1 assembly sites are indistinguishable by STED nanoscopy.
(A, B) Confocal (left) and STED images (right) of the ventral PM of HeLa Kyoto cells transfected only with the HIV-1 derived constructs pCHIV and pCHIVCLIP (native assembly, (A)) or additionally with the plasmids expressing the rCDS (induced assembly, (B)). In B, HIV-1 assembly was first inhibited by addition of rCD1 at 4 hpt and then induced by addition of FK506 for 90 min at 22 hpt. Gag (cyan) was detected via Atto 590 CLIP and Env (red) was detected via indirect immunolabeling. Some individual assembly sites are highlighted with arrows. Gag clusters (filled arrowheads) were surrounded by Env accumulations (open arrowheads). Scale bar represents 1 µm (overview images) or 200 nm (enlargements). (C, D) Averaged line profiles of selected native (C) or induced (D) Gag assembly sites (n = 9 and n = 7, respectively). Error bars represent SEM.
Figure 5 with 1 supplement
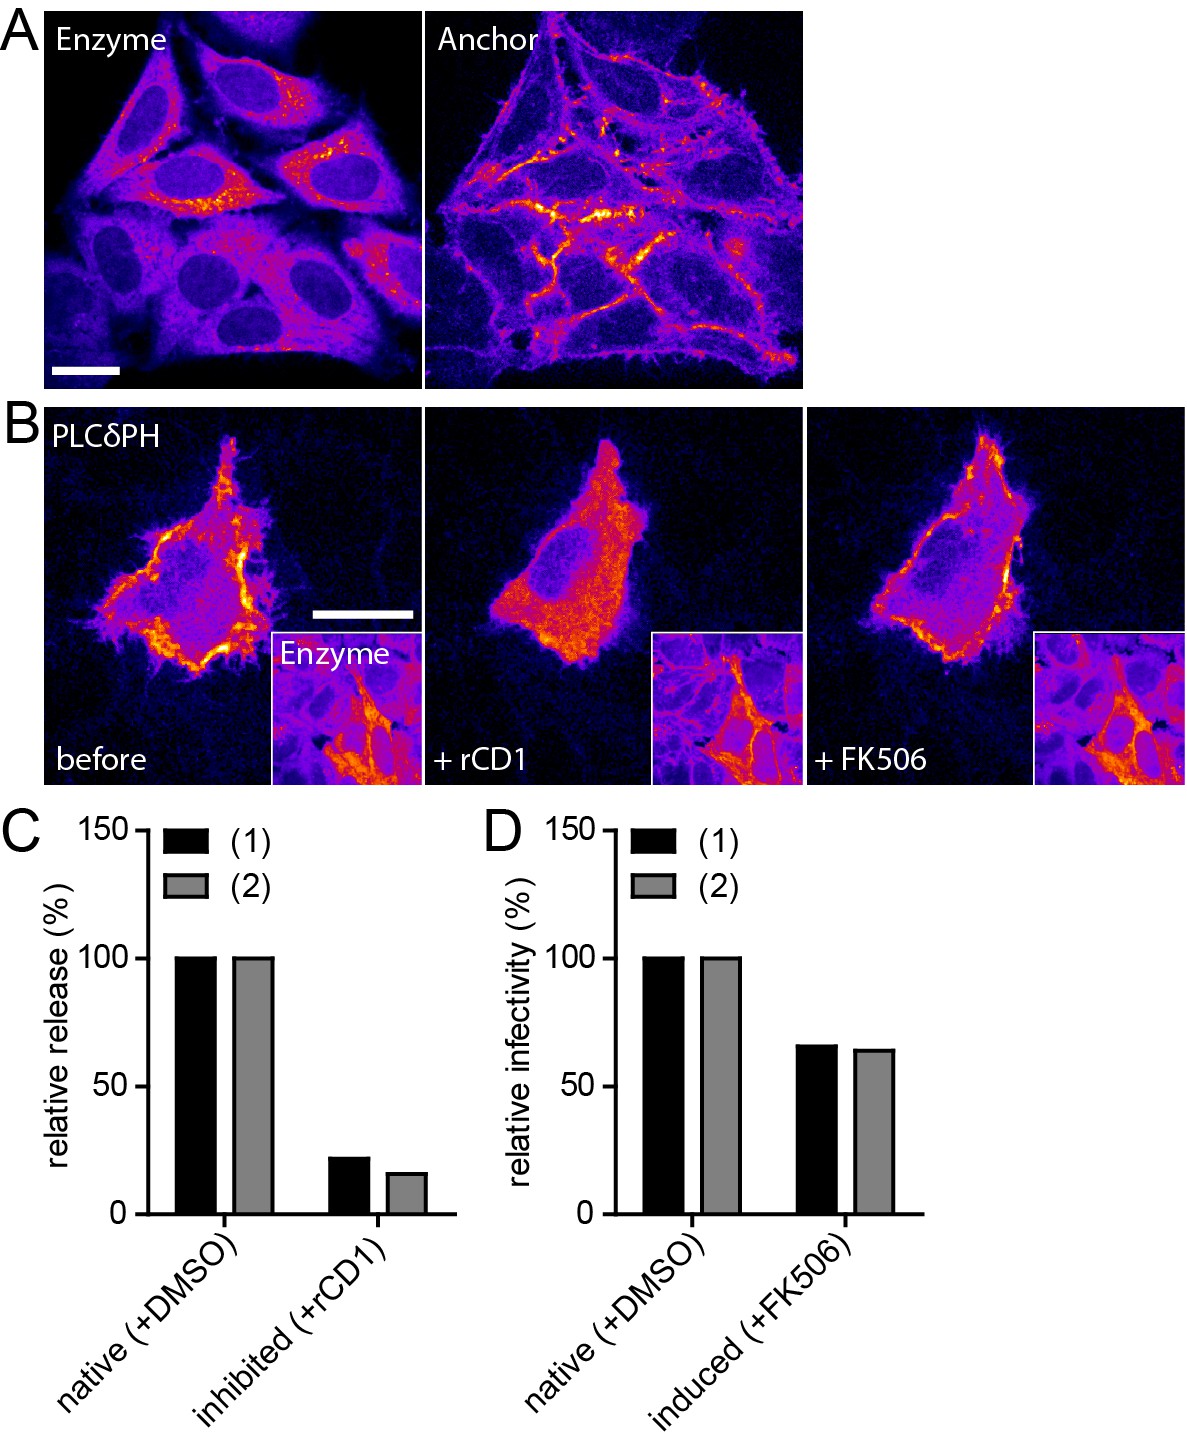
Infectivity of virions produced under native and induced conditions in HeLarCDS cells.
(A) Representative SDC fluorescence images of the central section of HeLarCDS cells expressing the Anchor and Enzyme. Single planes are shown. (B) HeLarCDS cells were transfected with pEGFP-PLCδ-PH and imaged 22 hpt (left panel). Cells were treated with 1 µM rCD1 (middle panel), followed by addition of 1 µM FK506 (right panel). Maximum intensity projections of three focal planes acquired with an axial spacing of 0.5 µm are shown. Scale bars in A and B represent 20 µm. (C,D) HeLarCDS cells were transfected with pNL4-3 and treated with DMSO (native) or 1 µM rCD1 (inhibited) 5 hpt. (C) Relative RT activity as a measure of virus release was determined from supernatants harvested at 22 hpt. (D) Cells were subsequently treated with DMSO (native) or 1 µM FK506 (induced). Infectivity on TZM-bl reporter cells was determined from supernatants harvested 2 hr after addition of DMSO (native)/1 µM FK506 (induced) and used to calculate normalized relative infectivity values. Data from two independent experiments [experiments (1) and (2)] are shown. Please refer to Figure 5—figure supplement 1 for non-normalized data.
Figure 5—figure supplement 1
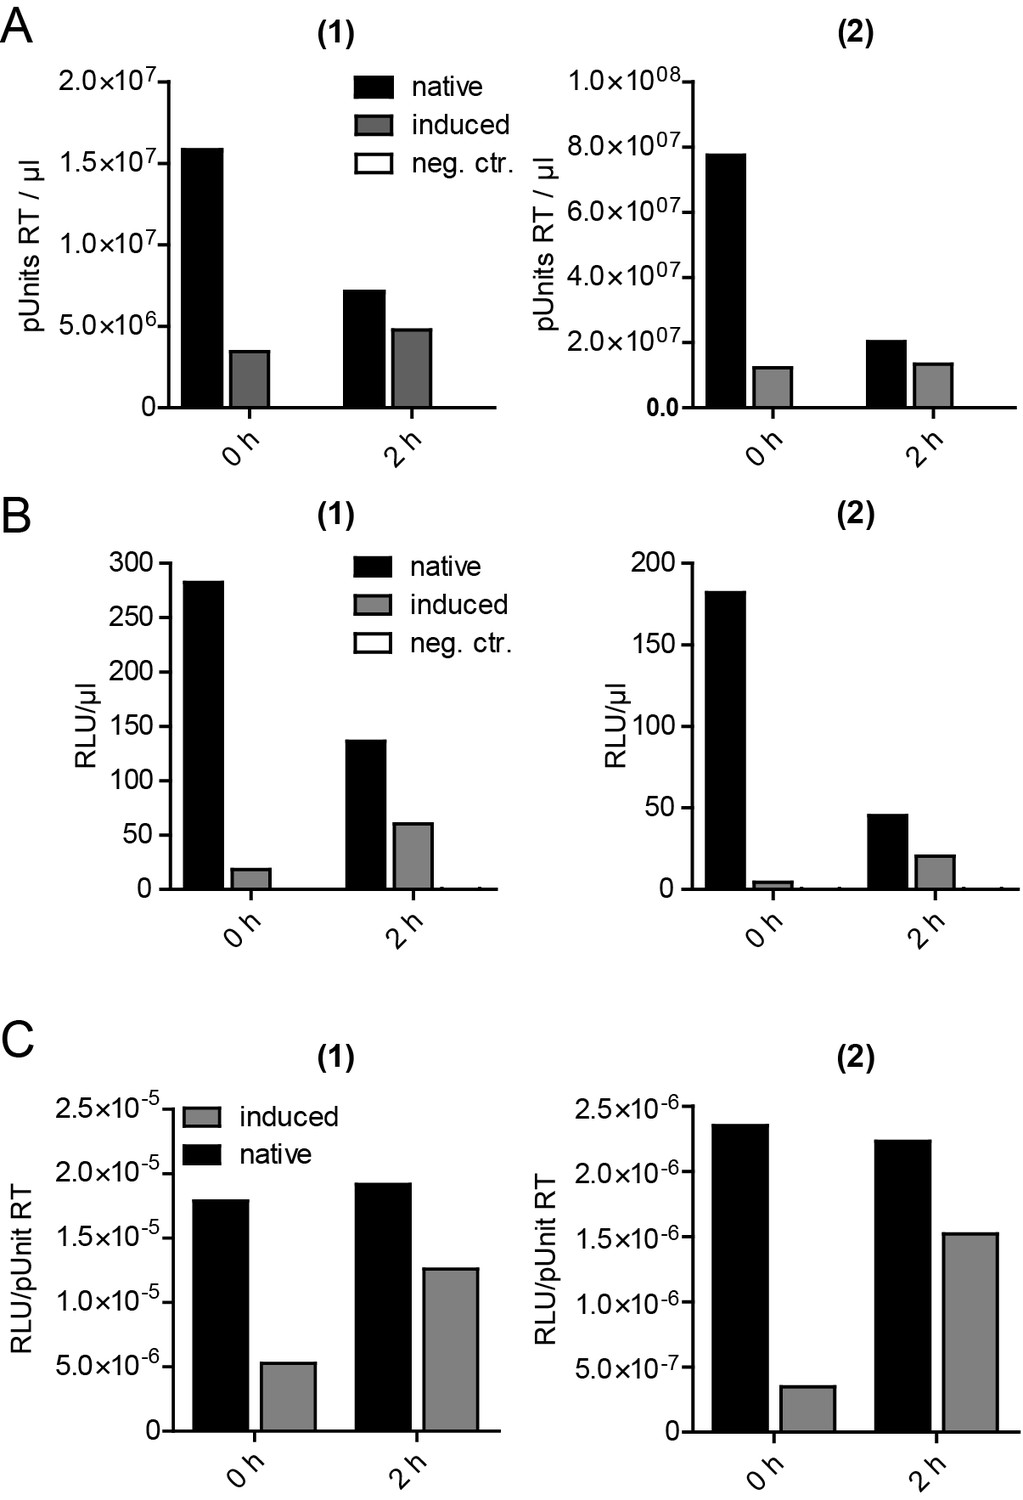
Release, infectivity and relative infectivity of virions produced under native and induced conditions.
(A–C) HeLarCDS cells were transfected with pNL4-3 (native/induced). Untransfected cells were used as an additional control (neg. ctr.). Cells were treated with DMSO (native) or 1 µM rCD1 (induced) 5 hpt, followed by treatment with DMSO (native) or 1 µM FK506 (induced) 22 hpt. RT activity as a measure of virus release (A) and infectivity on TZM-bl reporter cells (B) were determined from supernatants harvested before addition of DMSO or FK506 at 22 hpt (0 hr) or 2 hr after addition of DMSO (native) or 1 µM FK506 (induced) (2 hr) and used to calculate relative infectivity values shown in (C). Data from two independent experiments [experiments (1) and (2)] are shown.
Figure 6 with 4 supplements

The partially assembled Gag lattice dissociates reversibly upon PI(4,5)P2 depletion.
(A, B) Representative time-lapse SDC fluorescence images of the central volume of HeLa Kyoto cells transfected with plasmids expressing the rCDS and HIV-1 derived constructs pCHIV and pCHIVEGFP. Maximum intensity projections of four focal planes acquired with an axial spacing of 0.5 µm are shown. Cells were treated at 22 hpt with 1 µM rCD1 for 90 min (A) and FK506 was added subsequently (B). Arrows indicate Gag-EGFP clusters. Scale bar represents 20 µm. (C, D) Relative number of Gag clusters in the cell shown in (A, B) and the control cell shown in Figure 6—figure supplement 1A following rCD1 (black) or DMSO (grey) (C) and FK506 (black) or DMSO (grey) (D) addition, respectively. (E, F) Quantitative analysis of the mean relative number of Gag-EGFP clusters following rCD1 (black) or DMSO (grey) (E) and FK506 (black) or DMSO (grey) (F) addition, respectively. Error bars represent SEM for n = 10 rCD1+FK506 treated cells from six independent experiments and n = 13 DMSO treated cells from four independent experiments. (See also Videos 6 and 7).
Figure 6—figure supplement 1
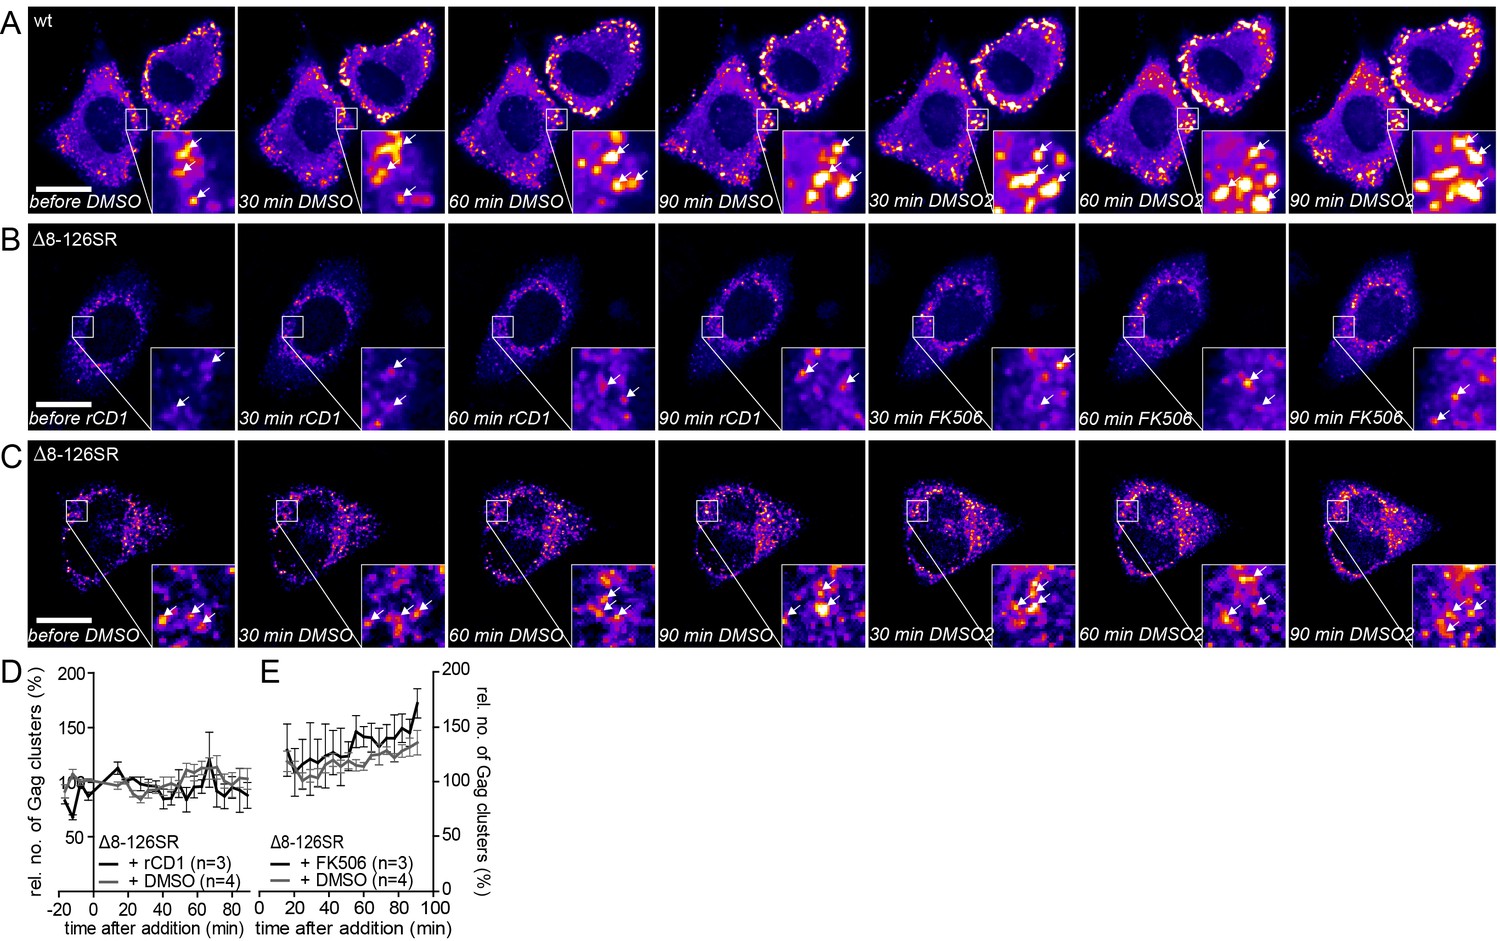
Addition of DMSO solvent control does not affect already assembled Gag clusters and the MA deletion mutant Δ8–126 SR does not respond to PI(4,5)P2 depletion and rescue.
(A–C) Representative time-lapse SDC fluorescence images of the central volume of HeLa Kyoto cells transfected with the rCDS and HIV- 1 derived constructs pCHIV and pCHIVEGFP(A) or pCHIVΔ8–126SR and pCHIVEGFP(Δ8–126 SR) (B, C). Maximum intensity projections of four focal planes acquired with an axial spacing of 0.5 μm are shown. Arrows indicate Gag-EGFP clusters. (A) Cells were treated at 22 hpt with 1% DMSO for 90 min, followed by addition of additional 1% DMSO. See Video 7 and Figure 6C and D for quantitative analysis of the number of Gag clusters over time in the cell shown in A. (B) Cells were treated at 22 hpt with 1 μM rCD1 for 90 min, followed by addition of 1 μM FK506. (C) Cells were treated at 22 hpt with 1% DMSO for 90 min, followed by subsequent addition of 1% DMSO. Scale bar represents 20 μm. (D, E) Quantitative analysis of the mean relative number of Gag(Δ8–126SR) clusters following rCD1 (black) or DMSO (grey) (D) and FK506 (black) or DMSO (grey) (E) addition, respectively. Error bars represent SEM for data from n = 3 rCD1+FK506 treated cells and n = 4 DMSO treated cells.
Figure 6—figure supplement 2
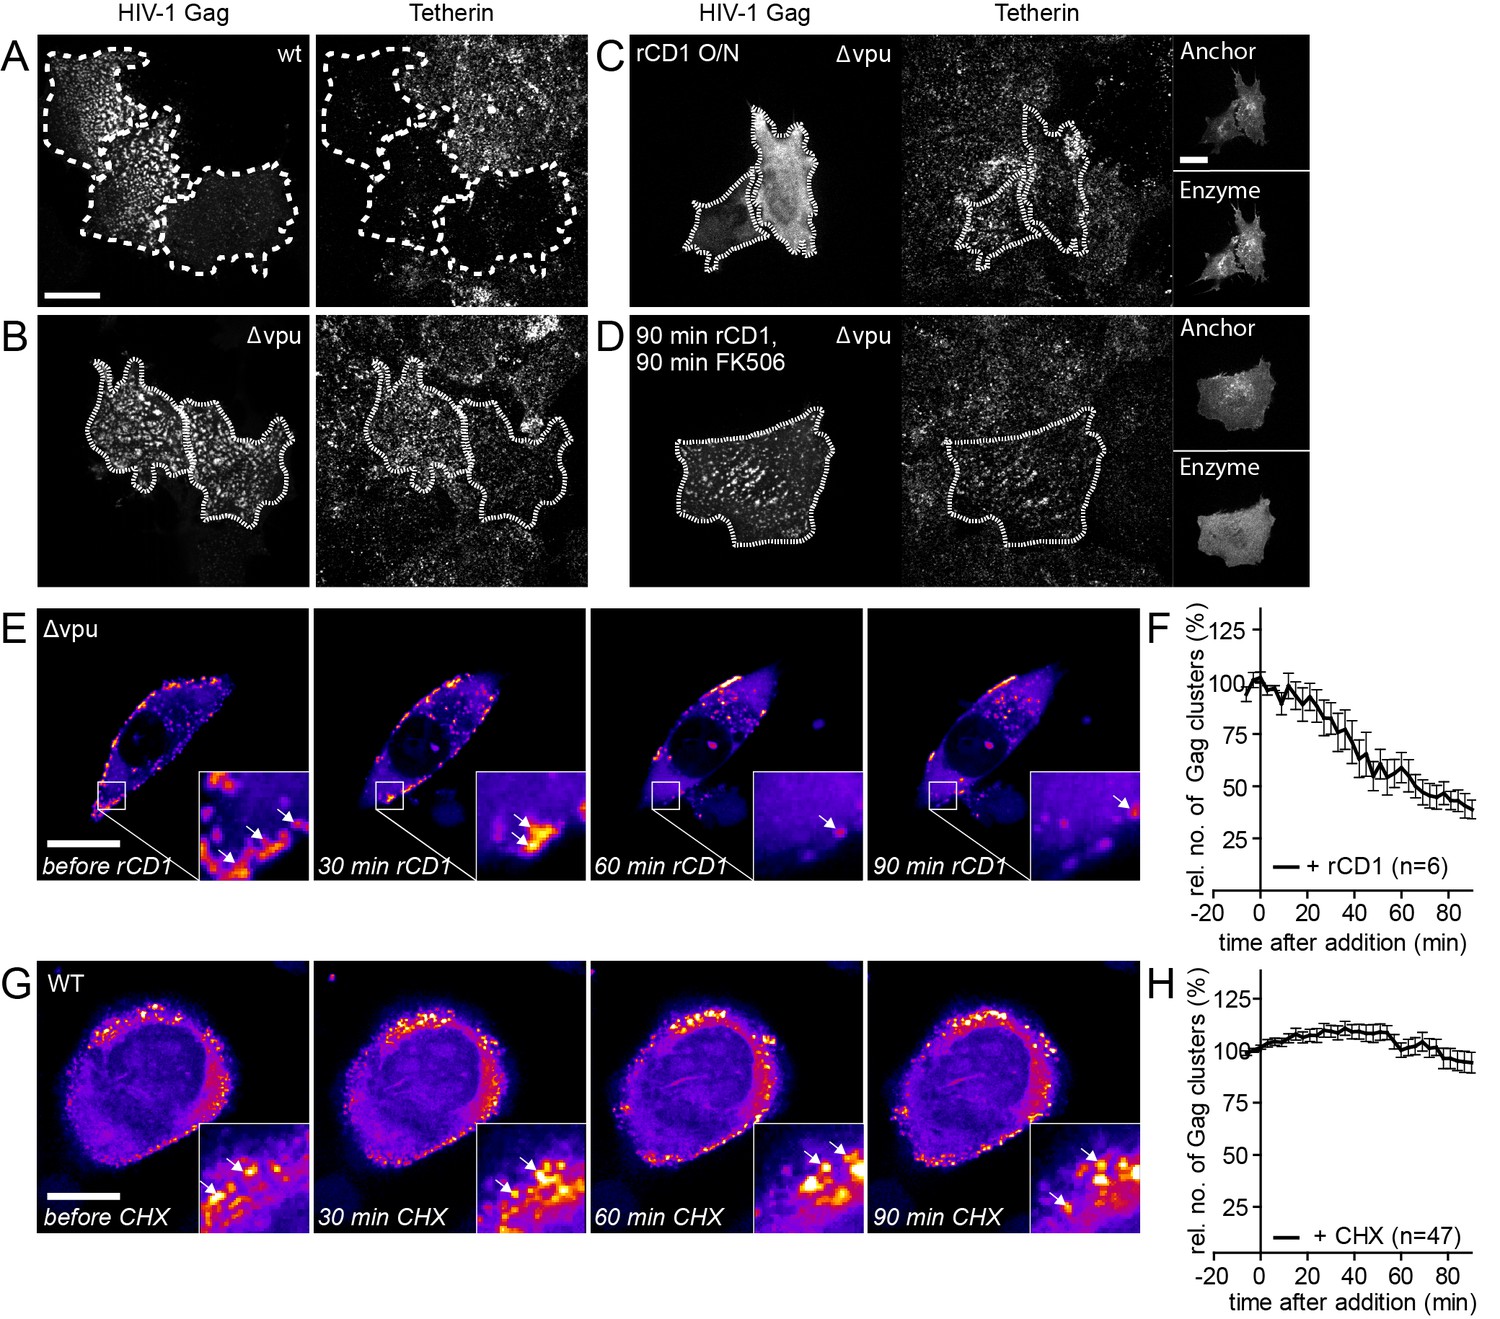
Influence of rate of particle release and new particle formation on number of Gag clusters.
(A–D) Representative SDC fluorescence images of the ventral PM of HeLa Kyoto cells transfected with HIV-1 derived constructs pCHIV and pCHIVEGFP (A), pCHIVΔvpu and pCHIVEGFPΔvpu (B) or the rCDS and HIV- 1 derived constructs pCHIVΔvpu and pCHIVEGFPΔvpu (C, D). Single focal planes are shown. Dashed lines show Gag-positive cells. Cells were either left untreated (A, B), treated with 1 µM rCD1 4 hpt (C) or treated at 22 hpt with 1 µM rCD1 for 90 min followed by 1 µM FK506 for additional 90 min (D). Cells were fixed 24.5 hpt and Tetherin was stained via immunolabeling. Scale bar represents 20 µm. (E) Representative time-lapse SDC fluorescence images of the central volume of HeLa Kyoto cells transfected with the rCDS and HIV- 1 derived constructs pCHIVΔvpu and pCHIVEGFPΔvpu. Maximum intensity projections of four focal planes acquired with an axial spacing of 0.5 μm are shown. Arrows indicate Gag-EGFP clusters. Cells were treated at 22 hpt with 1 µM rCD1 for 90 min. (F) Quantitative analysis of the mean relative number of Gag clusters following rCD1 addition. Error bars represent standard error of the mean for n = 6 cells. (G) Representative time-lapse SDC fluorescence images of the central volume of HeLa Kyoto cells transfected with the HIV- 1 derived constructs pCHIV and pCHIVEGFP. Maximum intensity projections of four focal planes acquired with an axial spacing of 0.5 μm are shown. Arrows indicate Gag-EGFP clusters. Cells were treated at 22 hpt with 10 µg/ml cycloheximide (CHX) for 90 min. Scale bar indicates 20 µm. (H) Quantitative analysis of the mean relative number of Gag clusters following CHX addition. Error bars represent SEM for data from n = 47 cells.
Figure 6—figure supplement 3
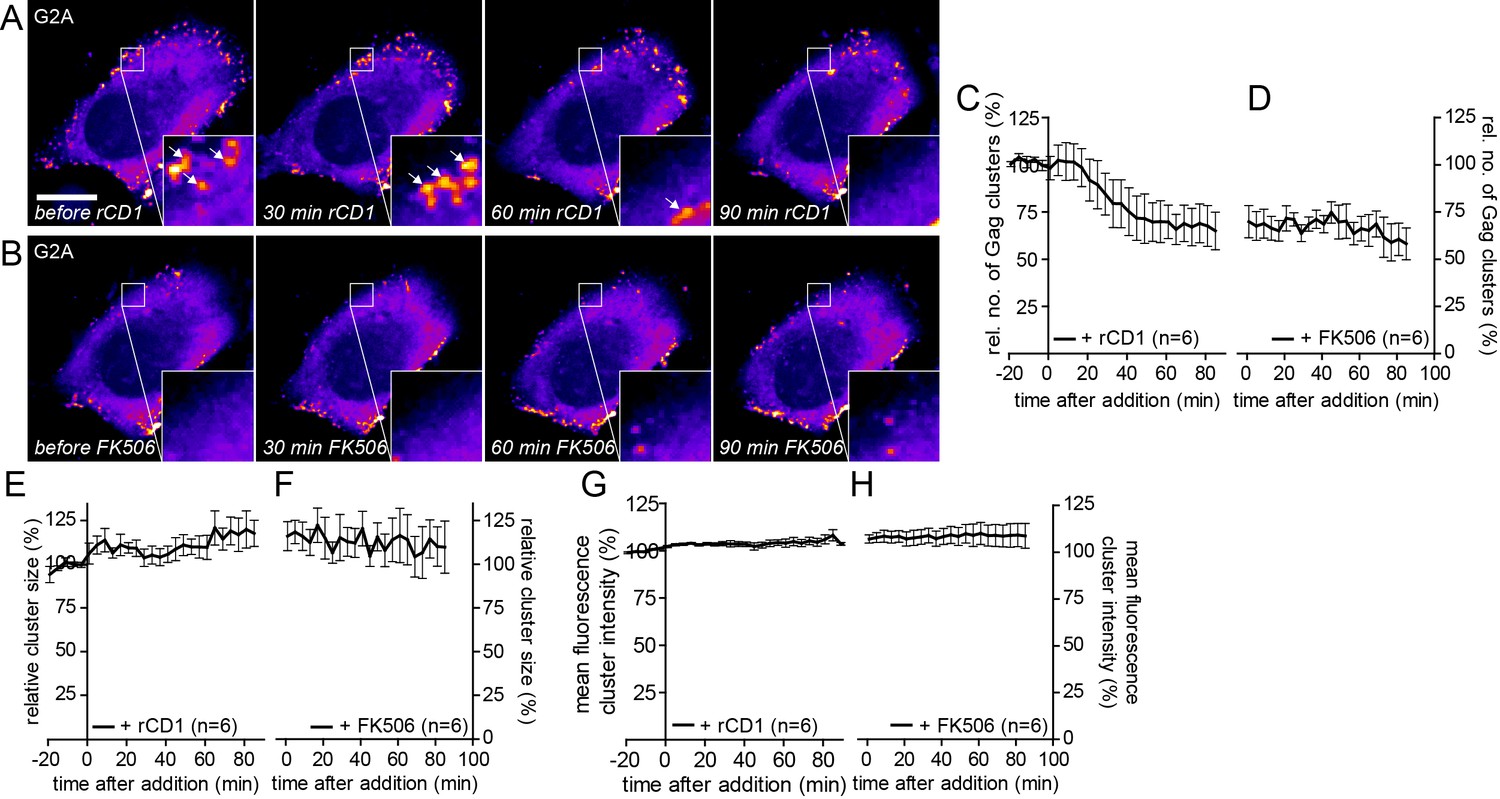
G2AGag does not respond to PI(4,5)P2 rescue following PI(4,5)P2 depletion.
(A, B) Representative time- lapse SDC fluorescence images of the central volume of a HeLa Kyoto cell transfected with the plasmids expressing the rCDS and HIV-1 derived constructs pCHIV and pGag-EGFP(G2A). Maximum intensity projections of four focal planes acquired with an axial spacing of 0.5 μm are shown. Cells were treated at 22 hpt with 1 μM rCD1 for 90 min (A), followed by addition of FK506 (B). Arrows indicate Gag-EGFP(G2A) clusters. Scale bar represents 20 μm. Quantitative analysis of the relative number of Gag-EGFP(G2A) clusters over time following rCD1 (C) and subsequent FK506 (D) treatment. Quantitative analysis of the relative cluster size of Gag-EGFP(G2A) clusters over time following rCD1 (E) and subsequent FK506 (F) treatment. Quantitative analysis of the mean fluorescence intensity of Gag-EGFP(G2A) clusters over time following rCD1 (G) and subsequent FK506 (H) treatment. Error bars represent the SEM of data from n = 6 cells.
Figure 6—figure supplement 4
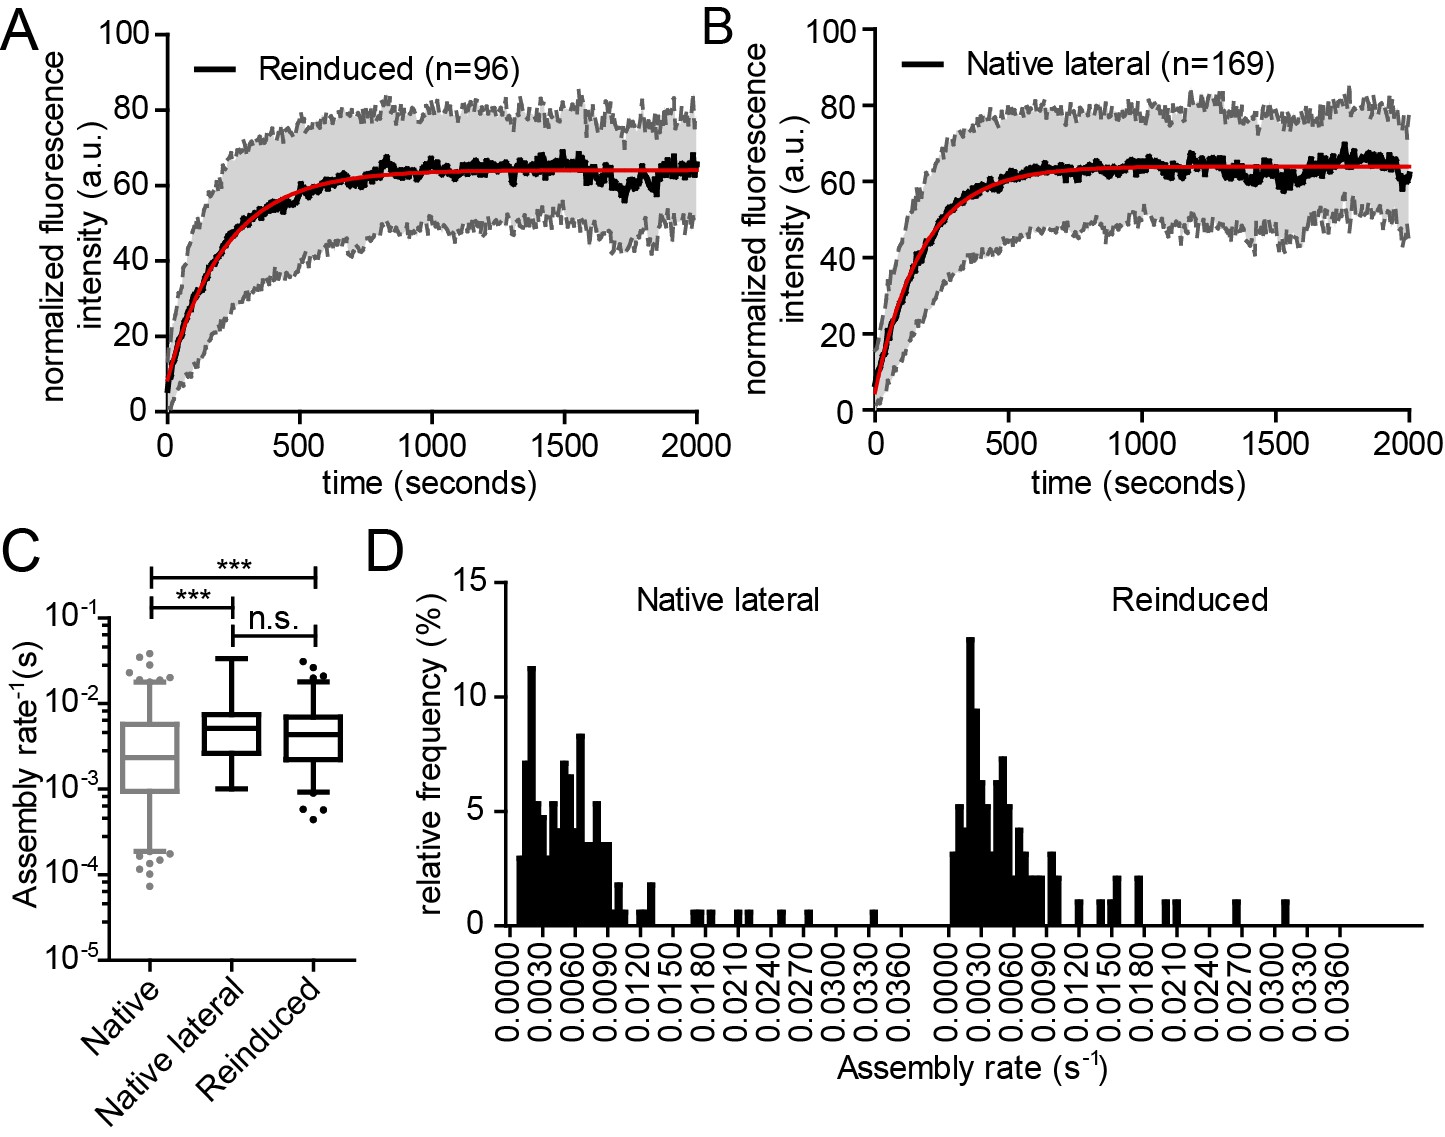
Kinetics of reinduced and native assembly at the lateral PM.
(A, B) Normalized and averaged HIV- 1 assembly traces of 96 individual reinduced assembly sites (A) and 169 individual native assembly sites (B) at the lateral PM of n = 3 and n = 6 cells, respectively. The SD is shown in grey and a single exponential fit is shown in red. (C) Assembly rate constants k of native and reinduced assembly at the lateral PM extracted from each individual assembly trace by fitting to single exponential equations. Data for native assembly were taken from main Figure 3 and shown here in grey to allow for easier comparison. Mean assembly rate constants for native and reinduced assembly at the lateral PM were 5.9 ± 0.4*10−3 s−1 and 5.8 ± 0.6*10−3 s−1. Whiskers plots represent 5–95 percentile (statistical significance was assessed with the Mann-Whitney U test, ***p≤0.001). See also Video 8 for a representative high time-resolution SDC microscopy movie of reinduced assembly. (D) Relative frequency distribution of native (lateral) and reinduced assembly rates k extracted from HIV-1 assembly traces of 169 individual native (left) and 96 individual induced (right) assembly sites at the lateral membrane from n = 6 cells and n = 3 cells, respectively, fitted to single exponential equations. The frequency distribution was plotted after binning with a bin width of 0.0005 s−1.
Figure 7
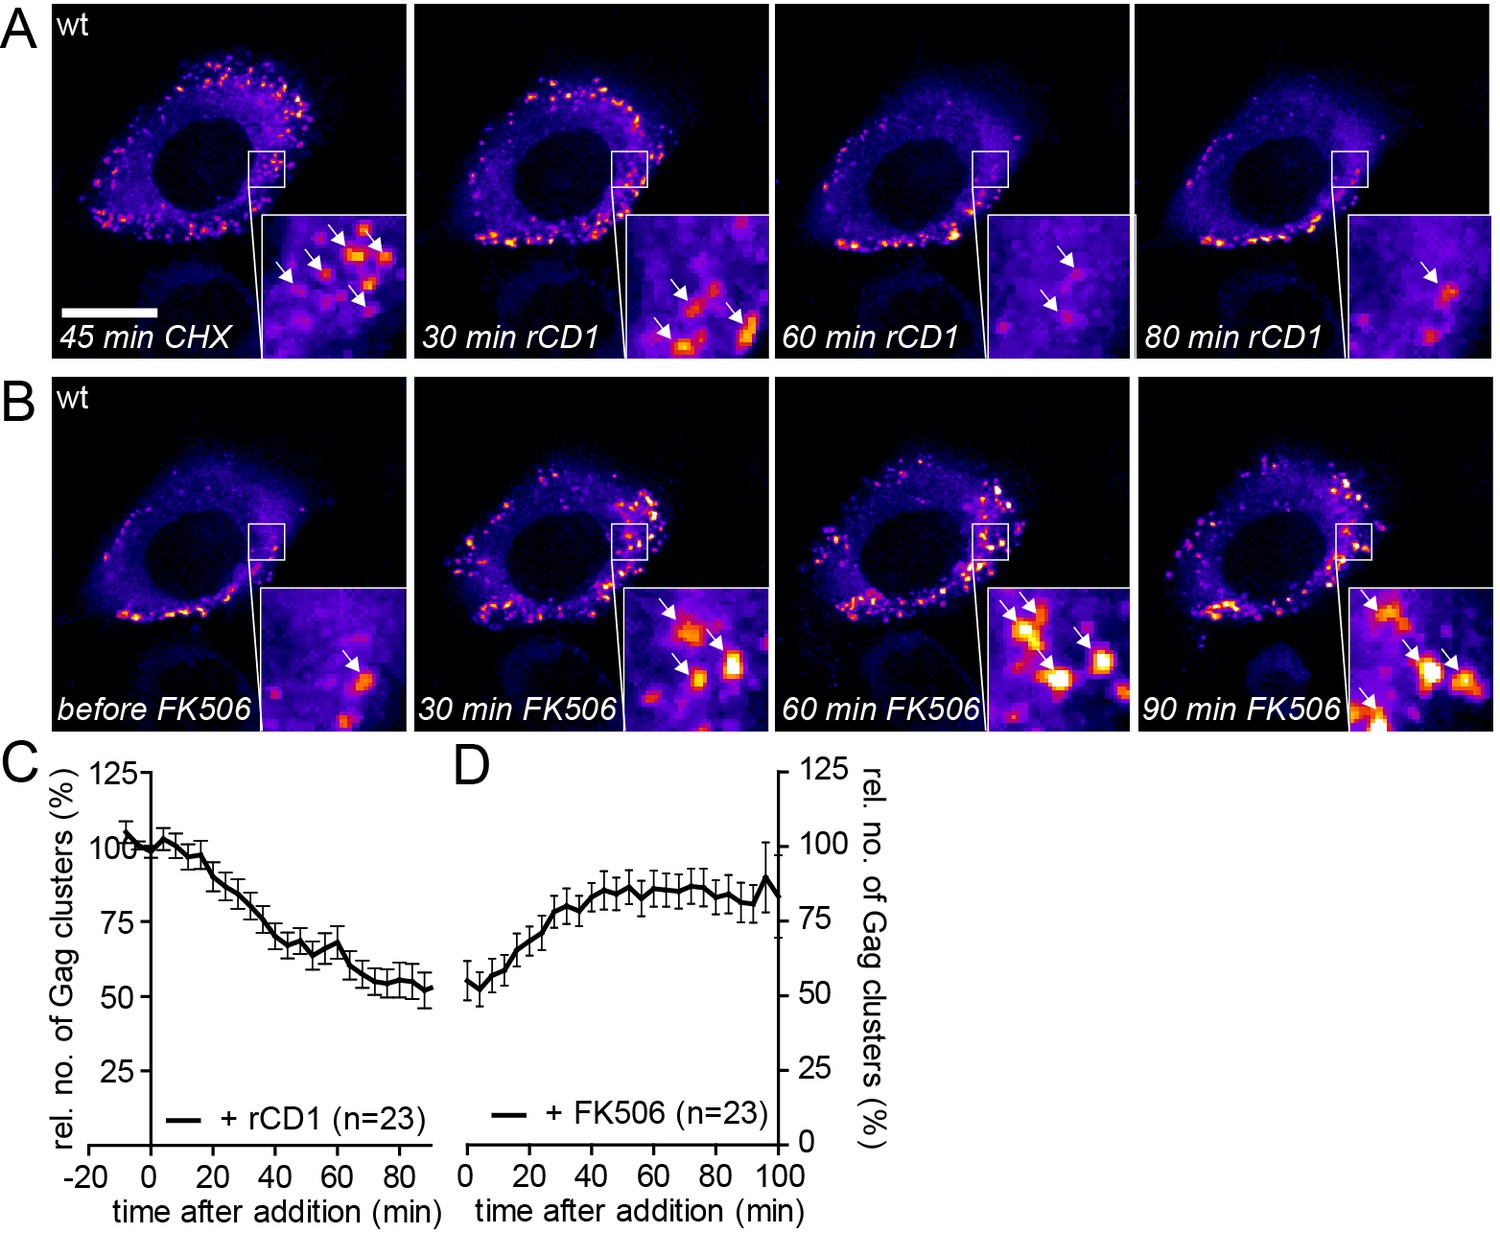
Assembly of Gag can be reinduced in the presence of cycloheximide.
(A, B) Representative time-lapse SDC fluorescence images of the central volume of a HeLa Kyoto cell transfected with plasmids expressing the rCDS and HIV-1 constructs pCHIV and pCHIVEGFP. Maximum intensity projections of four focal planes acquired with an axial spacing of 0.5 µm are shown. Cells were pre-treated at 21 hpt with 10 µg/ml CHX for 60 min. Subsequently cells were treated with 1 µM rCD1 for 90 min (A), followed by addition of FK506 (B). Arrows indicate individual Gag-EGFP clusters. Scale bar represents 20 µm. (C, D) Relative number of Gag-EGFP clusters over time following rCD1 (C) or FK506 (D) treatment. Error bars represent SEM of data from n = 23 cells from three independent experiments.
Figure 8
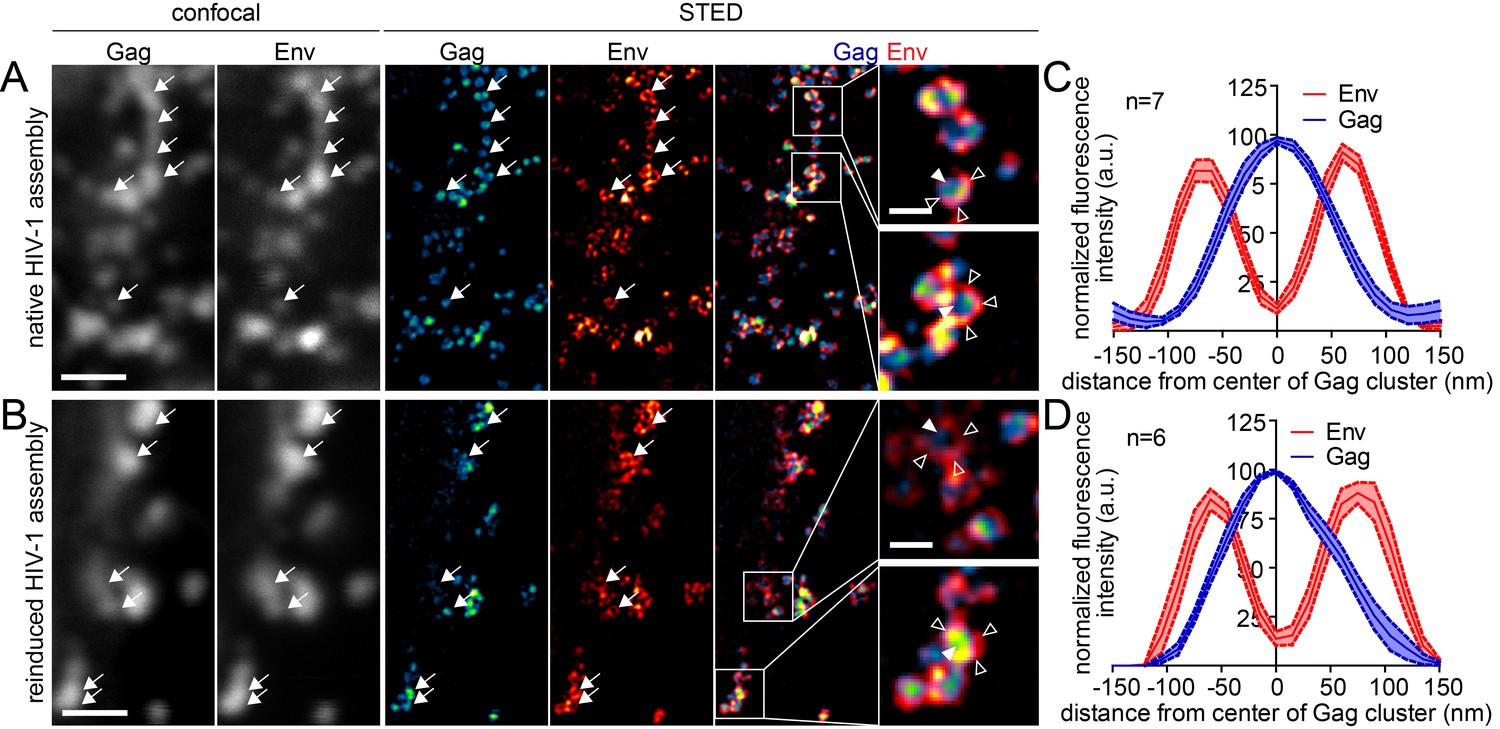
Native and reinduced HIV-1 assembly sites are indistinguishable by STED nanoscopy.
(A, B) Confocal (left) and STED images (right) of the lateral PM of fixed HeLa Kyoto cells expressing only the HIV-1 constructs pCHIV and pCHIVCLIP (native assembly, (A)) or in addition the plasmids expressing the rCDS (reinduced assembly, (B)). In B, dissociation of assembled Gag clusters was induced by addition of 1 µM rCD1 for 90 min at 22 hpt; subsequently Gag assembly was reinduced by addition of 1 µM FK506 for 90 min. Gag (cyan) was detected via Atto 590 CLIP and Env (red) was detected via indirect immunolabeling. Some individual HIV-1 assembly sites are highlighted by arrows. Gag clusters (filled arrowheads) were surrounded by Env accumulations (open arrowheads). Scale bar represents 1 µm (overview images) or 200 nm (enlargements). (C, D) Averaged line profiles of selected native (C) or induced (D) Gag assembly sites (n = 7 and n = 6 for native and reinduced assembly sites, respectively). Error bars represent SEM.
Videos
Video 1
Reversible PI(4,5)P2 depletion from the PM by the rCDS.
Representative time-lapse SDC fluorescence microscopy sequence of the central volume of HeLa Kyoto cells transfected with the plasmids expressing the rCDS and the PI(4,5)P2 detector protein EGFP-PLCδ-PH. The maximum intensity projection of four focal planes acquired with an axial spacing of 0.5 μm is shown. Treatment with 1 μM rCD1 at 22 hpt induced translocation of the Enzyme to the PM (see insert box), leading to depletion of EGFP-PLCδ-PH from the PM. Subsequent addition of 1 μM FK506 releases the Enzyme from the PM (see insert box) and restored EGFP-PLCδ- PH binding. The sequence was acquired at a time resolution of 2 min/frame and is displayed with 6.2 fps. See also Figure 1—figure supplement 1A for corresponding video still images.
Video 2
Induction of HIV-1 assembly in PI(4,5)P2 depleted cells by PI(4,5)P2 reconstitution.
Representative time-lapse SDC fluorescence microscopy sequence of the ventral PM of a HeLa Kyoto cell transfected with the rCDS and HIV-1 derived constructs pCHIV and pCHIVEGFP. Cells were treated with 1 μM rCD1 at 4 hpt, followed by addition of 1 μM FK506 at 22 hpt. The sequence was acquired at a time resolution of 1 min/frame and is displayed with 12 fps. See Figure 2A for corresponding still images.
Video 3
Addition of DMSO solvent control to PI(4,5)P2 depleted cells does not induce Gag assembly.
Representative time-lapse SDC fluorescence sequence of the ventral membrane of a HeLa Kyoto cell transfected with the rCDS and HIV-1 derived constructs pCHIV and pCHIVEGFP. Cells were treated with 1 μM rCD1 4 hpt, followed by addition of 1% DMSO solvent control at 22 hpt. The sequence was acquired at a time resolution of 2 min/frame and is displayed with 4.6 fps. See also Figure 2B for corresponding video still images.
Video 4
High time resolution TIRF imaging of native Gag assembly.
Representative time-lapse TIRF microscopy sequence of the ventral PM of a HeLa Kyoto cell transfected with the HIV-1 derived constructs pcHIV and pCHIVEGFP. Cells were imaged at 22 hpt. The cell shows only few assembly sites in the beginning of the movie and progresses in assembly throughout the sequence. The sequence was acquired at a time resolution of 5 s/frame and is displayed with 140 fps. See Figure 3, showing the assembly kinetics derived from this and additional movies.
Video 5
High time resolution TIRF imaging of induced Gag assembly.
Representative time-lapse TIRF microscopy sequence of the ventral PM of a HeLa Kyoto cell transfected with the rCDS and HIV-1 derived constructs pcHIV and pCHIVEGFP. Cells were treated at 4 hpt with 1 μM rCD1 for 90 min, followed by addition of 1 μM FK506 at 22 hpt. The sequence was acquired at a time resolution of 5 s/frame and is displayed with 140 fps. See Figure 3, showing the assembly kinetics derived from this and additional movies.
Video 6
The partially assembled Gag lattice dissociates reversibly upon PI(4,5)P2 depletion.
Representative time-lapse SDC fluorescence microscopy sequence of the central volume of a HeLa Kyoto cell transfected with the rCDS and HIV-1 derived constructs pcHIV and pCHIVEGFP. Maximum intensity projections of four focal planes acquired with an axial spacing of 0.5 μm are shown. Cells were treated at 22 hpt with 1 μM rCD1 for 90 min, followed by addition of 1 μM FK506. The sequence was acquired at a time resolution of 4 min/frame and is displayed with 4 fps. See Figure 6A and B for corresponding still images.
Video 7
Addition of DMSO solvent control does not affect already assembled Gag clusters.
Representative time-lapse SDC fluorescence microscopy sequence of the central volume of HeLa Kyoto cells transfected with the plasmids expressing the rCDS and HIV-1 derived constructs pcHIV and pCHIVEGFP. Maximum intensity projections of four focal planes acquired with an axial spacing of 0.5 μm are shown. Cells were treated at 22 hpt with 1% DMSO for 90 min, followed by addition of additional 1% DMSO. The sequence was acquired at a time resolution of 2.5 min/frame and is displayed with 8 fps. See Figure 6—figure supplement 1A for corresponding still images.
Video 8
High time resolution SDC imaging of reinduced Gag assembly.
Representative time-lapse SDC fluorescence microscopy sequence of the central volume of a HeLa Kyoto cell transfected with the plasmids expressing the rCDS and HIV-1 derived constructs pcHIV and pCHIVEGFP. Maximum intensity projections of four focal planes acquired with an axial spacing of 0.5 μm are shown. Cells were treated at 22 hpt with 1 μM rCD1 for 90 min, followed by addition of 1 μM FK506. The sequence was acquired at a time resolution of 6 s/frame and is displayed with 100 fps. See Figure 6—figure supplement 4, showing the assembly kinetics derived from this and additional movies.
Additional files
-
Supplementary file 1
Plasmid sequence pCHIV(d8-126 SR).
- https://doi.org/10.7554/eLife.25287.027
-
Supplementary file 2
Plasmid sequence pCHIVGFP(d8-126 SR).
- https://doi.org/10.7554/eLife.25287.028
-
Supplementary file 3
Plasmid sequence pCHIVSNAP(d8-126 SR).
- https://doi.org/10.7554/eLife.25287.029
Download links
A two-part list of links to download the article, or parts of the article, in various formats.
Downloads (link to download the article as PDF)
Open citations (links to open the citations from this article in various online reference manager services)
Cite this article (links to download the citations from this article in formats compatible with various reference manager tools)
Synchronized HIV assembly by tunable PIP2 changes reveals PIP2 requirement for stable Gag anchoring
eLife 6:e25287.
https://doi.org/10.7554/eLife.25287


