Pharmacological evidence for a metabotropic glutamate receptor heterodimer in neuronal cells
- Institut de Génomique Fonctionnelle (IGF), CNRS, INSERM, Univ. Montpellier, France
- Universitat Autònoma de Barcelona, Spain
- Network Biomedical Research Center on Mental Health, Spain
- CisBio Bioassays, France
Figures
Figure 1 with 3 supplements
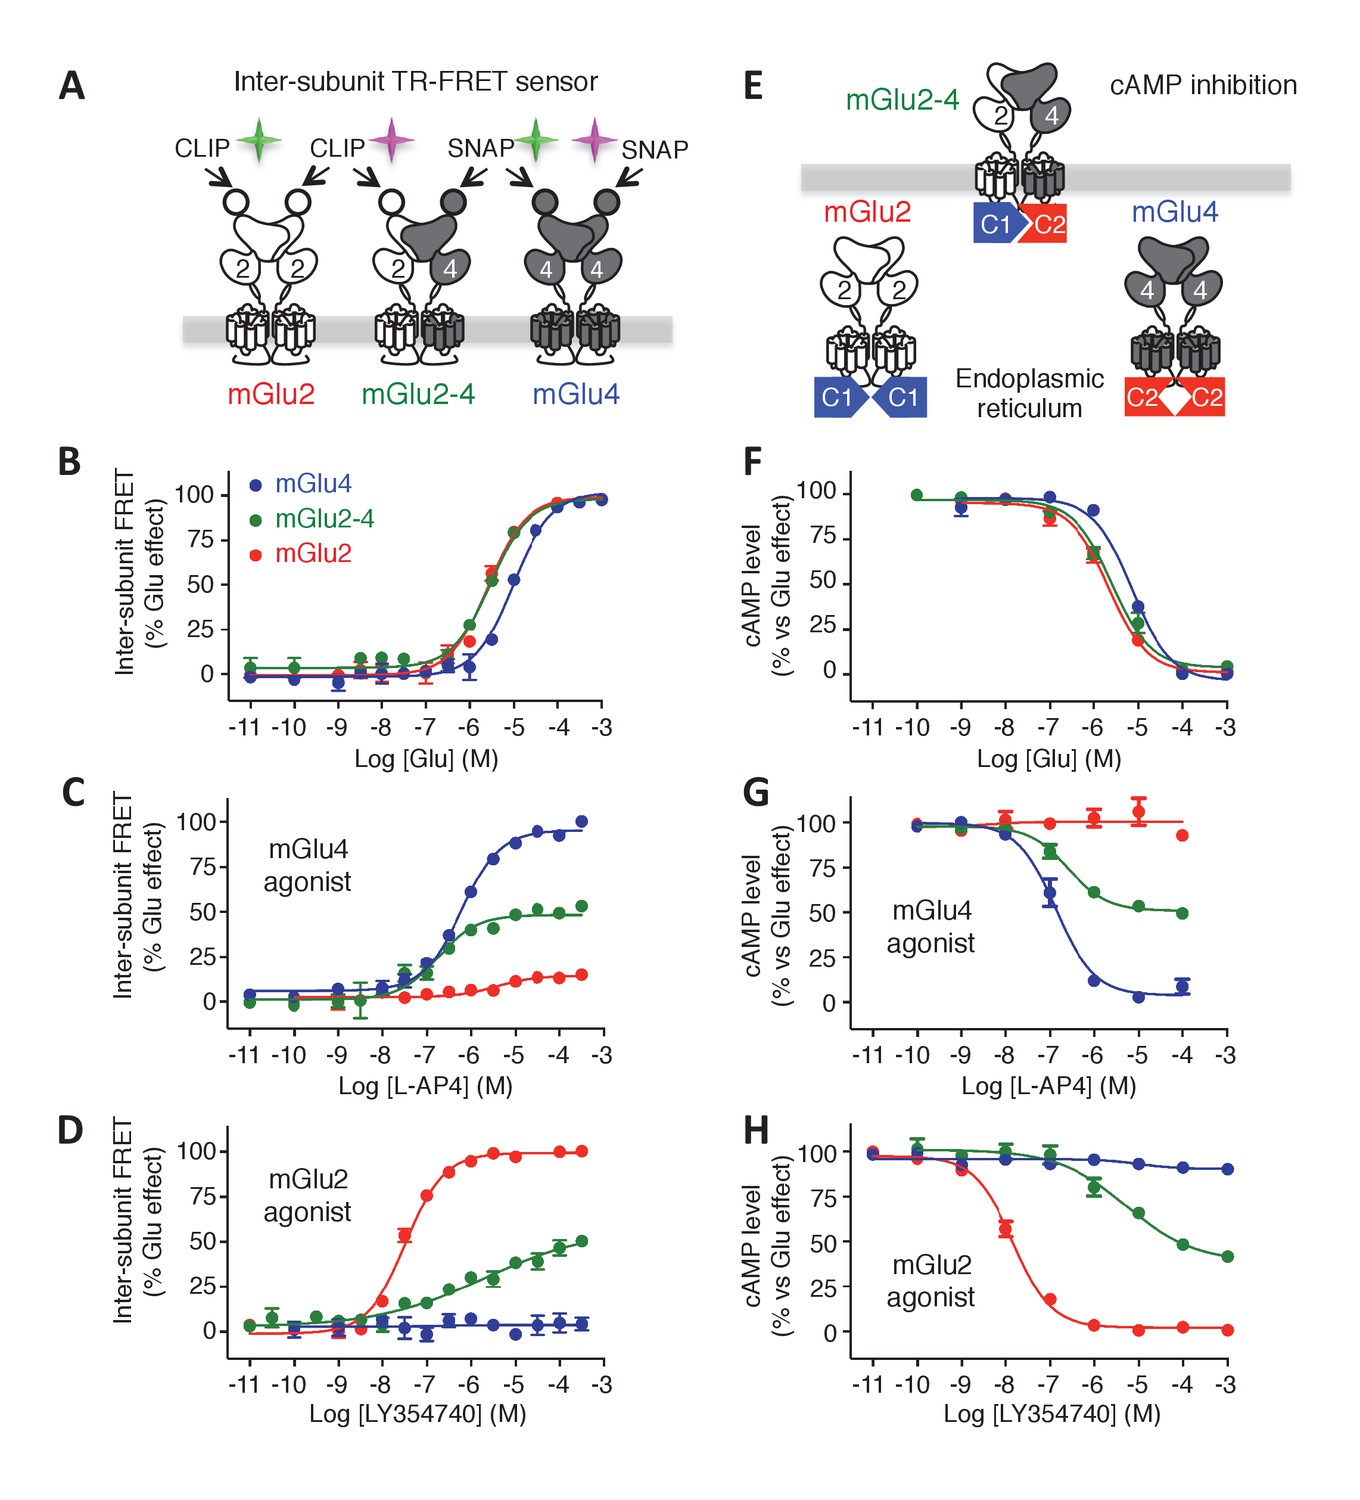
Phamacological profile of mGlu2, mGlu4 and mGlu2-4 receptors.
(A) Schematic representation of TR-FRET mGlu sensors generated. (B–D) Specific effect on VFT rearrangement of the CLIP-CLIP mGlu2 (red), SNAP-CLIP mGlu2-4 (green) or SNAP-SNAP mGlu4 (blue) with increasing concentrations of the indicated compound. (E) Schematic representation of the C1-C2 expression control system used for a specific expression of mGlu2-4 heterodimers at the cell surface. (F–H) Specific detection of the inhibition of cAMP pathway using C1-C2 expression control system for mGlu2-4 (green), as well as wild-type mGlu2 (red) and wild-type mGlu4 (blue). Glutamate and the specific agonists of mGlu4 (L–AP4) and mGlu2 (LY354740) present similar pharmacological profile using both techniques. Results are mean ± SEM from three independent experiments performed in triplicates.
Figure 1—figure supplement 1
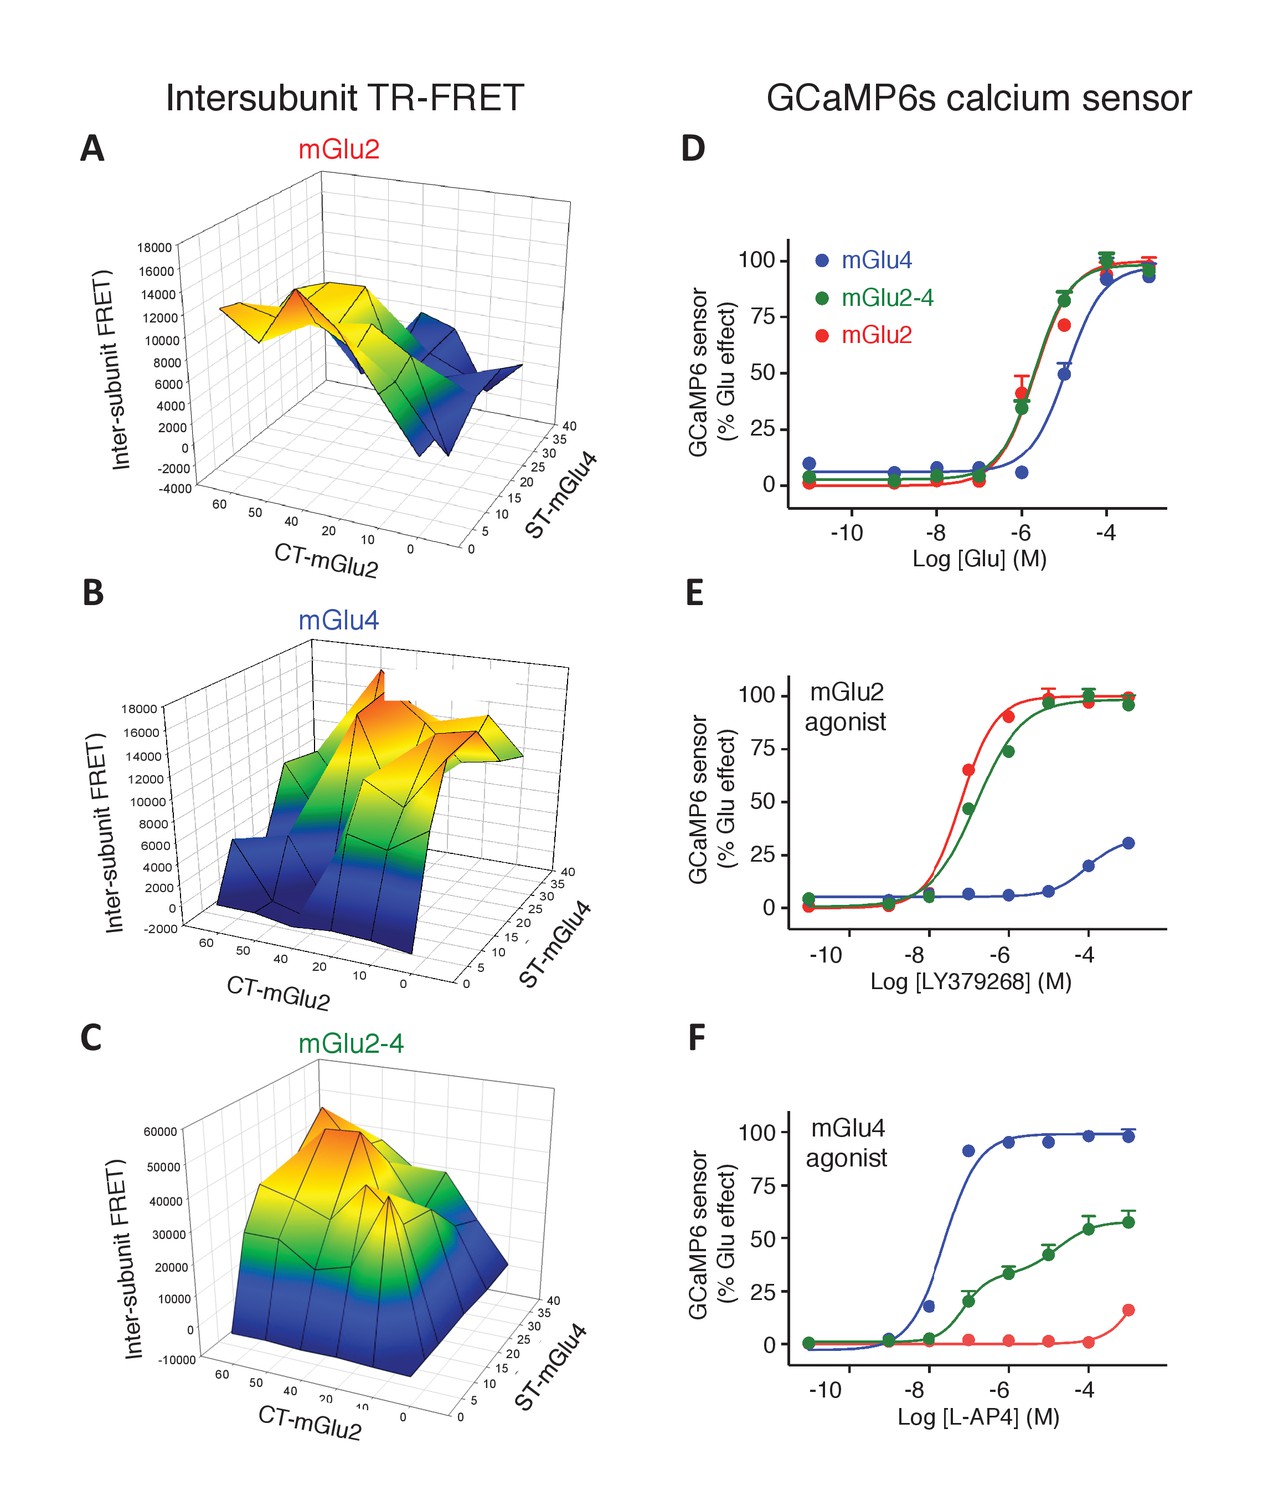
Optimization of mGlu2, mGlu4 and mGlu2-4 expressing cells by TR-FRET and signaling.
(A–C) Cells transfected with various amount of CLIP(CT)-mGlu2 and SNAP(ST)-mGlu4 were labeled with CLIP donor and CLIP acceptor (A), SNAP-donor and SNAP-Acceptor (B), or CLIP-donor and SNAP-acceptor (C). TR-FRET signals were measured and plotted as a function of the amount of mGlu2 and mGlu4 plasmid used for the transfection. TR-FRET signal intensity is color coded, high value in red while the low values are in dark blue and is used as a representation of the amount of mGlu2 homodimers (A), mGlu4 homodimers (B) and mGlu2-4 heterodimers (C). (D-F) Calcium increase in optimized conditions of expression of mGlu2-4 (green), or in cells expressing mGlu4 alone (blue) or mGlu2 alone (red), when activated by glutamate (D), LY379268 (E), or L-AP4 (F). Data are means ± SEM of three experiments performed in triplicates. Values are in percent of the glutamate effect measured in mGlu2-expressing cells (D, E) and mglu4-expressing cells (F).
Figure 1—figure supplement 2
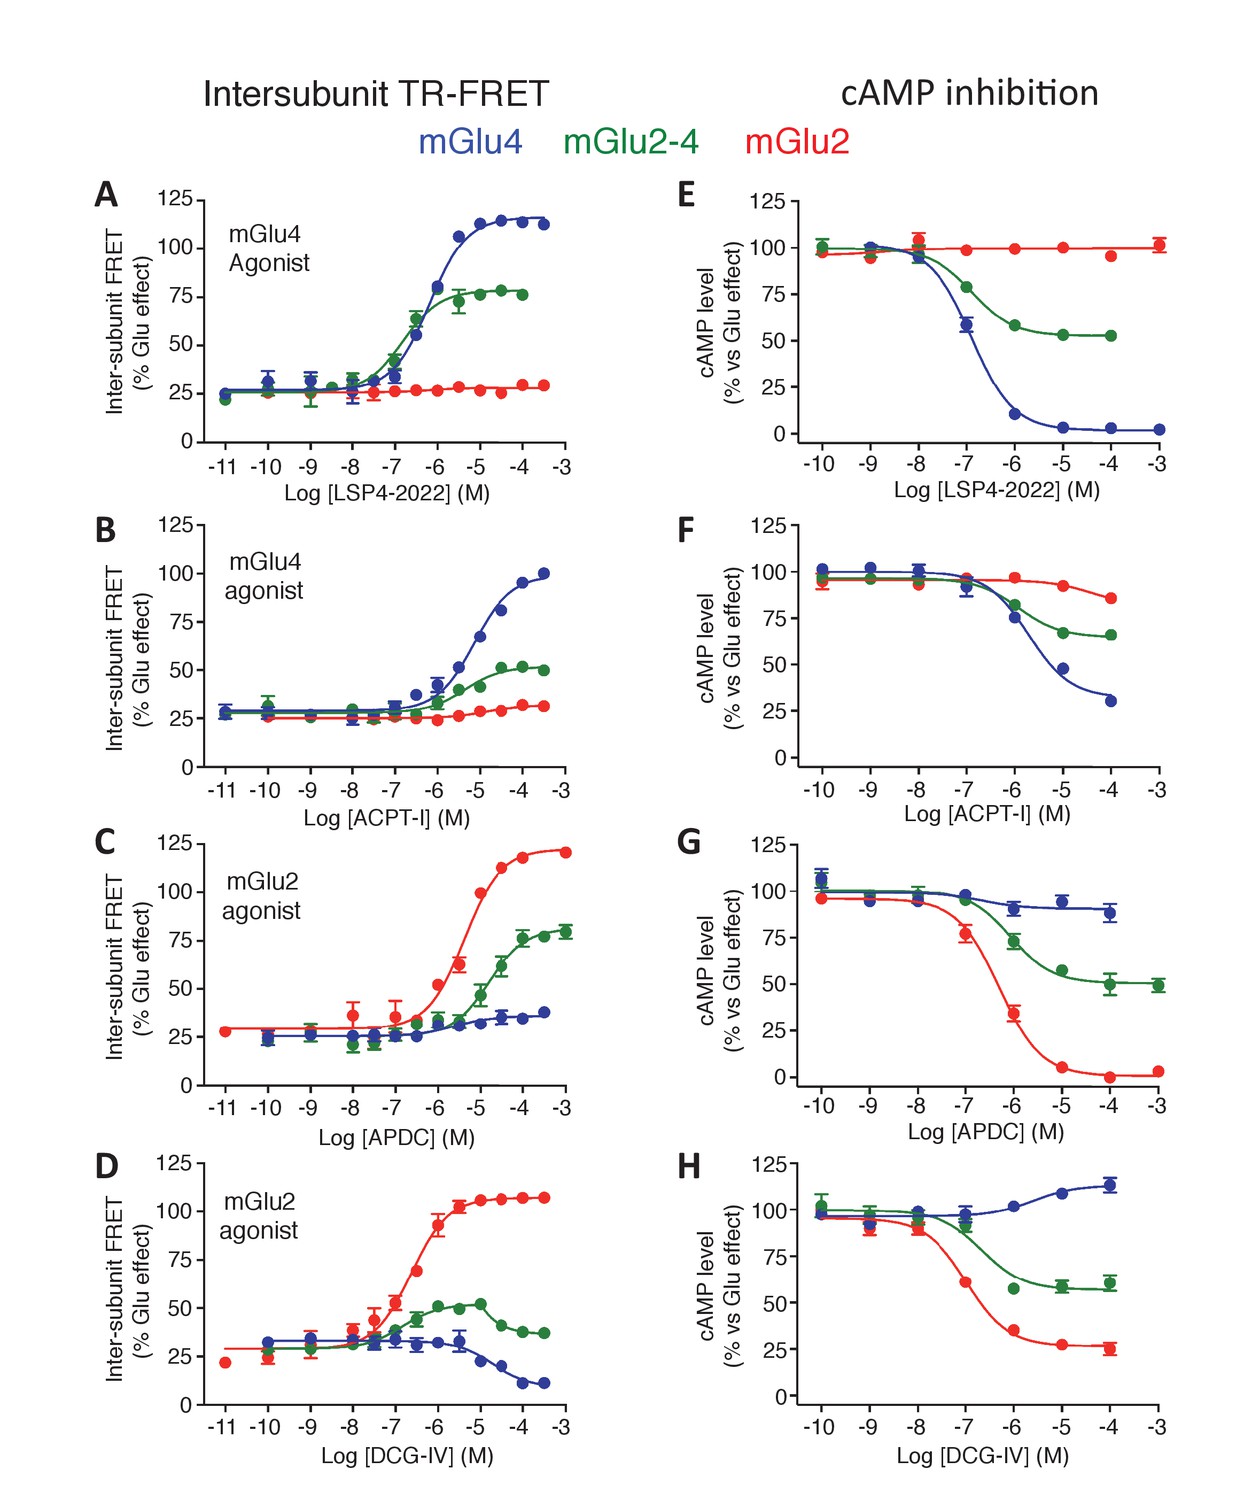
Pharmacological profile of mGlu2 (red curves), mGlu4 (blue curves) and mGlu2-4 (Green curves) expressing cells upon activation by mGlu4 or mGlu2 ligands by TR-FRET (A–D) and cAMP signaling (E–H).
Results are mean ± SEM performed in three independent experiments.
Figure 1—figure supplement 3
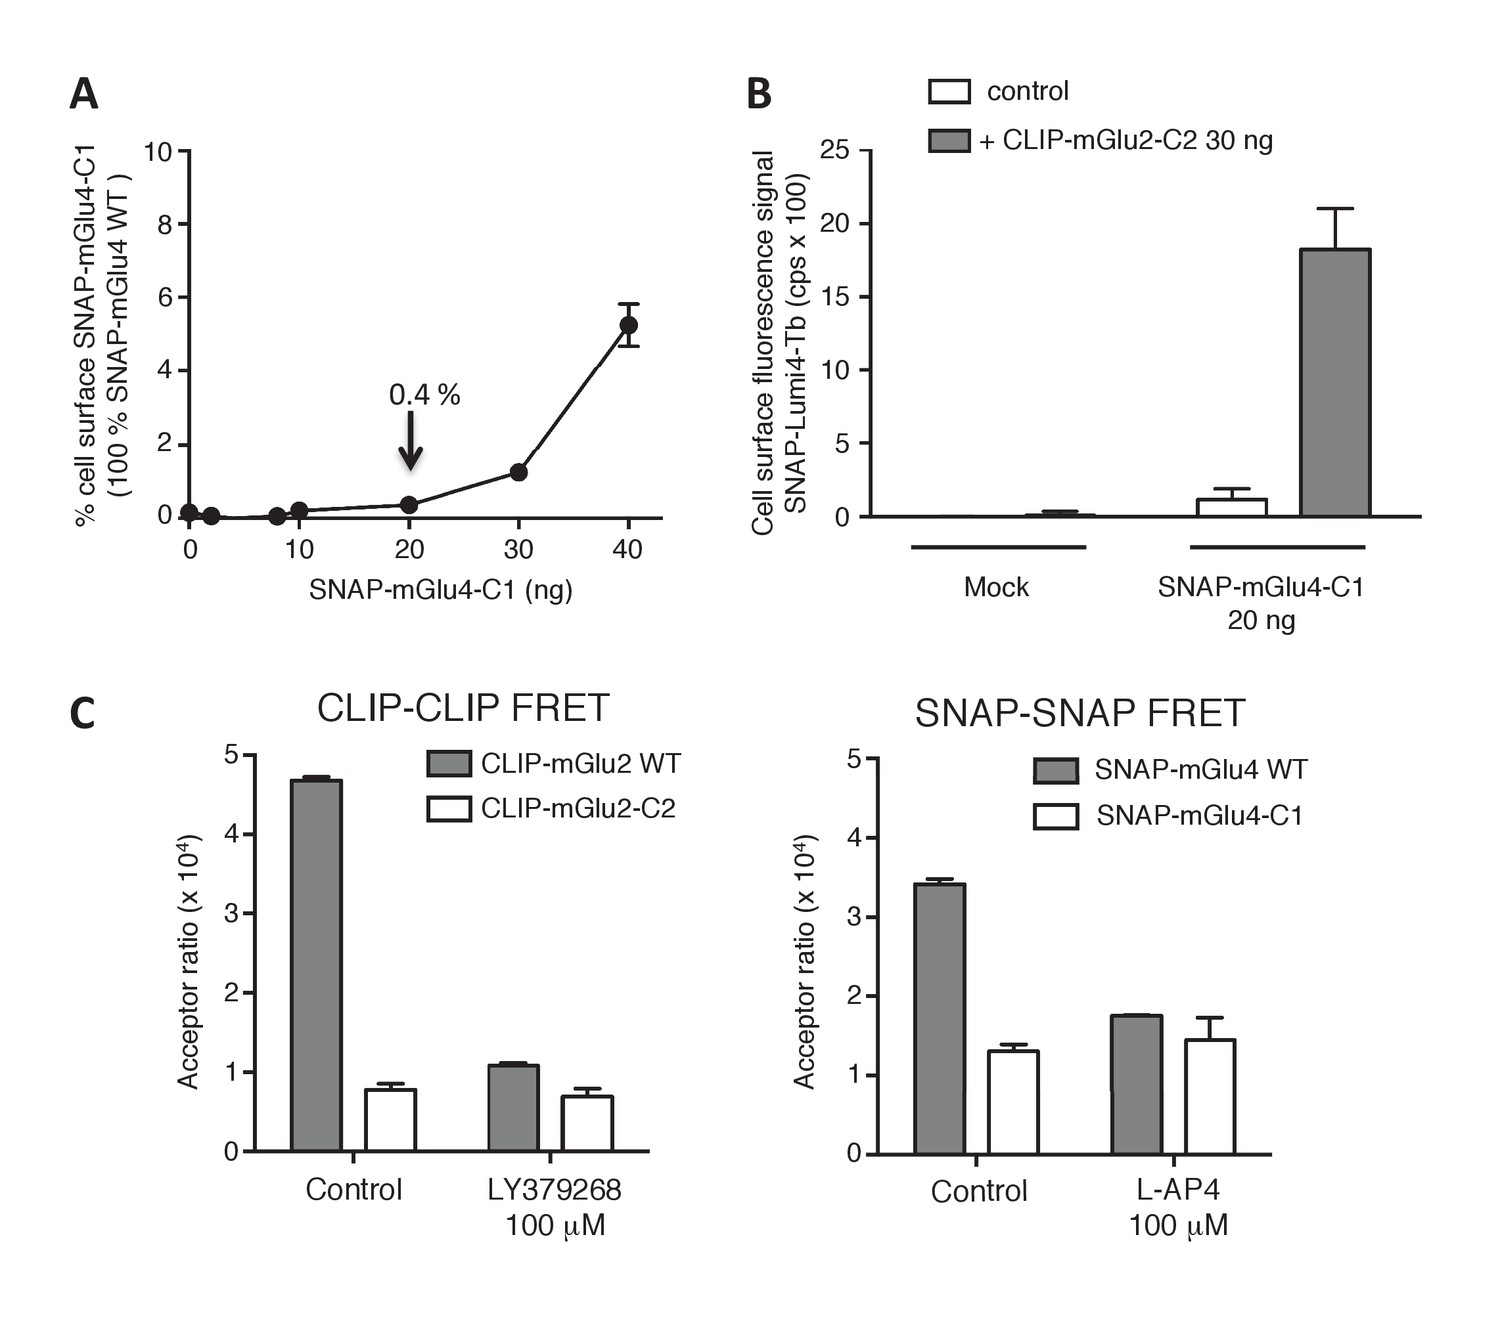
Validation of the use of C1-C2 constructs to get mGlu2-4 heterodimer only at the cell surface.
(A) Percentage of cell surface SNAP-mGlu4-C1 in comparison to SNAP-mGlu4 wild-type, measured after SNAP-Lumi4-Tb labeling of cells transfected with different amounts of SNAP-mGlu4-C1 or SNAP-mGlu4 wild-type cDNAs. (B) Amount of cell surface SNAP-mGlu4-C1 in presence or absence of CLIP-mGlu2-C2, measured by the emission of SNAP-Lumi4-Tb for the indicated amounts of transfected SNAP-mGlu4-C1 cDNA. (C) in cells expressing ST-mGlu4-C1 (20 ng) and CT-mGlu2-C2 (30 ng), although low FRET signals could be detected between CLIP or SNAP subunits, such signal likely corresponds to bystander FRET rather than cell surface homodimers since the FRET signals are not affected by agonist activation.
Figure 2 with 1 supplement
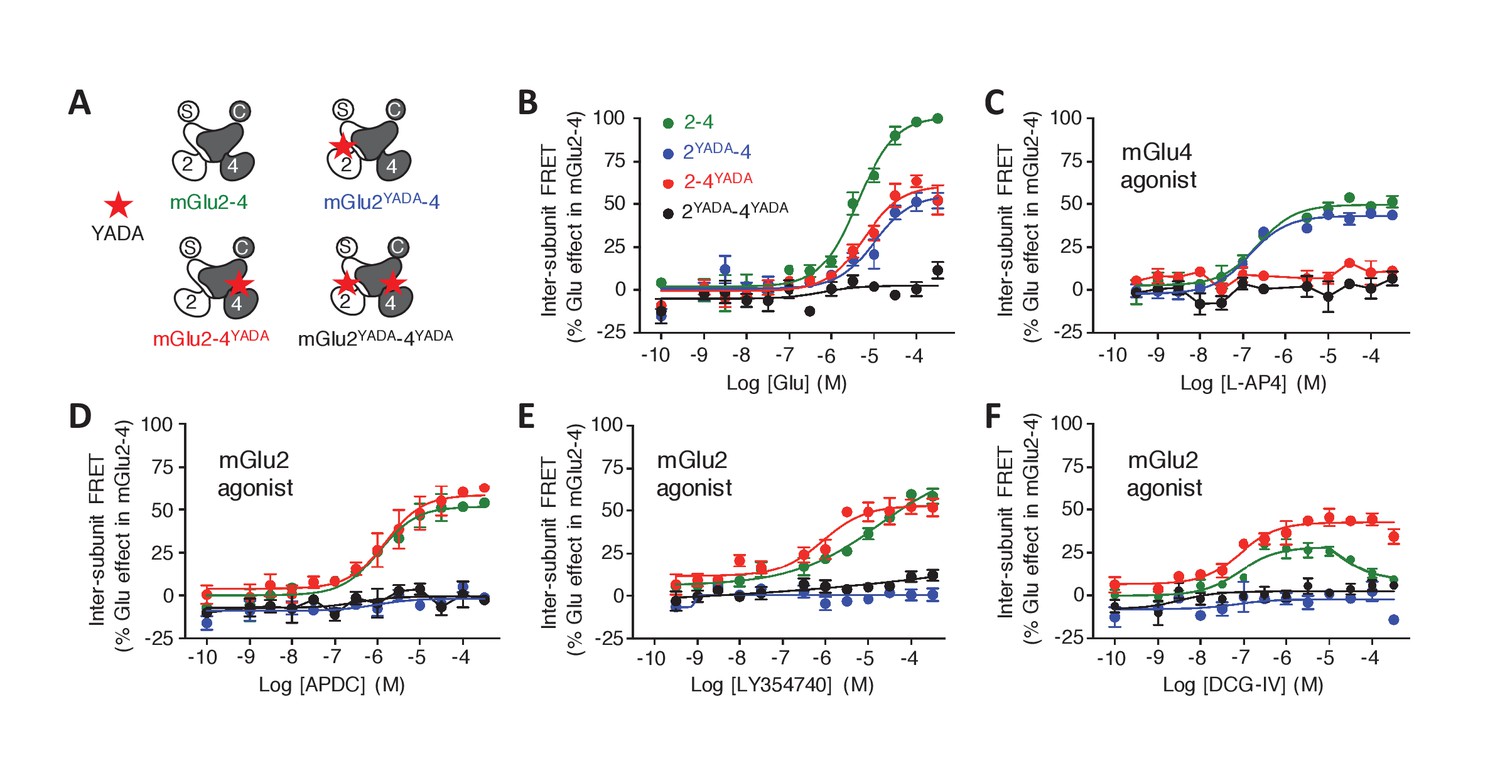
Role of each binding site in agonist-induced activity of mGlu2-4.
(A) Schematic representation of the mGlu2-4 mutants; wild type (green), YADA mutation in mGlu2 (blue), mGlu4 (red) or both (black). (B–F) Effect of increasing concentrations of the indicated ligands on the mGlu2-4 TR-FRET sensor. Results are mean± SEM of three independent experiments performed in triplicates.
Figure 2—figure supplement 1
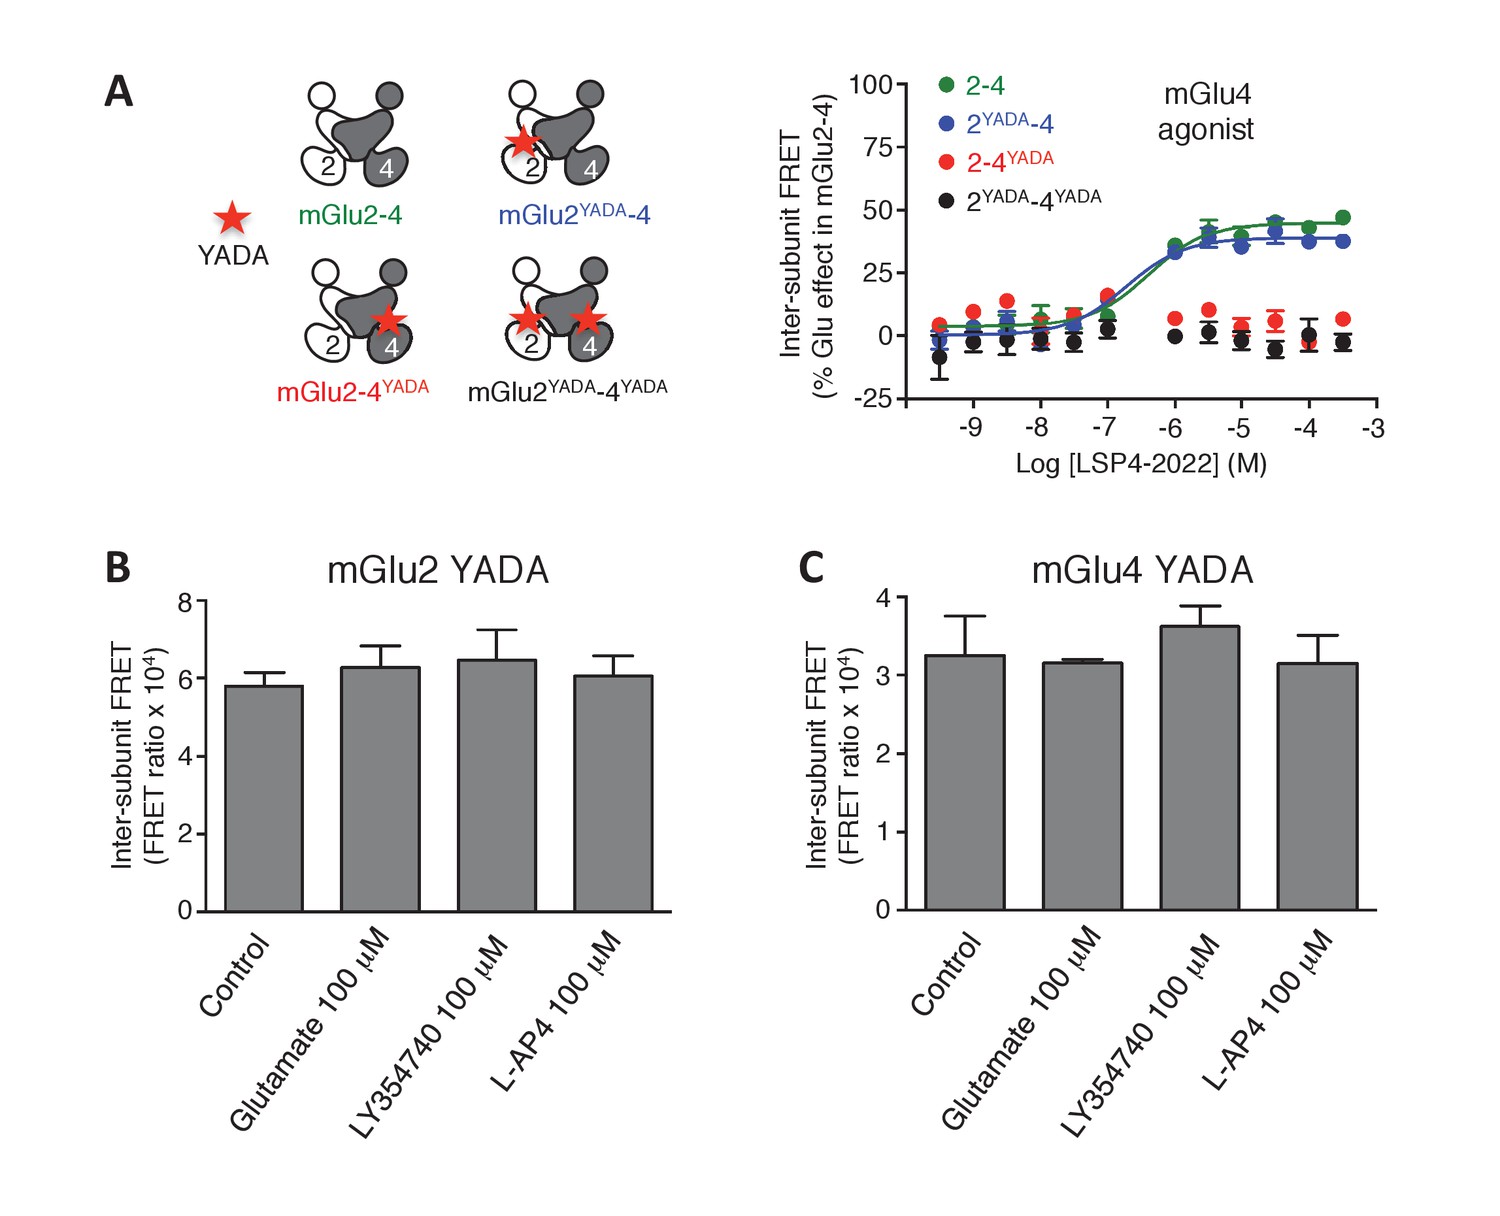
Lack of activation of mGlu2 and mGlu4 mutated in their binding site.
(A) mGlu2-4 TR-FRET sensor with mutation in the glutamate-binding site upon activation by LSP4-2022. (B–C) In the homodimers, FRET between CLIP or SNAP subunits is not affected by activation with the indicated agonists. Results are mean ± SEM of three independent experiments.
Figure 3 with 2 supplements
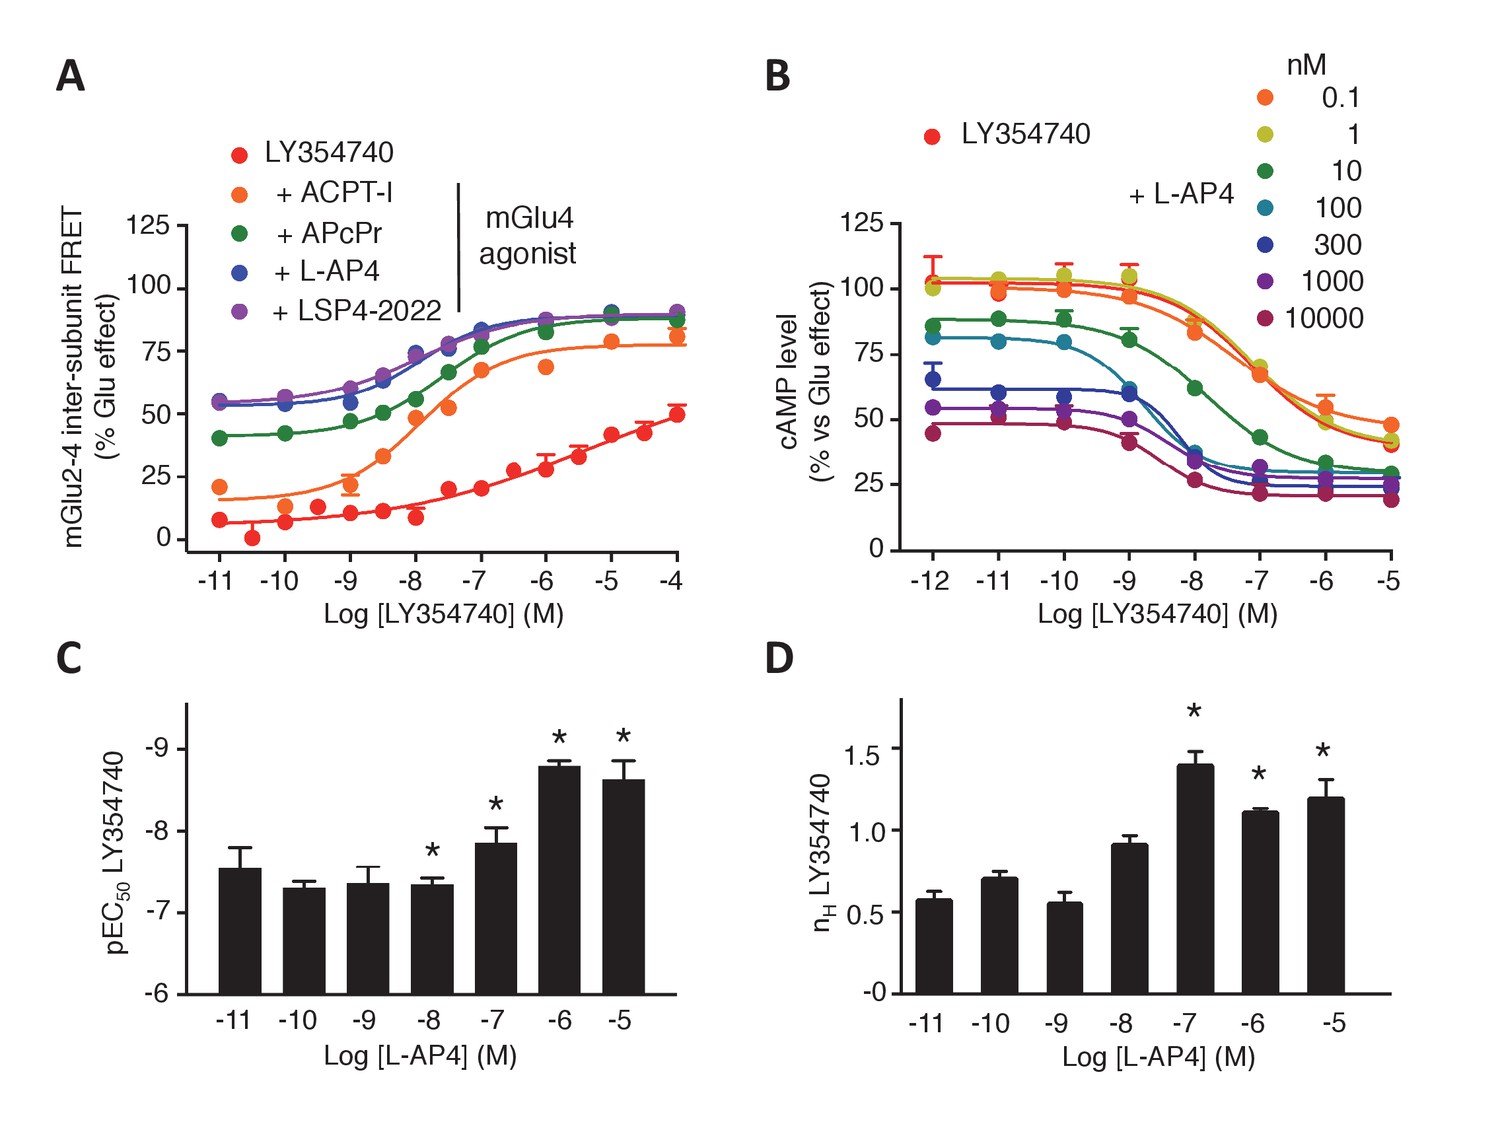
Synergistic action of mGlu2 and mGlu4 agonists in mGlu2-4 heterodimer.
(A–B) Dose response curves of the mGlu2 ligand LY354740 in absence or presence of mGlu4 ligands (ACPT-I 10 µM, APcPr 3 µM, L-AP4 3 µM or LSP4-2022 3 µM) on the TR-FRET assay (A) and the inhibition of forskolin-induced cAMP production (B). (C–D) LY35740 EC50 (C) or Hill slope (D) in the presence of the indicated concentration of L-AP4. Results are mean ± SEM of three independent experiments performed in triplicates. Curve fitting was performed by using nonlinear regression. p-values<0.05 were considered statistically significant (*).
Figure 3—figure supplement 1
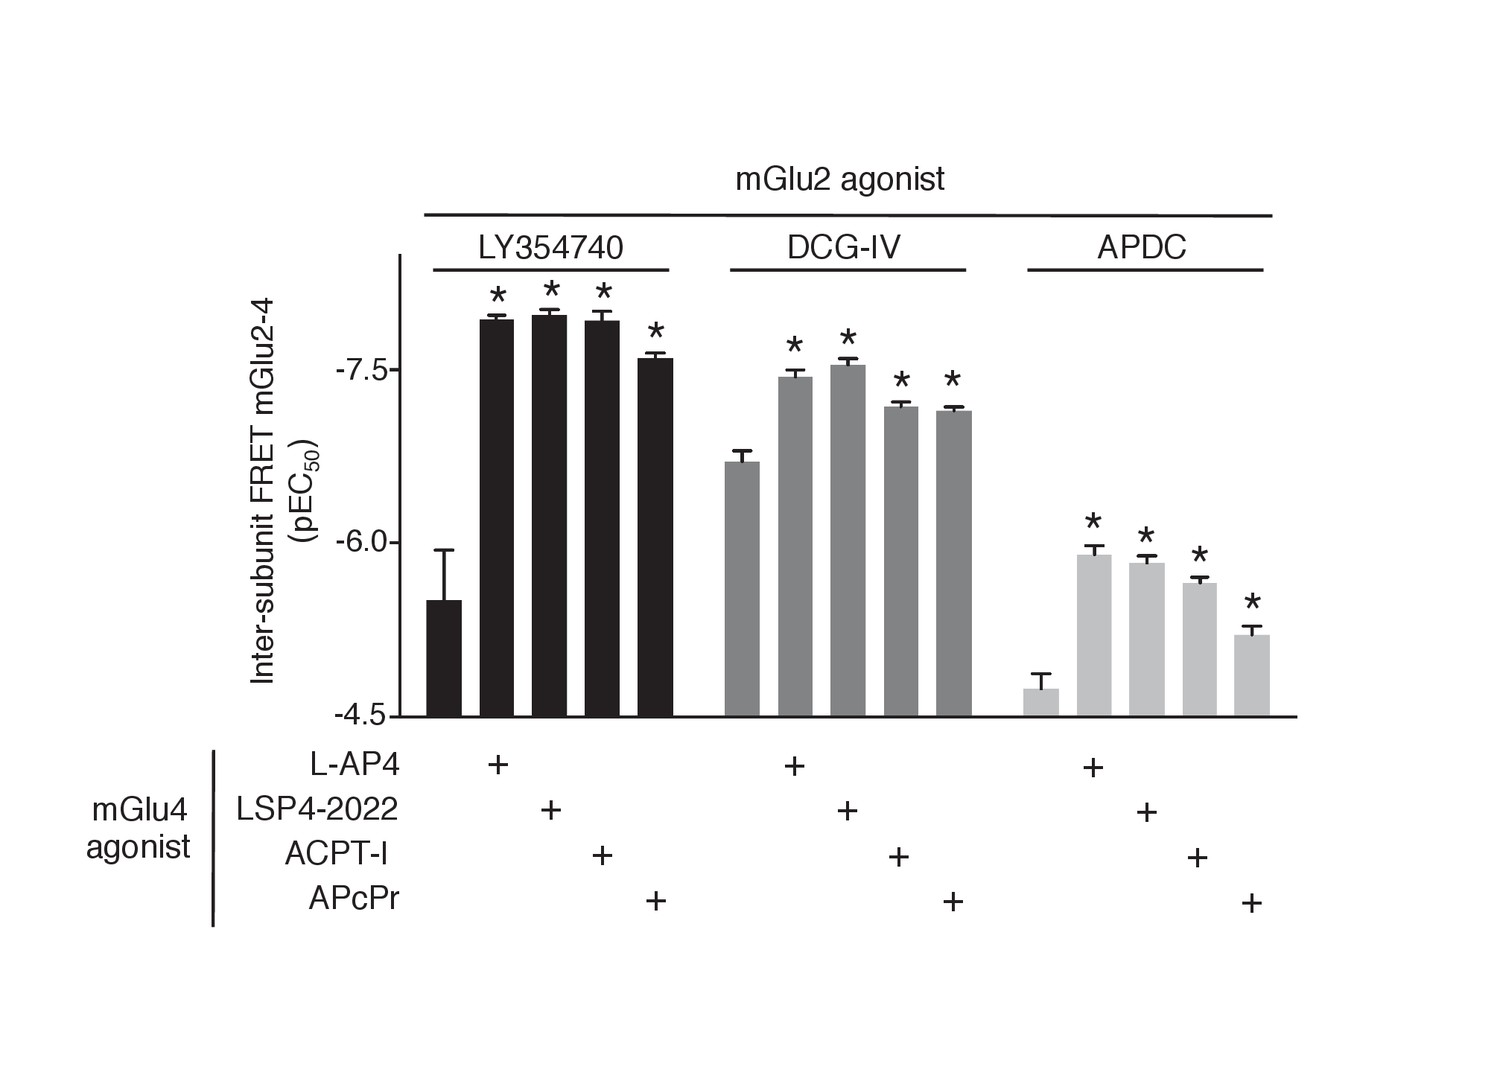
Increase in mGlu2 ligands potency in presence of mGlu4 agonist.
Representation of EC50 values obtained from dose response curves of mGlu2 agonist using mGlu2-4 TR-FRET sensor. Results are mean ± SEM of three independent experiments. *p<0.05 in one-way Anova plus Bonferroni post-hoc test.
Figure 3—figure supplement 2
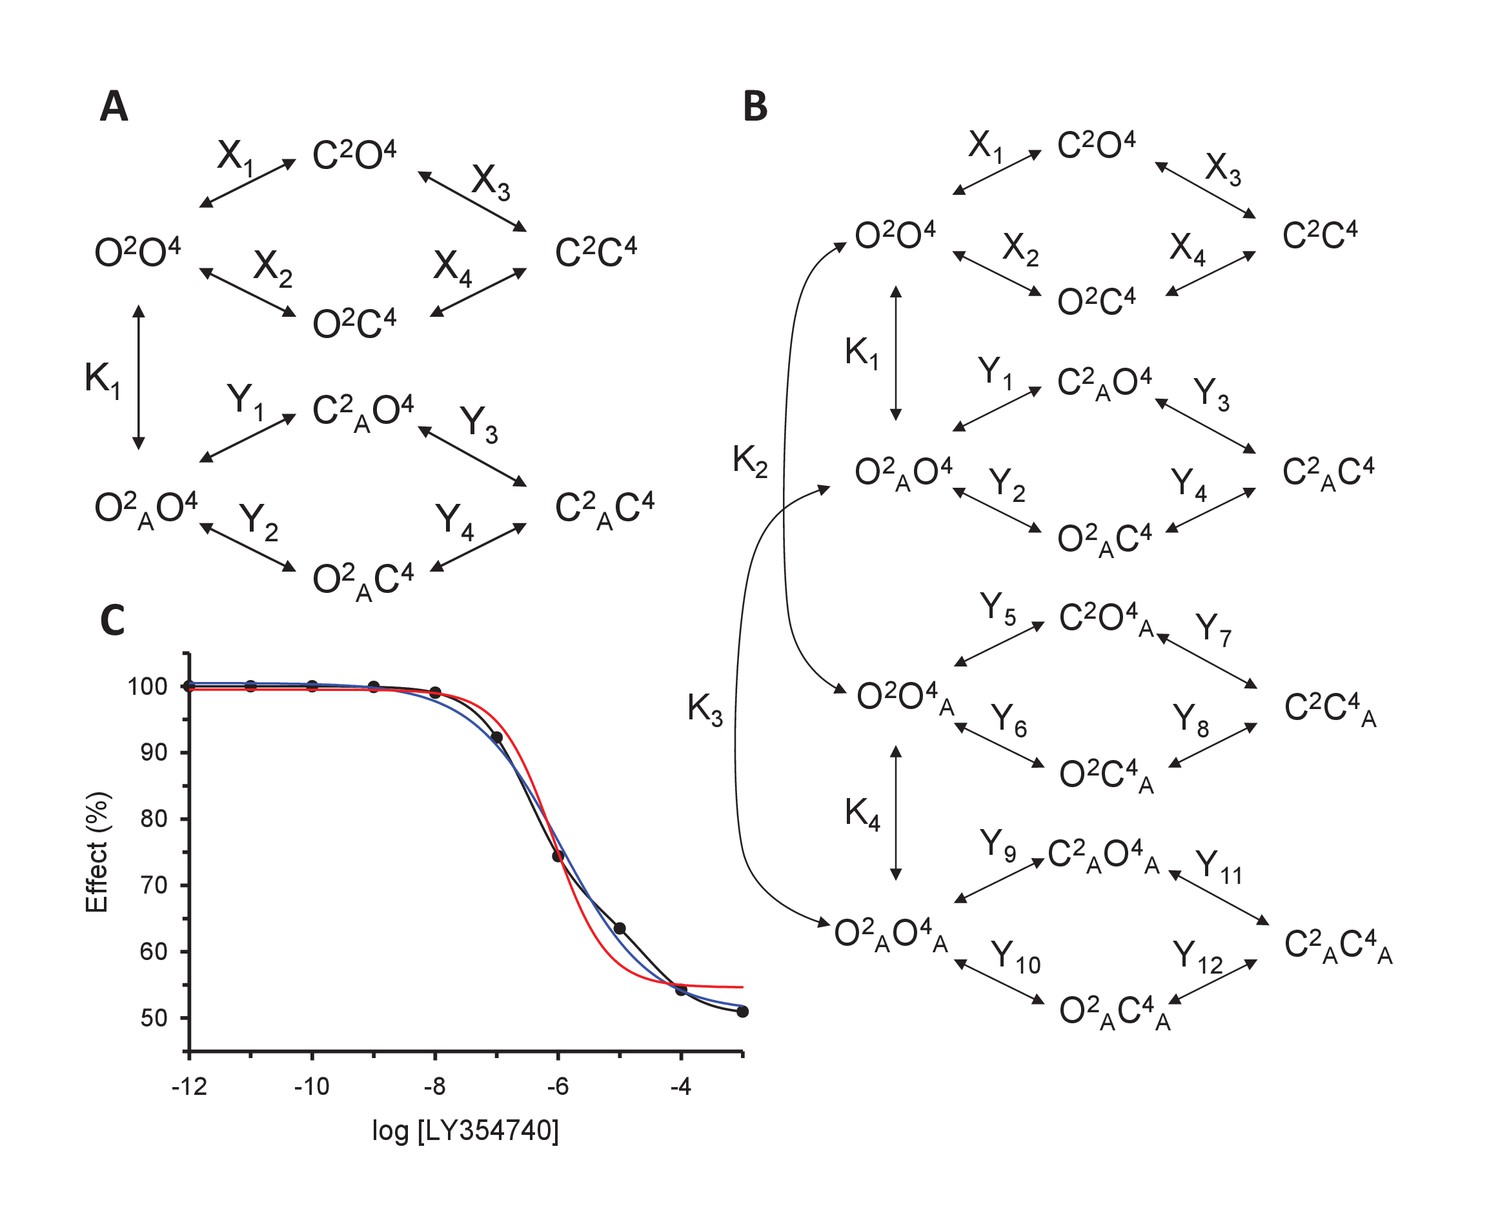
Models for the action of agonists at the mGlu2-4 VFT domains.
(A) Model 1. A heterodimeric mGlu2-4 model in which an mGlu2 agonist binds the mGlu2 protomer exclusively. The binding of an mGlu4 ligand to mGlu4 alters the constants of the model. (B) Model 2. A heterodimeric mGlu2-4 model in which an mGlu2 agonist binds both the mGlu2 and the mGlu4 protomers. The additional binding of an mGlu4 ligand alters the constants of the model. (C) Theoretical solid black circles and black curve result from Model 2 in which the mGlu2 agonist LY354740 binds both protomers within the mGlu2-4 heterodimer. Blue curve results from fitting to data points by using the Hill equation with a variable nH parameter. Red curve results from fitting to data point by using the Hill equation with the nH parameter fixed to 1. The parameters of the model and fittings are given below. The theoretical black curve is biphasic, while the Hill equation-fitted blue and red curves are mandatory single-phase curves. Parameter values used in Model 2 (Panel b; Appendix 1): f = 0.5; X1 = X2 = X3=10−6; Y1 = 2; Y2 = 10−6; Y3 = 10−6; Y5 = Y6 = Y7=10−6; Y9 = 102; Y10 = 10−6; Y11 = 10−6; K1 = 10−6; K2 = 103; K3 = 10−3. Hill equation parameters from curve fitting to black solid circles. Hill equation parameters with variable nH parameter (blue curve): Bottom = 50.99; Top = 100.5; X50 = −5.95; nH = 0.60. Hill equation parameters with nH parameter fixed to 1 (red curve): Bottom = 54.62; Top = 99.50; X50 = −6.08. The fitting using the variable nH parameter is significantly better than that using the fixed nH = 1 parameter (F-test goodness of fitting). Because Model 1 can only provide curves with nH = 1 this means that a simulated situation as that supposed here cannot be explained by the ligand binding to only one protomer of the mGlu2-4 hetrodimer.
Figure 4
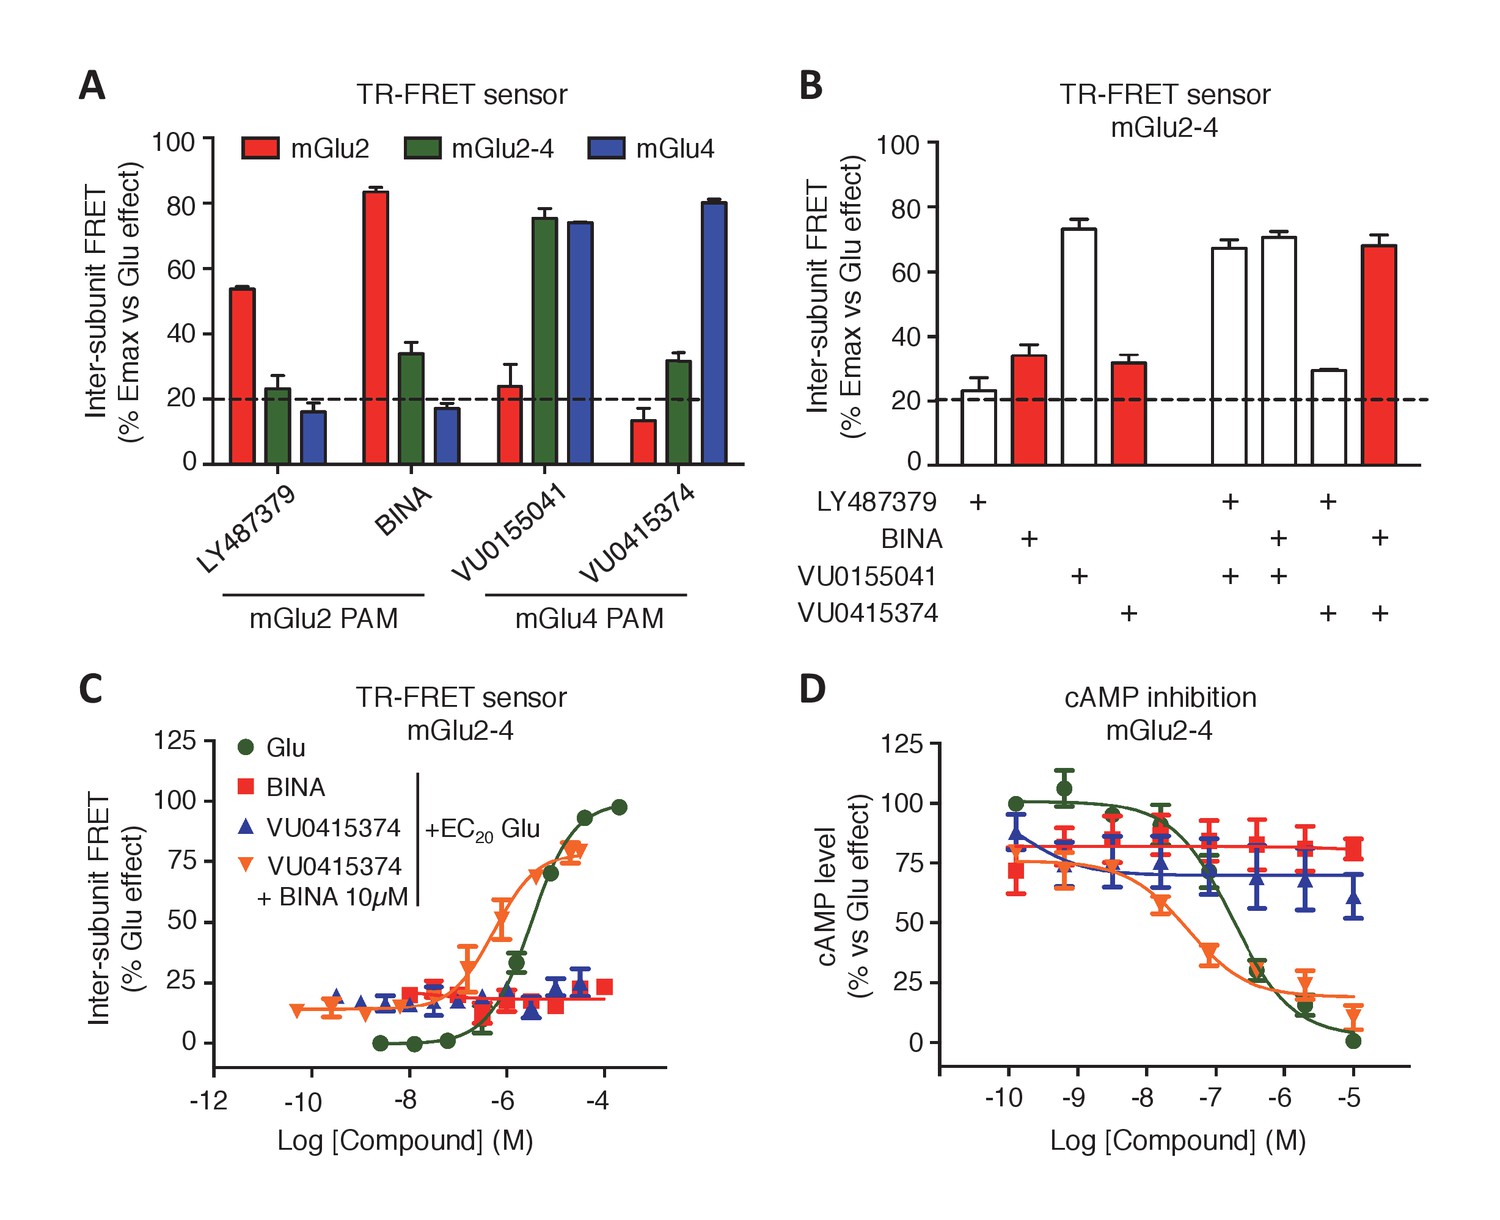
Synergistic action of mGlu2 and mGlu4 PAMs in mGlu2-4 heterodimer.
(A) Effect of mGlu2 (LY487379 10 µM, BINA 10 µM) and mGlu4 (VU0155041 10 µM, VU0415374 10 µM) PAMs on mGlu2 (red), mGlu4 (blue) and mGlu2-4 (green) TR-FRET sensors in the presence of an EC20 of glutamate. (B) Effect of mGlu2 and/or mGlu4 PAMs on the response mediated by an EC20 concentration of glutamate in mGlu2-4 heterodimer by TR-FRET. The strong synergy between BINA and VU0415374 is highlighted with red bars. (C–D) Dose response of BINA and/or VU0415374 in potentiating the effect of EC20 glutamate on TR-FRET sensors (C) and cAMP inhibition (D). Results are mean ± SEM of three independent experiments performed in triplicates.
Figure 5

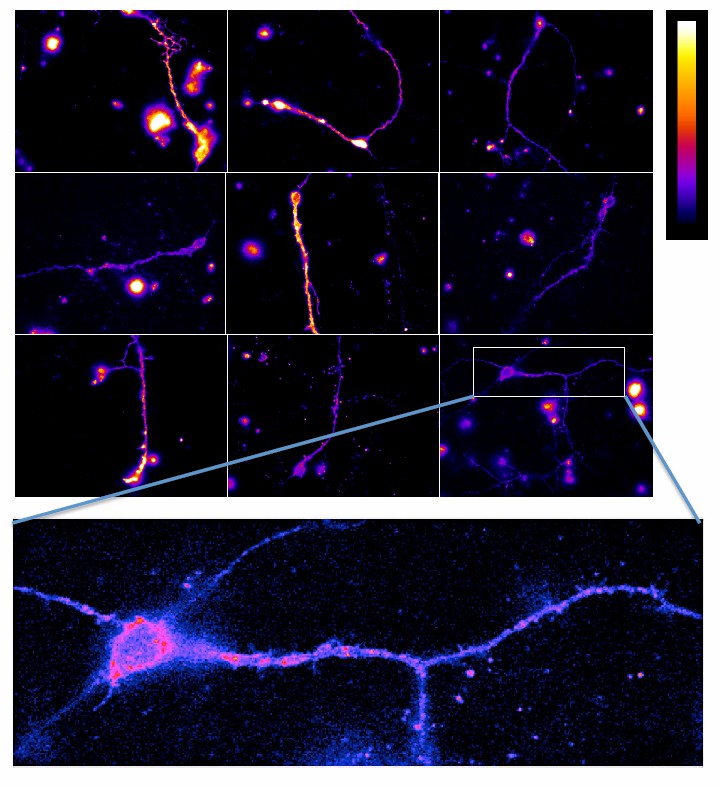
TR-FRET detection of mGlu2-4 heterodimers in transfected hippocampal neurons.
Neurons transfected with CLIP-mGlu2 and SNAP-mGlu4 are compared with either CLIP-mGlu2 and SNAP-mGlu1 (negative control) or SNAP-mGlu2 (positive control). The receptors are labeled with Lumi4-Tb as donor and Red as acceptor. (A) Image examples of neurons expressing the three receptor combinations at comparable expression levels showing similar TR-FRET and NFRET (TR-FRET normalized to the expression of donor and acceptor) signals for the mGlu2-4 heterodimer and the mGlu2 homodimer and a low signal for the mGlu1-2 heterodimer. TR-FRET images are corrected for bleedthrough and thresholded to remove background and noise. Images are 138 µm wide. (B) Quantification of NFRET as a function of the expression level of donor and acceptor. Each point is the quantification of one neuron. (C) Scatter plot of NFRET.
Figure 6 with 2 supplements
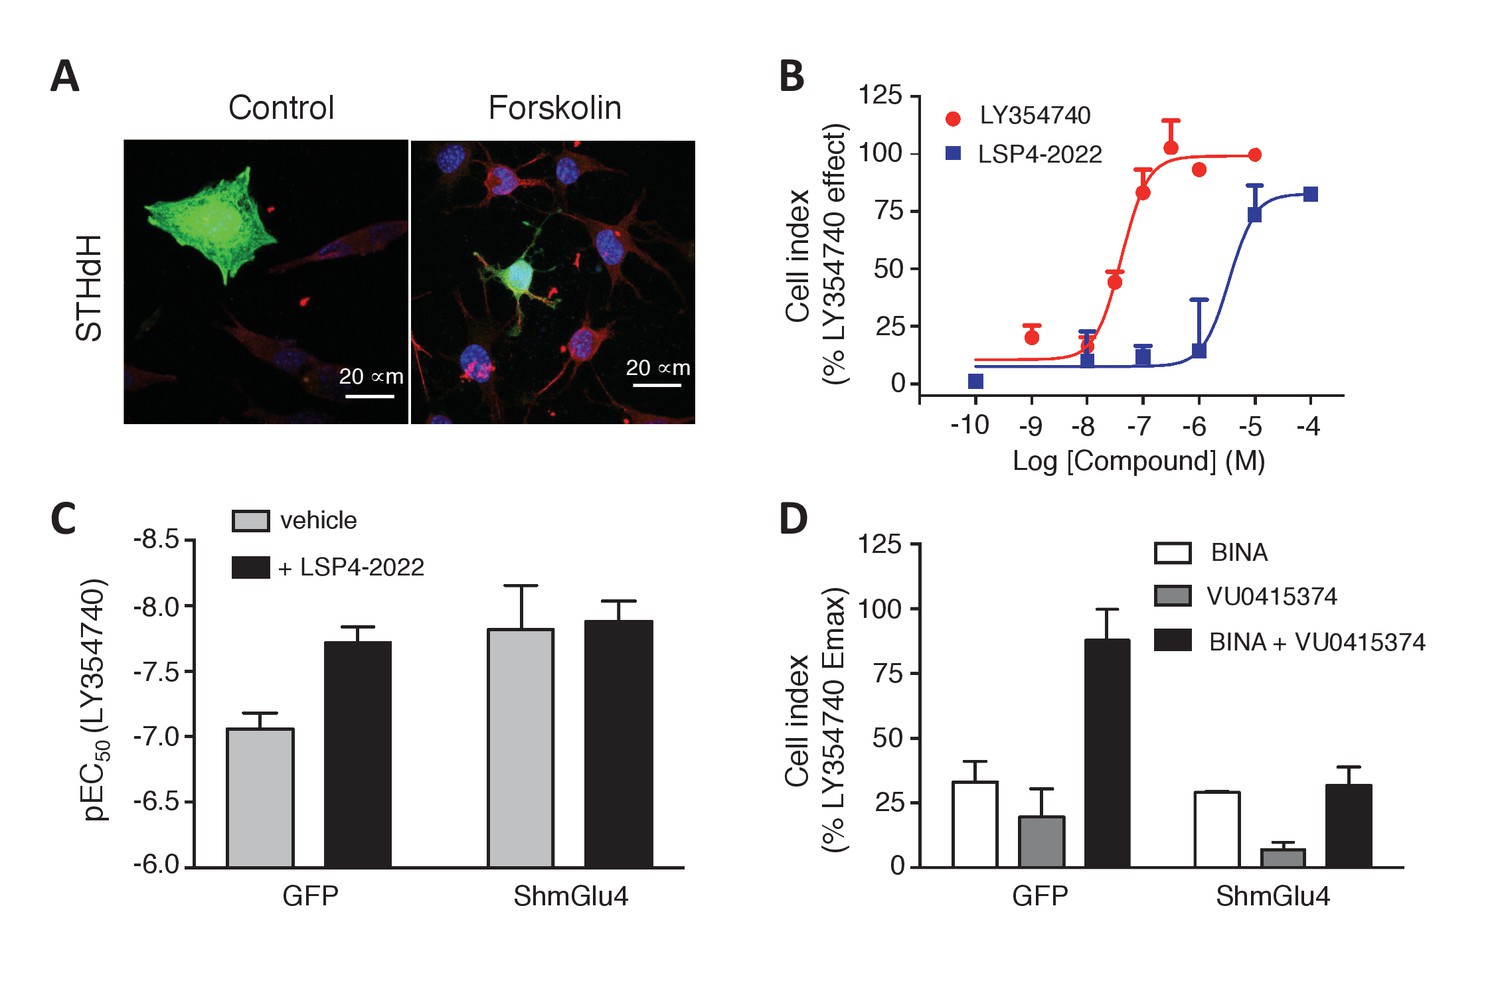
Functional evidence for mGlu2-4 heterodimers in a neuronal cell line, STHdh.
(A) Representative image of neuronal cells treated or untreated with forskolin. Cells were transfected with GFP (green) and stained with MAP2 (red) and DAPI (blue). (B) Dose response on LY354740 or LSP4-2022 represented in % variation of cell index versus LY354740. (C) pEC50 values of LY354740 as determined using the change in cell index, in control cells transfected with GFP, and in cells transfected with the SH RNA against mGlu4, under control condition (gray bars) or in the presence of the mGlu4 agonists LSP4-2022 (10 µM). (D) Maximum effect of mGlu2 (BINA 1 µM) and/or mGlu4 PAM (VU0415374 1 µM) in potentiating the effect of low concentration of LY354740 (10 nM) and LSP4-2022 (100 nM) in control STHdh cells infected with GFP vector or silencing shRNA for mGlu4. Data in B–D are means ± SEM of three independent experiments performed in triplicates.
Figure 6—figure supplement 1
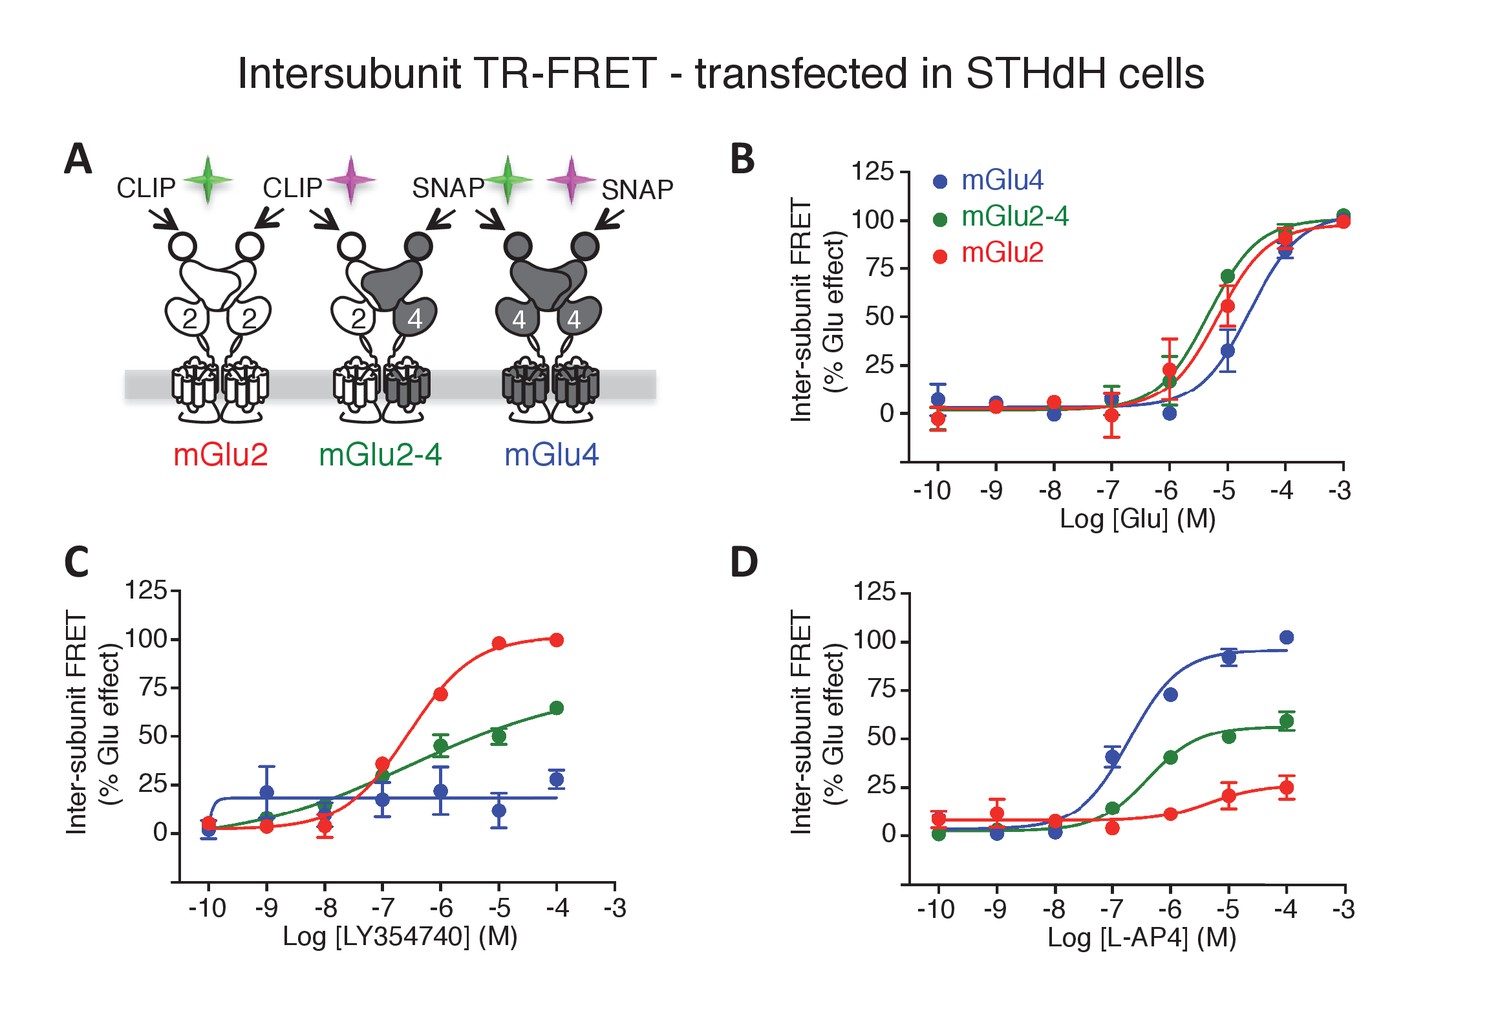
mGlu2-4 heterodimer TR-FRET sensor transfected in SThdH striatal cell line.
(A) Schematic representation of TR-FRET mGlu sensors. (B–D) Pharmacological profile of the three indicated populations of receptor dimers observed in SThdH environment was similar to previous in HEK293 cells. Results are means ± SEM of three independent experiments.
Figure 6—figure supplement 2
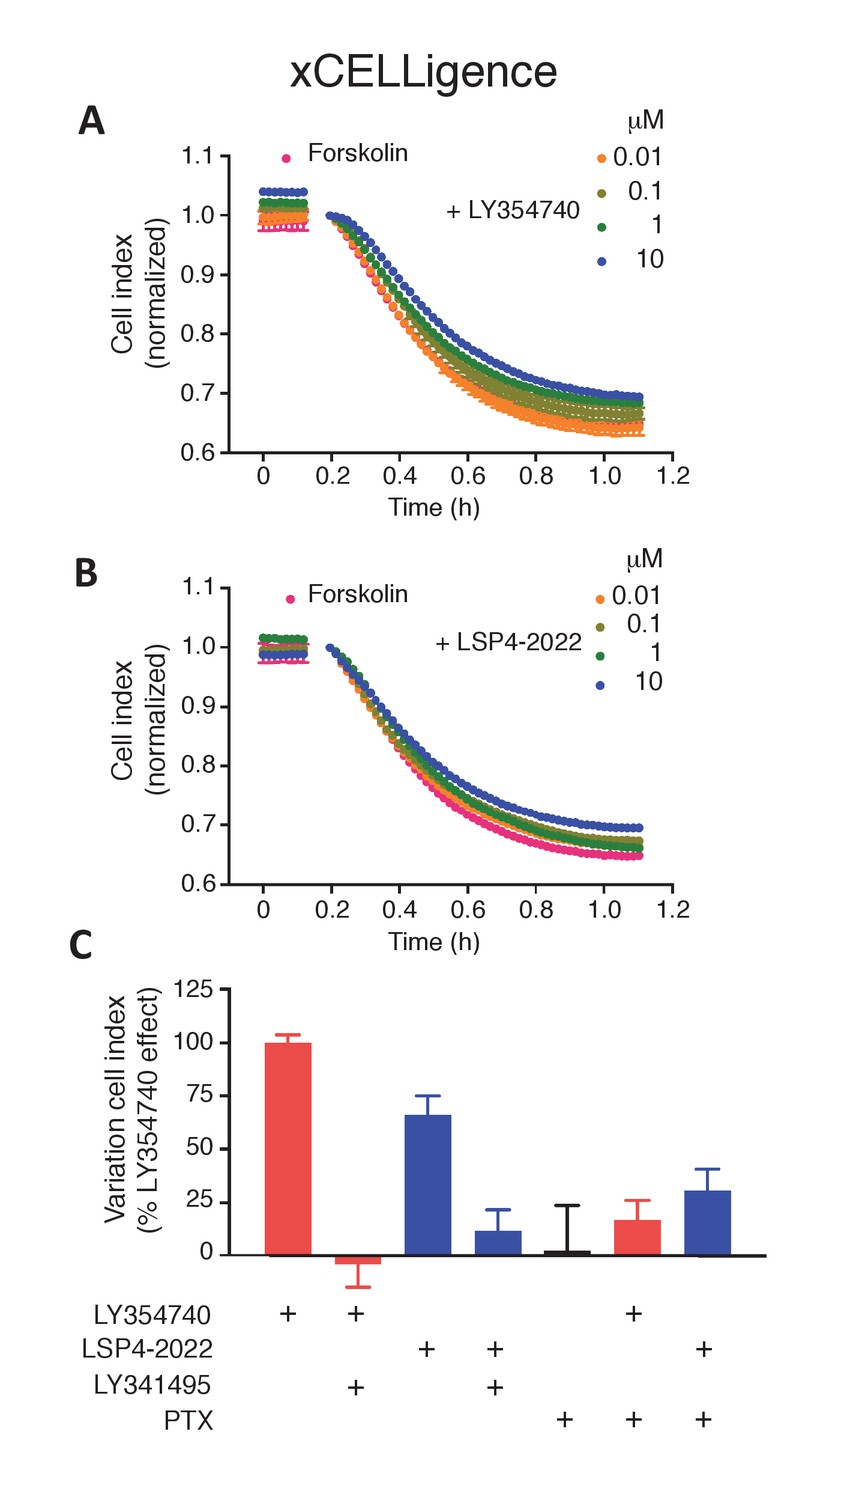
mGlu2 and mGlu4 ligands impair forskolin shrinking of SThdH striatal cell line.
(A–B) Representative experiment showing mGlu2 (A) and mGlu4 (B) ligands impairing forskolin effect in xCELLigence. (C) mGlu2 and mGlu4 ligands effect is impaired by mGluR antagonist LY341495 and pertussis toxin (PTX). Results are means ± SEM performed in two independent experiments.
Figure 7 with 1 supplement
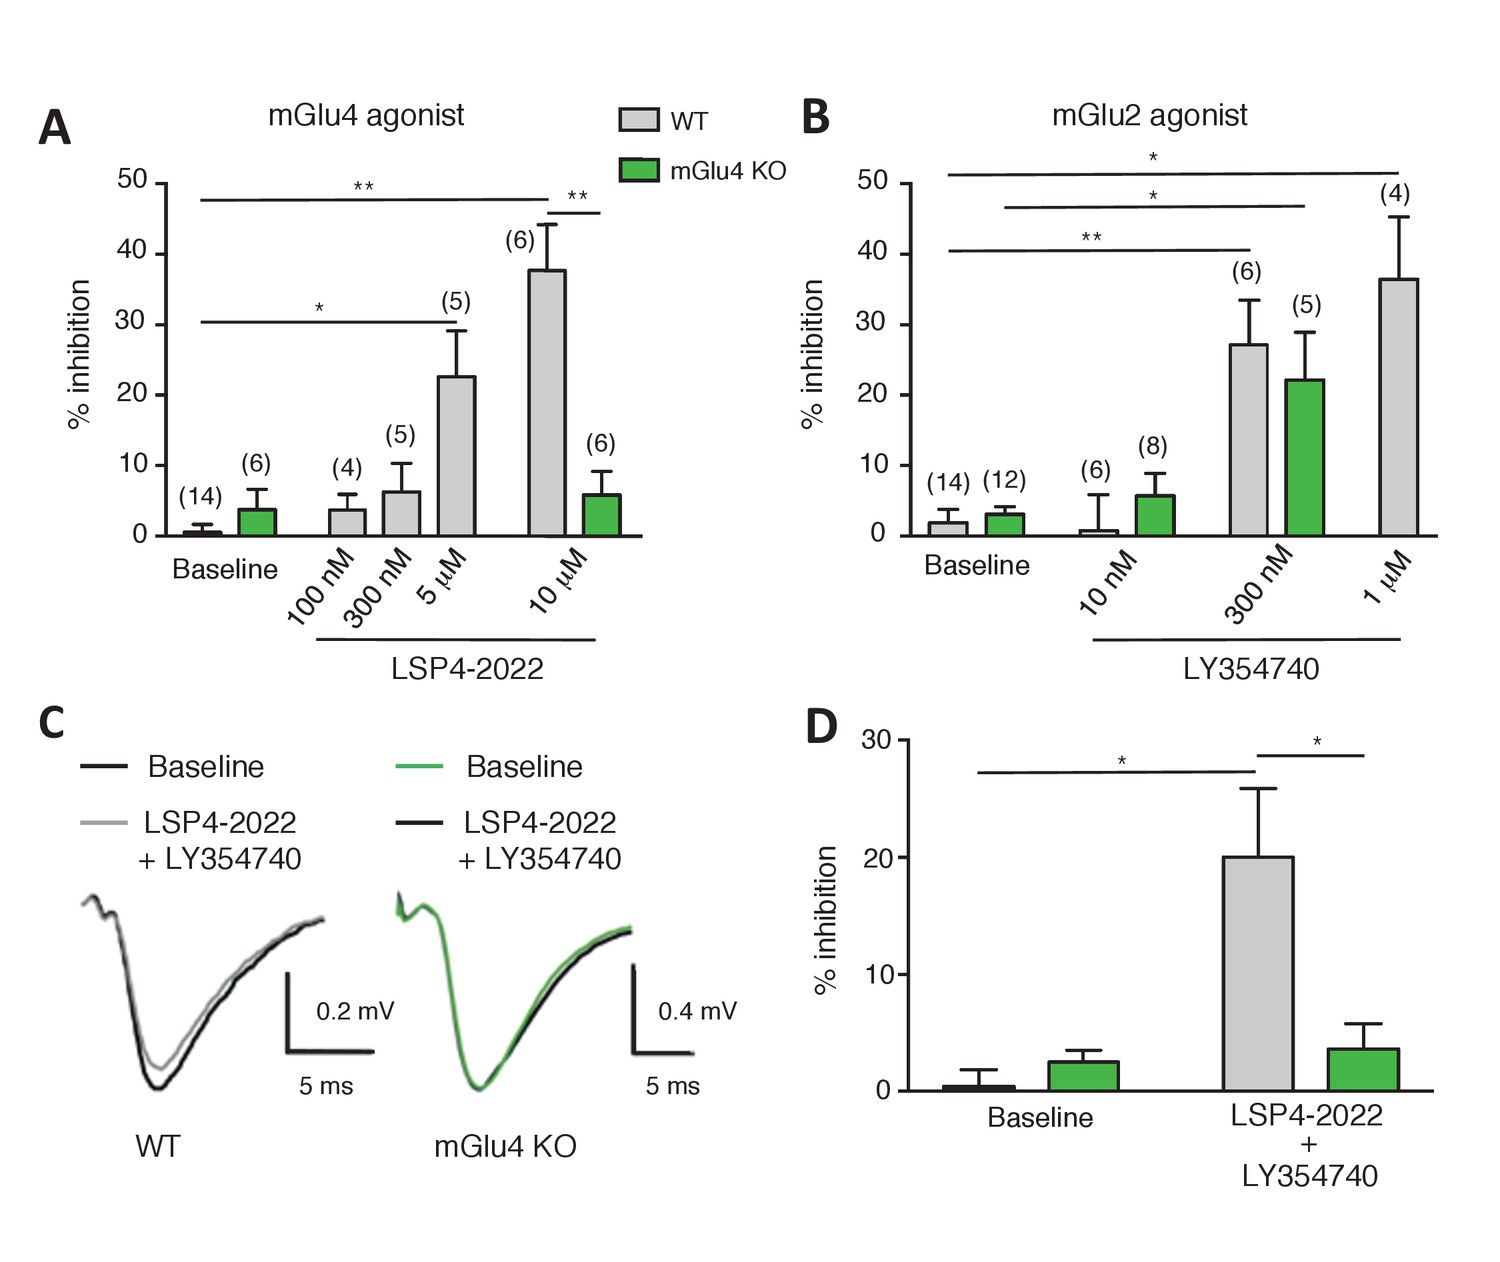
Effect of LY354740 and LSP4-2022 in the LPP of wild-type (WT) mice.
(A) Bar graph illustrating the % inhibition of fEPSPs induced by low (100 nM and 300 nM) and high (5 µM and 10 µM) concentrations of LSP4-2022 in the LPP. Only high concentrations of LSP4-2022 induced a significant decrease of fEPSP amplitude. Green bars indicate data obtained using slices from mGlu4 KO mice. (B) Inhibitory effect of LY354740 on fEPSP amplitude in the LPP. Note that 300 nM or 1 µM LY354740 caused a significant decrease of fEPSP amplitude. Green bars indicate data obtained using slices from mGlu4 KO mice. (C) Representative averaged traces of evoked synaptic activity induced by LPP stimulation in field recording of granular cells from WT mice (Left). Bar graph illustrating the % inhibition of fEPSP amplitude by LY354740 (10 nM), LSP4-2022 (100 nM) and LY354740 (10 nM) / LSP4-2022 (100 nM) in the LPP (Right). Note that application of LY354740 (10 nM) + LSP4-2022 (100 nM) significantly decreased the fEPSP amplitude. Data in A-C are means ± SEM of (n) independent experiments from at least three different animals. *p<0.05, **p<0.001.
Figure 7—figure supplement 1
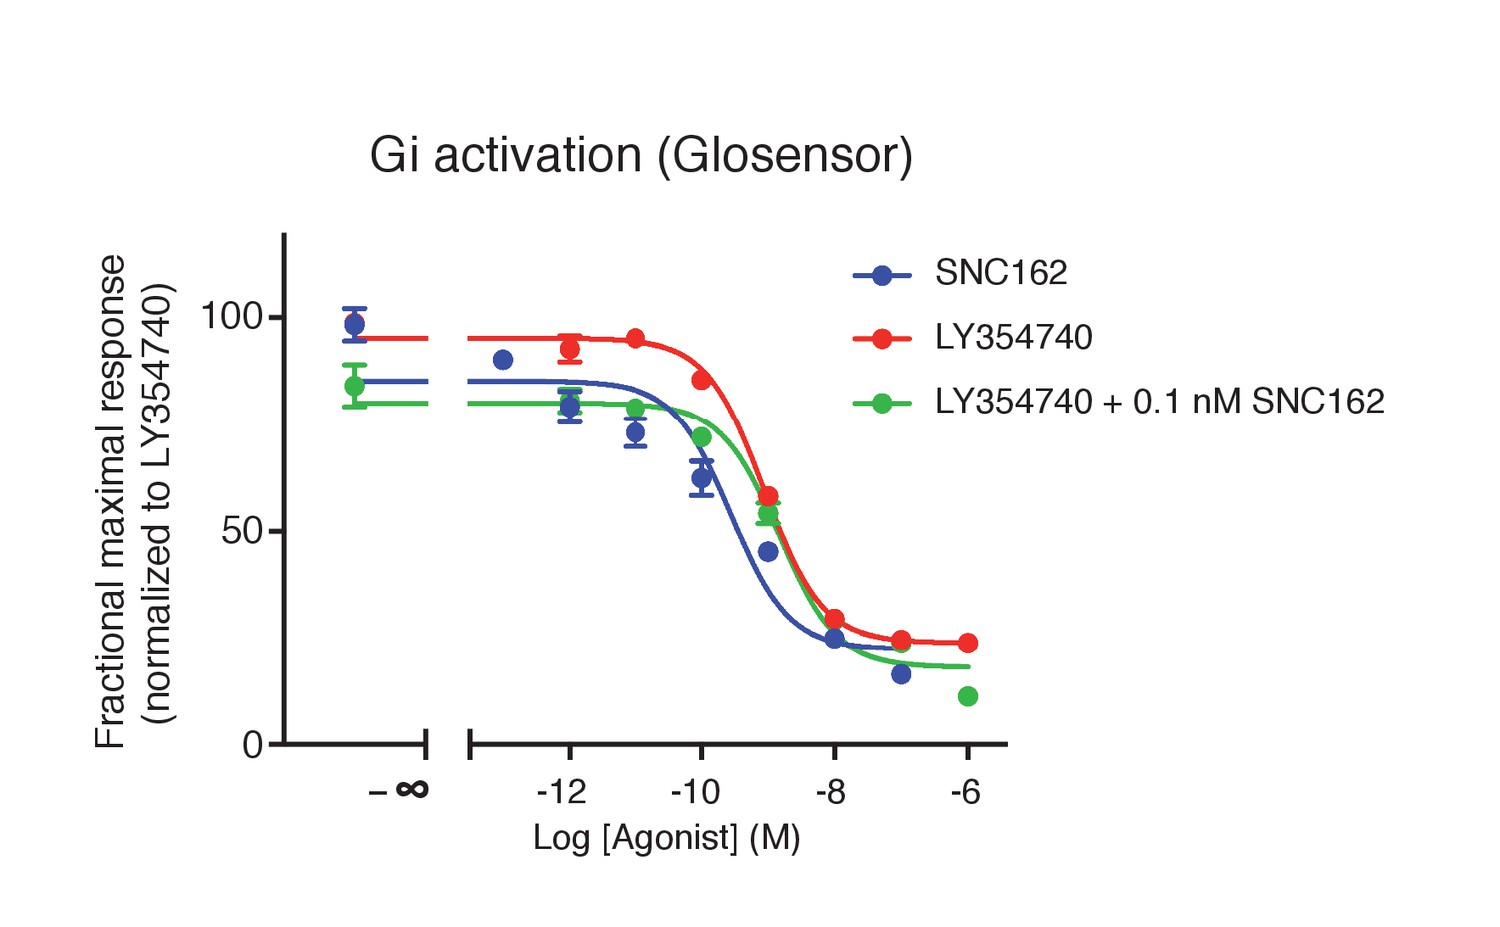
Absence of synergistic effect between mGlu2 and the Gi-coupled delta opioid receptor.
Activation of delta-opioid receptor with SNC162 had no effect on the potency of LY354740 in inhibiting cAMP formation via mGlu2 receptors. Means pEC50 ± SEM are 9.74 ± 0.31, 9.07 ± 0.01 and 8.93 ± 0.11, for SNC162 alone, LY354740 alone or in presence of SNC162 0.1 nM, respectively. pEC50 values C162 are not significantly different. Data are means ± sem of four independent experiments performed in triplicates.
Appendix 1—figure 1
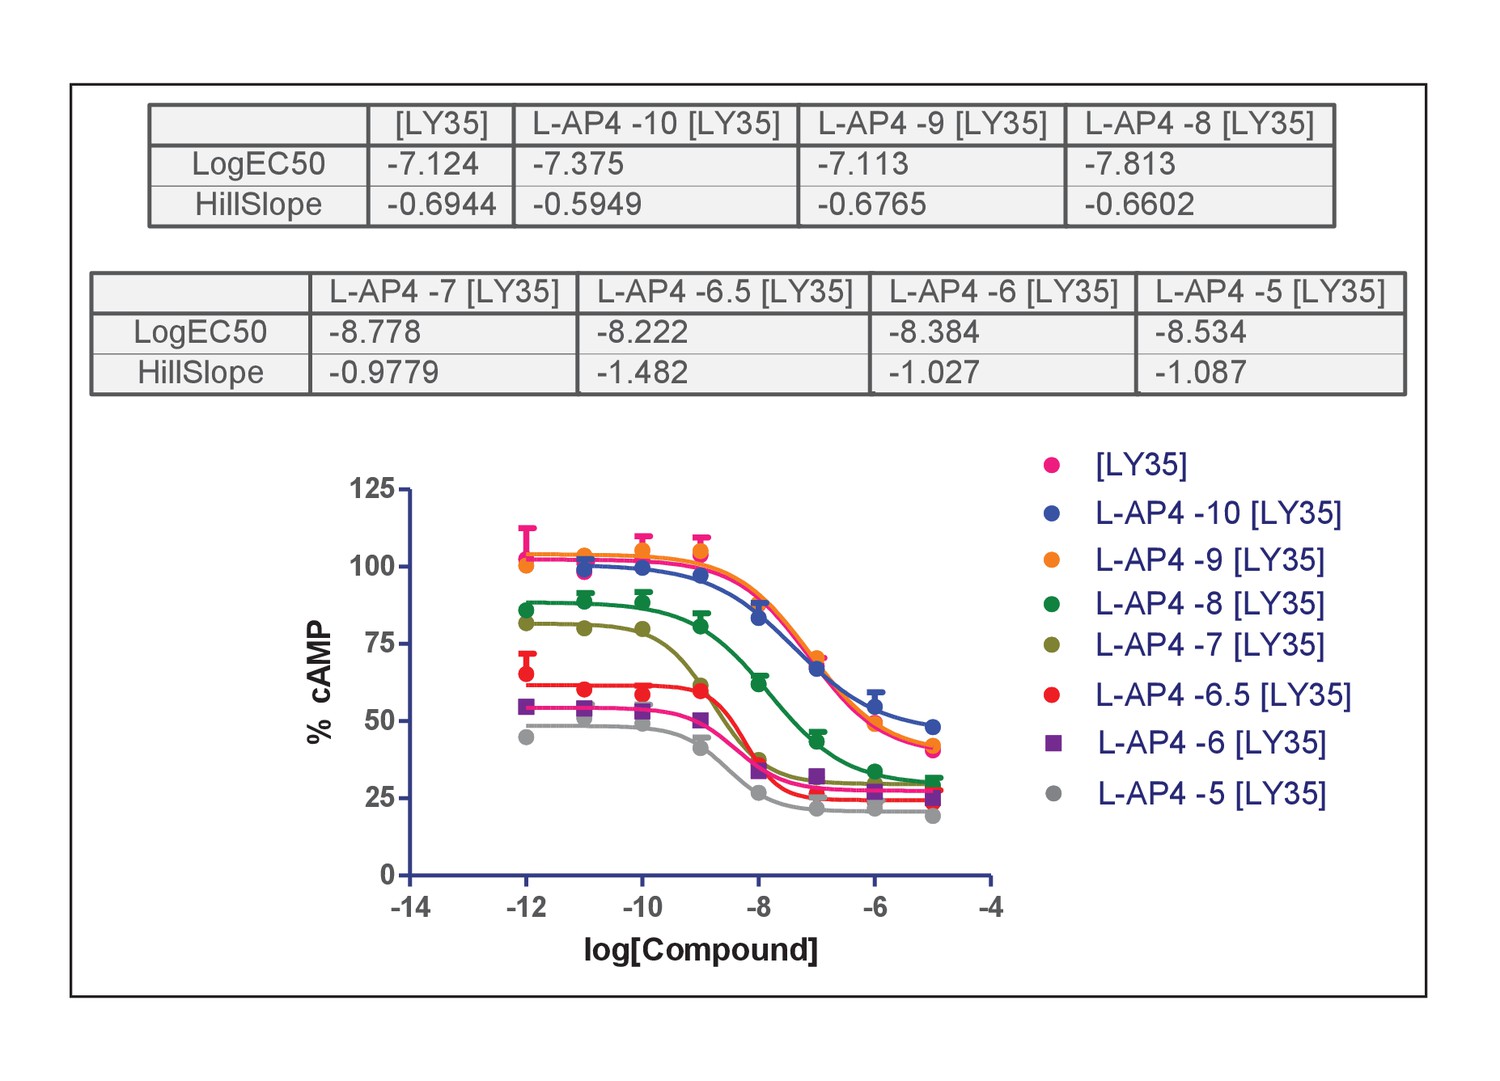
Concentration-effect curves of LY35 in the presence of L-AP4.
https://doi.org/10.7554/eLife.25233.020
Appendix 1—figure 2
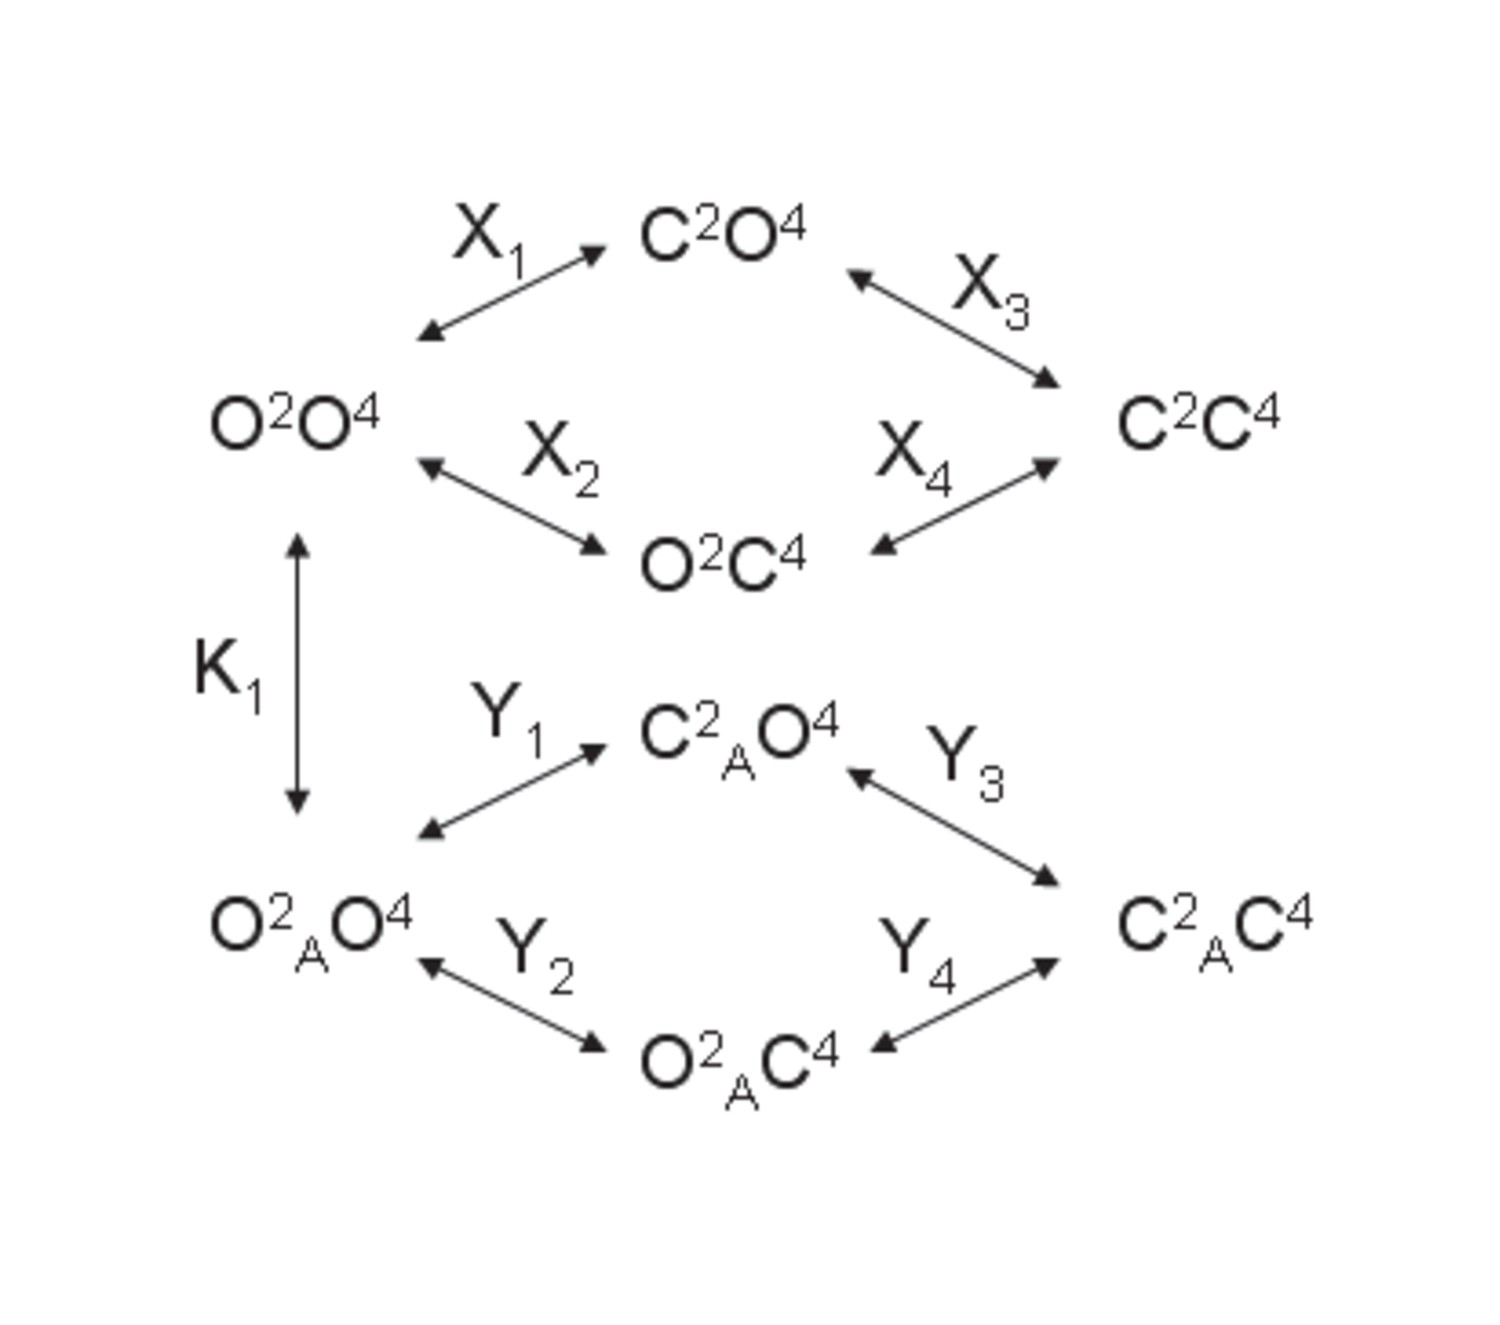
Model 1.
A heterodimeric mGlu2/4 model in which an mGlu2 agonist binds exclusively the mGlu2 protomer. The binding of an mGlu4 ligand to mGlu4 alters the constants of the model.
Appendix 1—figure 3
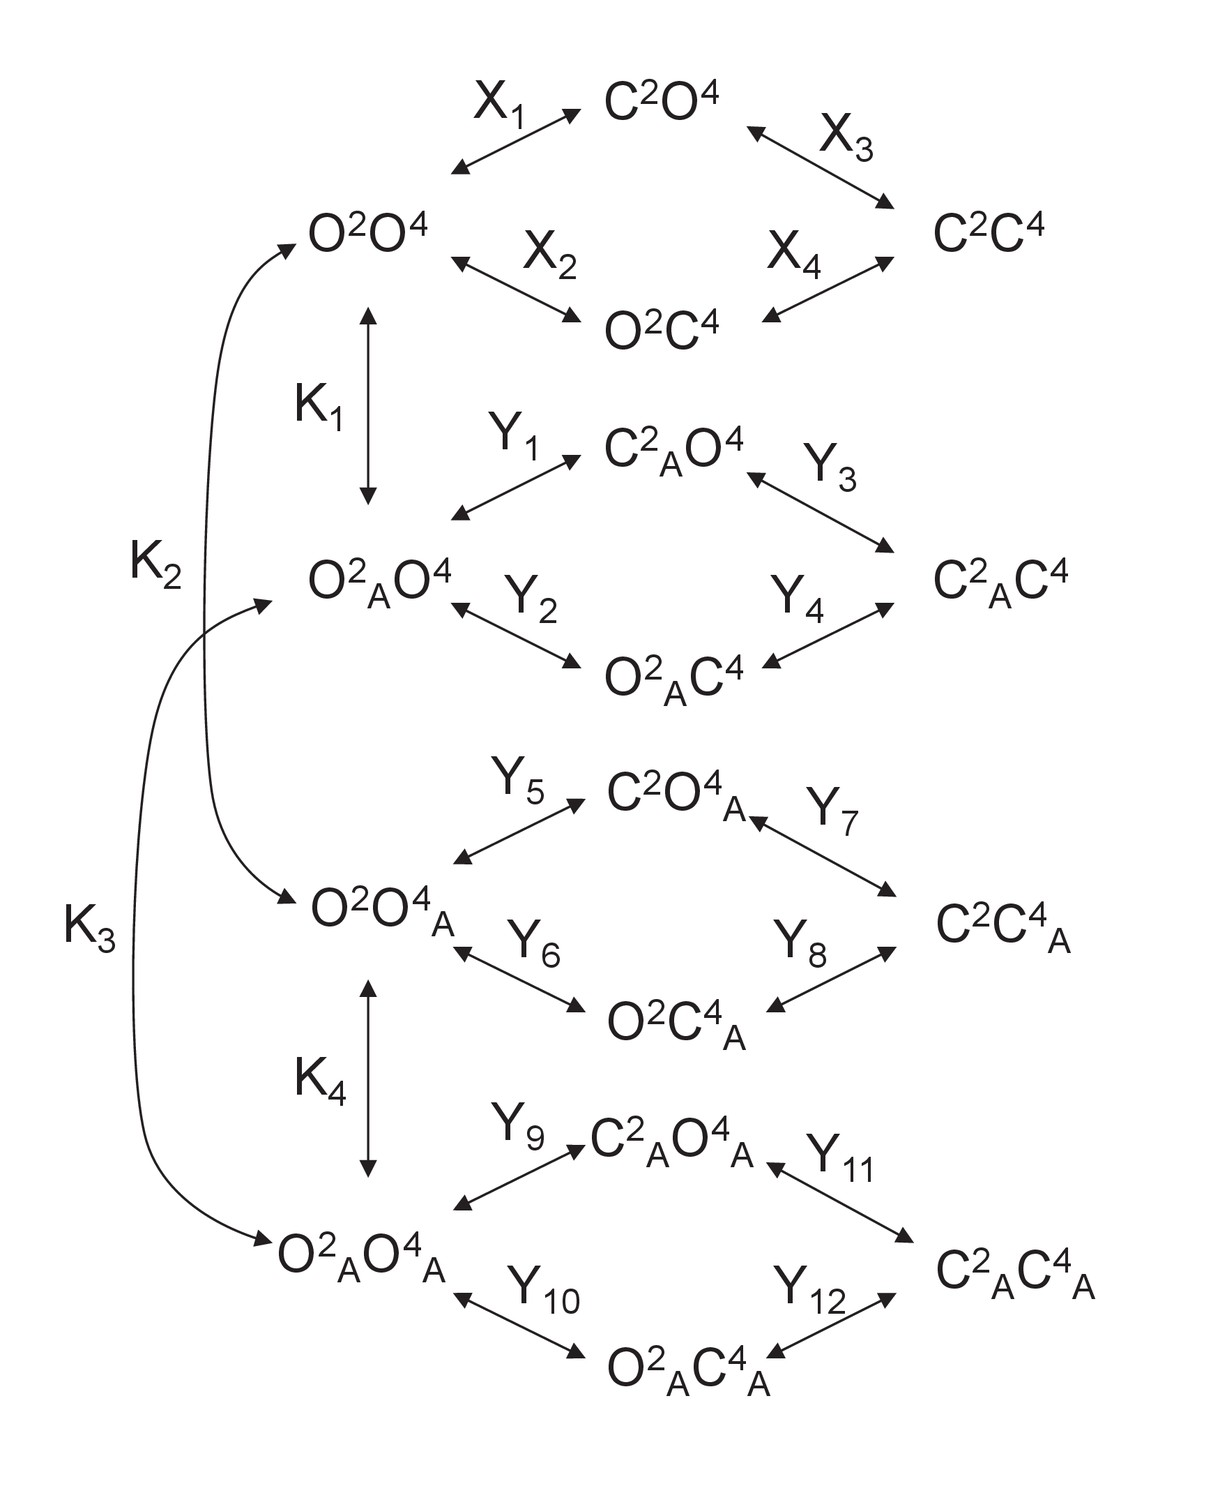
Model 2.
A heterodimeric mGlu2/4 model in which an mGlu2 agonist binds both the mGlu2 and the mGlu4 protomers. The additional binding of an mGlu4 ligand alters the constants of the model.
Appendix 1—figure 4
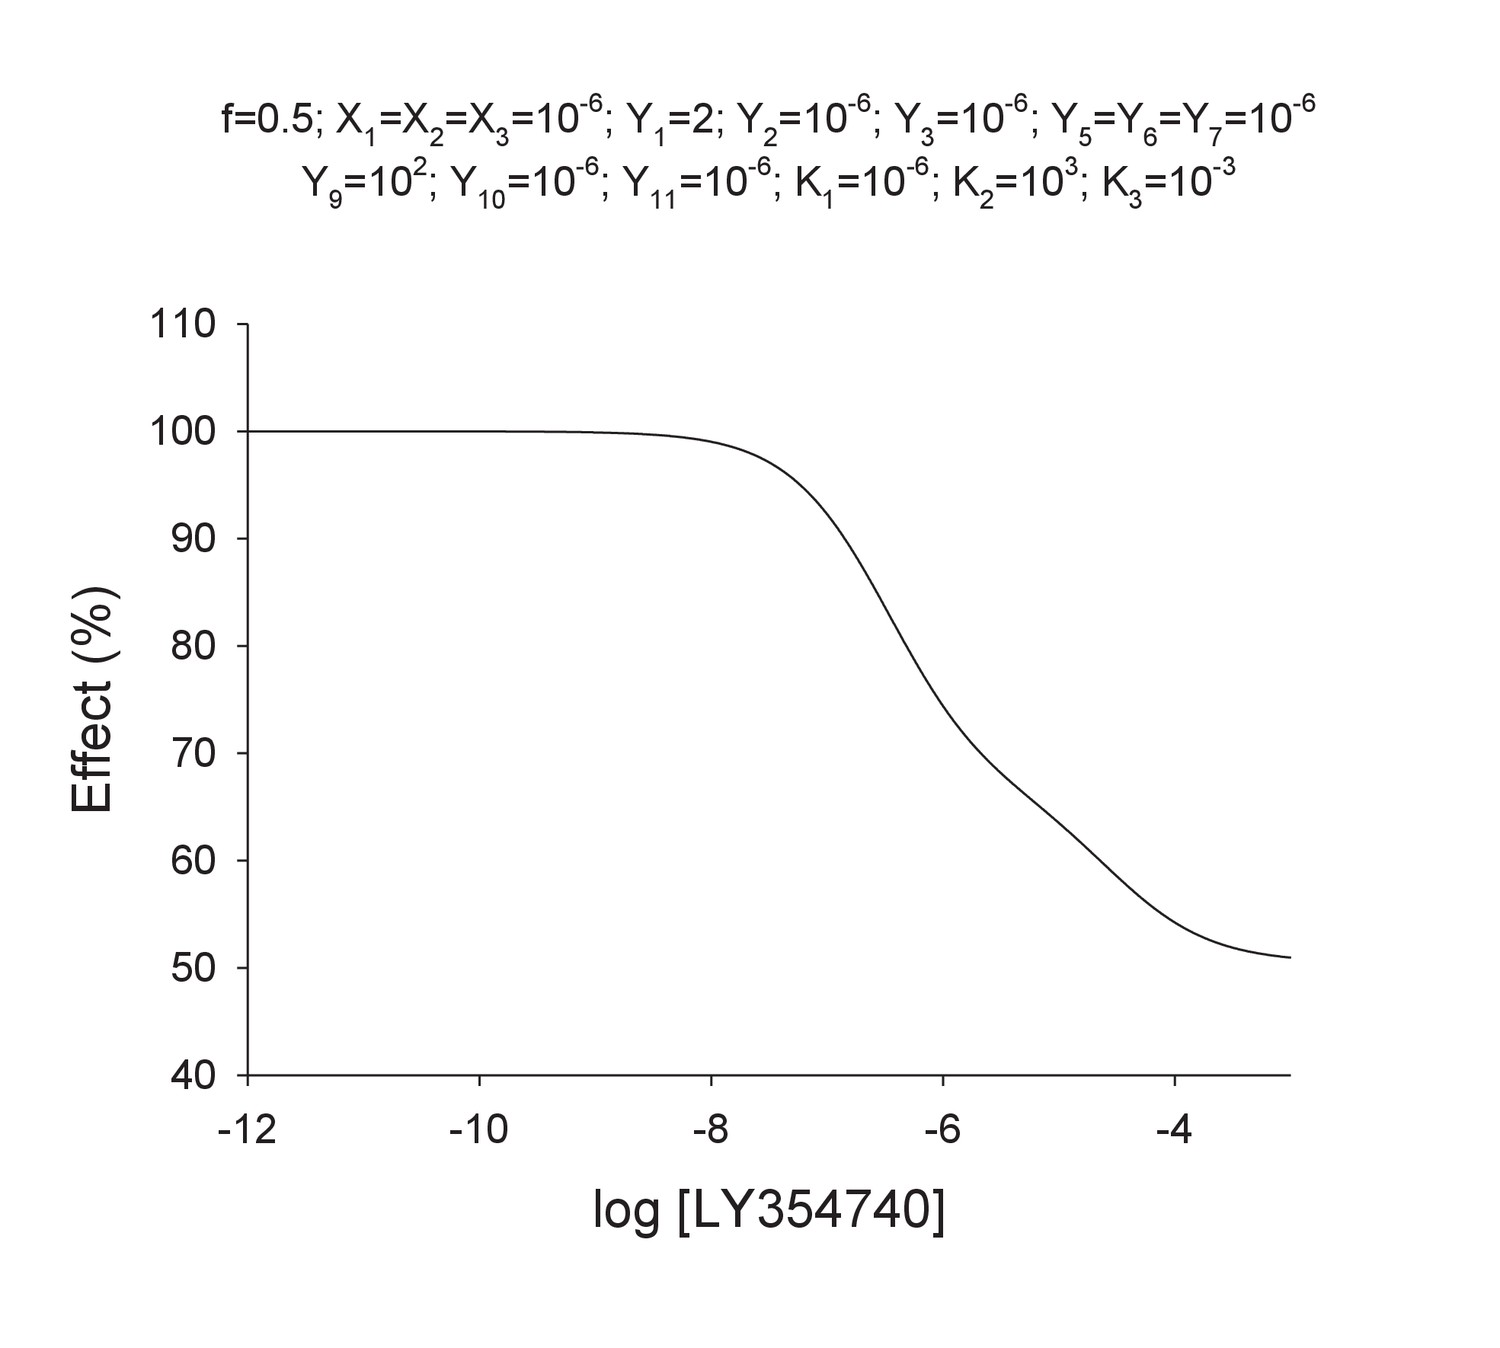
Theoretical concentration-effect curve for particular values of the mechanistic constants included in Model 2.
The theoretical concentration-effect data are the following.
Appendix 1—figure 5
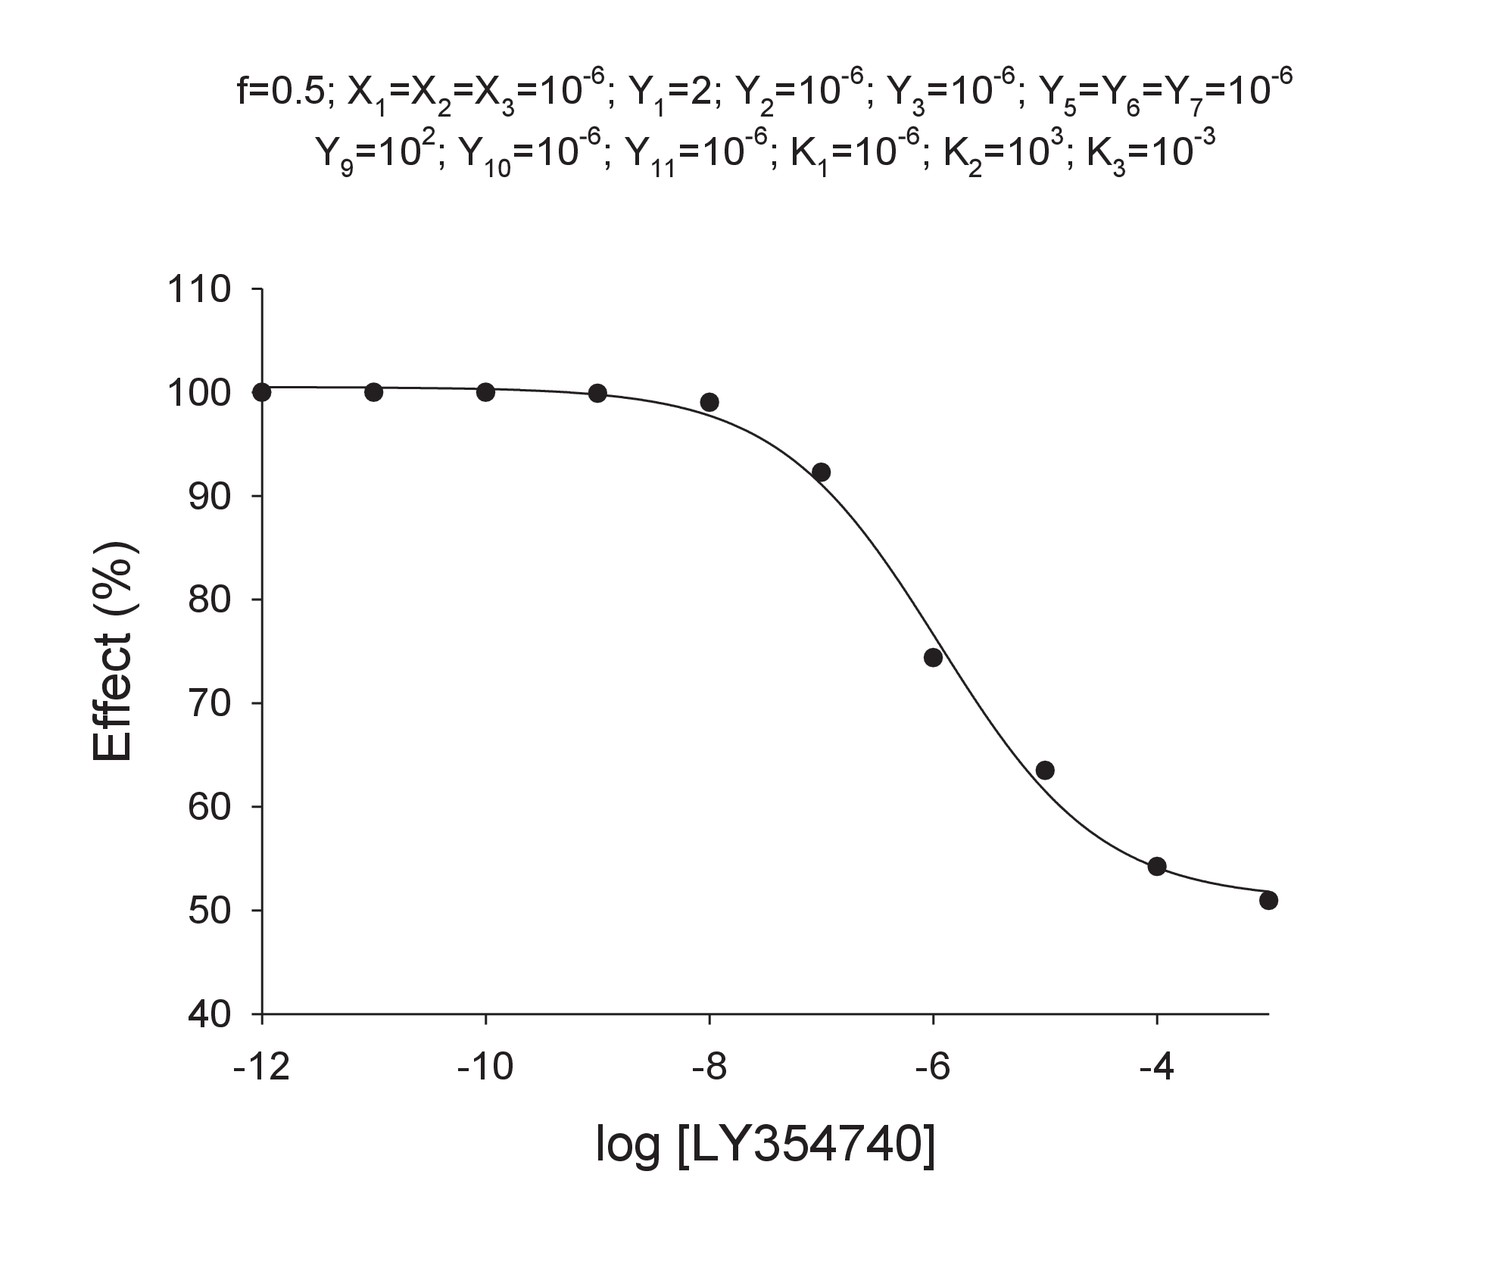
Curve data included in Appendix 1—table 4 (solid points) and the theoretical curve by using the Hill equation parameters of Appendix 1—table 5 (curve line).
https://doi.org/10.7554/eLife.25233.027
Author response image 1
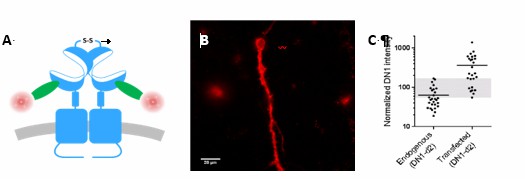
Overlap between expression levels of mGlu2 in native and transfected neurons.
Expression of mGlu2 receptor in native and transfected primary hippocampal neurons was measured by immunofluorescence using a d2-labeled single domain antibody (DN1-d2) specific for the mGlu2 receptor. (A) Schematic drawing of DN1-d2 labeling of the mGlu2 receptor. (B) Example of DN1-d2 labeled native neuron with endogenous expression of mGlu2 receptor. (C) Mean intensity of DN1-d2 labeling of neurons with endogenous mGlu2 receptor expression (28 cells) or transfected with mGlu2 receptor (26 cells). The endogenous mGlu2 expression overlaps with the expression in transfected neurons in the 55-170 subunits/Veff range (shaded area).
Author response image 2
Tables
Table 1
Potencies (pEC50) of the indicated compound on mGlu2, mGlu2-4 and mGlu4 as determined using the TR-FRET-based conformational assay depicted in Figure 1, or the cAMP assay as depicted in Figure 2.
Data are means ± SEM of at least three experiments performed in triplicates.
| Receptor | ||||||
|---|---|---|---|---|---|---|
| mGlu2 | mGlu2-4 | mGlu4 | ||||
| Compound | pEC50 | Emax (%) | pEC50 | Emax (%) | pEC50 | Emax (%) |
| TR-FRET conformational sensor assay | ||||||
| Glutamate | 5.5 ± 0.04 | 100 ± 1 | 5.5 ± 0.04 | 100 ± 2 | 5.0 ± 0.05 | 100 ± 2 |
| LY354740 | 7.5 ± 0.04 | 99 ± 1 | 5.9 ± 0.4 | 59 ± 9 | – | 3 ± 1 |
| APDC | 5.4 ± 0.07 | 97 ± 3 | 4.8 ± 0.1 | 56 ± 3 | – | 10 ± 2 |
| DCGIV | 6.6 ± 0.06 | 79 ± 1 | 6.8 ± 0.2 | 27 ± 2 | 4.7 ± 0.2 | 16 ± 2 |
| L-AP4 | – | 14 ± 1 | 6.7 ± 0.1 | 48 ± 2 | 6.2 ± 0.1 | 95 ± 1 |
| LSP4-2022 | – | 3 ± 1 | 6.8 ± 0.1 | 53 ± 2 | 6.2 ± 0.05 | 91 ± 1 |
| ACPT-I | – | 7 ± 1 | 5.3 ± 0.2 | 26 ± 2 | 5.1 ± 0.1 | 74 ± 2 |
| cAMP assay | ||||||
| Glutamate | 5.6 ± 0.06 | 100 ± 1 | 5.6 ± 0.07 | 100 ± 2 | 5.1 ± 0.06 | 100 ± 2 |
| LY354740 | 7.8 ± 0.04 | 97 ± 1 | 5.3 ± 0.2 | 59 ± 6 | – | 5 ± 1 |
| APDC | 6.3 ± 0.06 | 96 ± 2 | 6.0 ± 0.1 | 50 ± 2 | – | 9 ± 3 |
| DCGIV | 6.9 ± 0.09 | 69 ± 2 | 6.6 ± 0.2 | 42 ± 3 | 5.5 ± 0.4 | −17 ± 2 |
| L-AP4 | – | 3 ± 2 | 6.6 ± 0.1 | 51 ± 1 | 6.9 ± 0.07 | 99 ± 2 |
| LSP4-2022 | – | 3 ± 1 | 6.9 ± 0.1 | 48 ± 2 | 6.9 ± 0.04 | 99 ± 1 |
| ACPT-I | – | 13 ± 7 | 5.9 ± 0.1 | 32 ± 1 | 5.7 ± 0.1 | 68 ± 3 |
Appendix 1—table 1
Hill equation parameters resulting of fitting curve data in Appendix 1—figure 1.
| L-AP4 conc (n) | Top Mean ± SEM | Bottom Mean ± SEM | x50 Mean ± SEM | nH Mean ± SEM |
|---|---|---|---|---|
| 0 (3) | 102.72 ± 6.89 | 39.40 ± 2.63 | −7.14 ± 0.11 | 0.77 ± 0.13 |
| −10 (3) | 100.29 ± 1.07 | 47.56 ± 1.29 | −7.40 ± 0.09 | 0.65 ± 0.04 |
| −9 (3) | 104.33 ± 2.04 | 39.05 ± 1.57 | −7.10 ± 0.14 | 0.68 ± 0.10 |
| −8 (3) | 88.64 ± 2.48 | 29.41 ± 1.71 | −7.82 ± 0.11 | 0.67 ± 0.04 |
| −7 (3) | 82.23 ± 2.52 | 29.34 ± 0.62 | −8.79 ± 0.17 | 0.93 ± 0.09 |
| −6.5 (2) | 61.65 ± 3.27 | 24.35 ± 0.74 | −8.21 ± 0.05 | 1.40 ± 0.03 |
| −6 (2) | 54.20 ± 0.48 | 27.81 ± 3.12 | −8.38 ± 0.23 | 1.32 ± 0.11 |
| −5 (2) | 46.14 ± 3.95 | 20.47 ± 3.17 | −8.44 ± 0.20 | 1.21 ± 0.48 |
Appendix 1—table 2
Hill equation parameters resulting of fitting curve data in Appendix 1—figure 1.
| L-AP4 conc (n) | nH Mean ± SEM | Confidence interval of nH parameter (95%) |
|---|---|---|
| 0 (3) | 0.77 ± 0.13 | (0.21, 1.33) |
| −10 (3) | 0.65 ± 0.04 | (0.46, 0.83) |
| −9 (3) | 0.68 ± 0.10 | (0.26, 1.09) |
| −8 (3) | 0.67 ± 0.04 | (0.49, 0.85) |
| −7 (3) | 0.93 ± 0.09 | (0.56, 1.30) |
| −6.5 (2) | 1.40 ± 0.03 | (1.04, 1.75) |
| −6 (2) | 1.32 ± 0.11 | (−0.12, 2.76) |
| −5 (2) | 1.21 ± 0.48 | (−4.94, 7.37) |
Appendix 1—table 3
Statistical comparison of goodness of fit including the slope parameter (nH) or not to curves displayed in Appendix 1—figure 1.
| [LAP4] | SS1 | df1 | SS2 | df2 | F-value | p-value |
|---|---|---|---|---|---|---|
| 0 | 1430.9 | 21 | 1330.1 | 20 | 1.515675513 | 0.232557 |
| 10**(−10) | 541.3 | 17 | 415.4 | 16 | 4.849301878 | 0.042671 |
| 10**(−9) | 852.8 | 21 | 727.1 | 20 | 3.457571173 | 0.077738 |
| 10**(−8) | 560.5 | 21 | 455.6 | 20 | 4.604916594 | 0.044334 |
| 10**(−7) | 273.4 | 21 | 273.1 | 20 | 0.021969974 | 0.883651 |
| 10**(−6.5) | 220.5 | 12 | 207.8 | 11 | 0.672281039 | 0.429666 |
| 10**(−6) | 206.5 | 13 | 206.5 | 12 | 0 | 1 |
| 10**(−5) | 252.3 | 13 | 252 | 12 | 0.014285714 | 0.906839 |
Appendix 1—table 4
Data extracted from concentration-effect curve of Appendix 1—figure 4.
| Log[LY354740] | Effect (%) |
|---|---|
| −12.00 | 100.00 |
| −11.00 | 100.00 |
| −10.00 | 99.99 |
| −9.00 | 99.90 |
| −8.00 | 99.03 |
| −7.00 | 92.28 |
| −6.00 | 74.40 |
| −5.00 | 63.50 |
| −4.00 | 54.23 |
| −3.00 | 50.96 |
Appendix—table 5
Parameter values by fitting curve data in Appendix 1—table 4 with the Hill equation.
| Parameter | Estimate | Approx std error | Approximate 95% Confidence Limits | |
|---|---|---|---|---|
| Bottom | 50.9874 | 1.5333 | 47.2355 | 54.7393 |
| Top | 100.5 | 0.7699 | 98.6649 | 102.4 |
| x50 | −5.9487 | 0.0920 | −6.1739 | −5.7234 |
| nH | 0.5993 | 0.0669 | 0.4356 | 0.7631 |
Download links
A two-part list of links to download the article, or parts of the article, in various formats.
Downloads (link to download the article as PDF)
Open citations (links to open the citations from this article in various online reference manager services)
Cite this article (links to download the citations from this article in formats compatible with various reference manager tools)
Pharmacological evidence for a metabotropic glutamate receptor heterodimer in neuronal cells
eLife 6:e25233.
https://doi.org/10.7554/eLife.25233


