An allosteric transport mechanism for the AcrAB-TolC multidrug efflux pump
- Baylor College of Medicine, United States
- The University of Texas Health Science Center at Houston Medical School, United States
- MRC Mitochondrial Biology Unit, Cambridge Biomedical Campus, United Kingdom
- University of Cambridge, United Kingdom
Figures
Figure 1 with 5 supplements
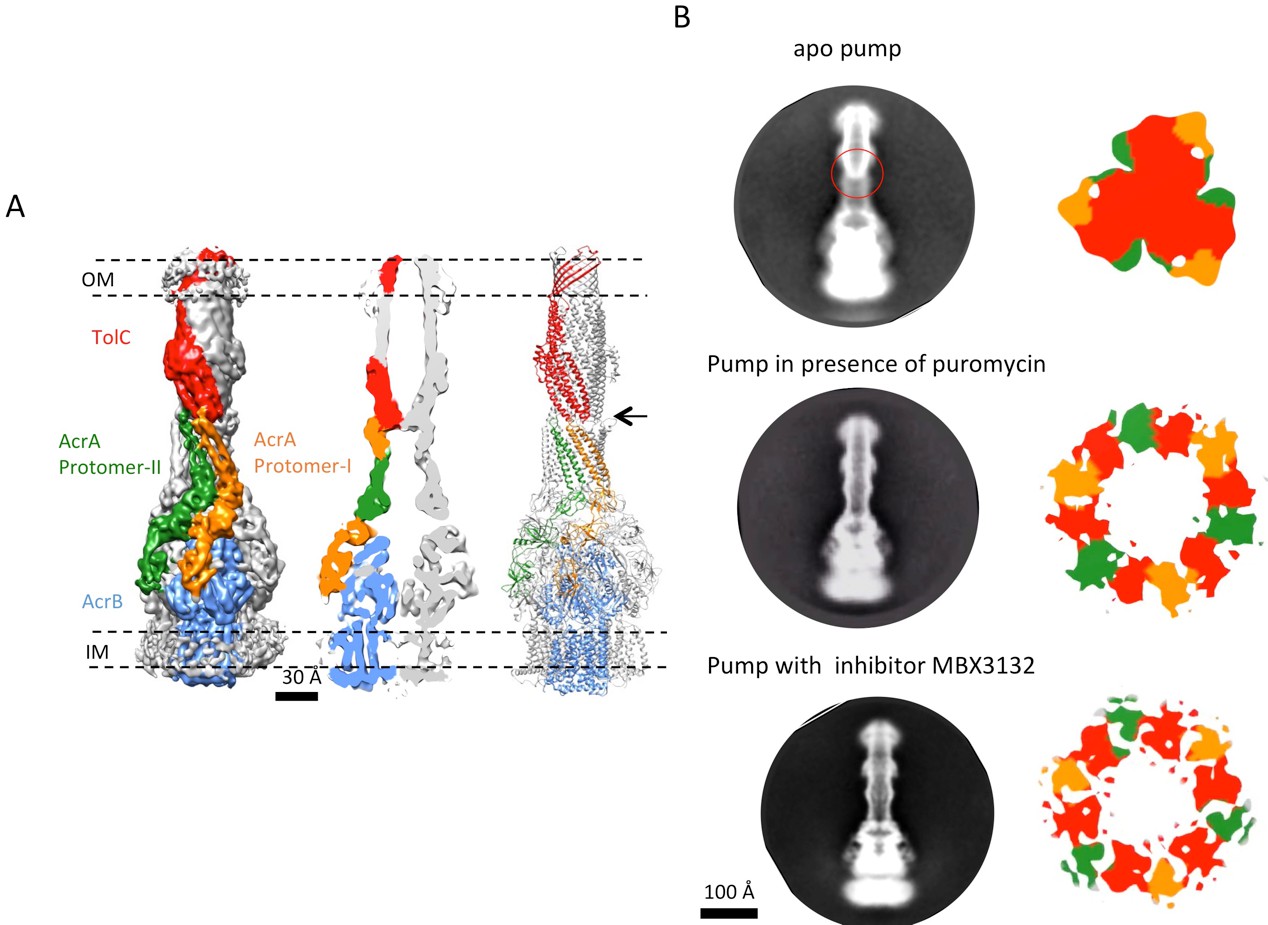
The structure of disulfide-bond stabilized AcrAB-TolC pump with closed channel at 6.5 Å resolution.
(A) CryoEM map of the pump with closed-state TolC, visualized in side view along the membrane plane (left). The four components within one asymmetric unit of the C3 symmetric assembly are color-coded: TolC (red), AcrA (orange and green) and AcrB (blue). (middle) A sliced view of the pump shows the closed channel. (right) Ribbon representation of the pump with closed-state TolC with the same color code as in left panel. The black arrow indicates the closed site in TolC. (B) Comparison of reference- free 2D averages (left) and slice view of 3-D maps at the arrow (right) of the apo pump with closed TolC (top), pump in presence of puromycin (middle) and pump with MBX3132 (bottom).
Figure 1—figure supplement 1
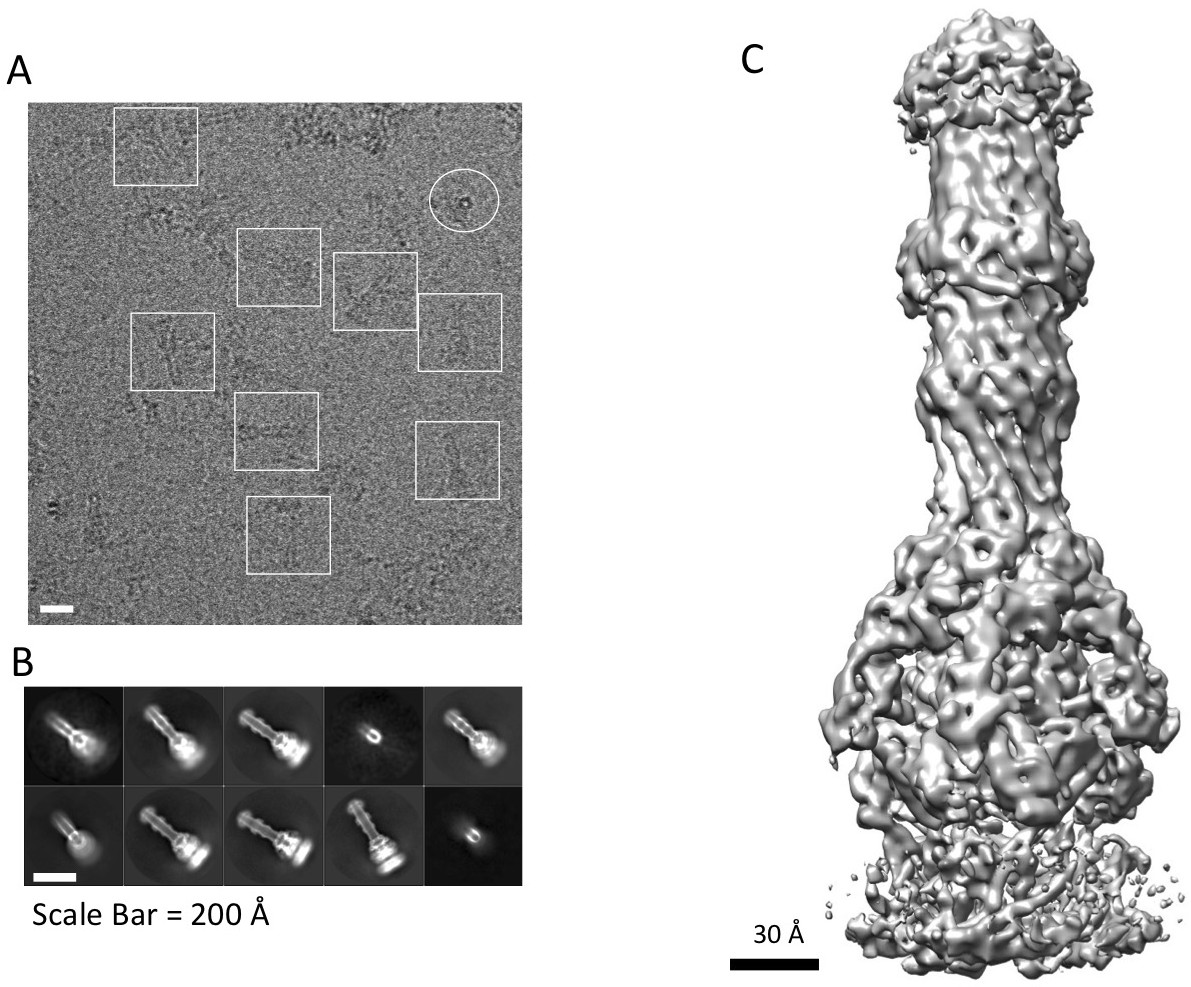
CryoEM structure of the AcrABZ-TolC pump with MBX3132 bound.
(A) A representative motion-corrected cryoEM image of ice-embedded AcrABZ-TolC/MBX3132 recorded using the K2 Summit camera. (B) Gallery of reference-free 2D averages from the images (prepared by Relion1.4). (C) 3.6 Å resolution density map reconstructed in C1 symmetry with the full image data set.
Figure 1—figure supplement 2
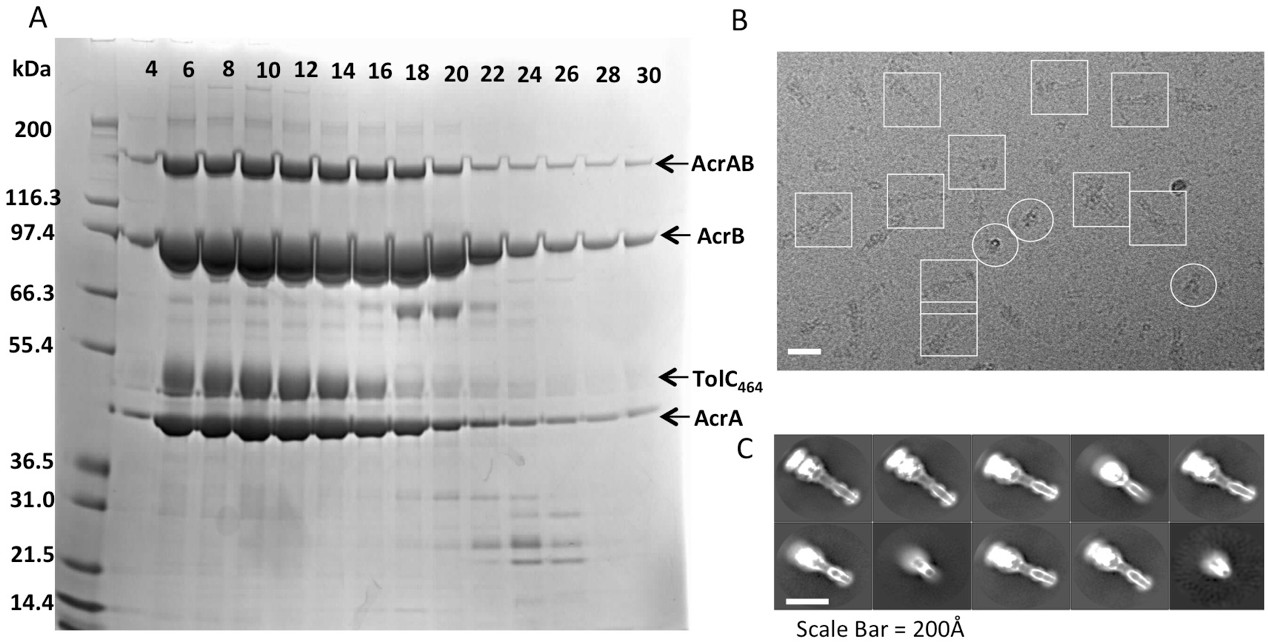
Analysis of the disulfide-bond stabilized AcrAB-TolC pump.
(A) Single cysteine-substitutions in the AcrA and AcrB components (AcrA-S273C and AcrB-S258C) generate stable covalent complexes of AcrAB. The lanes show SDS-PAGE assay of fractions from size exclusion chromatography elution of the double cysteine mutant in the presence of reducing agent. The identity of the bands is indicated. The AcrAB cysteine mutant co-elutes with co-expressed truncated TolC464, indicating that the proteins have formed a stable assembly. In the absence of reducing agent, all the AcrB is present as a thiol-linked complex with AcrA, and excess free AcrA (one pre AcrB protomer) are seen (results not shown). (B) A representative motion-corrected cryo-EM image of ice-embedded AcrAB-TolC pump recorded using the K2 Summit camera. (C) Reference free 2D averages by Relion 2.0.
Figure 1—figure supplement 3
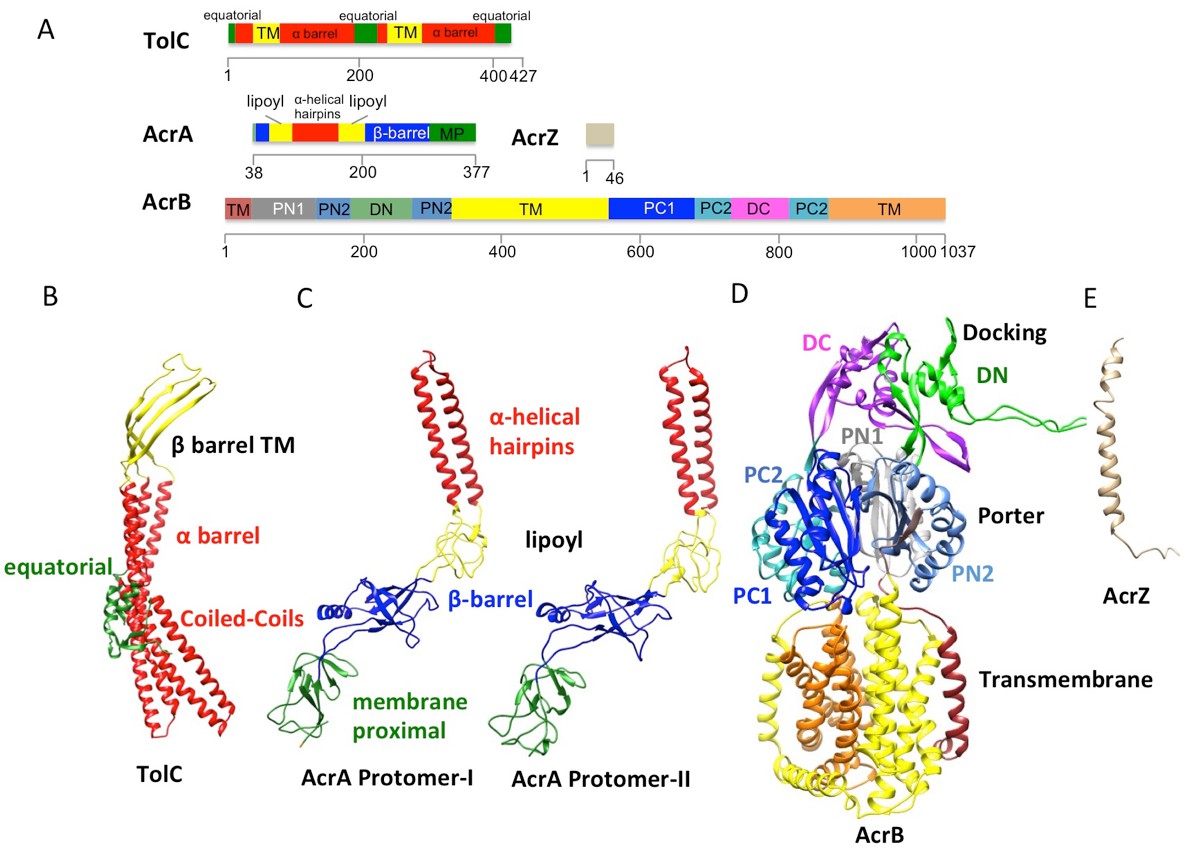
The domains and subdomains of the components of AcrABZ-TolC pump.
(A) Linear representation of protein components of AcrABZ-TolC. The domains are described in the text. The cryoEM derived models of fitted subunits of TolC (B), AcrA (C) AcrB (D) and AcrZ (E) are colour-coded by domains as in panel (A).
Figure 1—figure supplement 4
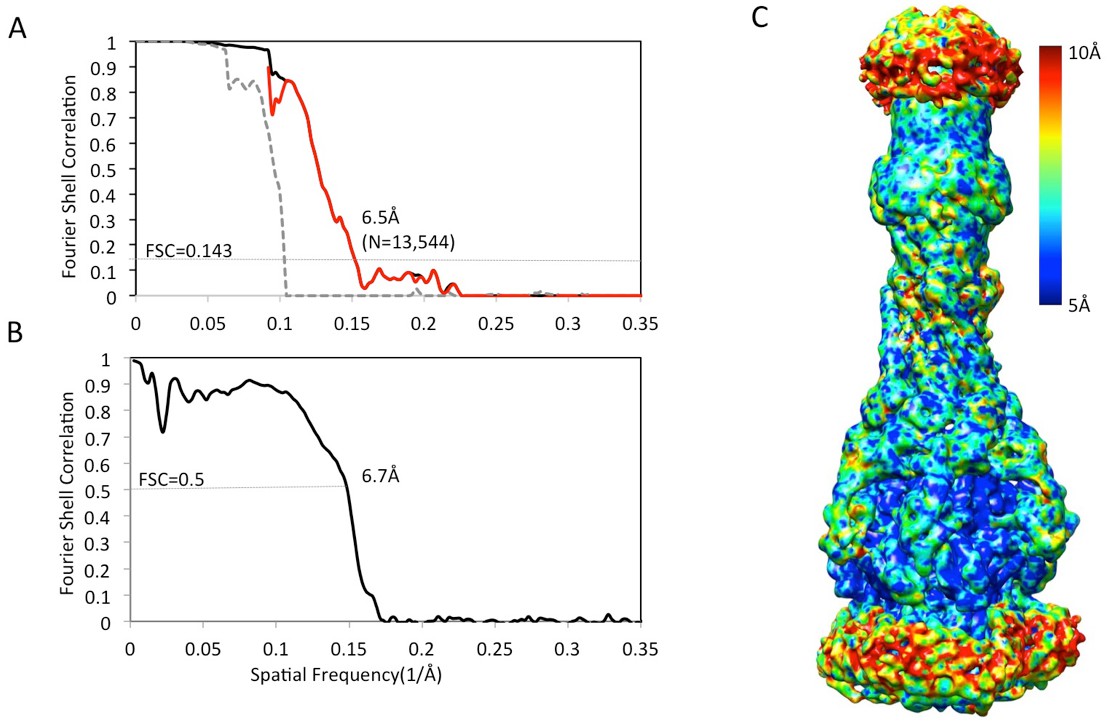
Resolution estimation of the apo AcrAB-TolC pump with closed TolC.
(A) True FSC curves of AcrAB-TolC pump with closed TolC. (B) FSC between cryoEM density map and model. (C) Colour-coded ResMap map of the apo AcrAB-TolC. The map is depicted as viewed along the membrane plane.
Figure 1—figure supplement 5
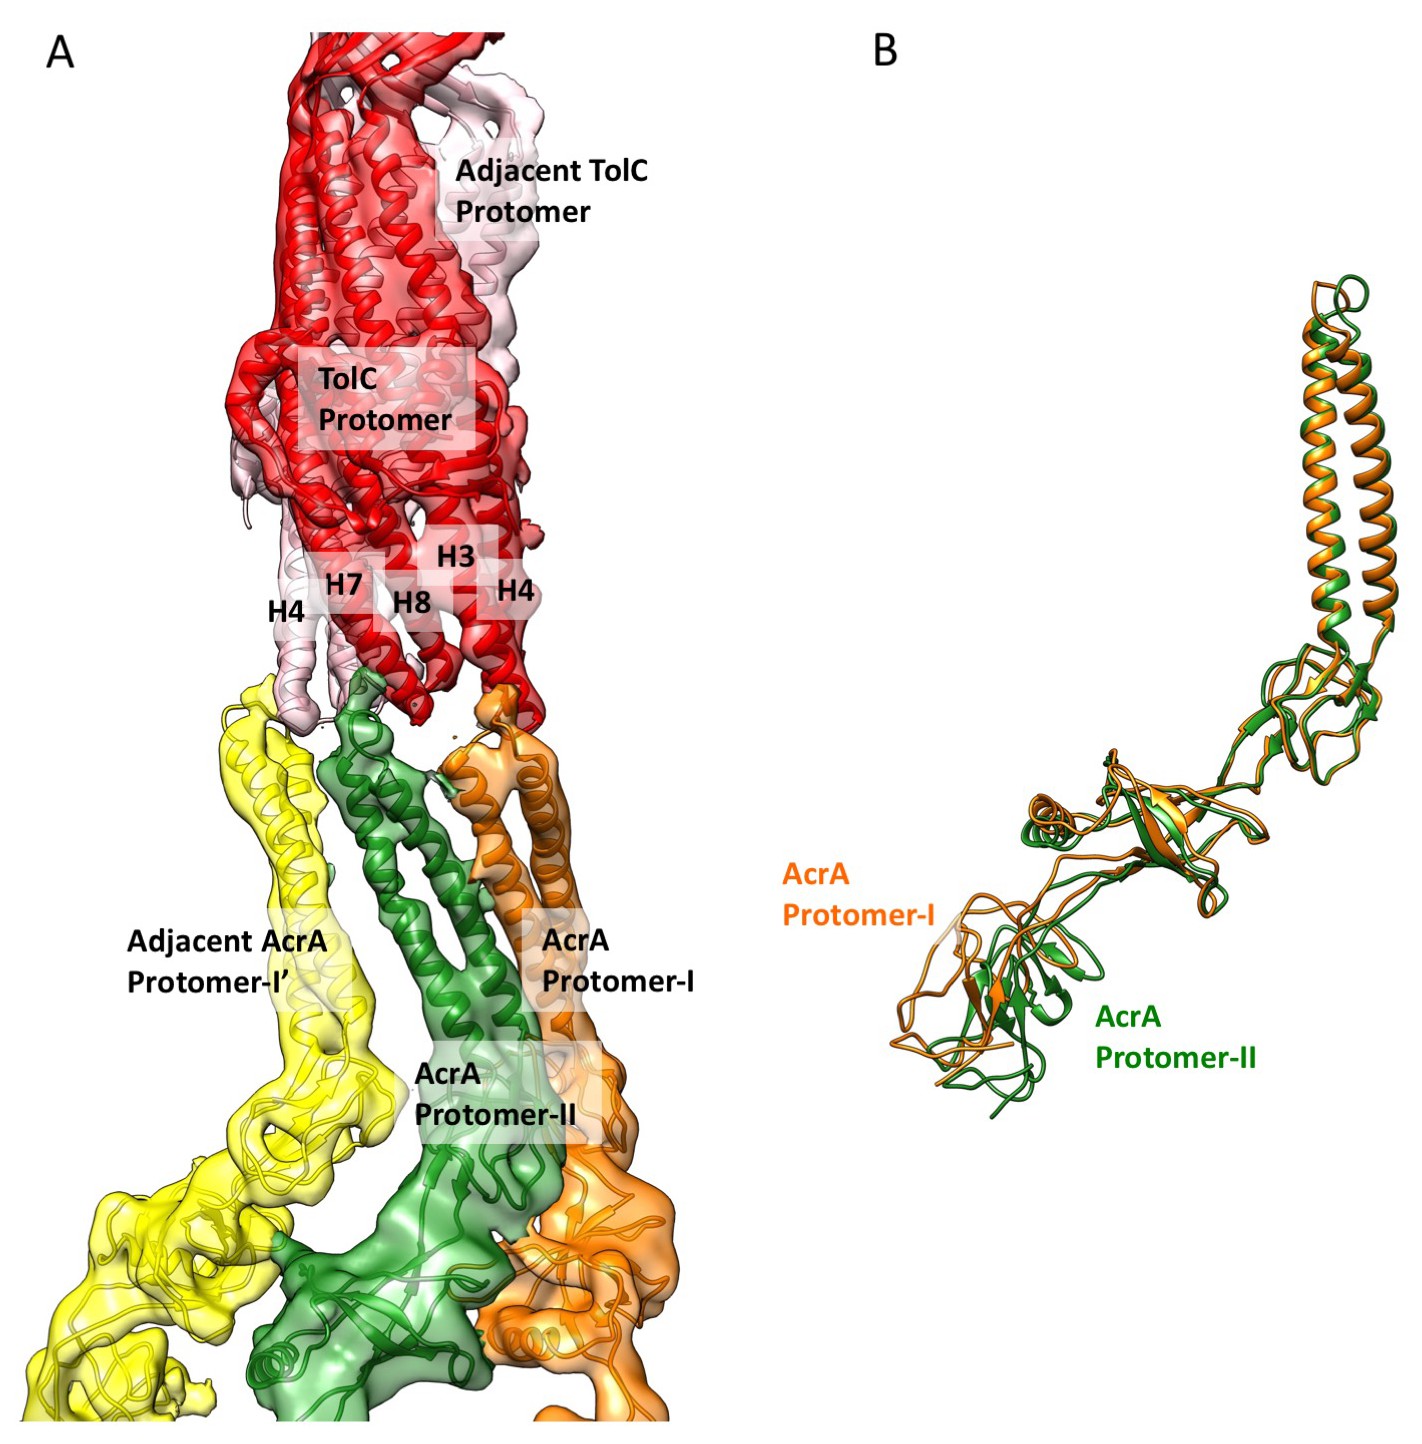
Conformational difference between two AcrA protomers and their interaction with closed-state TolC in the apo-state.
(A) Segments of the cryoEM density map of the pump with fitted models showing the interactions between AcrA and closed-state TolC. The AcrA helical hairpin, lipoyl and β-barrel domains between AcrA protomer-II (green) and the adjacent AcrA protomer-I’ (yellow) do not pack tightly to seal the channel from the periplasm, whereas they do form a tight seal in the ligand bound forms (see Figure 2 and Figure 3). (B) Conformational difference between protomer-I (Orange) and protomer-II (Green) of AcrA in the cryoEM structure of apo AcrAB-TolC pump.
Figure 2 with 3 supplements
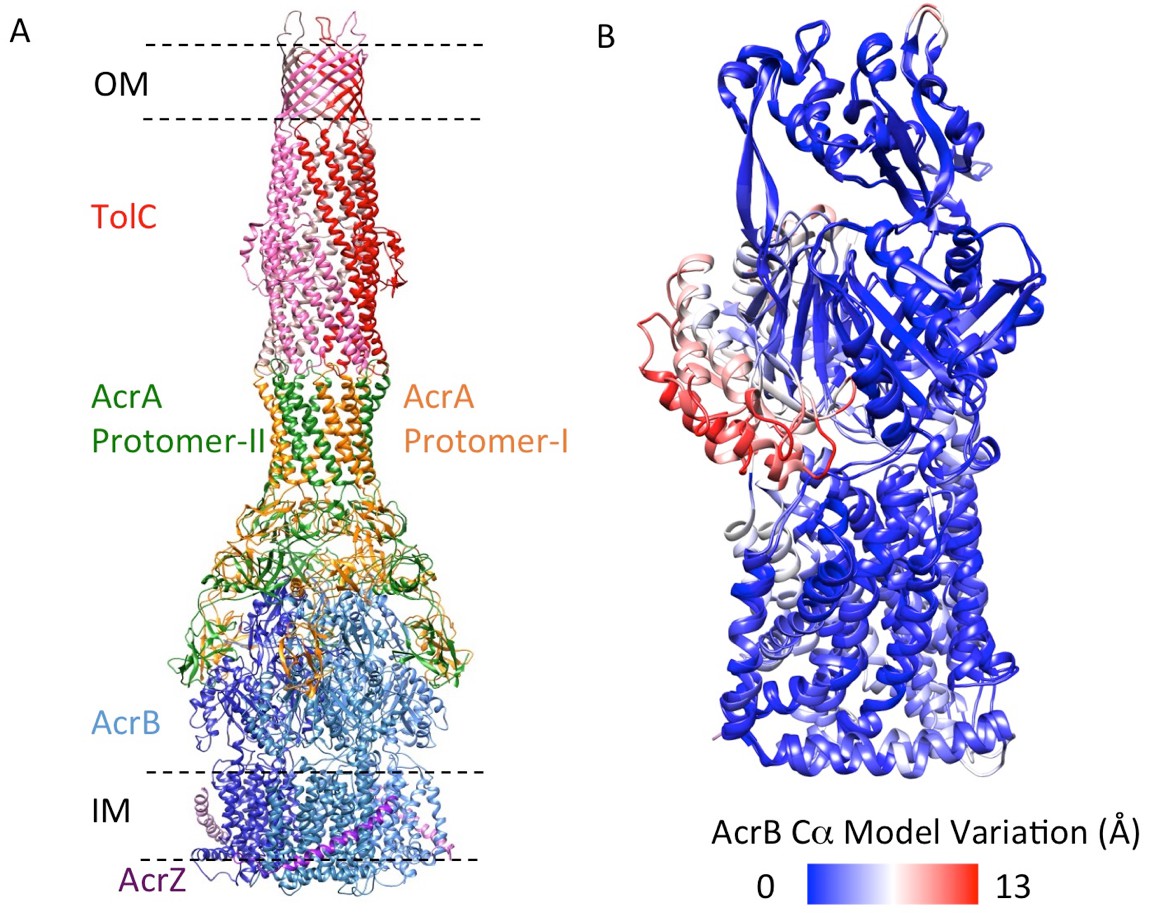
5.9 Å resolution cryoEM asymmetric structure of the AcrABZ-TolC pump in the presence of puromycin.
(A) Structure of asymmetric AcrABZ-TolC pump visualized in side view; subunits are color-coded accordingly: TolC (red and pink), AcrA (orange and green), AcrB (blue) and AcrZ (purple). (B) Model variation of the C-alpha trace between the three subunits of AcrB within the full pump colored in gradient from blue to red with increasing variation.
Figure 2—figure supplement 1
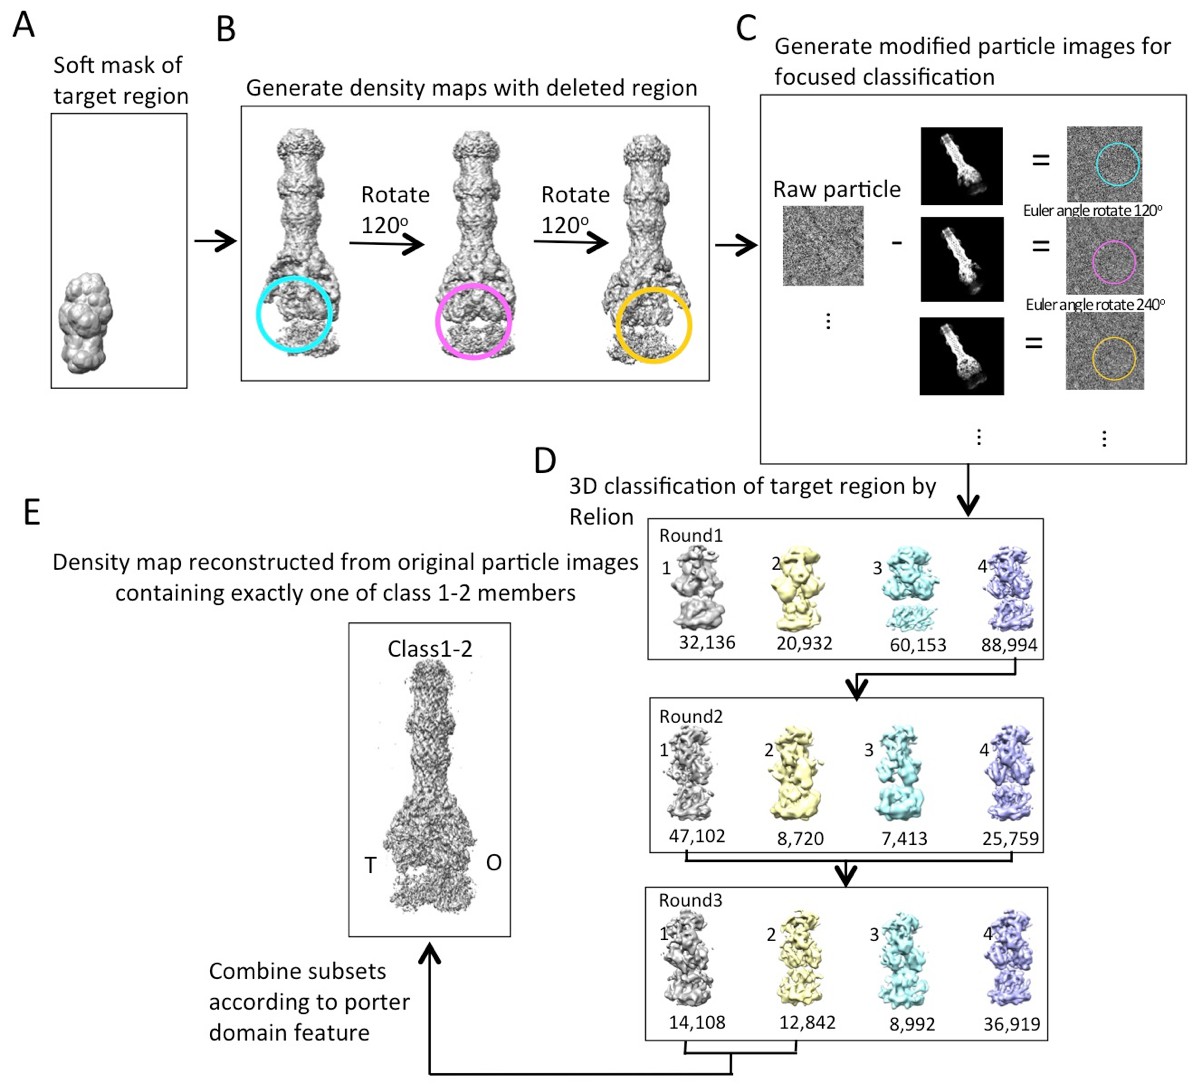
Workflow of masked classification of C3-symmetry imposed map of AcrABZ-TolC pump in the presence of puromycin with residual signal subtraction.
(A) A soft mask used in the target region of the complex for focused classification. (B) Generation of three maps with the part of the complex to be ignored in focused classification. (C) Generation of modified particle images for focused classification by subtraction of the 2D projections of the maps in b from raw images. The modified images are CTF corrected. (D) Three rounds of focused 3D classification yielded classes (1,2 and 4) with good density for the AcrB subunit. (E) Particles were combined according to the features of the density map of the AcrB subunit. The map for the full pump assembly was reconstructed without any imposed symmetry using the original particle images from this combined particle subset.
Figure 2—figure supplement 2
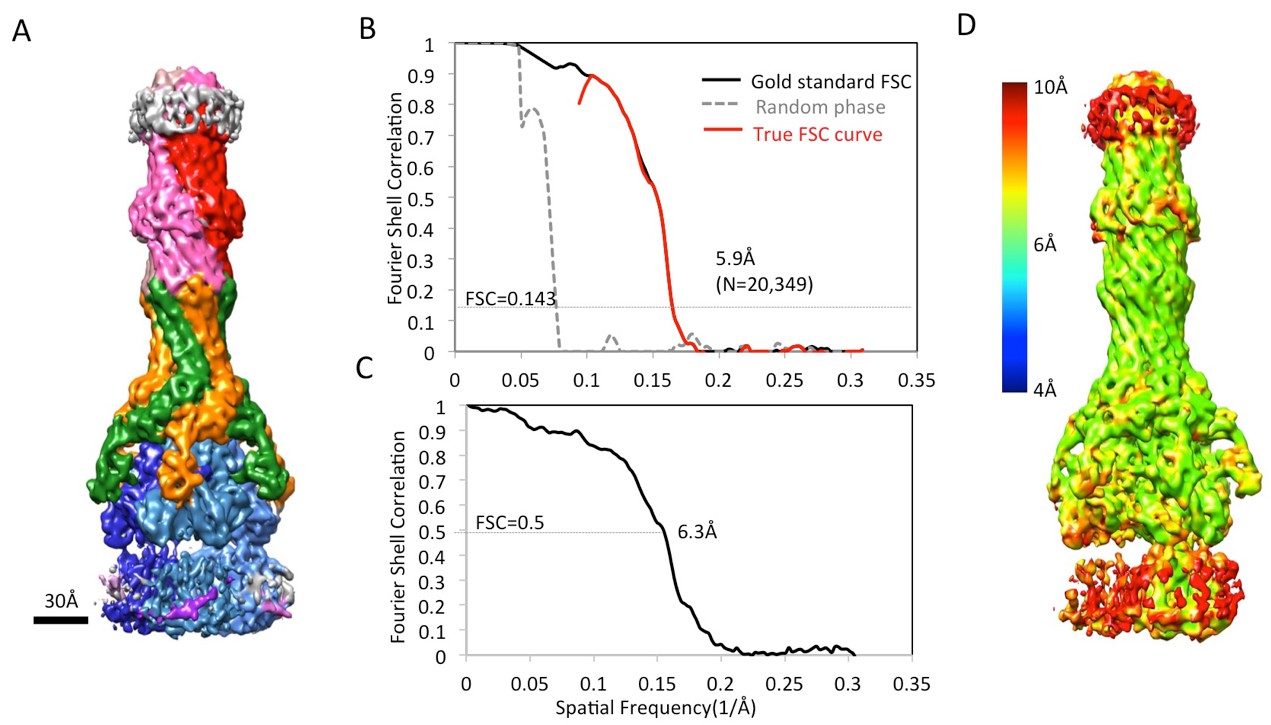
CryoEM analysis of asymmetric AcrABZ-TolC pump in presence of puromycin reconstructed from a subset of particle images after focus classification.
(A) Density map of asymmetric AcrABZ-TolC pump in the presence of puromycin, subunits are color-coded accordingly: TolC (red and pink), AcrA (orange and green), AcrB (blue) and AcrZ (purple). (B) True FSC curves of the asymmetric AcrABZ-TolC pump in the presence of puromycin. (C) FSC between cryoEM density map and model. (D) Color-coded ResMap map of the asymmetric AcrABZ-TolC pump in the presence of puromycin.
Figure 2—figure supplement 3
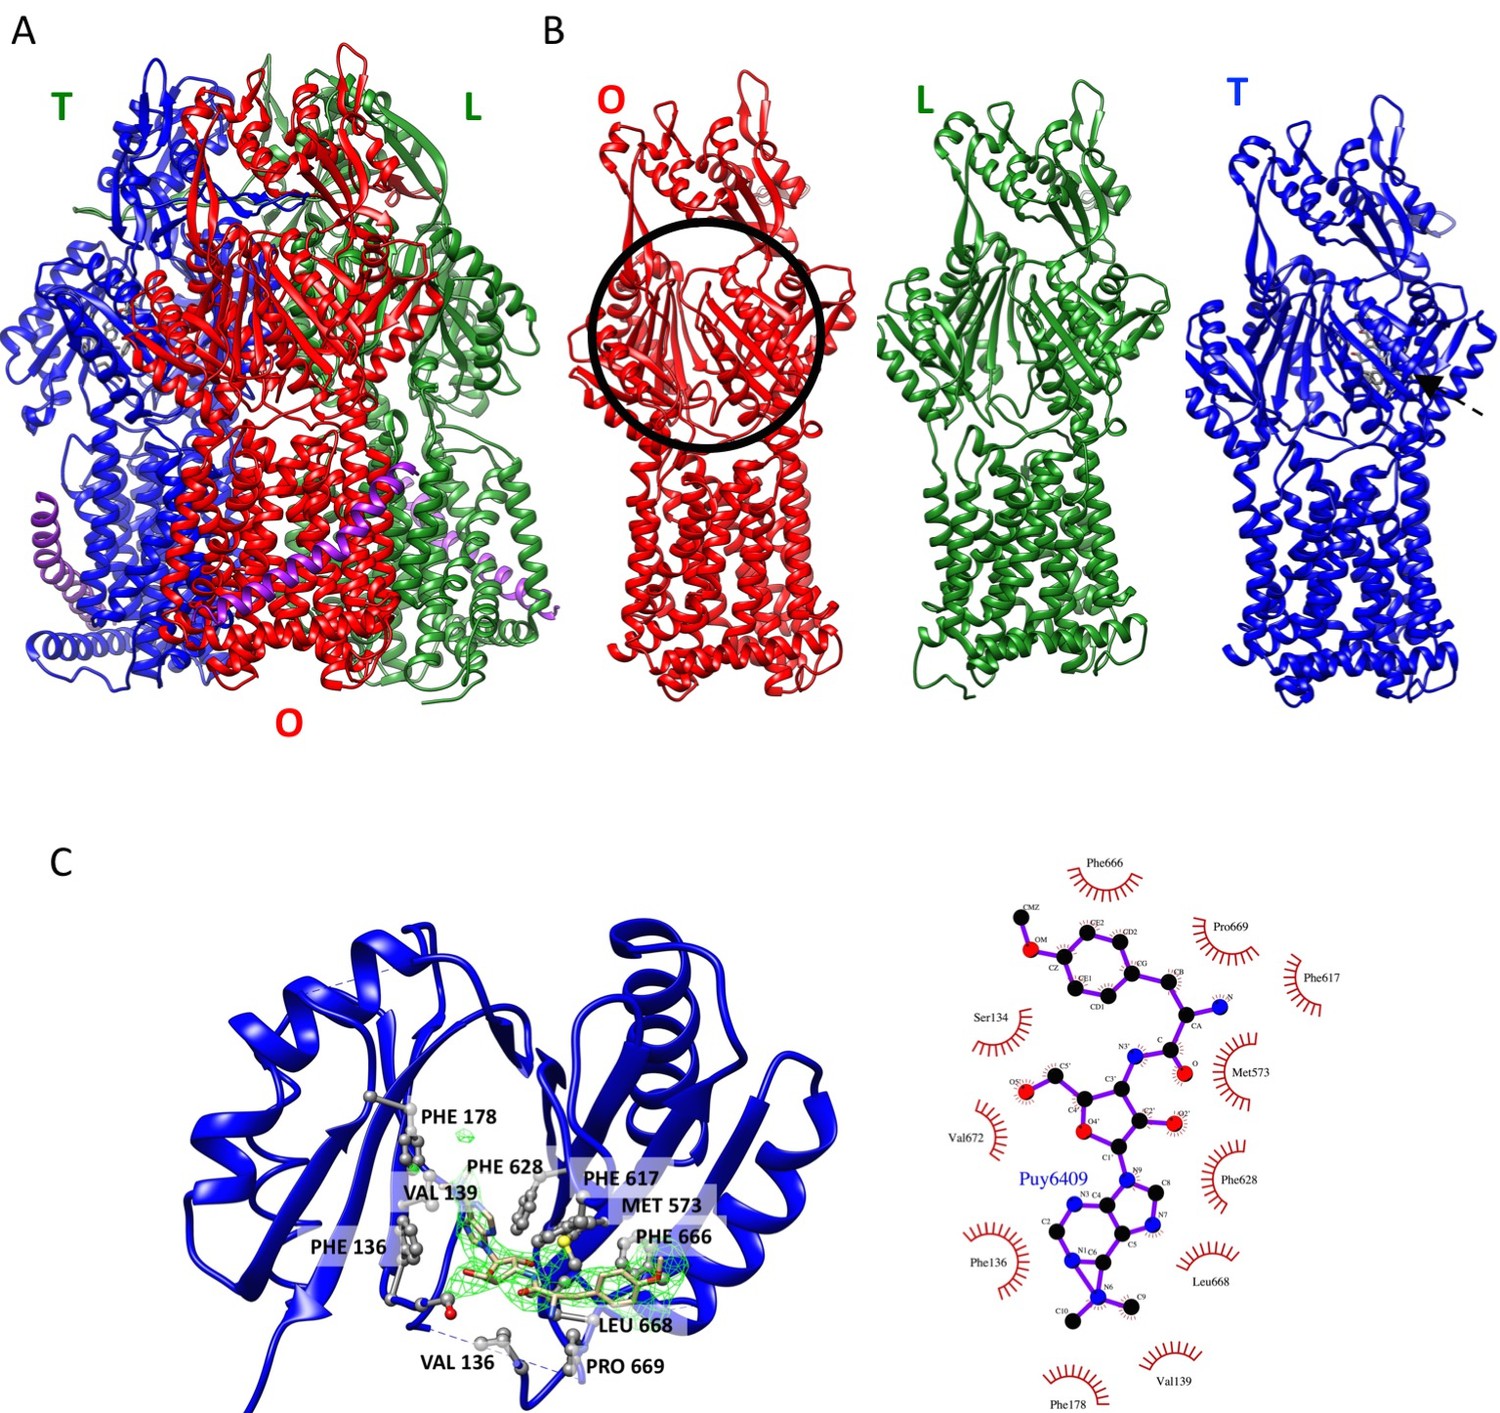
Crystal structure of AcrBZ complex with puromycin bound (PDB ID 5NC5).
(A) Ribbon representation of AcrBZ/puromycin trimer. (B) Individual AcrB protomers in the structure. Protomers O, L and T are colored in red, green, and blue, respectively. (C) An enlarged view of puromycin in the deep binding pocket of the T protomer. The green density was calculated with a feature-enhanced procedure in PHENIX. The schematic on the right shows the main contacts between puromycin and AcrB.
Figure 3 with 2 supplements
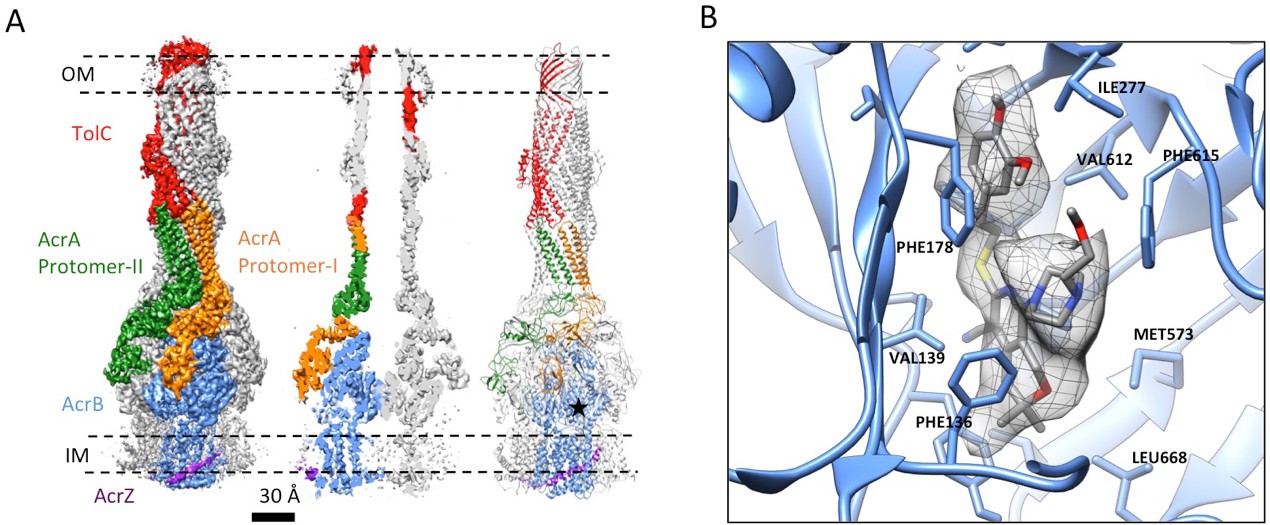
3.6 Å resolution cryoEM structure of the AcrABZ-TolC pump with inhibitor MBX3132 bound AcrB in the TTT state.
(A) Three-fold symmetry imposed density map (left) and model (right) of the AcrABZ-TolC complex. (middle) A sliced view of pump. The five protein components within one asymmetry unit of the pump are color-coded. TolC (red), AcrA (orange and green), AcrB (blue) and AcrZ (purple). (B) Density of the MBX3132 seen in the hydrophobic trap of each AcrB subunit. The location of the trap is indicated by the star in the model in the right panel of (A).
Figure 3—figure supplement 1
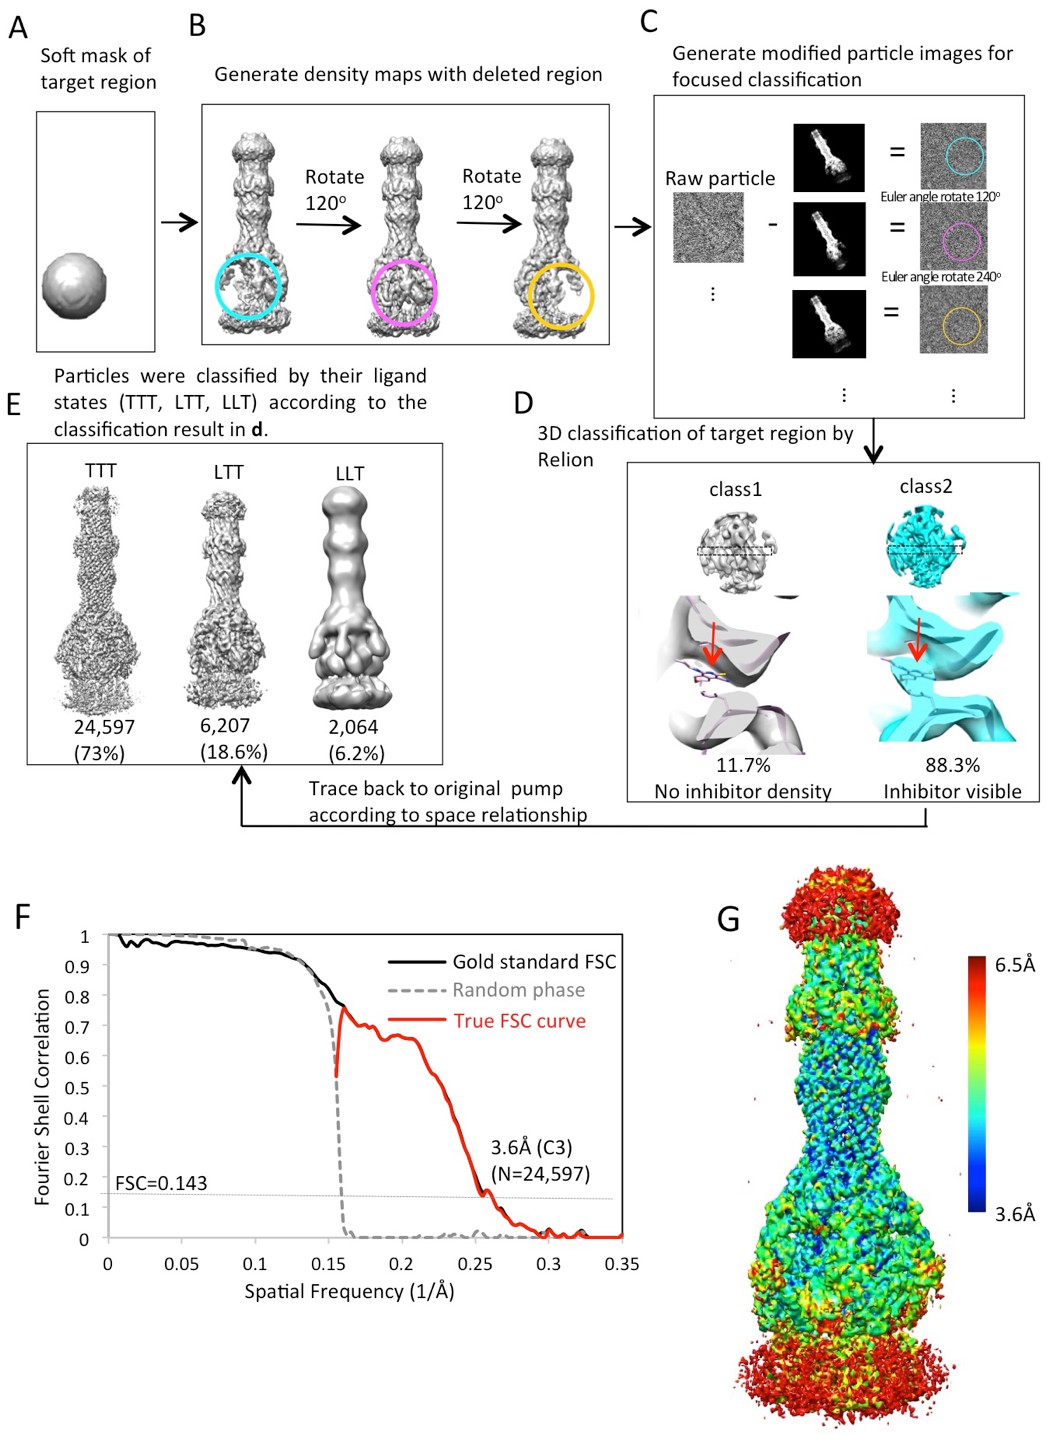
Workflow of focused classification with residual signal subtraction for the AcrABZ-TolC/MBX3132 pump reconstructed with C3 symmetry imposition.
(A) A soft mask is generated in the target region of the pump complex for focused classification. (B) Generation of three maps with the part of the complex to be ignored in focused classification. (C) Generation of modified particle images for focused classification by subtraction of the 2D projections of the maps in (B) from raw images. The modified images are CTF corrected. (D) The focused 3D classification procedure yielded two principal classes, only one class showed ligand density in the hydrophobic trap of AcrB. (E) Particles were classified by their ligand states (TTT, LTT, LLT) according to the classification result in d. The LLL state (not shown) was only observed in a few particles. (F) FSC profile for the particle reconstructions with C3 symmetry using particle images classified as TTT state. The dotted grey line shows the profile in which the phases were randomized at 5 Å resolution. (G) Colour-coded 3D map of AcrABZ-TolC/MBX3132 based on resolution variations obtained with ResMap (Methods).
Figure 3—figure supplement 2

Validation of AcrABZ-TolC/MBX3132 density map and model.
(A) The FSC curve between the cryoEM density map (C3) and map calculated from the molecular model of AcrABZ-TolC/MBX3132. FSC cut-off = 0.5. (B) The densities of selected regions overlaid with the corresponding model: an α-helical hairpin domain of AcrA (left), a coiled-coil in the α-helical barrel region of TolC (middle) and a β-sheet in the pore domain of AcrB (right).
Figure 4 with 3 supplements
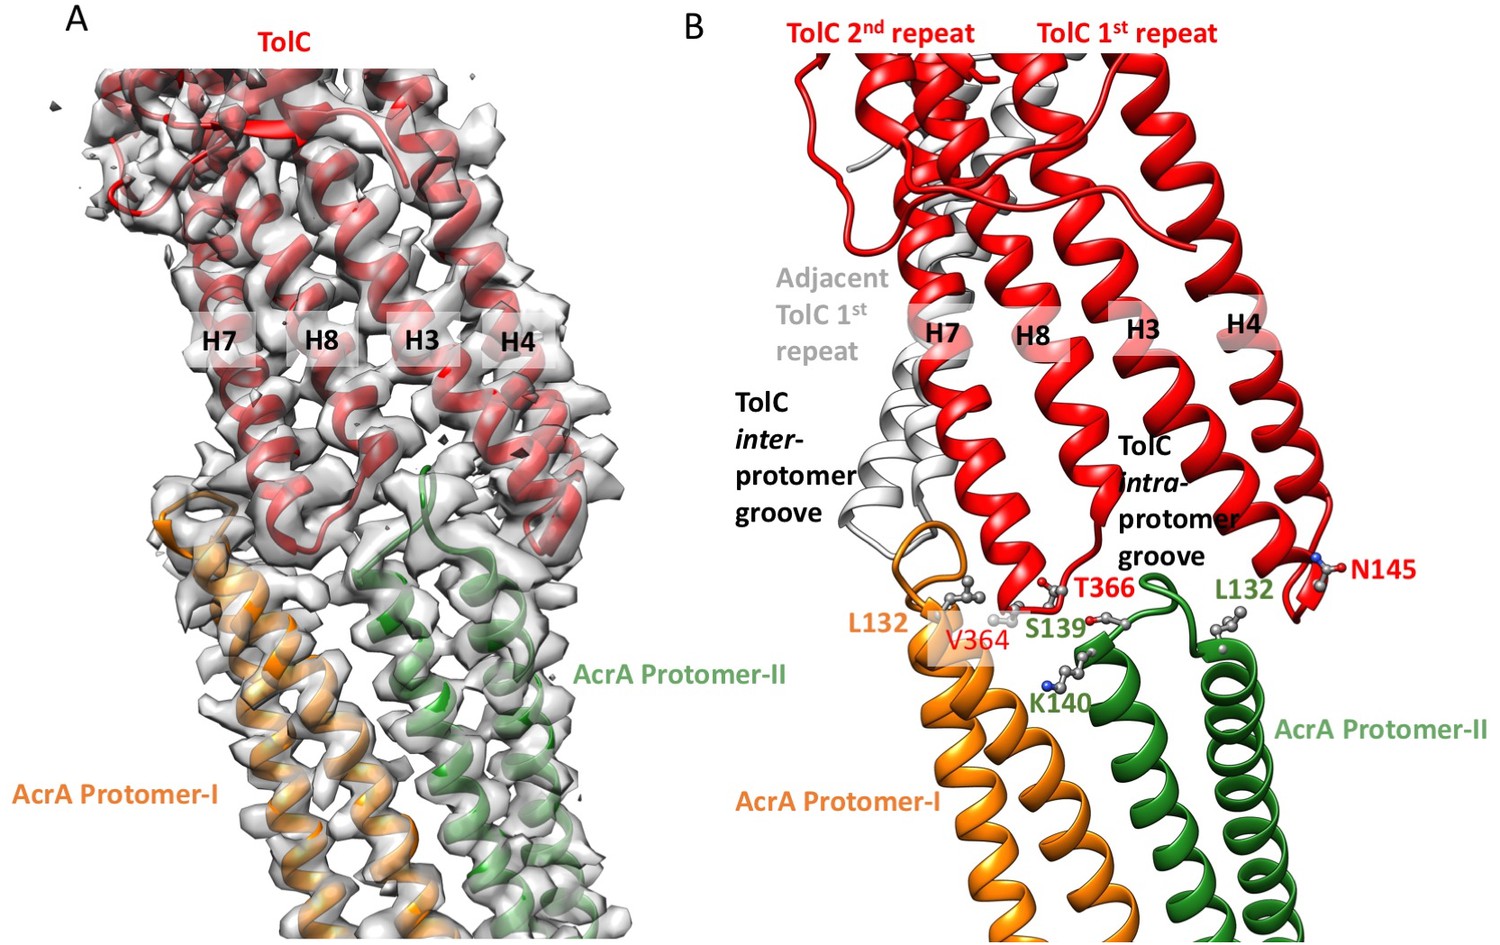
Interactions between TolC and AcrA in the AcrABZ-TolC pump with inhibitor MBX3132 bound.
(A) Segments of the 3.6 Å resolution cryoEM density map of the pump with fitted model showing the tip-to-tip interaction between a TolC protomer (red) and two α-helical hairpins of AcrA (orange and green). (B) Detail of the tip-to-tip interface of TolC and AcrA. Residue pairs of complementary mutations (Kim et al., 2015) identified at this interface are shown (Xu et al., 2011).
Figure 4—figure supplement 1
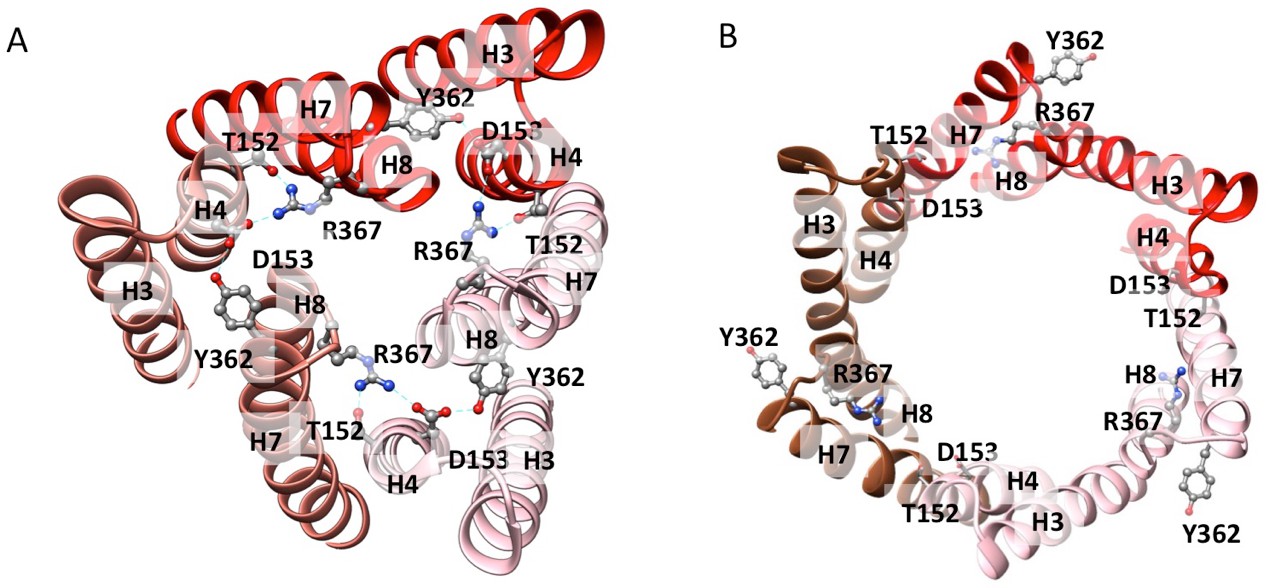
Residue interactions in the closed and open states of TolC.
(A) The closed-state TolC from crystal structure (PDB code: 1EK9). Residues Y362, R367 from H7/H8 interact with T152, and D153 from H3/H4 to form a network of hydrogen bond interactions. (B) In the opened-state TolC in the full pump in the presence of ligands, this interaction network is broken. The three protomers are coloured in red, orange-red and pink, respectively. The model is from the MBX3132-bound pump.
Figure 4—figure supplement 2

Pairs of co-evolved residues at the TolC-AcrA interface.
Four co-evolving residue pairs of the MdtNOP efflux pump between the components MdtN and MdtP were mapped onto crystal structures of VceC and MacA, (http://datadryad.org/resource/doi:10.5061/dryad.s00vr/3) (Ovchinnikov et al., 2014). The corresponding co-varying pairs in AcrA and TolC were obtained by sequence alignment between AcrA and MacA (Yum et al., 2009), and between TolC and VceC (Federici et al., 2005), respectively.
Figure 4—figure supplement 3
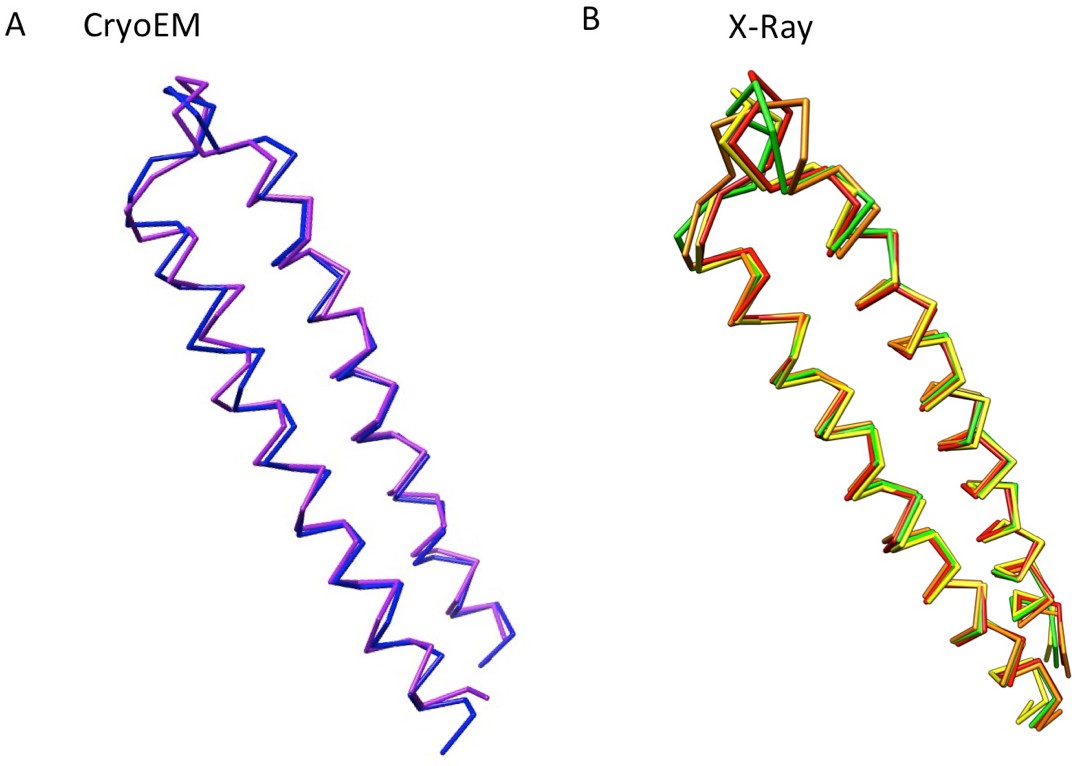
The conformational flexibility at the tips of α-helical hairpin domains of AcrA, displayed as Cα traces.
(A) Conformational difference of the α-helical hairpin domains of protomer-I (blue) and protomer-II (purple) of AcrA in the cryoEM structure of AcrABZ-TolC/MBX3132. (B) Four conformations of the α-helical hairpin domains of AcrA observed in a crystal structure. Chains A to D are coloured in red, orange, yellow and green, respectively (PDB code: 2F1M).
Figure 5
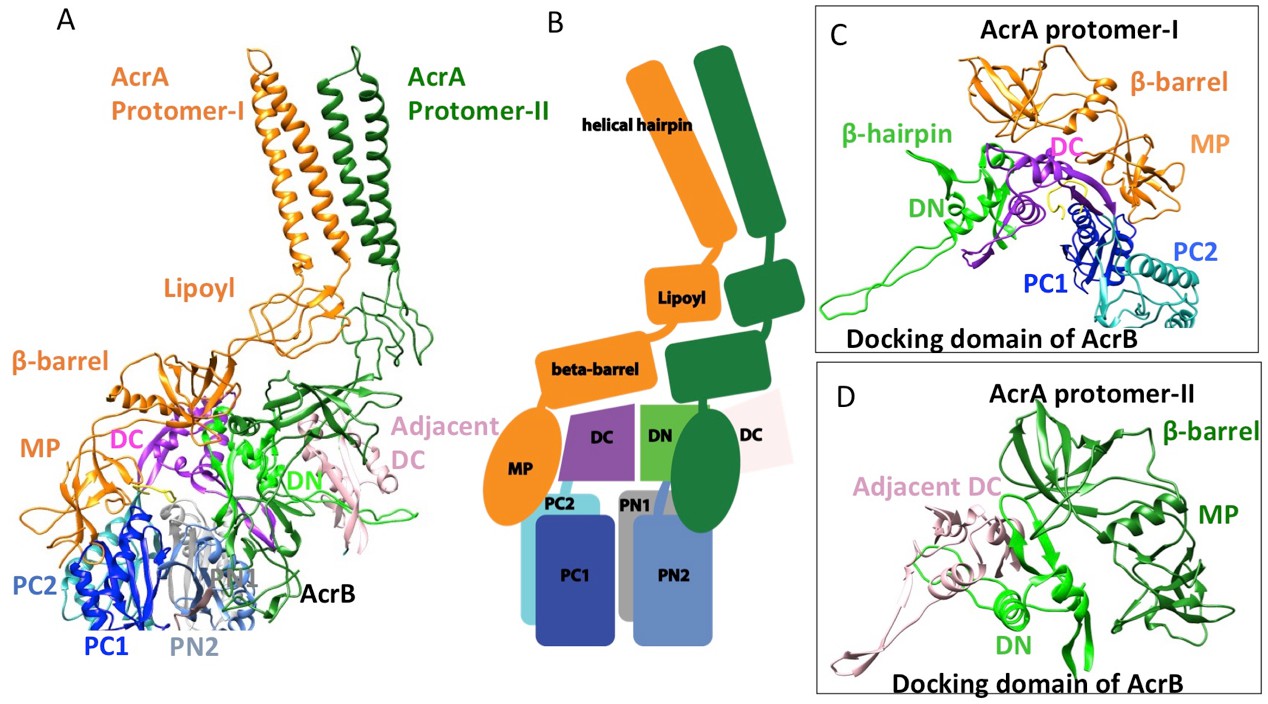
Interactions between AcrA and AcrB in the AcrABZ-TolC pump with inhibitor MBX3132 bound.
(A) A pair of AcrA protomers interacts with one AcrB protomer. Subdomains of the AcrB are labeled with different colors. (B) Cartoon schematic of the domains/subdomains shown in (A). (C) Interaction between AcrA protomer-I and AcrB. (D) Interaction between AcrA protomer-II and AcrB. There are 120 and 180 degrees rotations in (C) and (D) relative to (A), respectively.
Figure 6
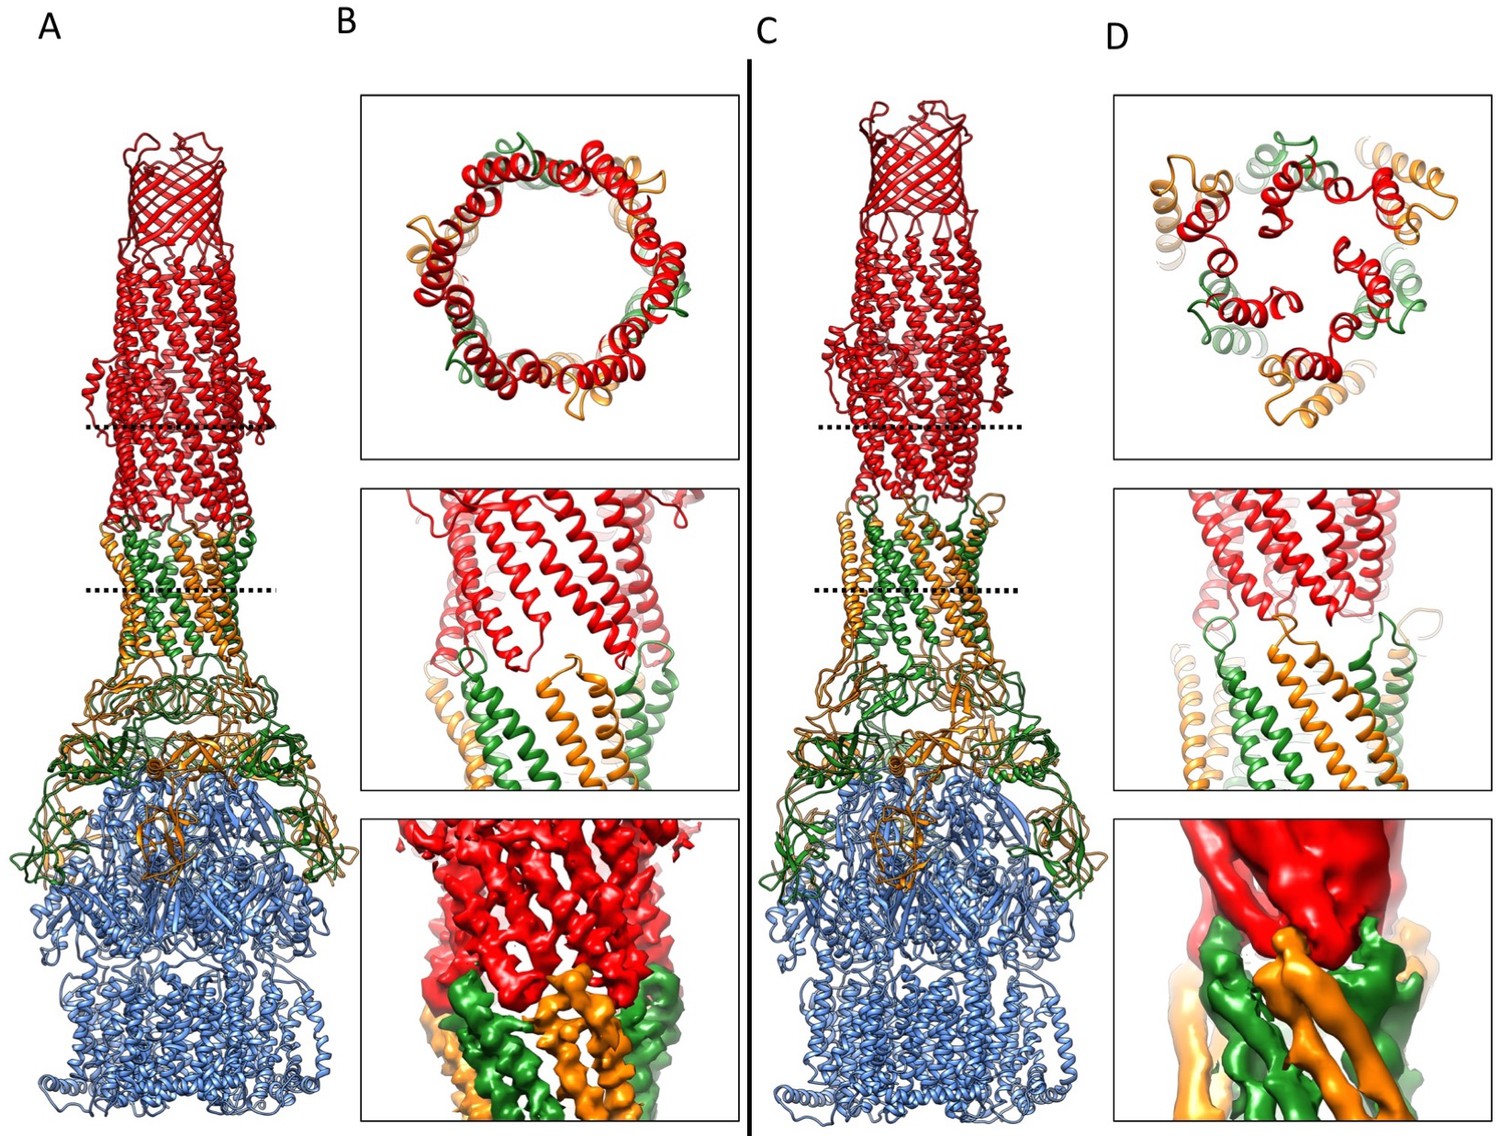
Comparison of AcrA-TolC interactions in puromycin-bound and apo state.
(A) Structure of AcrAB-TolC/puromycin pump visualized in side view. (B) Top view (top panel) and side views (middle and bottom panels) of AcrA-TolC interface in puromycin-bound state. (C). Structure of apo AcrAB-TolC pump visualized in side view. (D) Top view (top panel) and side views (middle and bottom panels) of AcrA-TolC interface in apo state. Subunits are color-coded accordingly: TolC (red), AcrA (orange and green) and AcrB (blue).
Figure 7
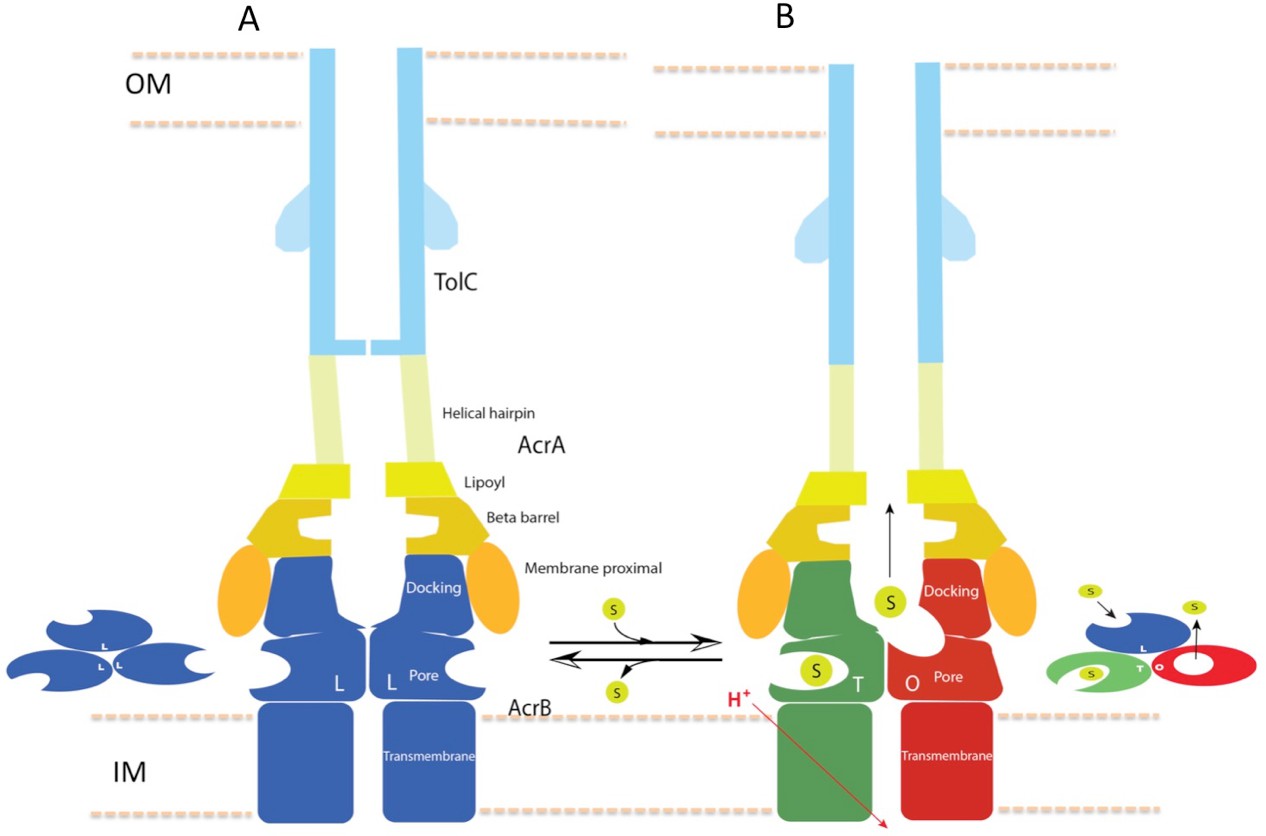
Schematic cartoon of the transport mechanism.
(A) The resting state of the apo pump with TolC in closed-state and the AcrB trimer in LLL conformation. (B) The apo pump switches to a transport-state in the presence of transport substrate (s), opening the TolC channel (right arrow). In the transport-state, AcrB cycles through three, structurally distinct states (L, T and O), two of which are shown in the left panel (T and O). Cycling is obligatory for unidirectional transport, driven by coupling with transmembrane proton conduction through the TM domain (red arrow). In the absence of substrate, the pump reverts to the resting state and closes the TolC channel (left arrow). The views are cross-sections through the cell envelope, with only two protomers shown for each of the pump components. The inset cartoons on the left in (A) and the right in (B) show views down the molecular axis of the AcrB trimer, indicating the states with the configuration inferred from the cryoEM reconstructions. The model predicts a contraction along the long axis of the pump with the switch from apo- to transport-states.
Videos
Video 1
Structure of AcrABZ-TolC multidrug efflux pump with inhibitor MBX3132 bound.
Individual protein subunits of the density map are highlighted and their corresponding models are then shown.
Video 2
Morph animation between the disulfide-engineered pump-derived model and the derived model of the pump in the presence of puromycin.
Intermediate states are interpolated between the two resolved states.
Additional files
-
Supplementary file 1
CryoEM Data collection and processing.
- https://doi.org/10.7554/eLife.24905.024
-
Supplementary file 2
Model statistics of AcrABZ-TolC/MBX3132 pump.
- https://doi.org/10.7554/eLife.24905.025
-
Supplementary file 3
Crystallographic data and refinement statistics of AcrBZ complex with puromycin.
- https://doi.org/10.7554/eLife.24905.026
Download links
A two-part list of links to download the article, or parts of the article, in various formats.
Downloads (link to download the article as PDF)
Open citations (links to open the citations from this article in various online reference manager services)
Cite this article (links to download the citations from this article in formats compatible with various reference manager tools)
An allosteric transport mechanism for the AcrAB-TolC multidrug efflux pump
eLife 6:e24905.
https://doi.org/10.7554/eLife.24905


