EM connectomics reveals axonal target variation in a sequence-generating network
- Max Planck Institute of Neurobiology, Germany
- New York University Langone Medical Center, United States
- New York University, United States
- Max Planck Institute for Biological Cybernetics, Germany
- Bernstein Center for Computational Neuroscience, Germany
- Center of Advanced European Studies and Research, Germany
Figures
Figure 1 with 4 supplements
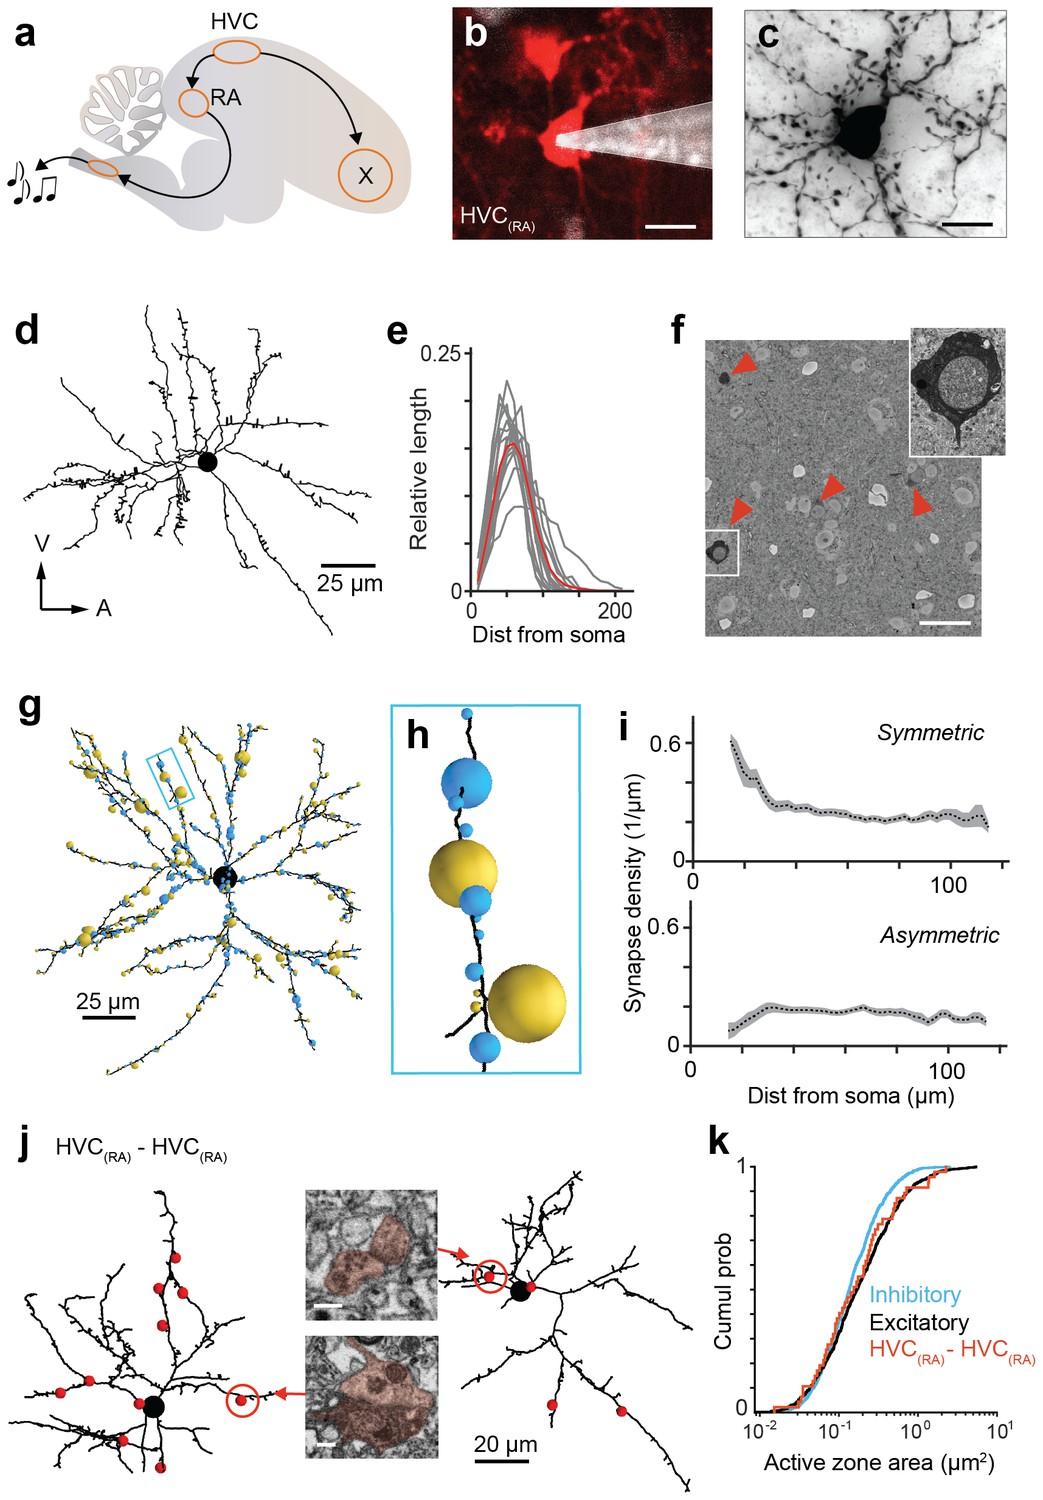
Analysis of synaptic inputs onto HVC(RA) dendrites.
(a) A schematic of the songbird brain showing HVC and its two main downstream targets, RA and Area X. (b) A backlabeled HVC(RA) neuron (red) during juxtacellular filling (pipette shown in white) guided by 2-photon imaging of fluoro-Ruby. (c,d) A Neurobiotin-filled cell from (b) in brightfield LM after histochemical processing (c) and dendritic reconstruction (d). (e) Normalized count of dendritic path length vs. soma distance for 15 HVC(RA) neurons; individual cells (gray) and average (red). Bin size: 10 µm. (f) Cross-section through a SBEM stack showing BDA-labeled HVC(RA) somata. (g) Inhibitory (blue spheres) and excitatory (gold spheres) synapses onto an HVC(RA) dendrite in the SBEM volume. Sphere cross-sectional areas are proportional to the active zone area. (h) Higher magnification of a dendritic branch from (g). (i) Density of asymmetric and symmetric synapses vs. the distance to the soma. (j) Two HVC(RA) dendrites; red spheres indicate double-labeled synapses, with cross sections through two synapses (insets). Inset, cross sections through the synapses circled in red. (k) Active zone size distributions of inhibitory (blue), excitatory (black), and double-labeled (red) synapses. Scale bars are 10 µm in b and c, 25 µm in f, and 0.25 µm in j.
Figure 1—figure supplement 1
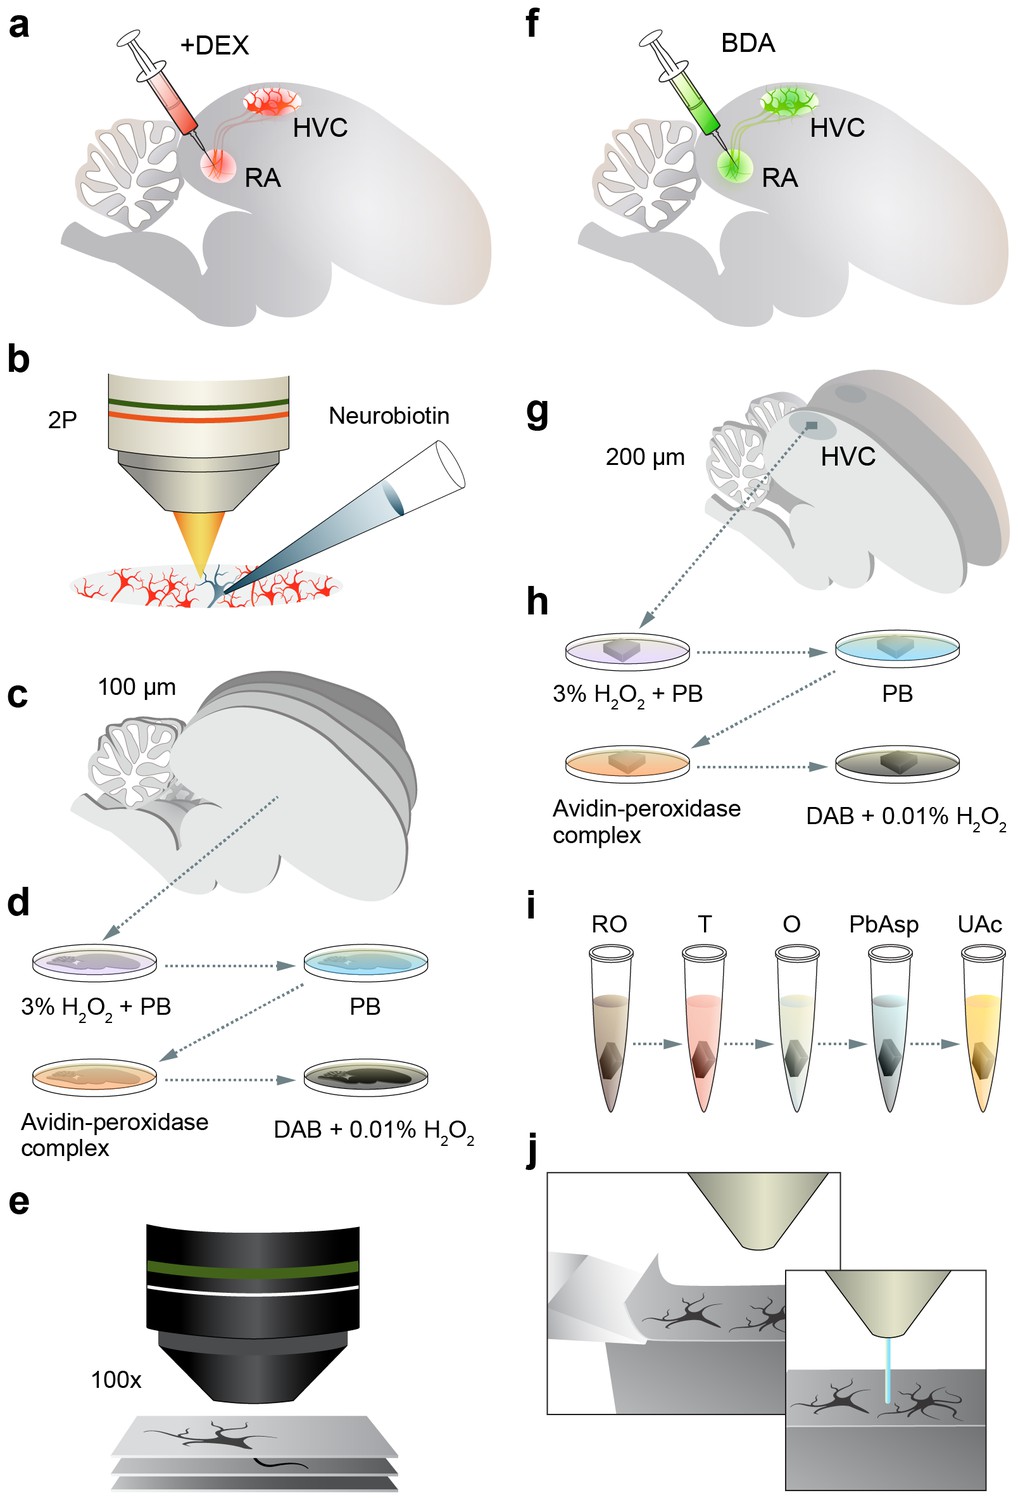
Sample preparation for LM and EM.
(a,b) For LM, HVC(RA) neurons are retrogradely labeled by injecting a fluorescent dextran (fluoro-Ruby) into RA (a), and a single labeled neuron is targeted and filled with Neurobiotin under the guidance of 2-photon microscopy (b). (c) The tissue is then fixed and 100 µm parasagittal sections are sliced through the entirety of HVC. (d,e) Sections are further processed to stain Neurobiotin-labeled neurites (d) and then imaged in brightfield with a 100x objective (e). (f) For EM, HVC(RA) neurons are retrogradely labeled with biotinylated dextran (BDA). (g,h) A single 200 µm parasagittal section is taken from the center of HVC (g) and further processed to stain BDA-labeled neurites (h). (i,j) A cube of tissue from within the center of HVC is extracted and stained by ROTO (reduced osmium OTO) (i) before being imaged via SBEM (j).
Figure 1—figure supplement 2
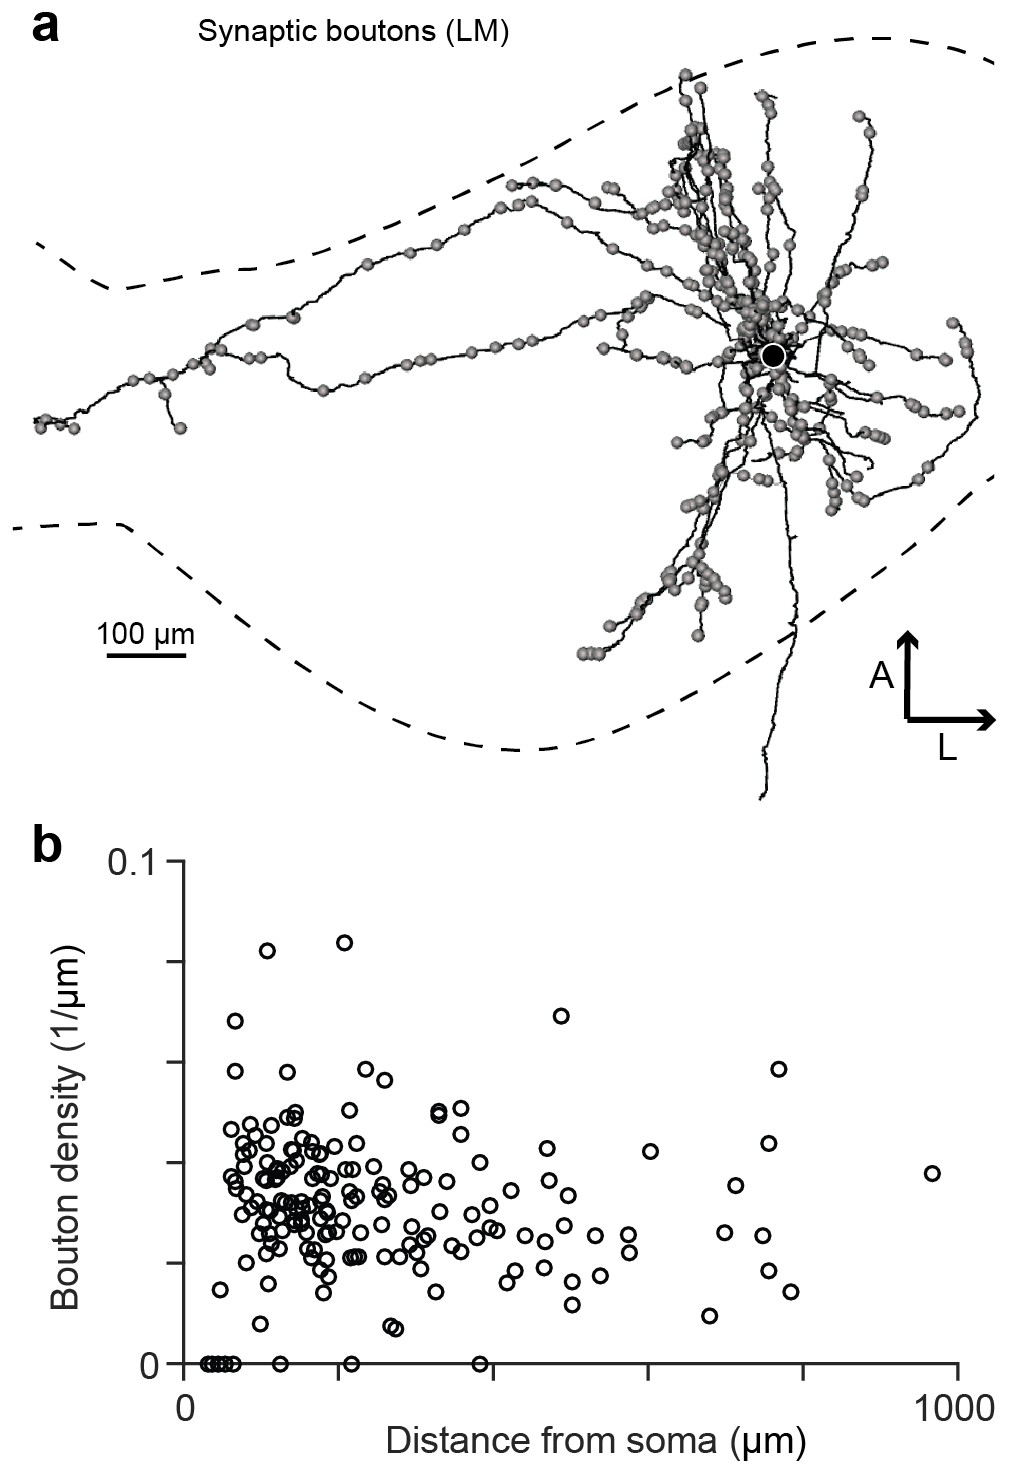
Synaptic boutons on HVC(RA) axon collaterals.
(a) An LM reconstruction of HVC(RA) axon collaterals of one neuron with the HVC border indicated by dashed lines. Locations of all synaptic boutons are marked by grey spheres. (b) Bouton density of collateral branches as a function of their midpoint distances from the soma.
Figure 1—figure supplement 3
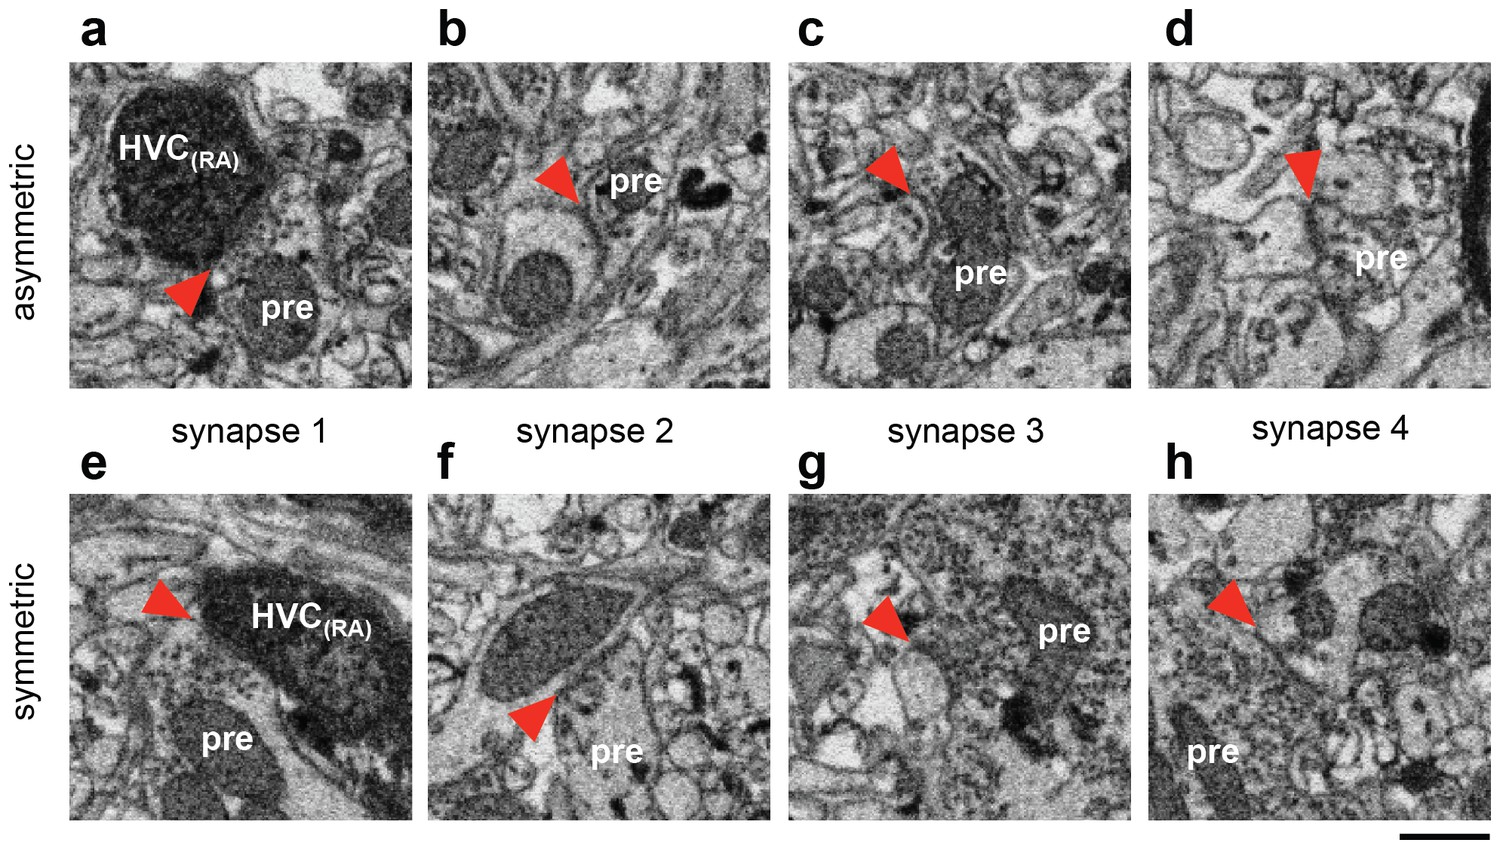
Ultrastructural classification of synapses.
(a) An asymmetric synapse onto a BDA-labeled HVC(RA) dendrite whose morphology is partially obscured by the label. Red arrows indicate the synaptic cleft. (b to d) Other synapses made by the same axon onto unlabeled dendrites. The pronounced postsynaptic density (PSD), especially for synapse 4, confirms the classification of this connection as excitatory. (e) A symmetric synapse onto a BDA-labeled HVC(RA) dendrite. (f to h) Synapses from the same neuron onto other unlabeled dendrites display a lack of a PSD and a different appearance of synaptic vesicles compared with the asymmetric synapses. Scale bar: 0.5 µm.
Figure 1—figure supplement 4
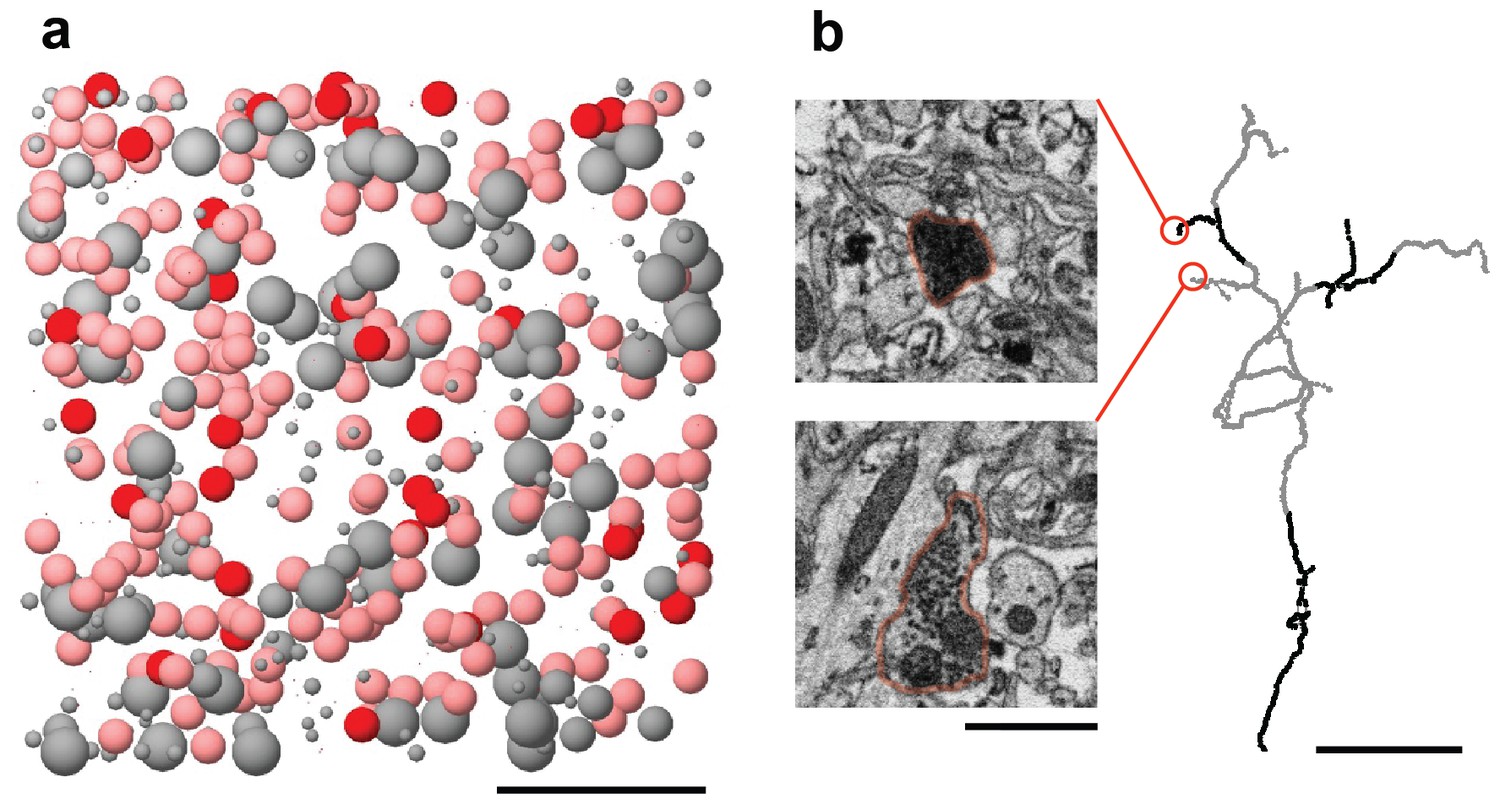
The BDA label is inefficient and incomplete.
(a) All cells within our SBEM dataset are represented by spheres at the location of the cell body. Known HVC(RA) neurons, which were labeled with BDA, were colored red. Also shown are putative HVC(RA) neurons, classified by morphological features of the soma and dendrite (pink), other neuron types (large gray spheres), and glia (small gray spheres). Scale bar: 50 µm. (b) Incomplete labeling of axonal collaterals of HVC(RA) neurons inside HVC is demonstrated with a skeleton reconstruction (labeled axon in black and unlabeled axon in gray). The inset electron micrographs correspond to the portions of the axonal field indicated. Scale bars: left: 1 µm, right: 5 µm.
Figure 2 with 1 supplement
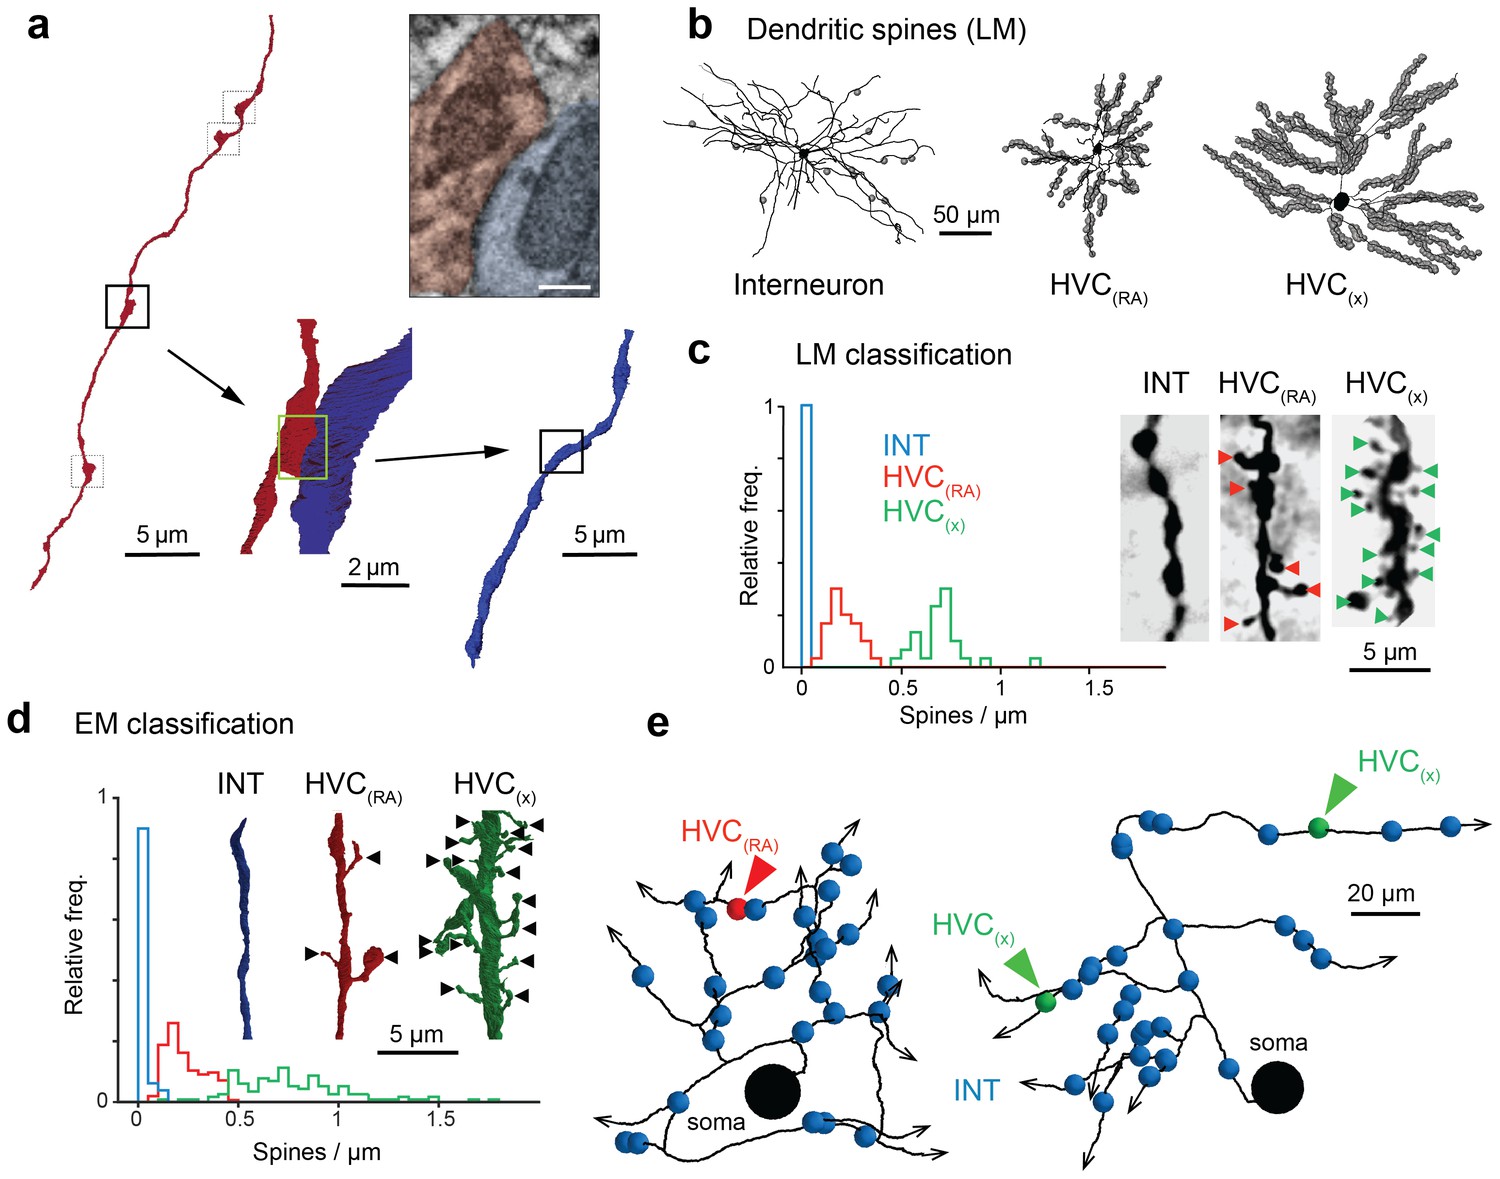
Classification of postsynaptic targets.
(a) A BDA-labeled axon with four synaptic boutons (boxes). One bouton and its postsynaptic structure labeled in red and blue, respectively: In cross section (top right) and as a surface reconstruction (bottom center). (b) Dendrites from an inhibitory interneuron, an HVC(RA) neuron, and an HVC(X) neuron (left to right) in LM. Spine locations are indicated by grey spheres. (c,d) Spine densities for each of these neuron classes from LM (c) and EM (d) reconstructions. Insets show examples with spines indicated by arrowheads. (e) SBEM-based reconstructions of two HVC(RA) somata with their proximal axons. Blue, green, and red spheres mark the location of synapses with inhibitory interneurons, HVC(RA) neurons, and HVC(X) neurons, respectively. Scale bar is 0.25 µm in a.
Figure 2—figure supplement 1
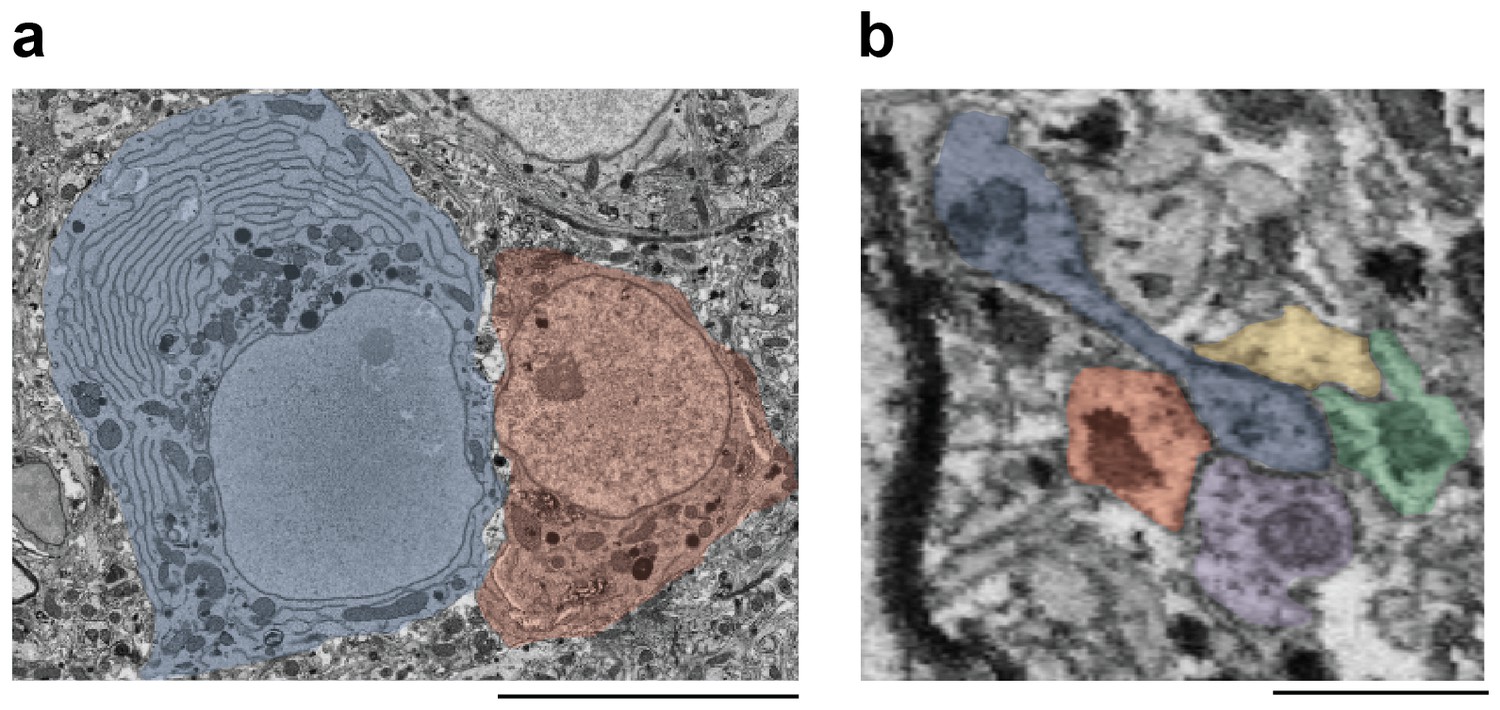
Morphological markers of interneurons.
(a) Ultrastructural and morphological differences of the somata of an HVC interneuron (left, blue shade) and an HVC(RA) neuron (right, red shade). Compared with HVC(RA) neurons, interneurons had large amounts of endoplasmatic reticulum (ER), many mitochondria, and a large cell body. Scale bar: 7.5 µm. (b) An electron micrograph (cut plane rotated to show spine attached to dendrite) showing a polysynaptic protrusion (blue label) that receives four synapses at its tip, that was previously misclassified as a dendritic spine of an excitatory cell. The four presynaptic axons are colored in yellow, green, purple and red. Scale bar: 1 µm.
Figure 3 with 3 supplements
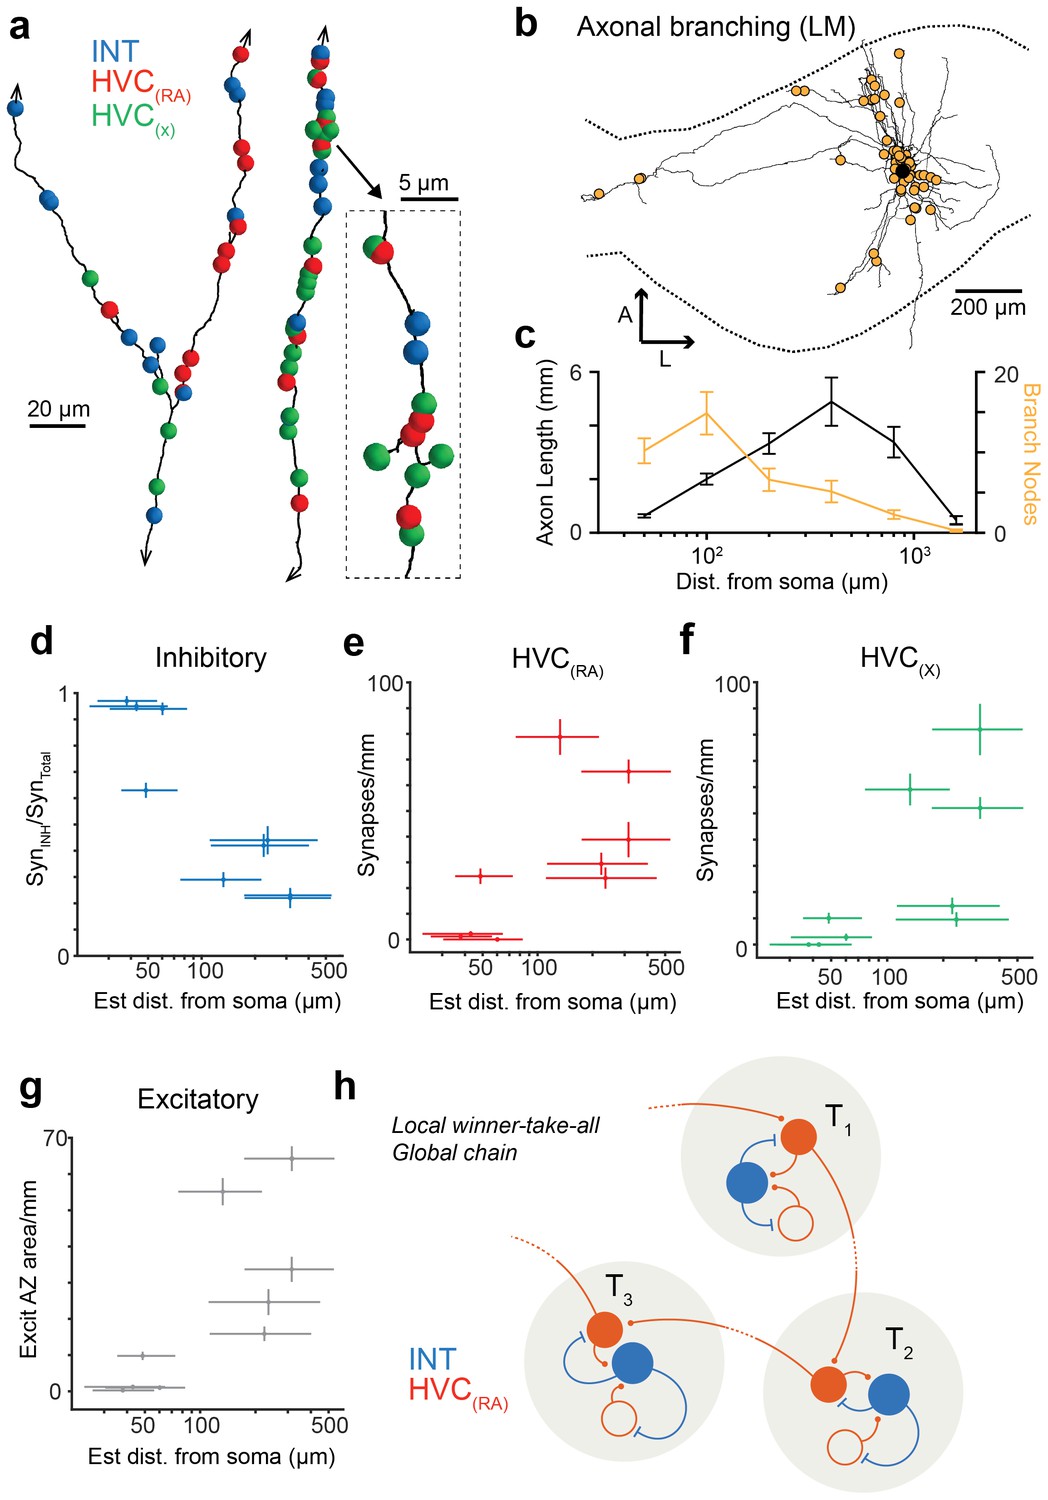
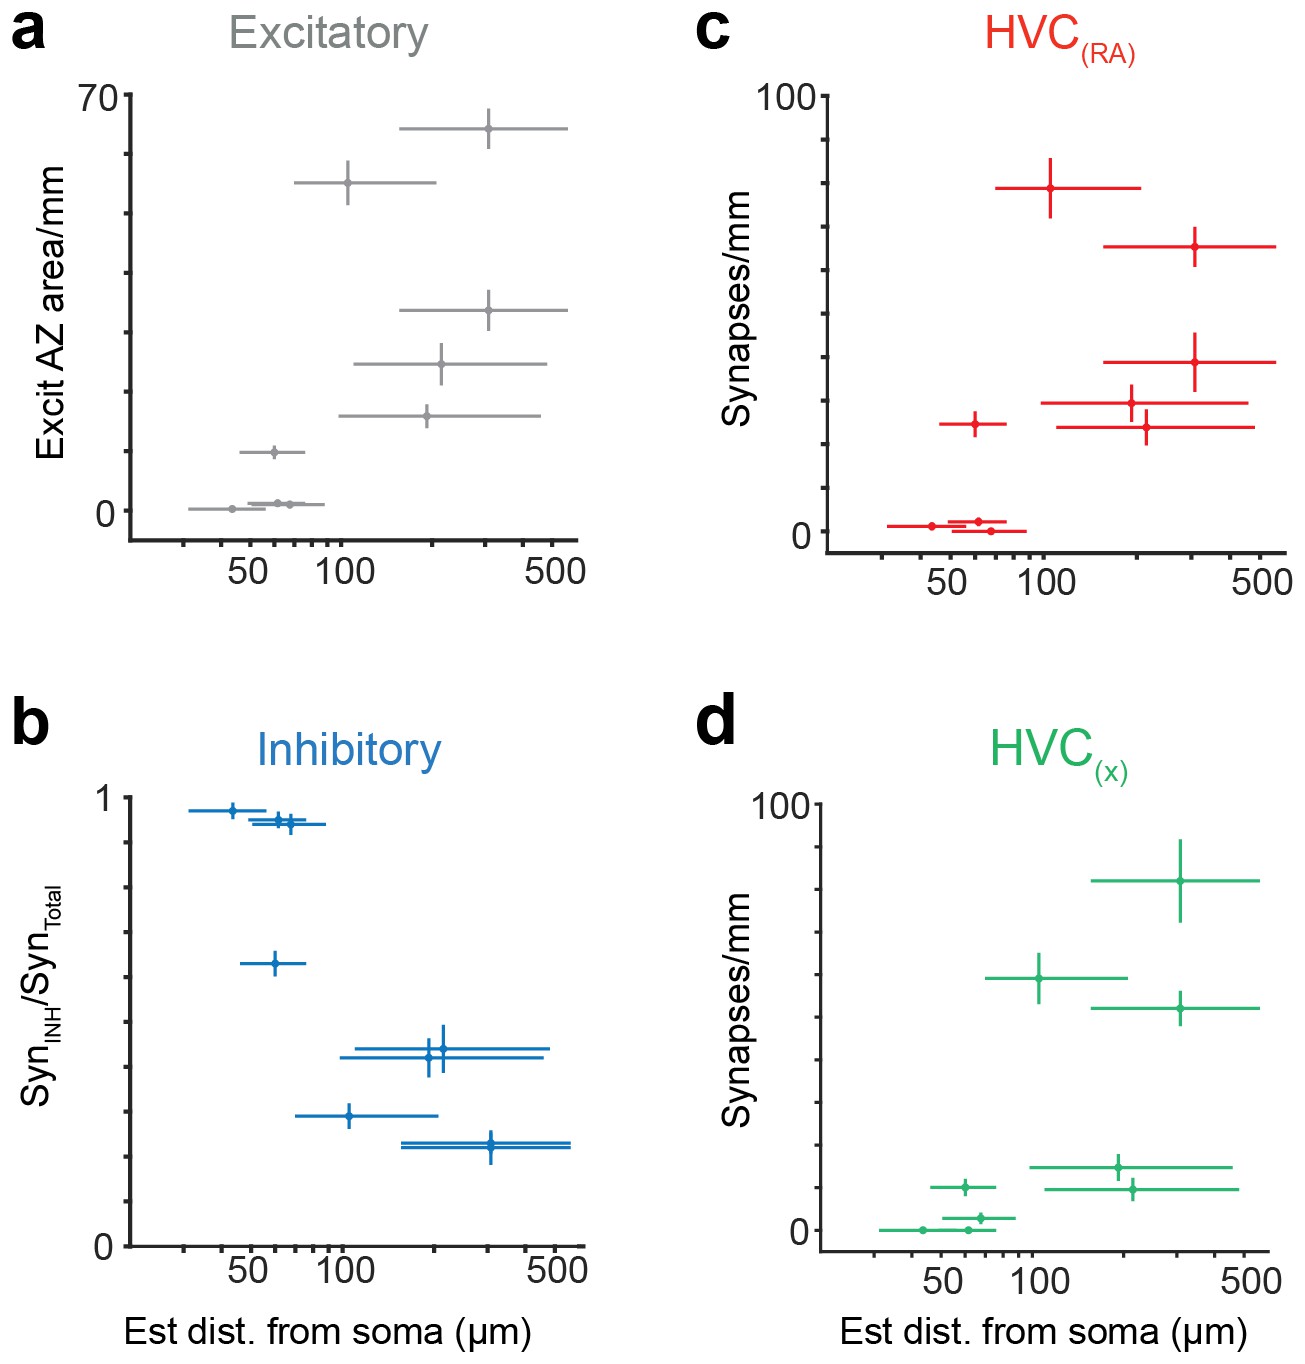
Spatial variation of postsynaptic cell type.
(a) SBEM-based reconstructions and synaptic targets for two orphaned axon segments. Colored spheres mark the locations and types of synapses. (b) Axon collaterals (LM-based reconstruction) of an HVC(RA) neuron with branch nodes (gold circles), the soma (black circle), and the HVC border (dashed lines). (c) Mean axon length (black) and branch node densities (gold) vs. soma distance (n = 15 cells). (d) The ratio of synapses onto inhibitory interneurons vs. estimated distance from the soma (p<0.005, Pearson's correlation). (e,f) The density of synapses onto HVC(RA) (e) and HVC(X) (f) vs. estimated distance from soma (p<0.002, Pearson's correlation, combining HVC(RA) and HVC(X) values). (g) Total synaptic size (summated active zone area, µm2/mm) onto excitatory neurons vs. estimated distance of the presynaptic axon from the soma (p<0.05, Pearson's correlation). Vertical error bars: SEM of the Poisson-distribution means estimated from the number of synapses on each axon segment (e–g) or the SEM of an assumed underlying binomial count distribution (d). Horizontal error bars from quantiles 0.16 to 0.84 of the distance distribution based on the nearest neighbor sampling approach (see Materials and methods). (h) Proposed circuit architecture. HVC(RA) neurons (red) target inhibitory interneurons (blue) proximally and other HVC(RA) neurons distally.
Figure 3—figure supplement 1
Synaptic properties of HVC(RA) axons, using a Bayesian approach to estimate distance from soma.
(a) Total synaptic strength (summated active zone area/pathlength) onto excitatory neurons vs. estimated distance of the presynaptic axon from the soma (p<0.05, Pearson's correlation). (b) The ratio of synapses onto inhibitory interneurons vs. estimated distance from soma (p<0.01, Pearson's correlation). (c,d) The density of synapses onto HVC(RA) (c) and HVC(X) (d) vs. estimated distance from soma (p<0.002, Pearson's correlation, combining HVC(RA) and HVC(X) values). Vertical bars represent the SEM of an assumed underlying Poisson distributed synapse counting process (a,c,d) or (b) the SEM of an assumed underlying Binomial count distribution. (a–d) Horizontal error bars correspond to a 0.16 and 0.84 quantile of the Bayesian posterior distribution, see Materials and methods.
Figure 3—figure supplement 2
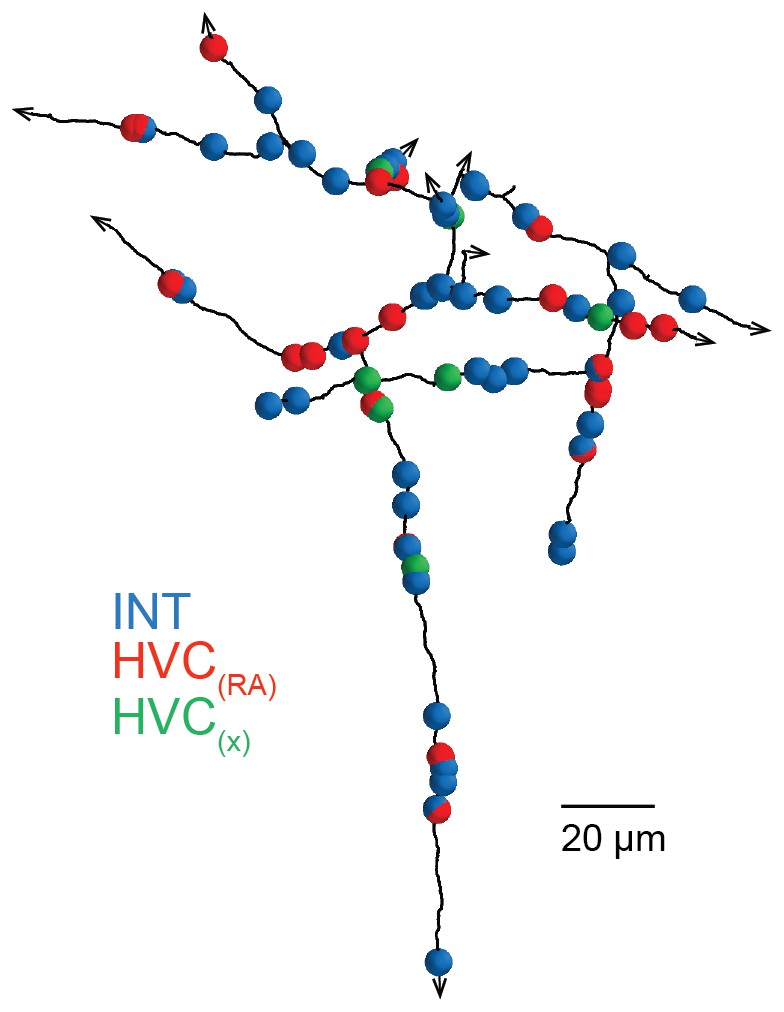
A SBEM-based reconstruction and synaptic targets for an orphaned axon with high branch density.
Small spheres mark the location of synapses, with the color indicating the target type. Note the higher frequency of inhibitory targets (blue) along the length of the reconstruction compared with other orphaned axons with low branch density (see Figure 3a).
Figure 3—figure supplement 3
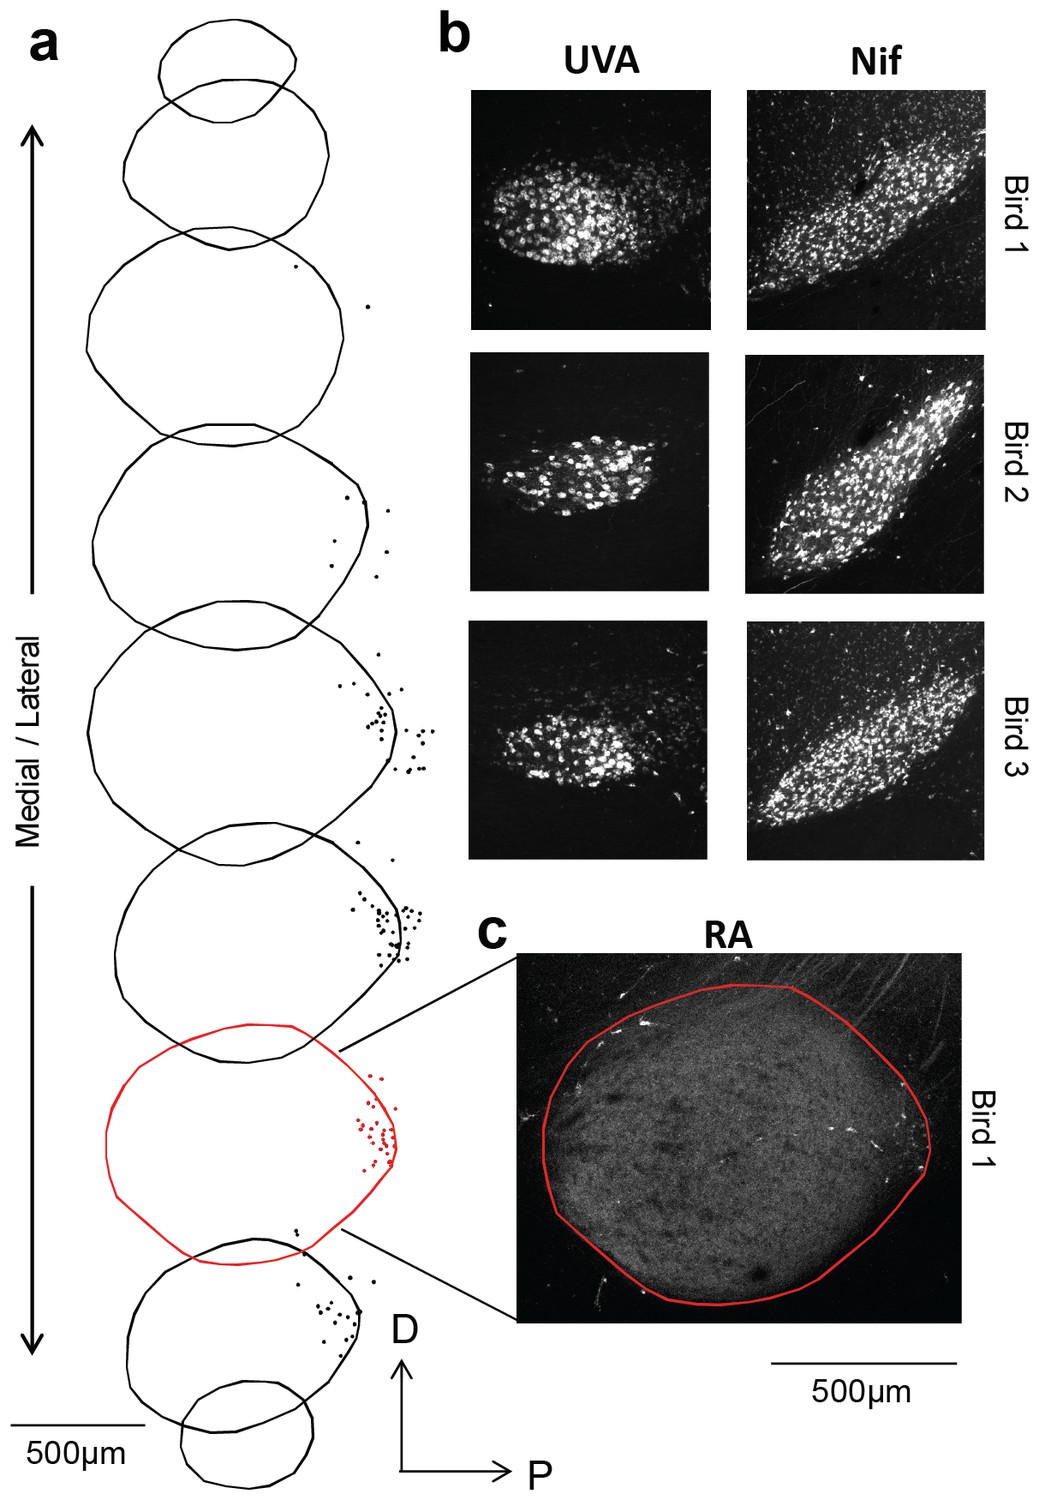
A small population of RA neurons project to HVC.
(a) The borders of RA were traced across nine sequential 100 µm thick sagittal sections, and the location of each retrogradely labeled HVC-projecting RA neuron is marked with a dot. (b) DiI injection in HVC resulted in robust retrograde labeling of upstream motor nuclei Uva and NIf, while only a small percentage (<1%) of cells in RA were labeled (a,c). An example confocal image of RA is shown in (c), revealing a sparse population of retrogradely labeled neurons in the posterior region of the nucleus.
Videos
Video 1
Video shifting through a z-stack of a sagittal section within HVC, containing a Neurobiotin-filled HVC(RA) neuron stained with DAB.
Number of z-sections shown is 144. Voxel size is 92 × 92 × 500 nm.
Video 2
Video of a subregion of the acquired SBEM dataset, showing the original data resolution (lossy compression).
Number of z-sections shown is 100, translating to 2.9 µm.
Video 3
Video of a subregion of the acquired SBEM dataset, showing a larger field of view with a BDA-labeled HVC(RA) soma (lossy compression).
Number of z-sections shown is 200, translating to 5.8 µm.
Video 4
Video of a z-stack of 18 consecutive images (100 × 100 pixels) showing a symmetric synapse.
Voxel dimensions: 11 × 11 × 29.
Video 5
Video of a z-stack of 18 consecutive images (100 × 100 pixels) showing an asymmetric synapse.
Voxel dimensions: 11 × 11 × 29.
Download links
A two-part list of links to download the article, or parts of the article, in various formats.
Downloads (link to download the article as PDF)
Open citations (links to open the citations from this article in various online reference manager services)
Cite this article (links to download the citations from this article in formats compatible with various reference manager tools)
EM connectomics reveals axonal target variation in a sequence-generating network
eLife 6:e24364.
https://doi.org/10.7554/eLife.24364


