Reciprocal synapses between mushroom body and dopamine neurons form a positive feedback loop required for learning
- The Scripps Research Institute Florida, United States
Figures
Figure 1 with 1 supplement

KC and DAn PPL1 neurons form axoaxonic reciprocal synapses.
(A) Diagram of 15 discrete compartments that divide the MB lobes according to the DAn pre- and MBOn postsynaptic innervation pattern. (B) Co-labeling of the MB lobes using R13F02-gal4 to drive uas-tdtomato expression and TH-lexA to drive lexAop-CD8::GFP expression. Lobe areas that remain primarily green receive less or no innervation from the PPL1 cluster of DAn compared to those that are white. (C) Diagram of trans-synaptic fluorescence reconstitution. Synaptic syb::spGFP1-10 is expressed in the presynaptic neuron along with spGFP11 in the putative postsynaptic counterpart. GFP reconstitution occurs only if synaptic connectivity exists. (D) GFP reconstitution when syb::spGFP1-10 is expressed in DAn. (E) GFP reconstitution when syb::spGFP1-10 is expressed in KC.
Figure 1—figure supplement 1

No GFP signal was observed after staining brains that expressed only half of the GRASP system.
(A) No detectable GFP signal was observed when spGFP11 was expressed with R13F02-lexA. (B) No detectable GFP signal was observed when only syb::spGFP1-10 was expressed with TH-gal4. (C) Reconstitution of GFP was observed when spGFP was expressed in KC with R13F02-gal4 and syb::spGFP1-10 in DAn with TH-gal4 driver. The three images shown were obtained using the same image acquisition parameters.
Figure 2 with 3 supplements
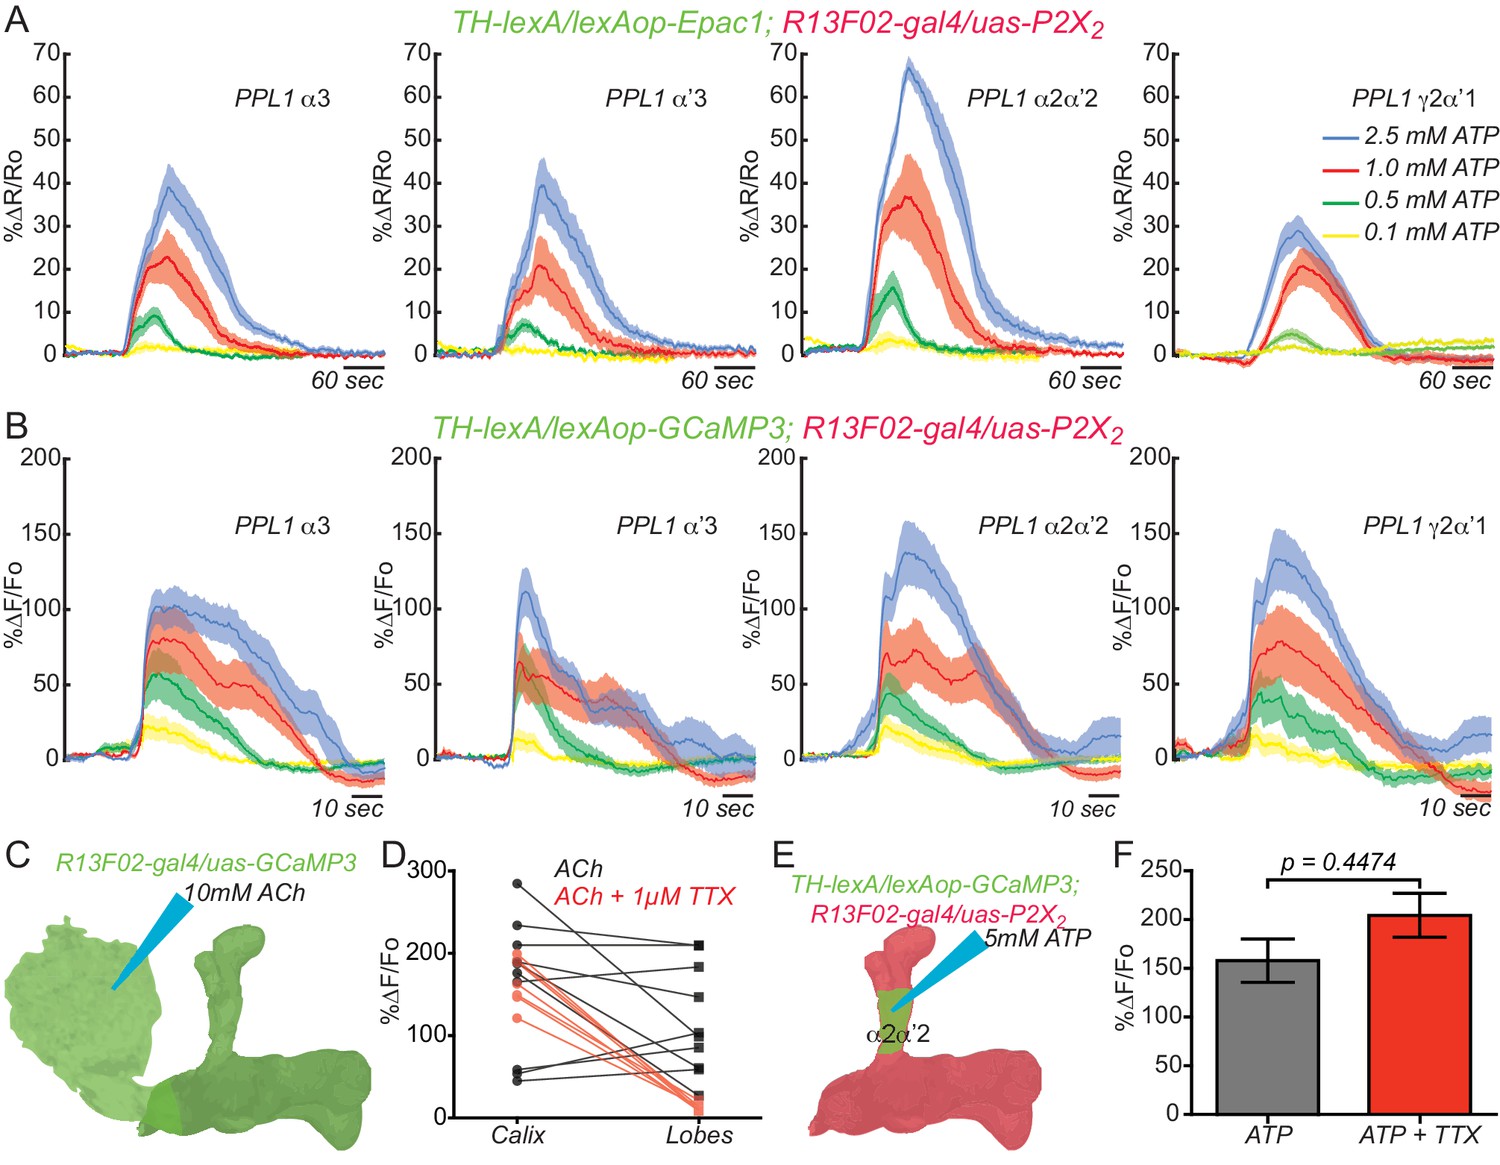
KC and DAn PPL1 neurons axoaxonic reciprocal synapses are functional.
(A) Cyclic AMP responses in DAn (α3, α’3, α2α’2 and γ2α’1) to artificial stimulation of KC using ATP/P2X2 system. The solid line of each trace represents the mean and shaded area represents ± SEM at various concentrations of ATP used in the experiment. Cyclic AMP accumulation was observed in the axons of the DAn that innervate all of the MB lobe compartments that were recorded. N = 9–14. (B) Calcium responses in DAn (α3, α’3, α2α’2 and γ2α’1) to artificial stimulation of KC using ATP/P2X2 system. The solid line of each trace represents mean and shaded area represents ± SEM. Calcium responses were observed in the axons of the DAn that innervate all of the MB lobe compartments that were recorded. N = 12–16. (C) Diagram of the experimental setup. A micropipette was used to focally apply ACh to the calyx of the MB while imaging in both the calyx and MB lobes. (D) Calcium responses in both calyx and lobes of the KC to ACh application in the presence (red) or absence (black) of 1 µM TTX. TTX blocked the responses in the lobes but not the calyx, indicating that TTX was functional in blocking action potentials. N = 7–10. (E) Diagram of the experimental setup. A micropipette was used to focally apply 5 mM ATP to the α2α2’ compartment of MB while recording calcium responses in α2α’2 DAn. (F) Calcium responses in α2α’2 DAn in the presence (red) or absence (gray) of 1 µM TTX. TTX was without significant effect, indicating that the artificial activation of KC fibers were capable of evoking responses in DAn axon terminals through local, mono-synaptic transmission. N = 9–11. Data were analyzed using Mann-Whitney U non-parametric test. Bars represent the means ± SEM.
Figure 2—figure supplement 1
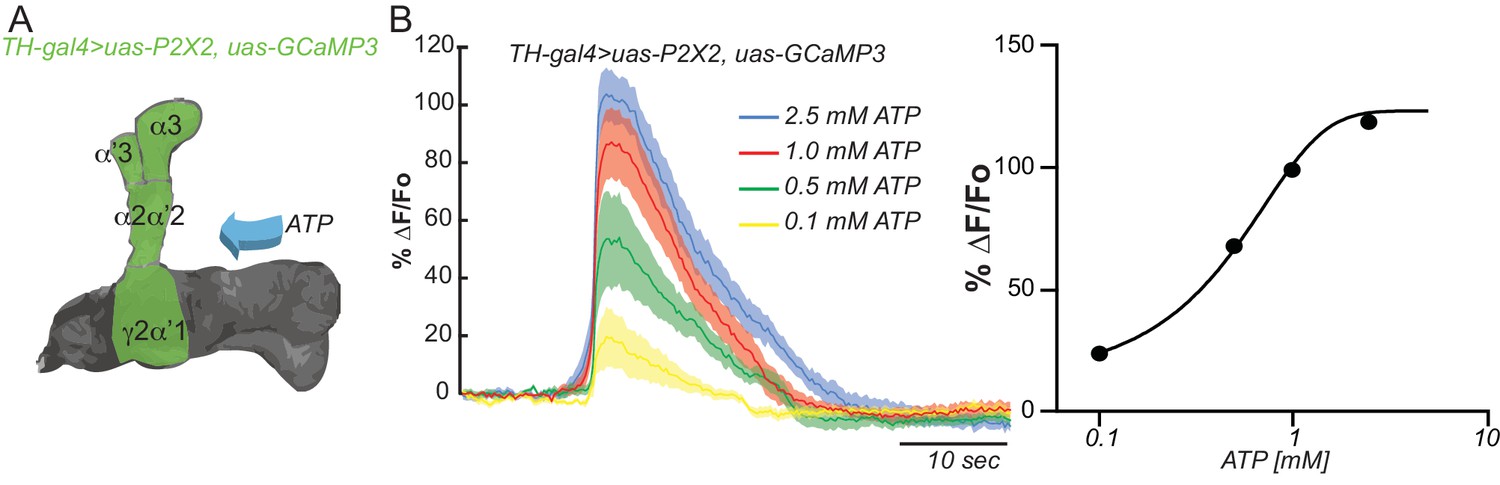
Testing the efficacy of the ATP/P2X2 system.
(A) Diagram of the experimental setup. Flies co-expressing the P2X2 channel and GCaMP3 in DAn using TH-gal4 were stimulated by bath application of increasing concentrations of ATP. (B) Calcium responses obtained by stimulation with different concentrations of ATP and measured in all compartments shaded green in panel A. N = 12. The solid lines represent the means and the shaded area represents ± SEM.
Figure 2—figure supplement 2
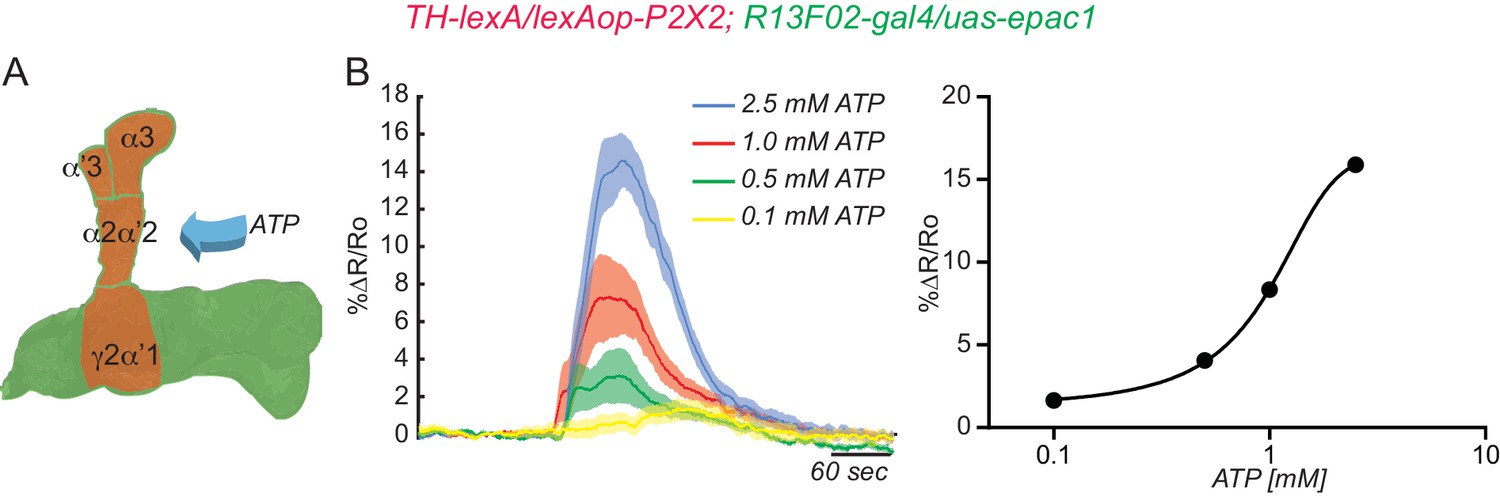
DAn are presynaptic to KC.
(A) Diagram of experiment setup. DAn were stimulated with increasing concentrations of ATP while recording cAMP responses in KC. (B) Cyclic AMP dose-response curve after artificial stimulation of DAn using the ATP/P2X2 system. N = 8. The solid lines represent the means and shaded areas represent ± SEM. Responses were recorded in all compartments shaded red in panel A.
Figure 2—figure supplement 3
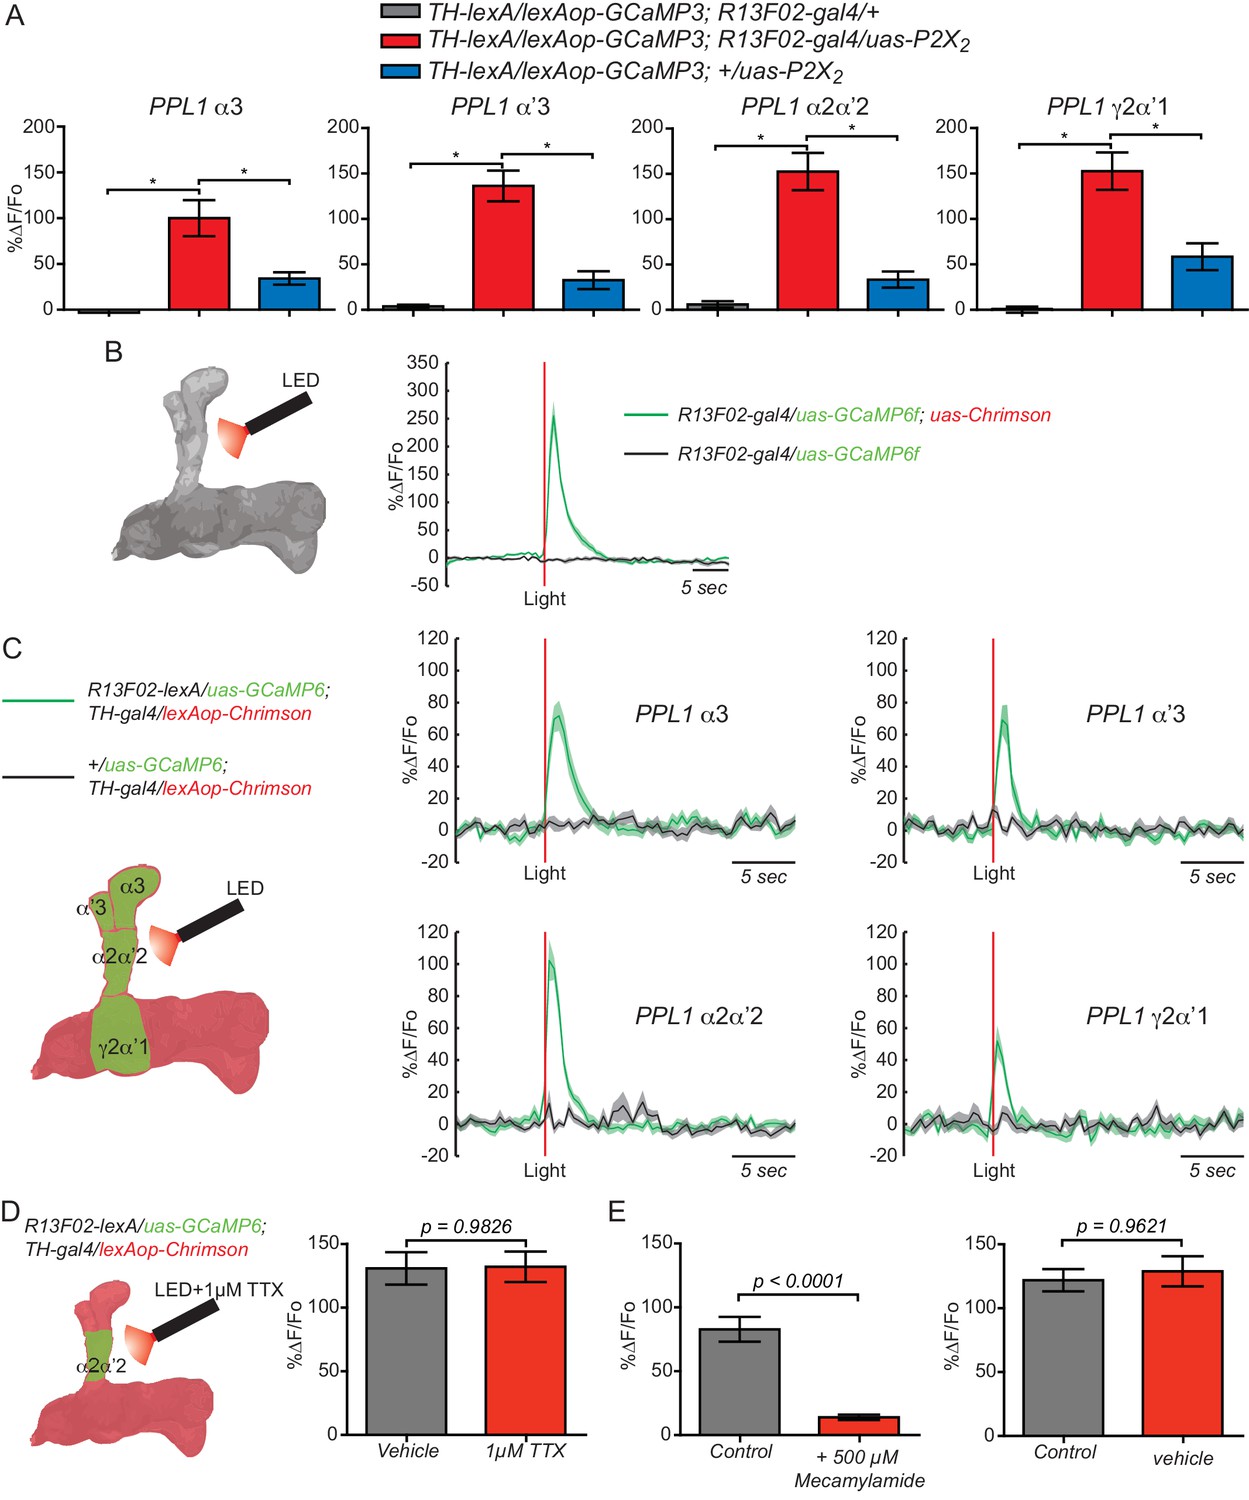
KC and PPL1 DAn axoaxonic reciprocal synapses are functional.
(A) Calcium responses in DAn (α3, α’3, α2α’2 and γ2α’1) to artificial stimulation of KC using the ATP/P2X2 system along with genetic controls. The uas-alone control (blue bars) showed significant responses to P2X2 stimulation, suggesting leaky expression of the channel. Bars represent the mean ± SEM at 2.5 mM ATP. Calcium responses were observed in the axons of the DAn that innervate all MB lobe compartments that were recorded. N = 7–12. Data were analyzed using Kruskal-Wallis one-way ANOVA and Dunn’s multiple comparison test. Bars represent the means ± SEM. (B) Testing the efficacy of the light/Chrimson system. Left panel shows a diagram of the experimental setup. Flies co-expressing the Chrimson channel and GCaMP6f in KC using R13F02-gal4 were stimulated by red light and calcium responses recorded. N = 12. The solid lines represent the means with the shaded area ± SEM. (C) Calcium responses in DAn (α3, α’3, α2α’2 and γ2α’1) to artificial stimulation of KC using the light/Chrimson system. The solid line of each trace represents the mean and shaded area represents ± SEM. Calcium responses were observed in the axons of the DAn that innervate all MB lobe compartments that were recorded. N = 6–9. (D) Calcium responses in α2α’2 DAn in the presence (red) or absence (gray) of 1 µM TTX. TTX was without significant effect, indicating that the artificial activation of KC fibers were capable of evoking responses in DAn axon terminals through local, monosynaptic transmission. N = 14. Data were analyzed using a Mann-Whitney U non-parametric test. Bars represent the means ± SEM. (E) Connections between KC and DAn are cholinergic. Calcium responses in α2α’2 DAn to stimulation of KC using the light/Chrimson system were strongly inhibited in presence of nAChR antagonist mecamylamide (500 µM) (left). Vehicle was without effect (right). N = 16–18. Data were analyzed using a Mann-Whitney U non-parametric test. Bars represent the means for calcium response ± SEM.
Figure 3 with 1 supplement
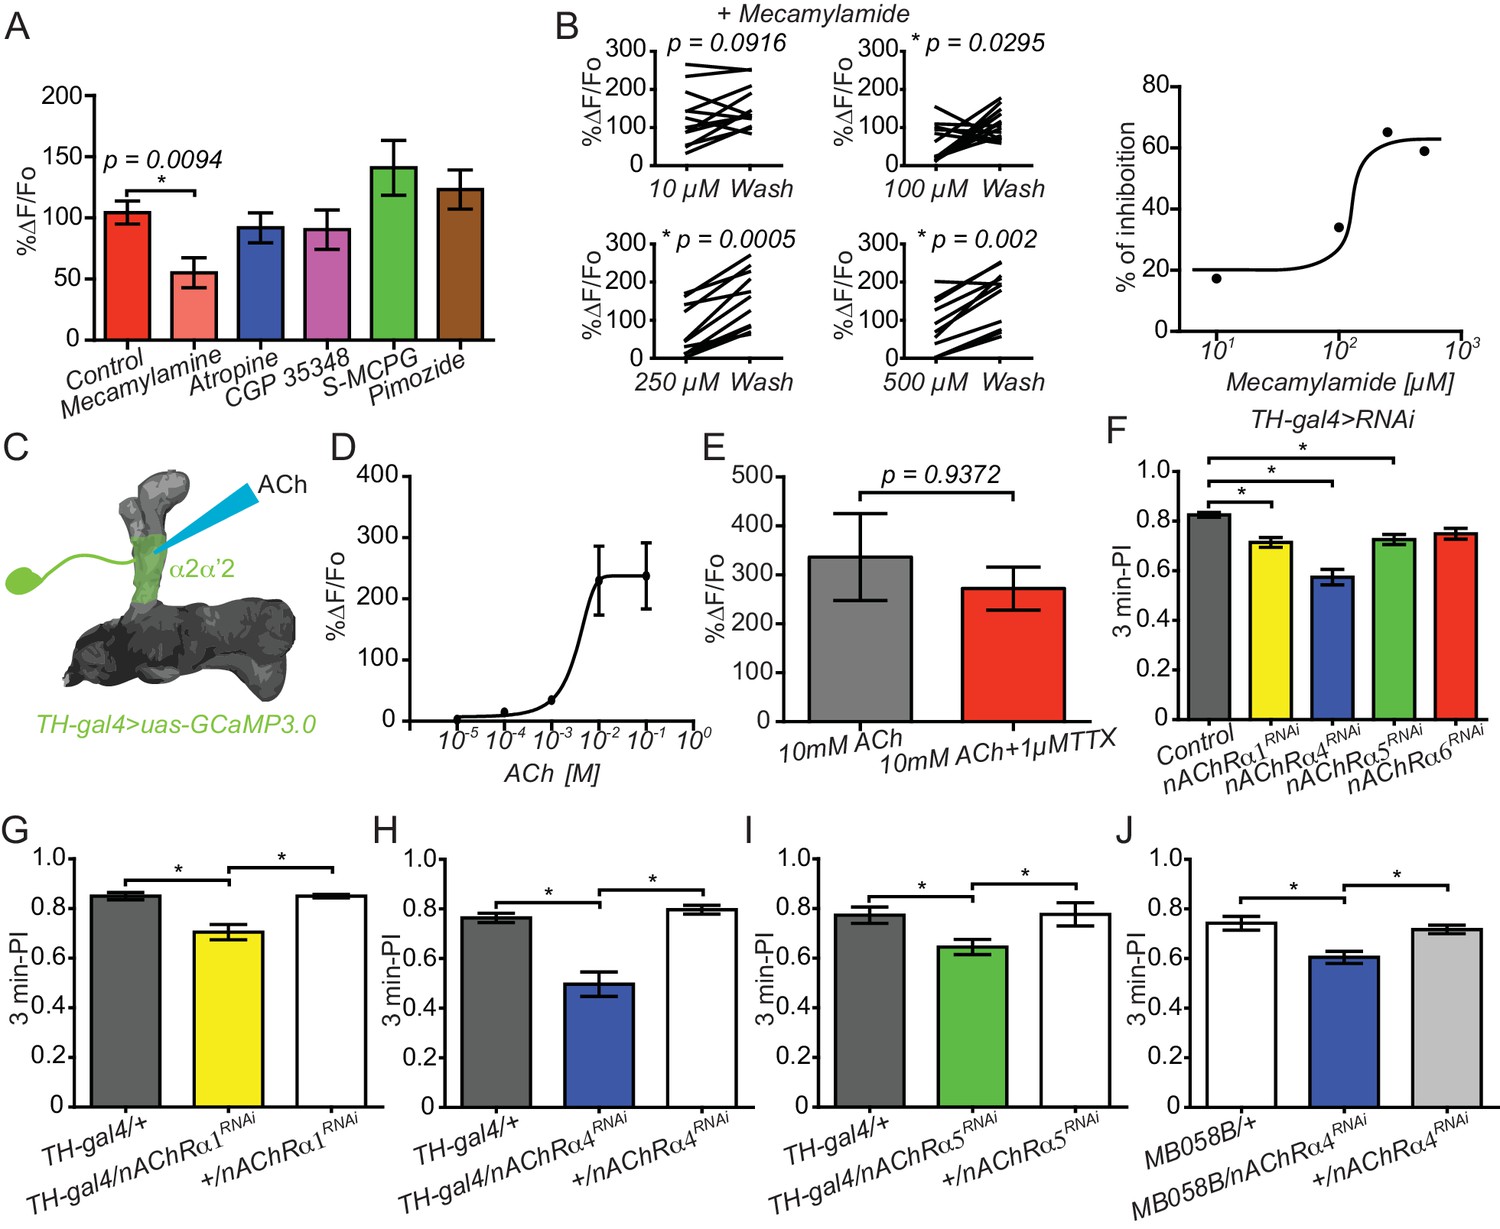
Connections between KC and DAn are cholinergic.
(A) Calcium responses in α2α’2 DAn to stimulation of KC using the ATP/P2X2 system in presence of inhibitors to nACh receptors (100 µM mecamylamide), mACh receptors (atropine), GABA receptors (CGP 35348), mGlu receptors (S-MCPG) and dopamine/serotonin receptors (pimozide). N = 10–16. Data were analyzed with Kruskal-Wallis one-way ANOVA and Dunn’s multiple comparison test. Bars represent the means for calcium response ± SEM. (B) Dose-response plots to increasing concentrations of mecamylamide comparing the responses in the presence of the inhibitor to a second response recorded after a ten-minute washout. N = 10–16. (C) Diagram of the experiment setup. A micropipette was used to focally apply ACh to α2α’2 DAn axonal terminals while recording calcium responses. (D) Calcium dose-response curve in α2α’2 DAn terminals to focal application of increasing concentrations of ACh. N = 6. Error bars represent SEM. (E) Calcium responses to focal application of 10 mM ACh to α2α’2 DAn axons in the presence (red) or absence (black) of 1 µM TTX. N = 6. Data were analyzed using Mann-Whitney U non-parametric test. Bars represent the mean ± SEM. (F) Three-minute aversive olfactory memory of flies expressing RNAi transgenes to different nAChRα subunits in DAn using TH-gal4. N = 12. Data were analyzed with Kruskal-Wallis one-way ANOVA and Dunn’s multiple comparison test. *p<0.05. Bars represent the mean ± SEM. (G) Three-minute aversive olfactory memory of flies expressing an RNAi transgene to nAChRα1 RNAi compared to the parental controls, TH-gal4/+ and nAChRα1RNAi/+. N = 6. Data were analyzed with Kruskal-Wallis one-way ANOVA and Dunn’s multiple comparison test. Bars represent the mean ± SEM. p<0.05. (H) Three-minute aversive olfactory memory of flies expressing an RNAi transgene to nAChRα4 compared to the parental controls, TH-gal4/+ and nAChRα4RNAi/+. N = 6. Data were analyzed with Kruskal-Wallis one-way ANOVA and Dunn’s multiple comparison test. Bars represent the mean ± SEM. p<0.05. (I) Three-minute aversive olfactory memory of flies expressing an RNAi transgene to nAChRα5 compared to the parental controls, TH-gal4/+ and nAChRα5RNAi/+. N = 6. Data were analyzed with Kruskal-Wallis one-way ANOVA and Dunn’s multiple comparison test. Bars represent the mean ± SEM. p<0.05. (J) Three-minute aversive olfactory memory of flies expressing an RNAi transgene to nAChRα4 in α2α’2 PPL1 neurons compared to the parental controls, MB058B-split-gal4/+ and nAChRα4RNAi/+. N = 6. Data were analyzed with Kruskal-Wallis one-way ANOVA and Dunn’s multiple comparison test. Bars represent the mean ± SEM. p<0.05.
Figure 3—figure supplement 1
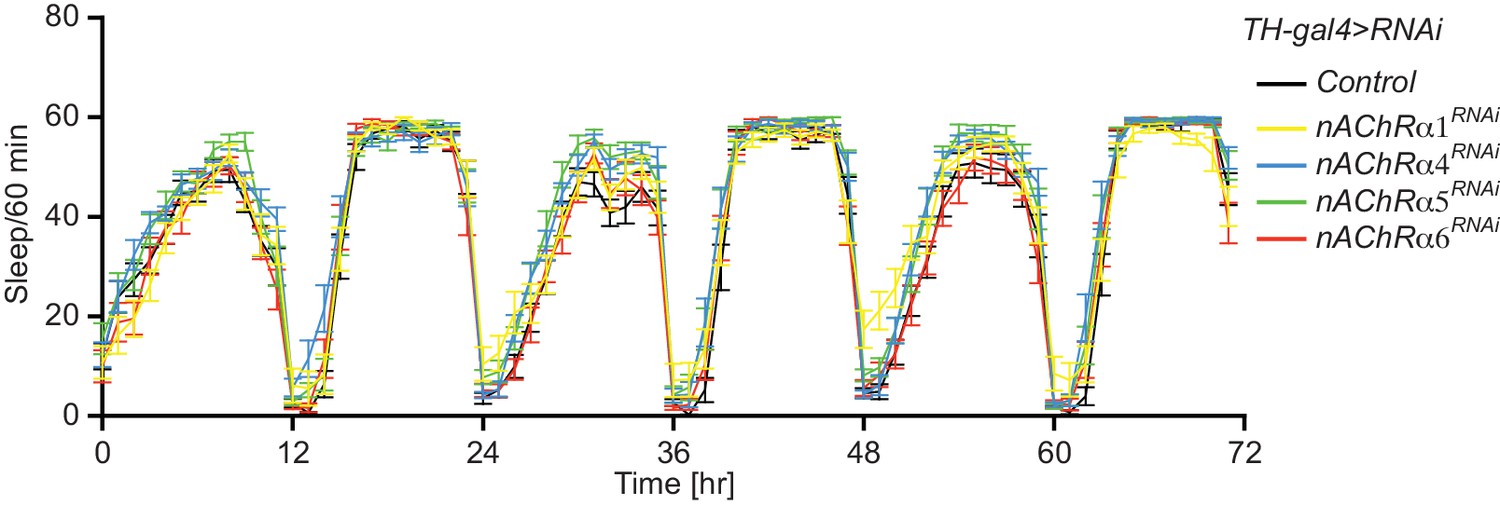
Knockdown of nAChR subunits using RNAi in DAn does not alter sleep patterns.
Sleep was monitored across three days. N = 24. Bars represent the mean ± SEM.
Figure 4
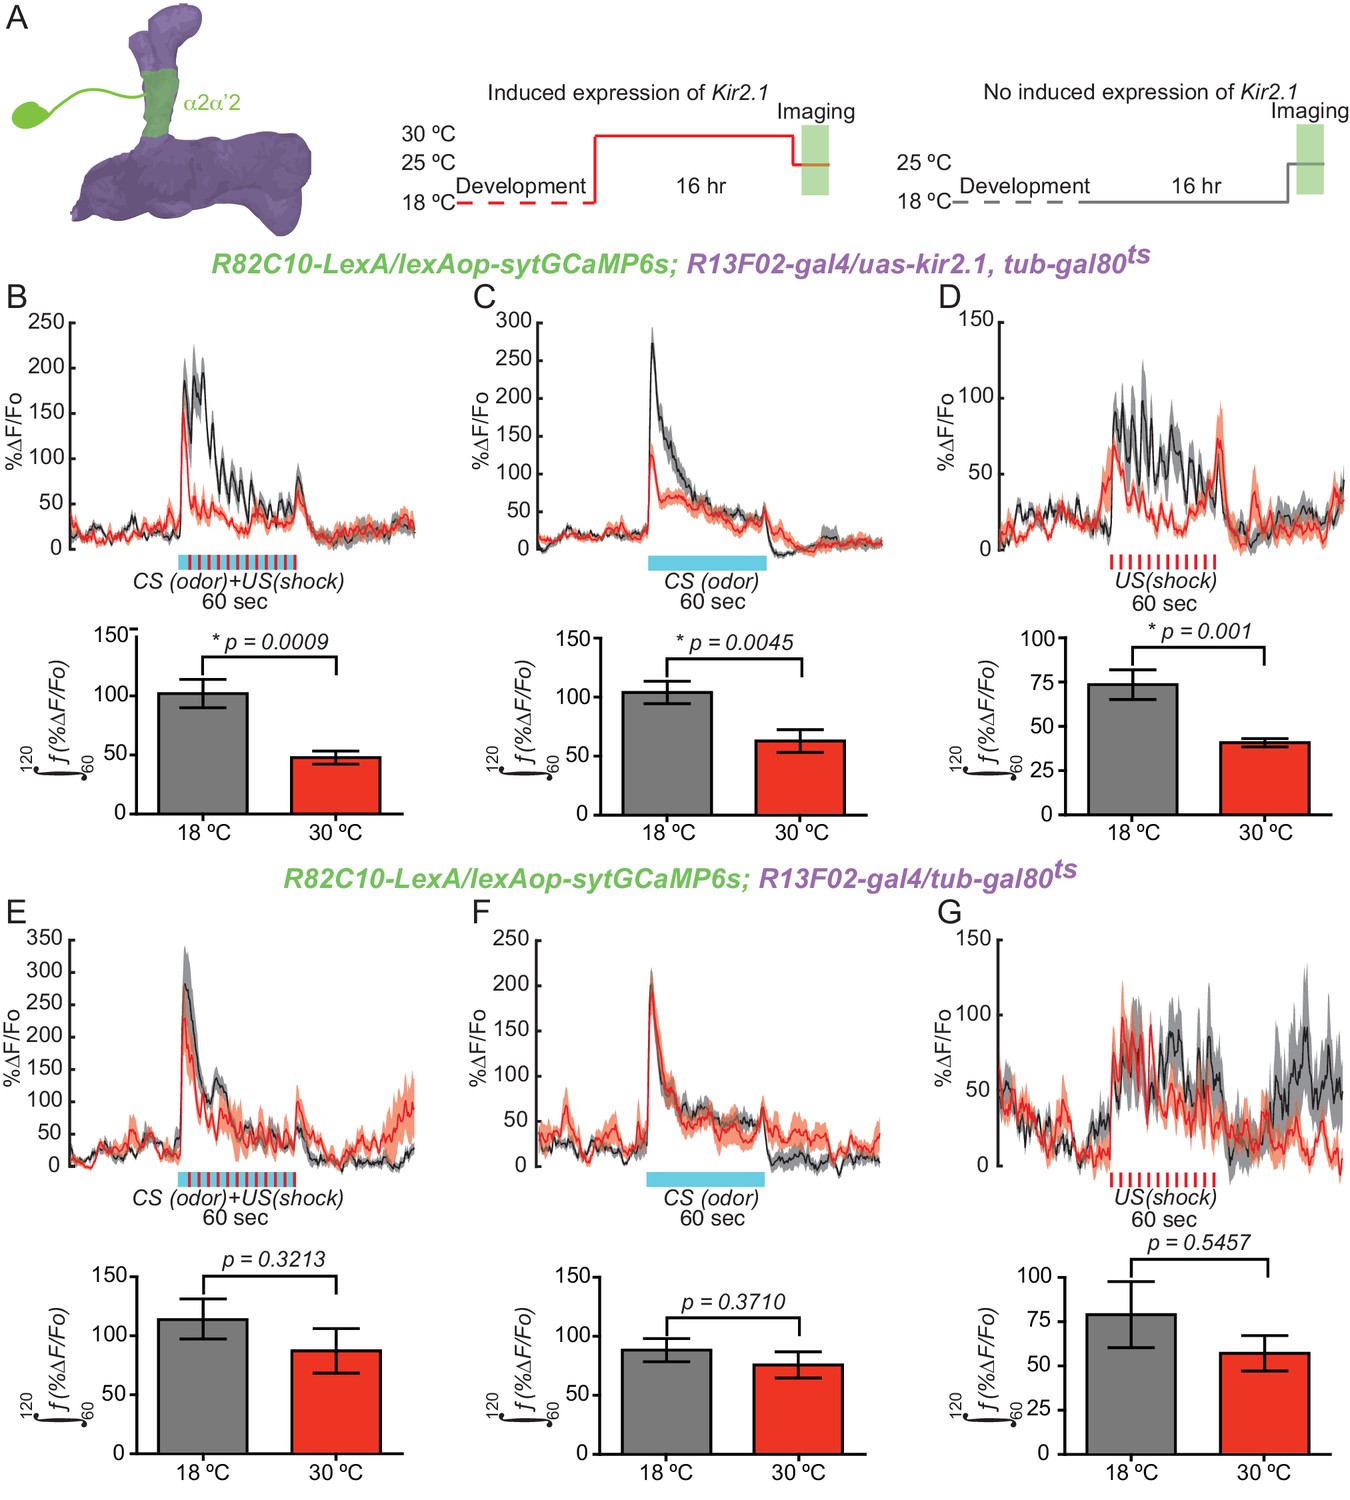
KC input is required for normal DAn synaptic release during learning.
(A) Diagram of the experimental setup. Flies of the indicated genotype were reared at 18°C and then 1–2 day old adults were switched to 30°C to induce kir2.1 channel expression in KC for 16 hr. Flies were then returned to room temperature and prepared for functional imaging. Control flies remained at 18°C until removing them to room temperature for functional imaging. (B) Calcium responses in α2α’2 DAn during aversive olfactory training (odor+shock) in flies with (red) or without (black) kir2.1 expression in KC. N = 10–12. The solid line represents the mean and the shaded area represents ± SEM. Data were analyzed using Mann-Whitney U non-parametric test. Bars represent the mean ± SEM of the area under the curve during the one minute of conditioning (the 60–120 s imaging time window). (C) Calcium responses in α2α’2 DAn during odor delivery in flies with (red) or without (black) kir2.1 expression in KC. N = 13–14. The solid line represents the mean and the shaded area represents ± SEM. Data were analyzed using Mann-Whitney U non-parametric test. Bars represent the mean ± SEM of the area under the curve during the one minute of odor presentation (the 60–120 s imaging time windows). (D) Calcium responses in α2α’2 DAn during 12 shock pulses delivery in flies with (red) or without (black) kir2.1 expression in KC. N = 14. The solid line represents the mean and the shaded area represents ± SEM. Data were analyzed using Mann-Whitney U non-parametric test. Bars represent the mean ± SEM of the area under the curve during the one minute of shock pulses (the 60–120 s imaging time window) (E–G) Parallel data to panels B–D but using flies without the kir2.1 transgene. These control data show that the differential responses observed in panels B–D require the kir2.1 expression.
Figure 5
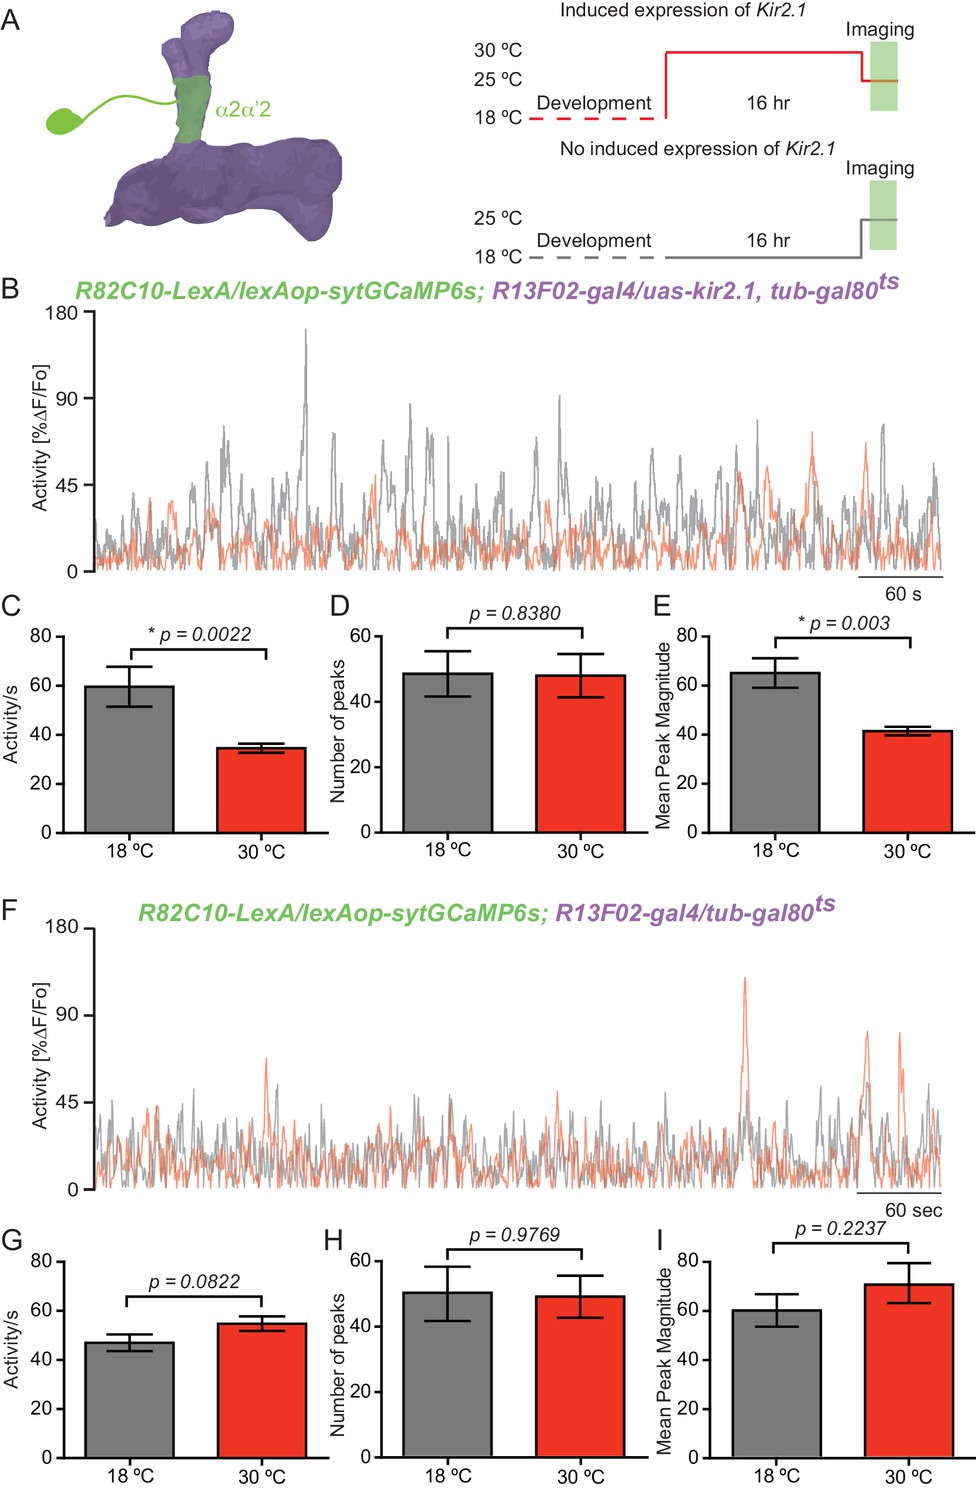
KC input shapes DAn ongoing activity.
(A) Diagram of the experimental setup. Flies of the indicated genotype were reared at 18°C and 1–2 day old adults were then switched to 30°C to induce kir2.1 channel expression in KC for 16 hr. The flies were then returned to room temperature and prepared for functional imaging. Control flies remained at 18°C until removing them to room temperature for functional imaging. (B) Representative 10 min recording of calcium ongoing activity in α2α’2 DA axon terminals in flies with (red) or without (black) kir2.1 expression in the KC. (C) Mean of total activity per sec during 10 min of recording of ongoing activity in α2α’2 DAn axon terminals in flies with (red) or without (black) kir2.1 expression in the KC. N = 10–12. Data were analyzed using Mann-Whitney U non-parametric test. Bars represent the mean ± SEM. (D) Mean number of peaks of the same 10 min recordings of ongoing activity in α2α’2 DAn axon terminals in flies with (red) or without (black) kir2.1 expression in the KC. Data were analyzed using Mann-Whitney U non-parametric test. Bars represent the mean ± SEM. (E) Mean peak magnitude of ongoing activity in α2α’2 DAn in flies with (red) or without (black) kir2.1 expression in the KC. Data were analyzed using Mann-Whitney U non-parametric test. Bars represent the mean ± SEM. (F–I) Parallel data to panels B–E but using flies without the kir2.1 transgene. These control data show that the decrease in total activity and mean peak magnitude observed in panels B and E require the kir2.1 expression. N = 11–13. Data were analyzed using Mann-Whitney U non-parametric test.
Videos
Video 1
A three-dimensional structured illumination image of the α2α’2 MB lobe compartment showing pre-synaptic KC puncta with post-synaptic DAn specializations on their axons.
https://doi.org/10.7554/eLife.23789.004Download links
A two-part list of links to download the article, or parts of the article, in various formats.
Downloads (link to download the article as PDF)
Open citations (links to open the citations from this article in various online reference manager services)
Cite this article (links to download the citations from this article in formats compatible with various reference manager tools)
Reciprocal synapses between mushroom body and dopamine neurons form a positive feedback loop required for learning
eLife 6:e23789.
https://doi.org/10.7554/eLife.23789


