Cooperation between a hierarchical set of recruitment sites targets the X chromosome for dosage compensation
- New York University, United States
Figures
Figure 1 with 2 supplements
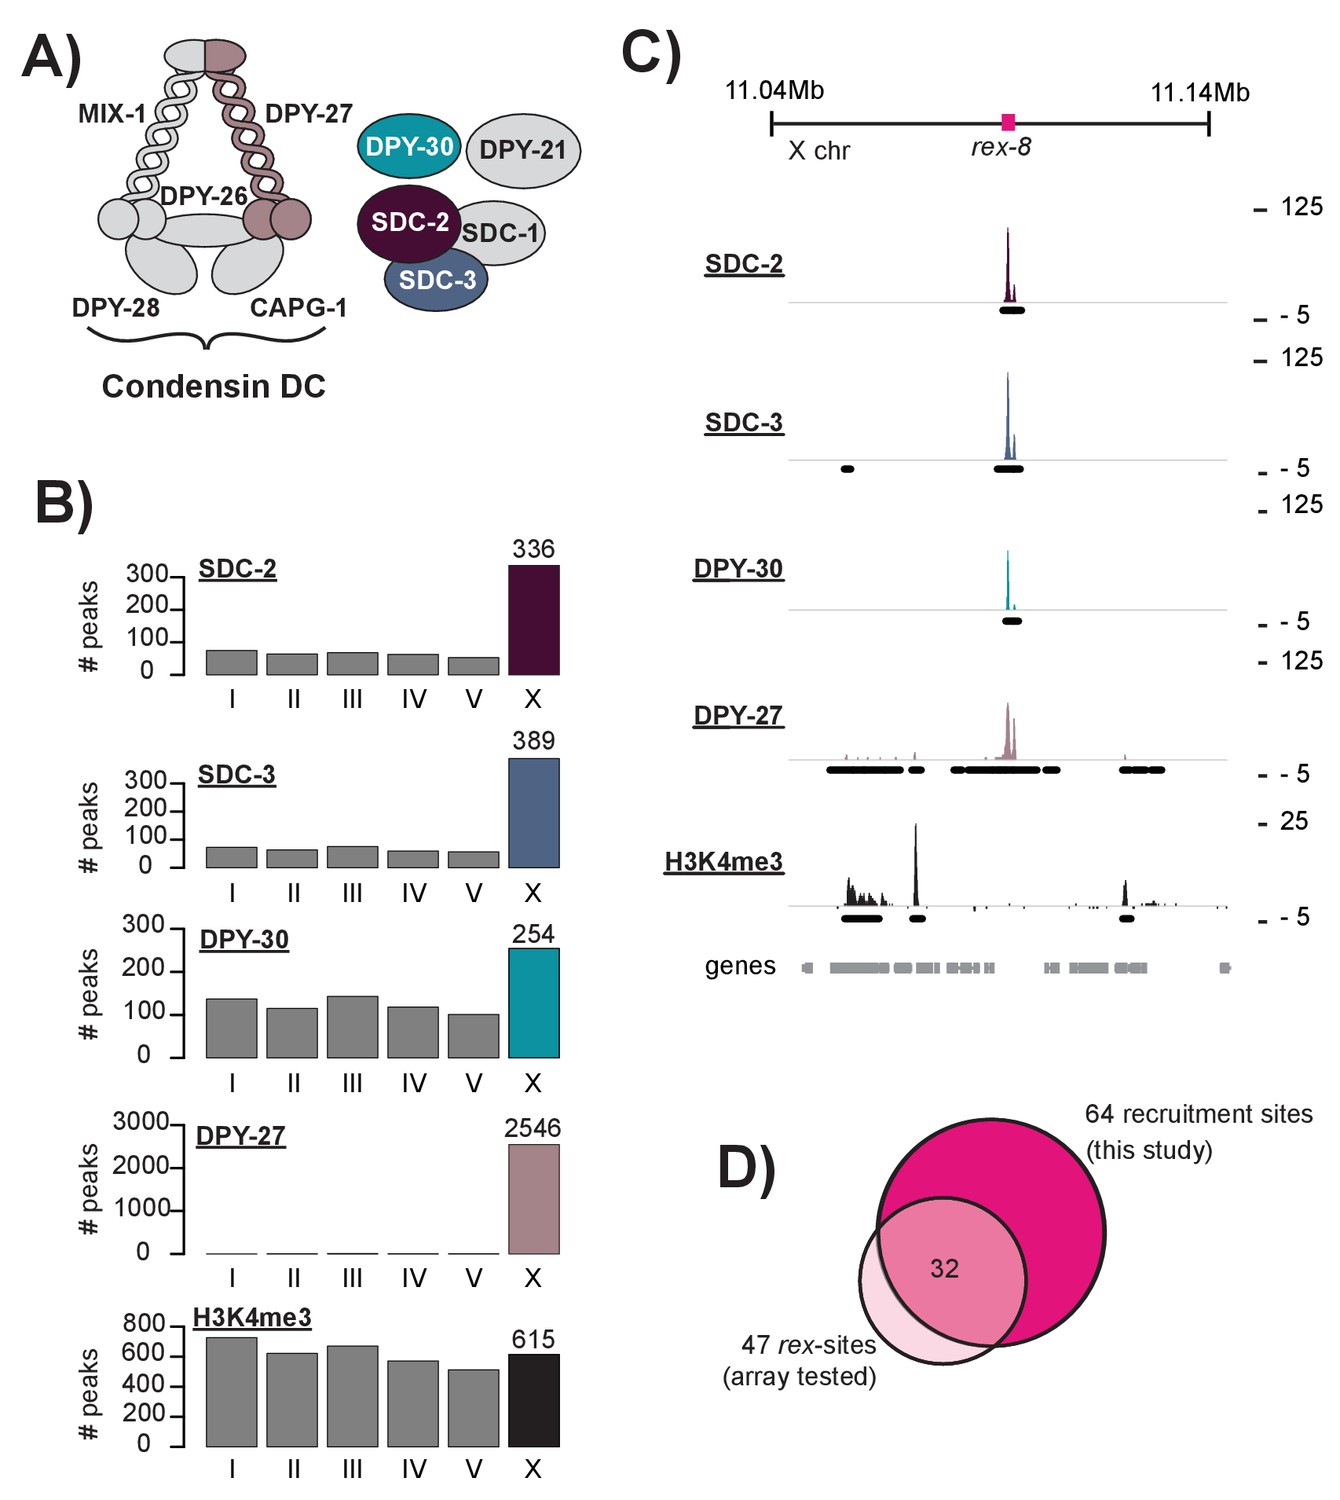
DCC recruitment sites are defined using high resolution ChIP-seq analysis.
(A) The C. elegans dosage compensation complex (DCC) is composed of a modified condensin complex (condensin DC) which is distinguished from condensin I by the SMC-4 variant, DPY-27. The non-condensin subunits SDC-2, SDC-3, and DPY-30 are required for DCC recruitment to the X chromosomes. (B) Peak distribution across each of the six chromosomes. (C) Representative ChIP-seq enrichment for an 80 kb window that includes recruitment element on the X, rex-8. Recruitment sites on the X chromosome were defined as a 400 bp window centered on the SDC-2 ChIP-seq summits that overlap with SDC-3, DPY-30, and DPY-27 peaks and that do not show significant H3K4me3 enrichment. (D) Recruitment sites identified in this study (n = 64) largely overlap with sequences previously shown to recruit DCC to multi-copy extrachromosomal array (n = 47) (Jans et al., 2009; Pferdehirt et al., 2011; McDonel et al., 2006).
Figure 1—figure supplement 1
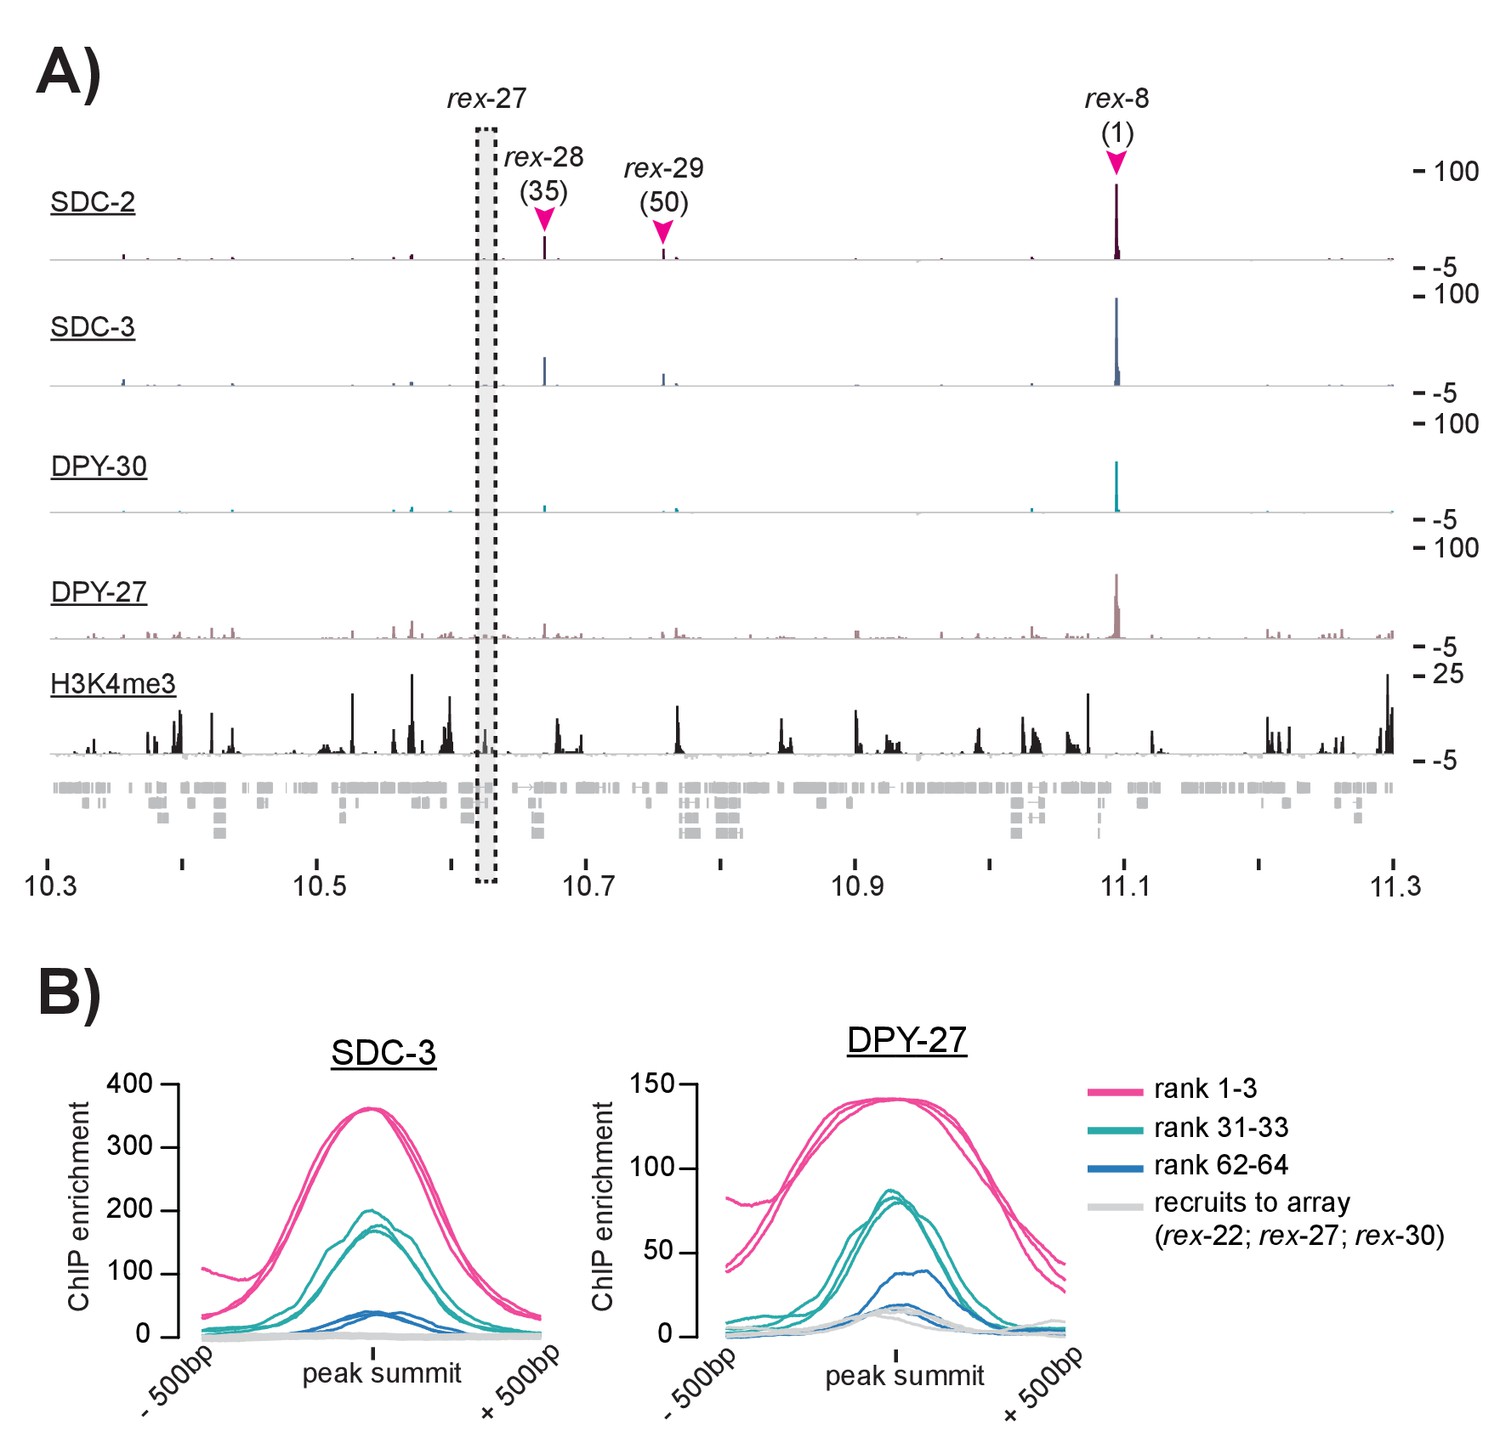
ChIP-seq data suggests that some previously defined rex-sites fail to recruit the DCC in the context of the X chromosome.
(A) SDC-2, SDC-3, DPY-30, DPY-27, and H3K4me3 ChIP-seq enrichment data is plotted for a 1 Mb window. Three previously identified rex-sites (rex-8 (rank 1), rex-28 (rank 35), and rex-29 (rank 50)) are identified as recruitment sites in this study. One previously identified rex-site (rex-27) shows little DCC enrichment and high H3K4me3 enrichment. (B) Plots showing SDC-3 and DPY-27 average ChIP enrichment across a 1 kb window centered on the peak summit. The top three recruitment sites (rank 1–3) are shown in pink; recruitment sites ranked 31–33 are shown in green; recruitment sites ranked 62–64 are shown in blue. Rex-22, rex-27, and rex-30, shown previously to recruit to array but not called recruitment sites in this study, are shown in gray.
Figure 1—figure supplement 2
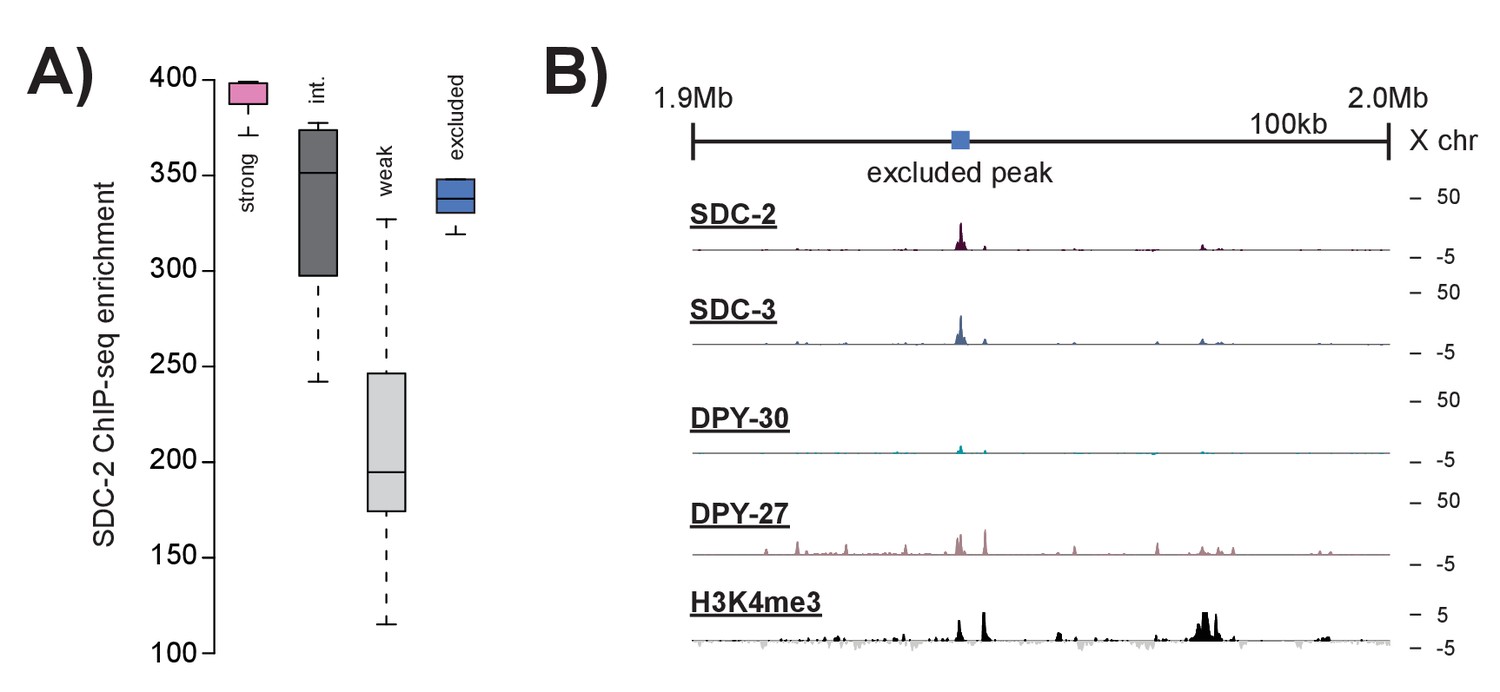
Peaks excluded by H3K4me3 overlap do not resemble strong recruitment sites.
(A) Boxplots indicating SDC-2 ChIP-seq enrichment score across each of the defined classes: strong recruitment sites (n = 17), intermediate recruitment sites (n = 16), weak recruitment sites (n = 31), and peaks excluded by H3K4me3 enrichment (n = 9). B) Representative ChIP-seq enrichment for a 100 kb window that includes a peak excluded by H3K4me3 enrichment.
Figure 2 with 1 supplement
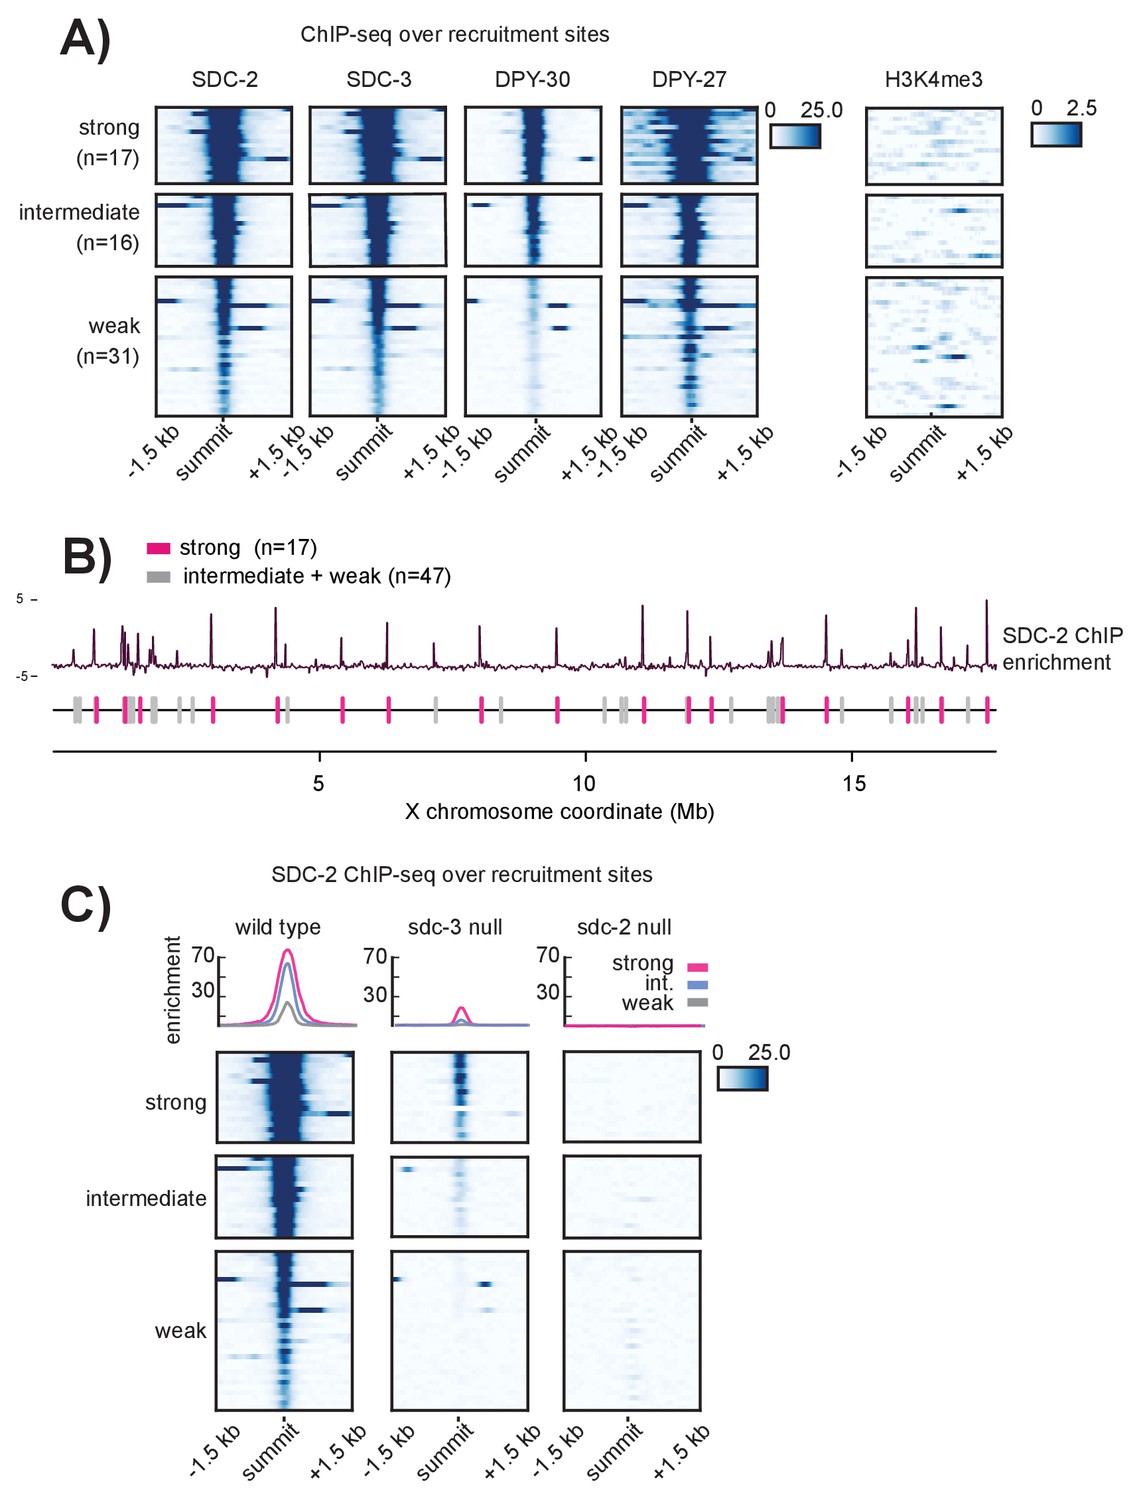
Recruitment sites on the X chromosome are hierarchical
(A) Heatmaps showing ChIP-seq enrichment for the DCC recruiter proteins, SDC-2, SDC-3, and DPY-30, the condensin DC subunit DPY-27, and the histone modification H3K4me3. Heatmaps are plotted across a 3 kb window centered on the 64 recruitment sites. Based on the DCC ChIP enrichment scores, the recruitment sites are categorized into three strength classes (strong, intermediate, weak) using k-means clustering (n = 3). (B) The strong DCC recruitment sites (pink, n = 17) are scattered across the X chromosome. Intermediate (n = 16) and weak (n = 31) recruitment sites (gray) are distributed in between. The median distance between recruitment sites is ~90 kb. SDC-2 enrichment across the length of the X chromosome was plotted using IGV. (C) In an sdc-3 null mutant, SDC-2 binds the strongest recruitment sites, indicating hierarchy of recruitment. As in (A), heatmaps indicating SDC-2 ChIP-seq enrichment are plotted across a 3 kb window centered on the 64 recruitment sites. Data from wild-type, sdc-3 null, and sdc-2 null are all plotted on the same scale. Density plots above each heatmap indicate the average ChIP enrichment score for each recruitment class plotted across the 3 kb window. Strong sites are plotted in pink, intermediate in blue, and weak in grey.
Figure 2—figure supplement 1
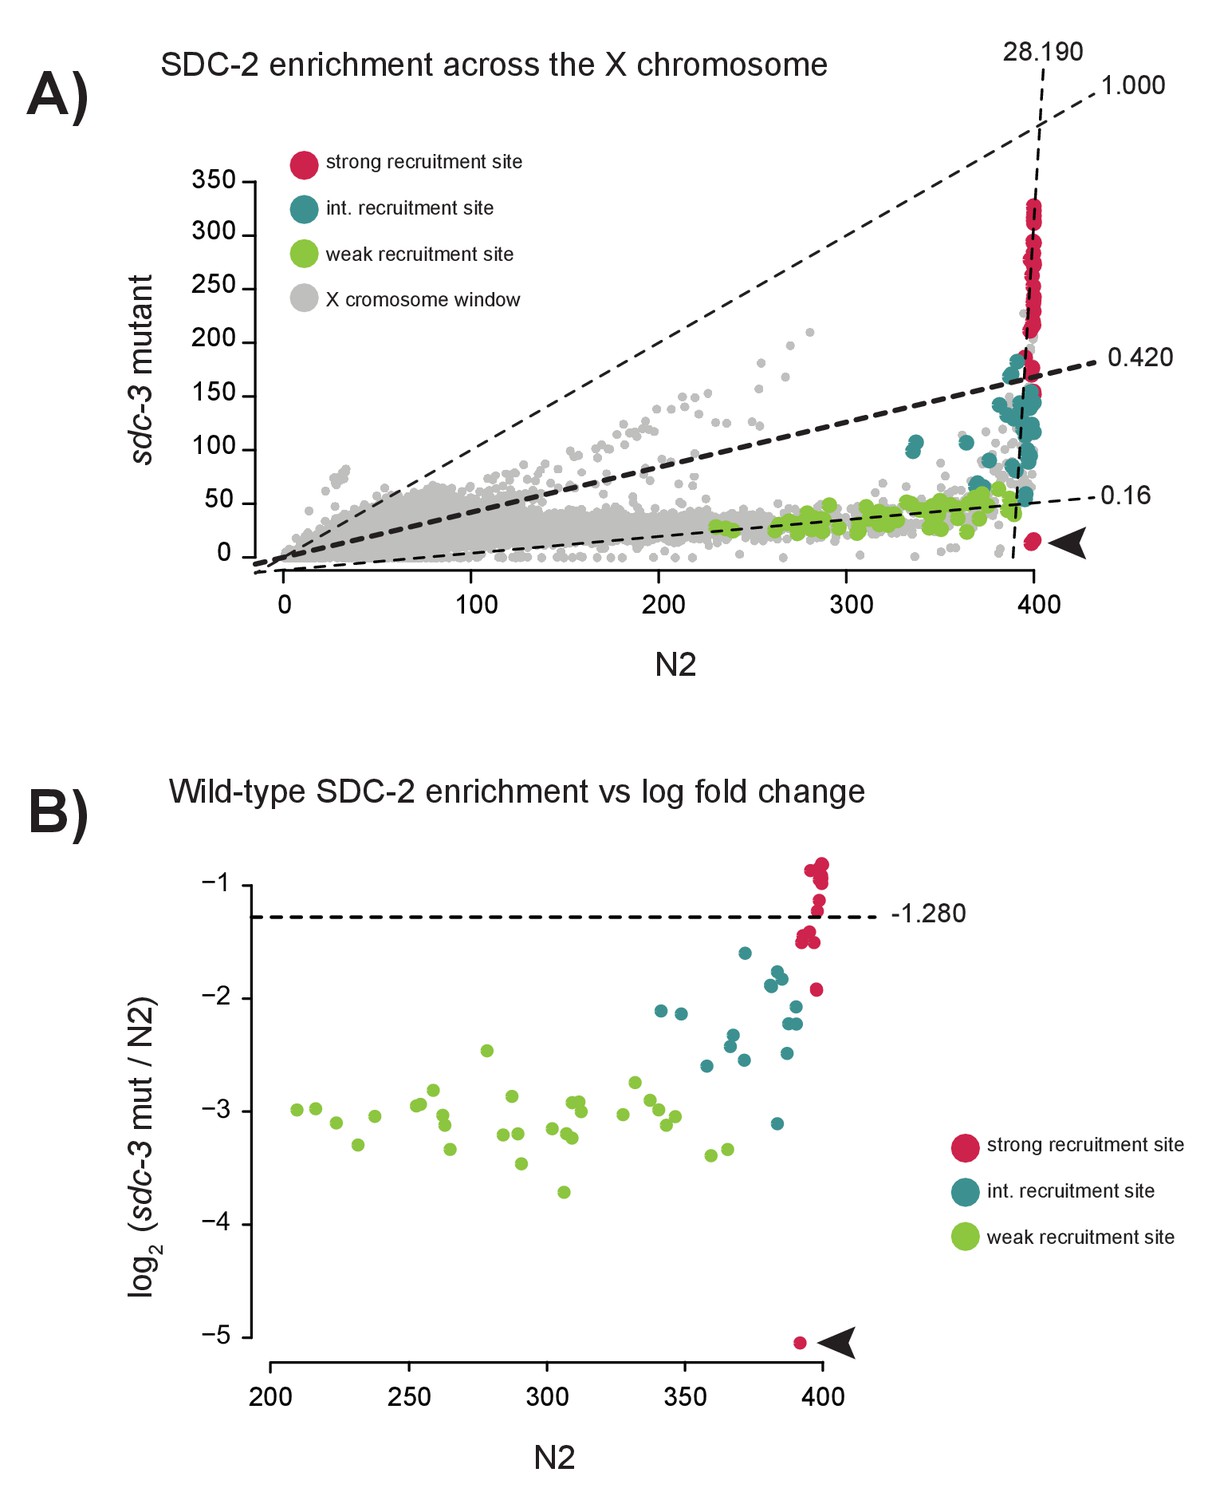
Specific reduction in SDC-2 enrichment at weak recruitment sites in an sdc-3 null mutant.
(A) Scatterplot comparing SDC-2 ChIP-seq enrichment between wild-type (N2) and the sdc-3 null mutant. Briefly, the X chromosome was divided into 200 bp windows with a step size of 100 bp. Average SDC-2 enrichment across the window was calculated and plotted. Windows that overlap with a strong recruitment site are plotted in red, intermediate site in teal, and weak site in green. For each recruitment strength class, the best fit linear model was determined and plotted. Slopes of the best-fit lines are indicated (strong = 28.190, intermediate = 0.420, weak = 0.16). Arrowhead indicates windows overlapping with a region of the X chromosome deleted in the sdc-3 null background. (B) Scatterplot comparing SDC-2 enrichment in wild-type (N2) versus the log2 change in enrichment in the sdc-3 null for all 64 recruitment sites. Each point represents an average across a 40 bp window centered at the recruitment site summit. Dividing the entire X chromosome into 40 bp window revealed an average log2 ratio of −1.280 (horizontal line). Strong recruitment sites are shown in red, intermediate site in teal, and weak site in green. Arrowhead indicates window overlapping with region of the X chromosome deleted in the sdc-3 null background.
Figure 3
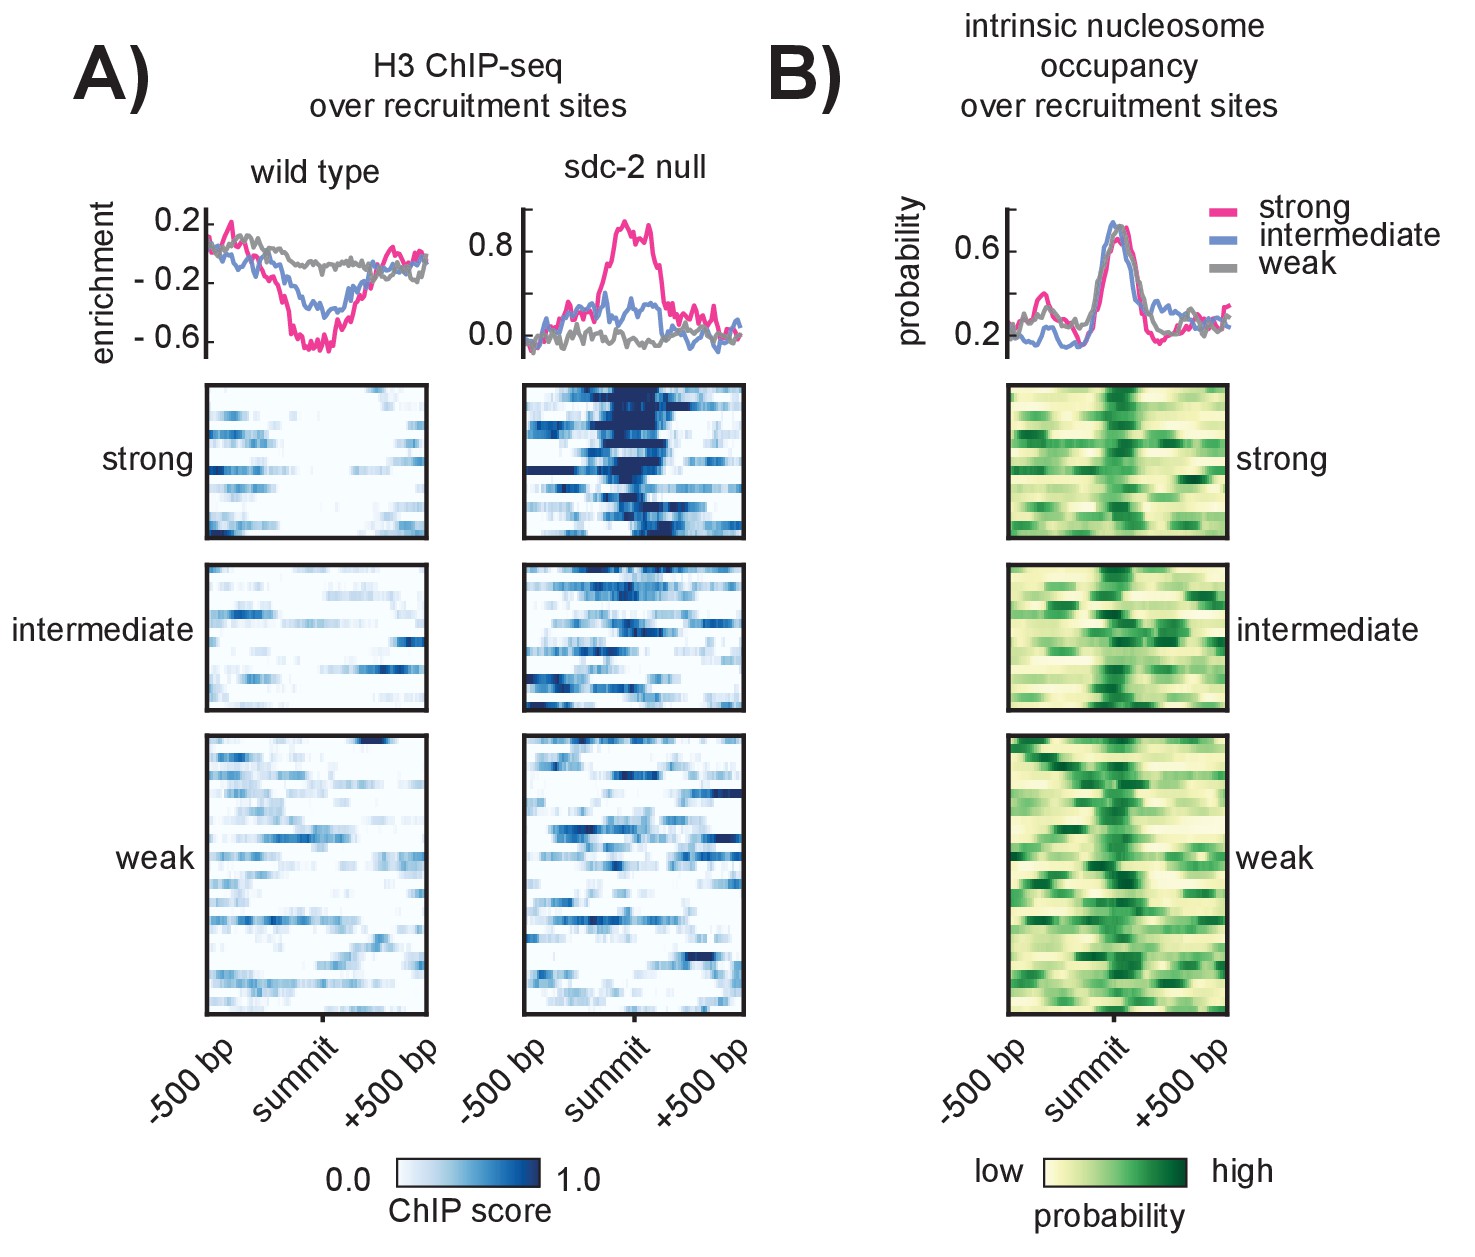
SDC-2 is required for open chromatin at strong DCC recruitment sites that encode for high intrinsic nucleosome occupancy.
(A) Heatmaps showing H3 ChIP-seq enrichment across a 1 kb window centered on the 64 recruitment sites. Wild-type data (left) indicates open chromatin at all recruitment sites. Data from an sdc-2 null strain (right) indicates increase in H3 enrichment, especially at the strong recruitment sites. Density plots above each heatmap indicate the average ChIP enrichment score for each recruitment class. (B) Heatmap indicates the probability of nucleosome occupancy across a 1 kb window centered on the recruitment sites. Probability ranges from 0.0 (yellow) to 1.0 (green). DNA-encoded nucleosome occupancy signal is highest at the center of the recruitment sites.
Figure 4
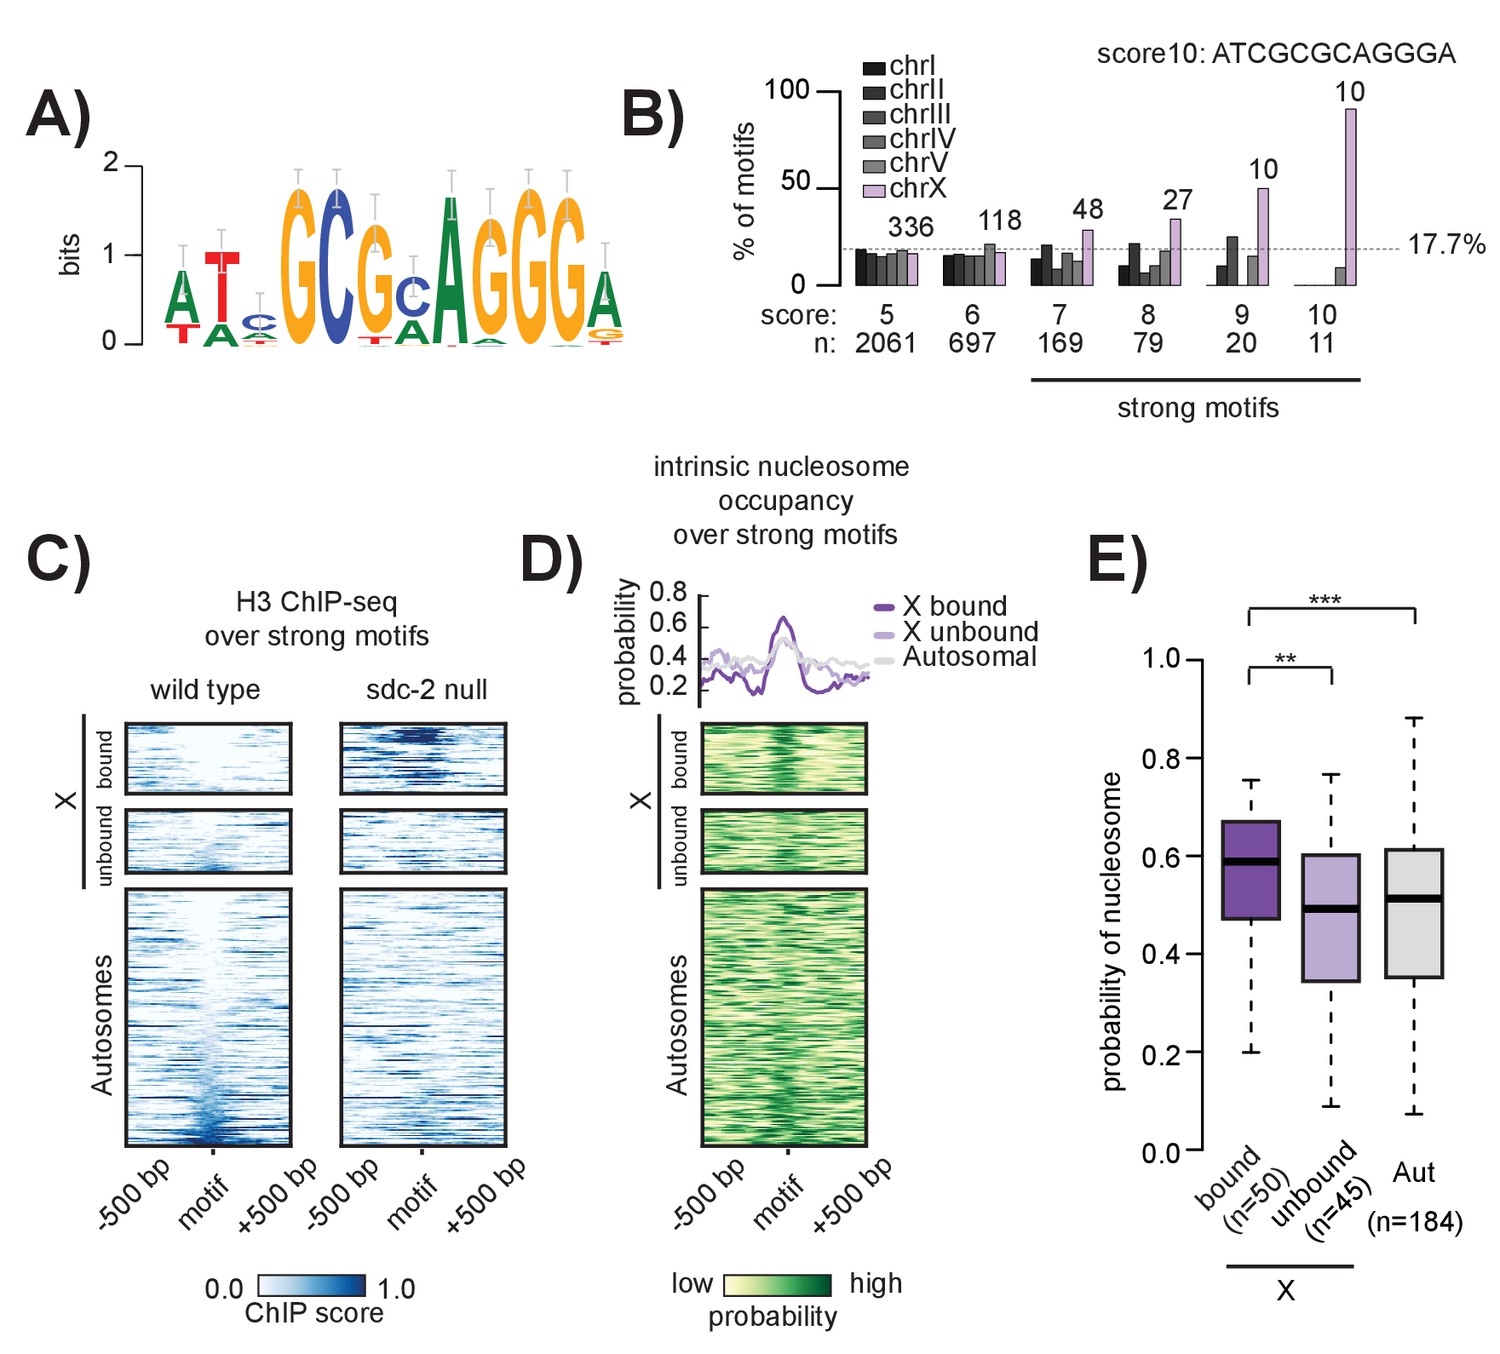
The 12 bp recruitment motif is enriched on the X. Bound motifs are characterized by DNA-encoded nucleosome occupancy.
(A) The 12 bp recruitment motif identified using high-resolution SDC-2 ChIP-seq data. (B) Motif distribution is plotted for chromosomes I through V (shades of gray) and chromosome X (purple). Motif enrichment is dependent on score-cutoff. Weaker motifs (score <7) are randomly distributed across the chromosomes. Strong motifs (score ≥7) are enriched on the X chromosome. Perfect score motifs (score 10, sequence ATCGCGCAGGGA) show almost complete X-specificity: 10/11 (91%) are on the X. (C) Heatmaps showing H3 ChIP-seq enrichment from wild-type (left) and sdc-2 null (right) embryos, plotted across a 1 kb window centered on all strong motifs of score ≥7. Motifs are sorted by H3 enrichment in wild-type, and divided into three categories: Bound by DCC on the X (n = 50), unbound on the X (n = 45), and unbound on the autosomes (n = 184). Here, we define ‘bound’ as the overlap of both SDC-3 and DPY-27 binding. There are no bound motifs on the autosomes. (D) Heatmap indicates the probability of nucleosome occupancy across a 1 kb window centered on the motifs. As in (C), motifs are sorted by H3 enrichment in wild-type. (E) Boxplot indicates intrinsic nucleosome occupancy for a 150 bp window centered on each motif. Bound motifs (dark purple, median 0.616) have significantly higher DNA-encoded nucleosome occupancy compared to unbound motifs on the X (light purple, median 0.4865) and motifs on the autosomes (grey, median 0.503). Significance calculated using one-tailed students t-test (** p-value<0.01, *** p-value<0.001).
Figure 5 with 2 supplements
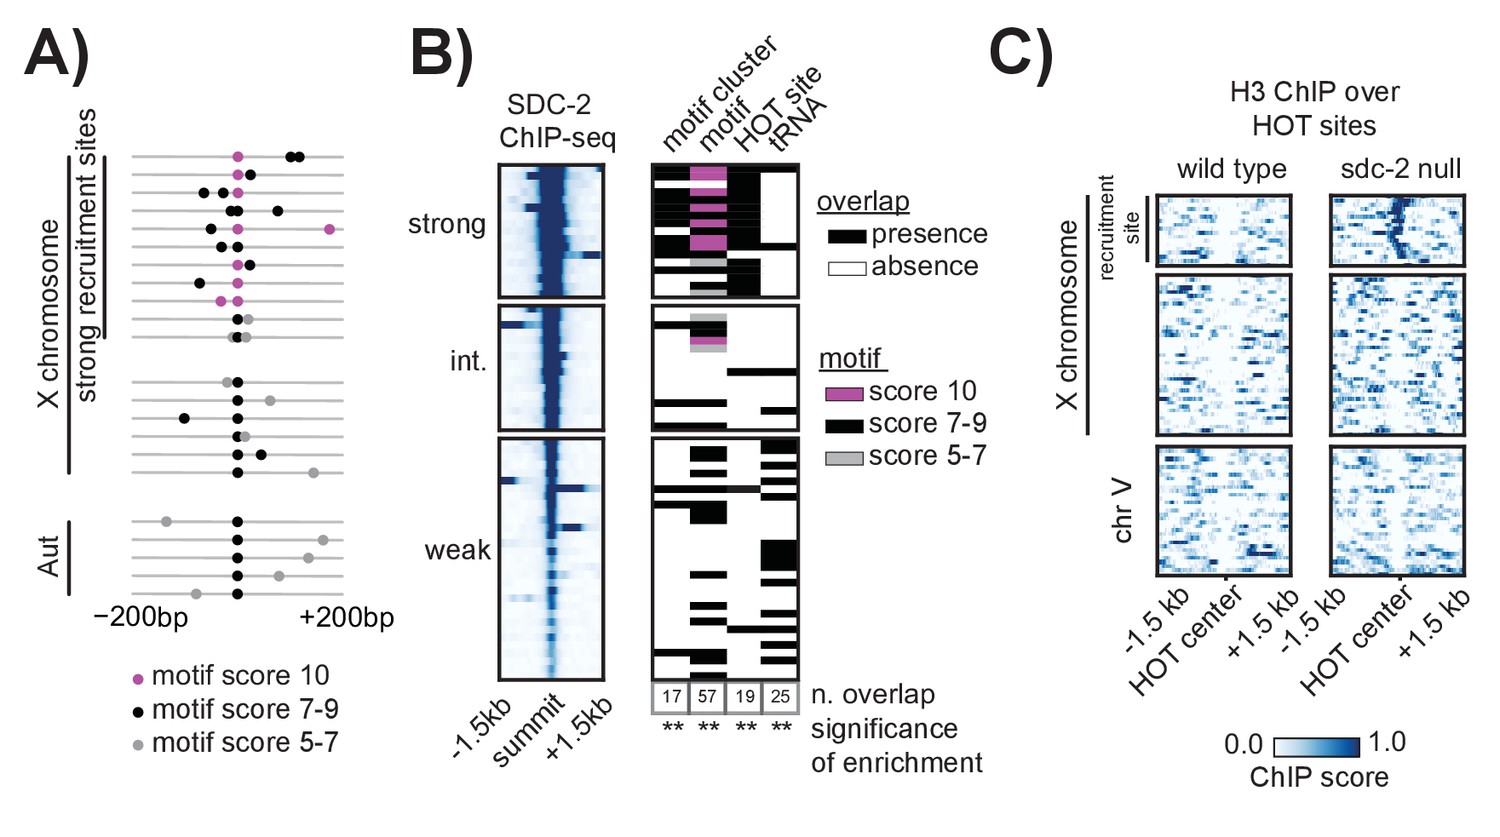
Clustered motifs at HOT sites distinguish the X chromosome from the autosomes.
(A) A motif cluster is defined as a strong motif (score ≥7) flanked within 200 bp by a second motif. Motif locations plotted for each of the 22 motif clusters: 17 are X- linked (11 at strong recruitment sites, six at weaker recruitment sites) and five are on the autosomes. Plots are centered on the strongest motif in each cluster. Weak motifs (score 5–7) are shown in gray; strong motifs (score 7–9) are shown in black; perfect matches (score = 10) are shown in pink. For simplicity, motif scores (Supplementary file 1E) are rounded down to the nearest whole integer. (B) Plot demonstrating overlap between recruitment sites and motif clusters, motif strength, HOT sites, and tRNAs. Black box indicates presence and white box indicates absence of a given overlap. For motifs, pink box indicates presence of a perfect score motif (score = 10); black box indicates presence of a strong motif (score 7–9); grey box indicates presence of a weak motif (score 5–7). Significance of overlap is calculated for the entire set of 64 recruitment sites using permutation test (overlapPermTest function of the regioneR package (Fruciano et al., 2016), 100 permutations, ** p-value<0.01). The reported ‘n. overlap’ refers to the number of indicated genomic annotation that overlaps with at least one recruitment site. Overlap with HOT site is a characteristic of strong recruitment sites. Overlap with tRNAs is a characteristic of weaker recruitment sites. (C) Heatmaps showing H3 ChIP-seq enrichment from wild-type (left) and sdc-2 null (right) embryos, plotted across a 3 kb window centered on annotated HOT sites. HOT sites on the X are divided into two categories: those that overlap with a recruitment site and those that do not. HOT sites from chromosome V are representative of all autosomal HOT sites. SDC-2 is required for opening chromatin at the HOT DCC recruitment sites on the X.
Figure 5—figure supplement 1
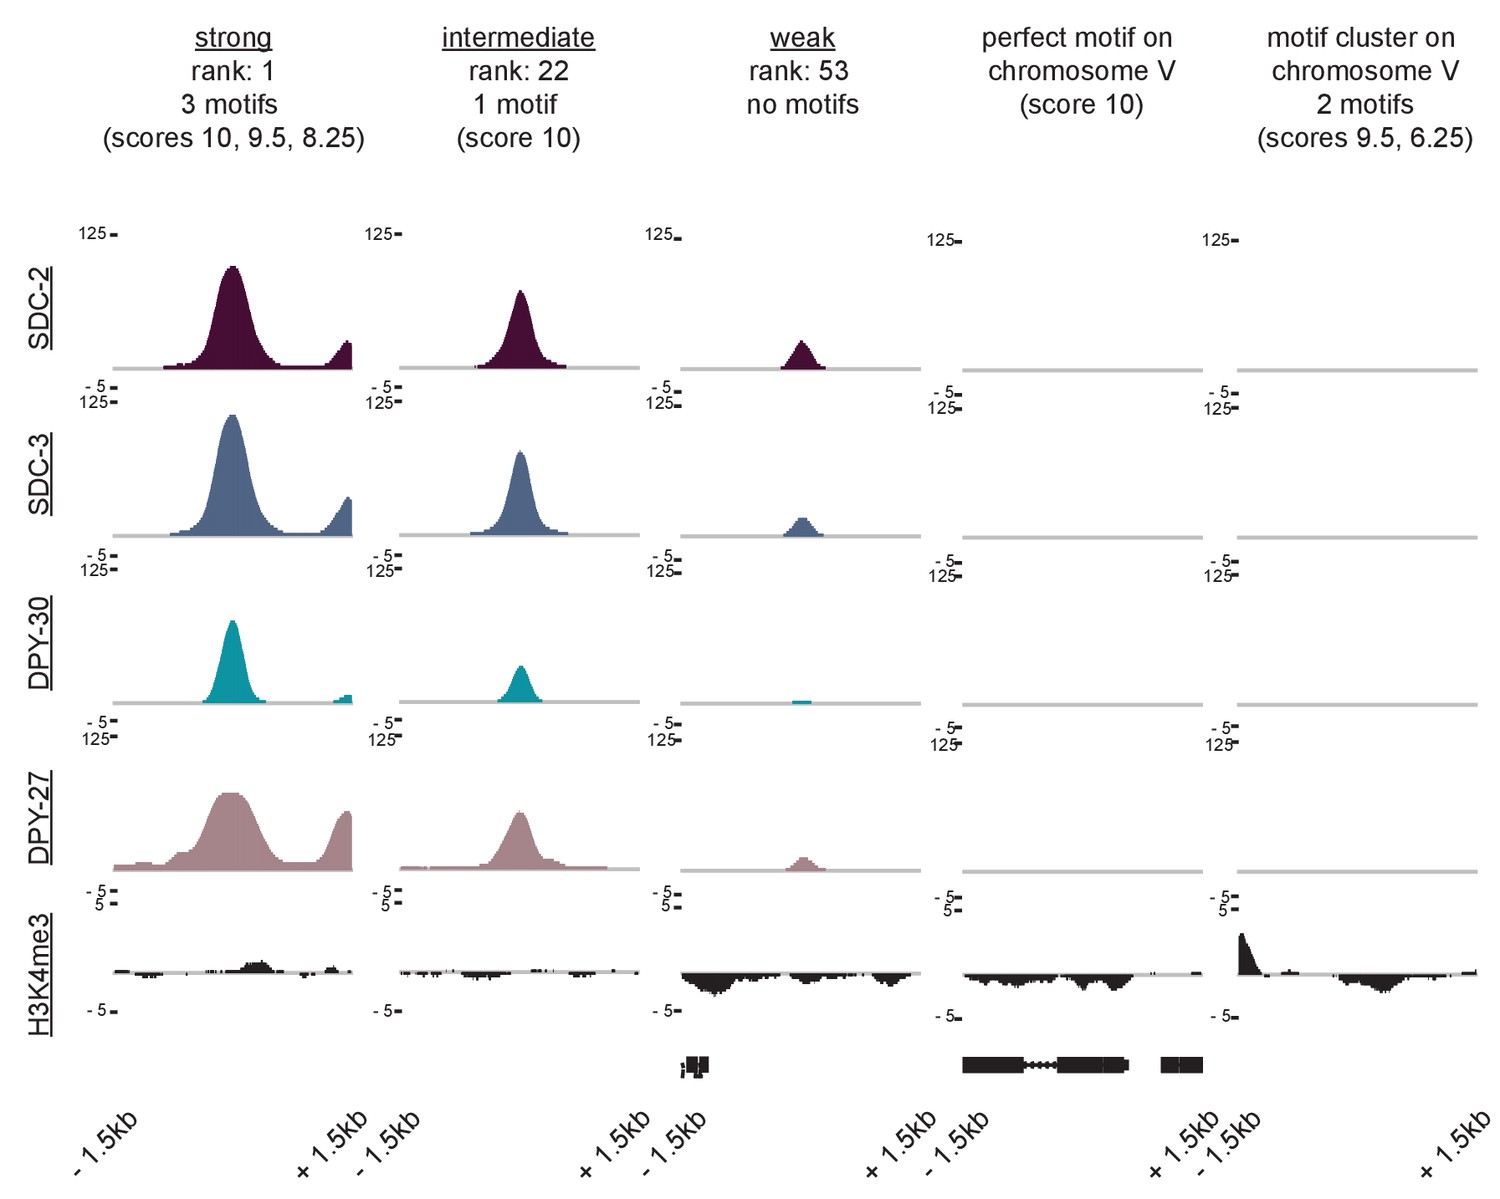
ChIP-seq data reveals that neither perfect affinity motifs nor motif clustering by itself is sufficient to explain X-specific recruitment of the DCC.
SDC-2, SDC-3, DPY-30, DPY-27, and H3K4me3 ChIP-seq enrichment is plotted across a 3 kb window centered on a representative recruitment site from each strength class, and for two autosomal loci (the perfect autosomal motif and the autosomal motif cluster used in Figure 6E) that do not recruit the DCC.
Figure 5—figure supplement 2
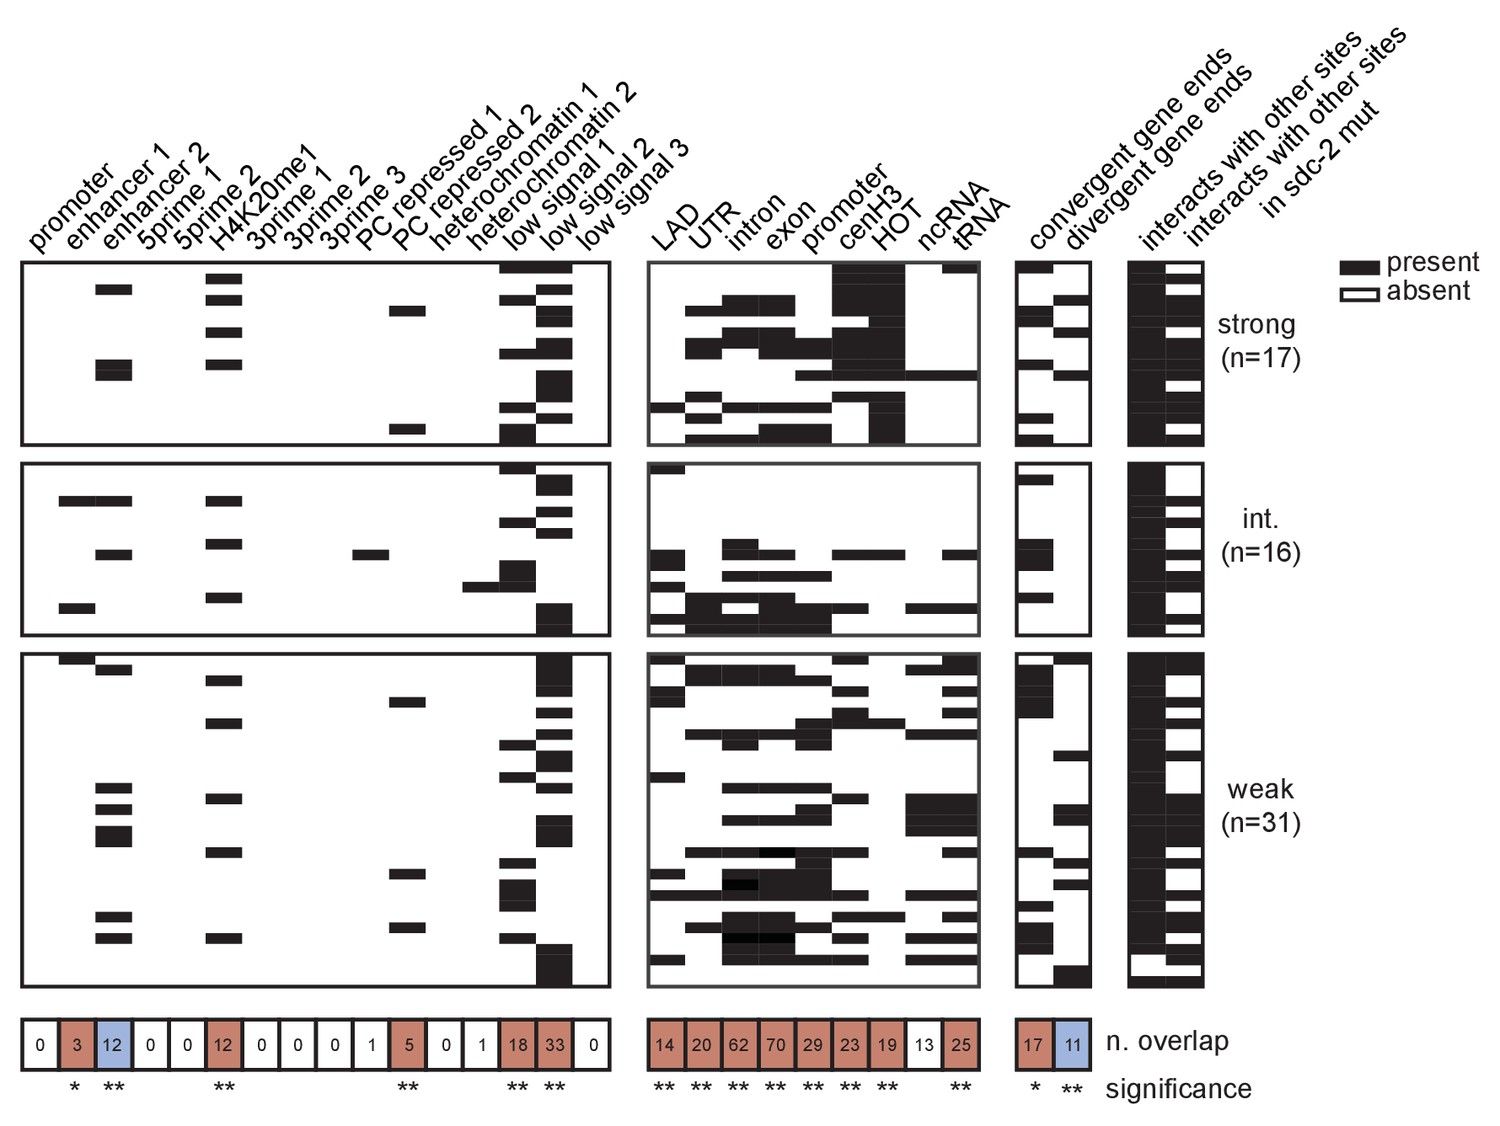
Extended analysis of overlap between recruitment sites with each tested annotation.
Black box indicates presence and white box indicates absence of a given overlap. Significance of overlap is calculated using permutation test (overlapPermTest function of the regioneR package (Fruciano et al., 2016), 100 permutations, ** p-value<0.01)). Red box indicates enrichment of overlap; blue box indicates depletion. The reported ‘n. overlap’ refers to the number of indicated genomic annotation that overlaps with at least one recruitment site. References for genomic annotations can be found in Supplementary file 1F.
Figure 6
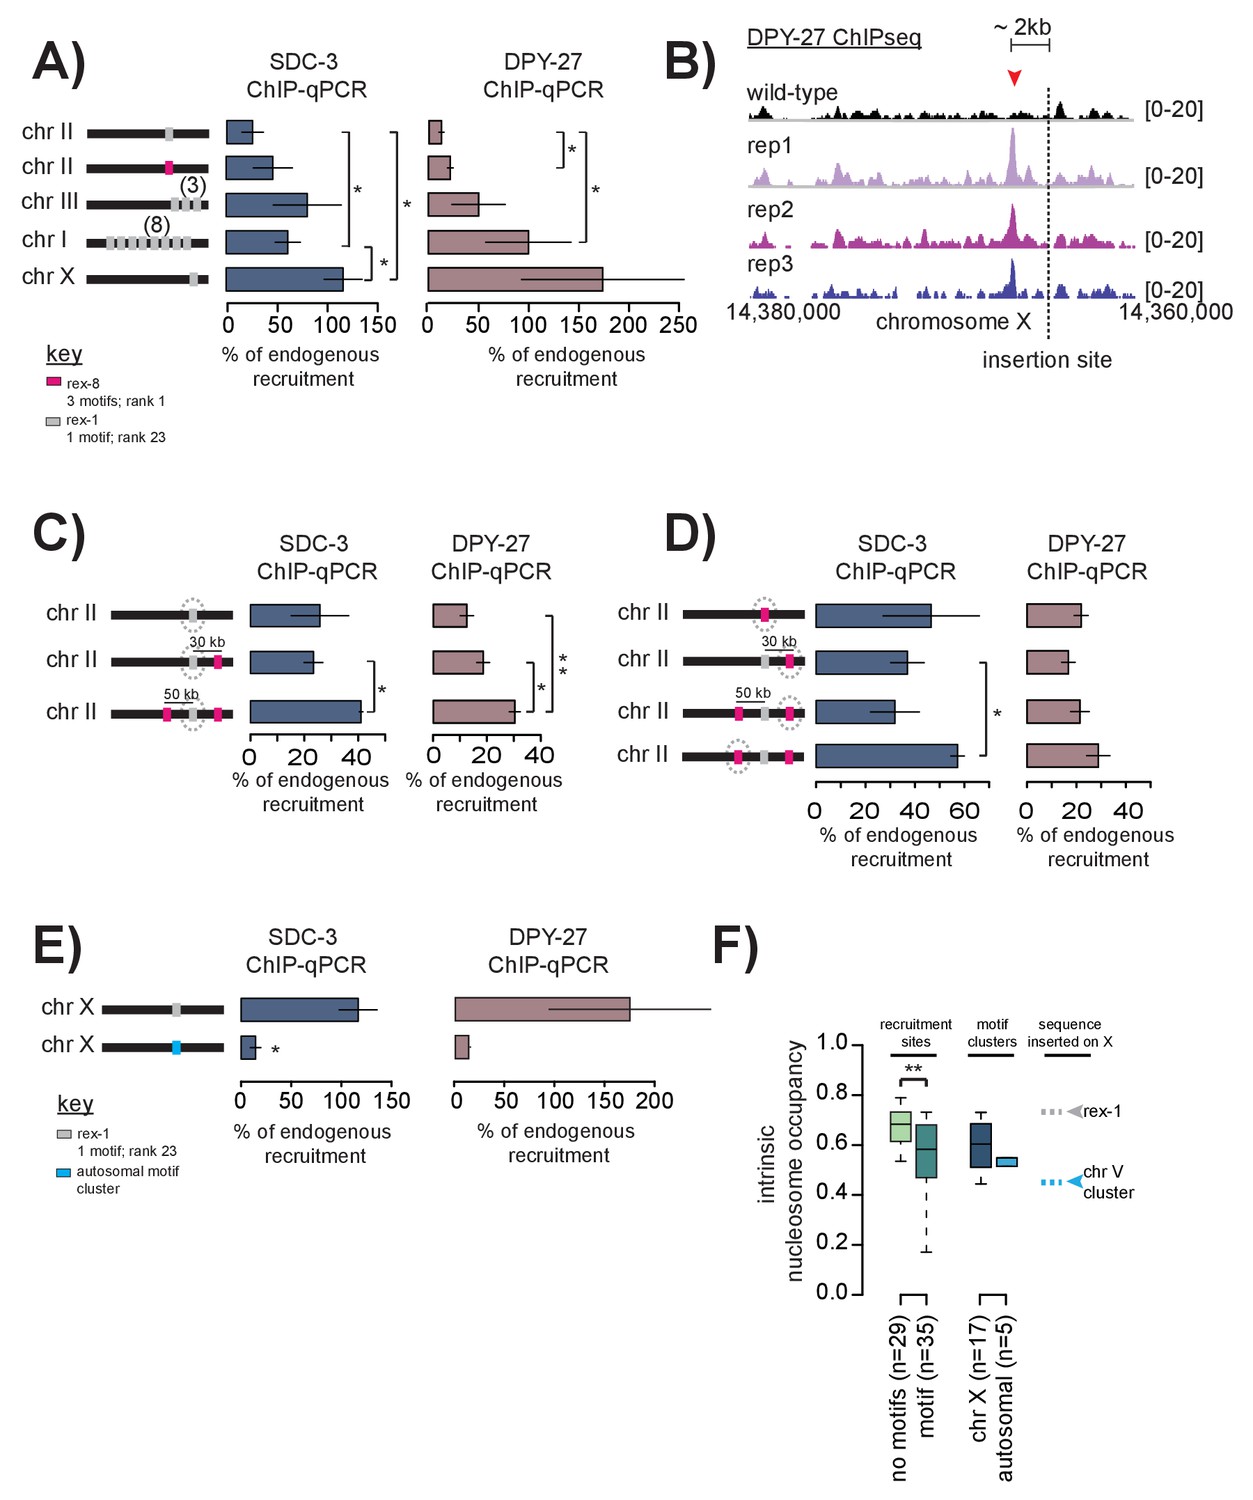
Cooperation between recruitment sites is necessary for robust DCC recruitment.
(A) SDC-3 (left, blue) and DPY-27 (right, brown) ChIP-qPCR data is plotted for the indicated ectopic insertions. ChIP-qPCR is plotted as percent of endogenous recruitment, that is, recruitment at the ectopic site is compared to recruitment at the corresponding endogenous sequence. MosSci was used to insert rex-1 and rex-8 sequence into the same locus on chromosome II. Bombardment was used to insert rex-1 sequence in three-copy on chromosome III and eight-copy on chromosome I. CRISPR was used to insert rex-1 sequence in single copy on chromosome X. Information on strain generation is available in Supplementary file 1A. Significance is tested using one-tailed t-test assuming unequal variance (*p-value<0.05; **p-value<0.01). (B) DPY-27 ChIP-seq data comparing wild-type average and three biological replicates of the ChIP-seq data in the strain bearing an ectopic insertion of rex-1 in single copy in chromosome X. The insertion site is indicated as the dashed line. Inserted rex-1 sequence is not shown, as ChIP-seq enrichment at the ectopic sequence is confounded by binding at the endogenous site. Location of the novel spreading peak in the insertion strain is indicated by the red arrowhead. (C) As in (A), SDC-3 and DPY-27 ChIP-qPCR data is plotted as percent of endogenous recruitment. Dashed circle indicates ectopic site being assayed in ChIP-qPCR. CRISPR was used to insert rex-8 sequence 30 kb downstream and 50 kb upstream of the ectopic rex-1 sequence on chromosome II. (D) As in (C), dashed circle indicates the ectopic site being assayed. (E) CRISPR was used to insert a motif cluster from chromosome V into the ectopic chromosome X site. Because the chromosome V site does not normally recruit the DCC, SDC-3 and DPY-27 ChIP-qPCR data is plotted as percent of endogenous rex-1 recruitment. (F) Boxplot indicates intrinsic nucleosome occupancy for a 150 bp window centered on either motif or recruitment site as indicated. Recruitment sites with no motifs (light green, median 0.684) have significantly higher DNA-encoded nucleosome occupancy compared to recruitment sites containing motifs (dark green, median 0.583). Motif clusters on the X (dark blue, median 0.604) have higher DNA-encoded nucleosome occupancy compared to motif clusters on the autosomes (light blue, median 0.548). Rex-1 has a nucleosome occupancy score of 0.732; the chromosome V motif cluster has a nucleosome occupancy score of 0.450).
Figure 7 with 5 supplements
Multiple DCC recruitment sites establish DCC binding within defined X chromosomal domains.
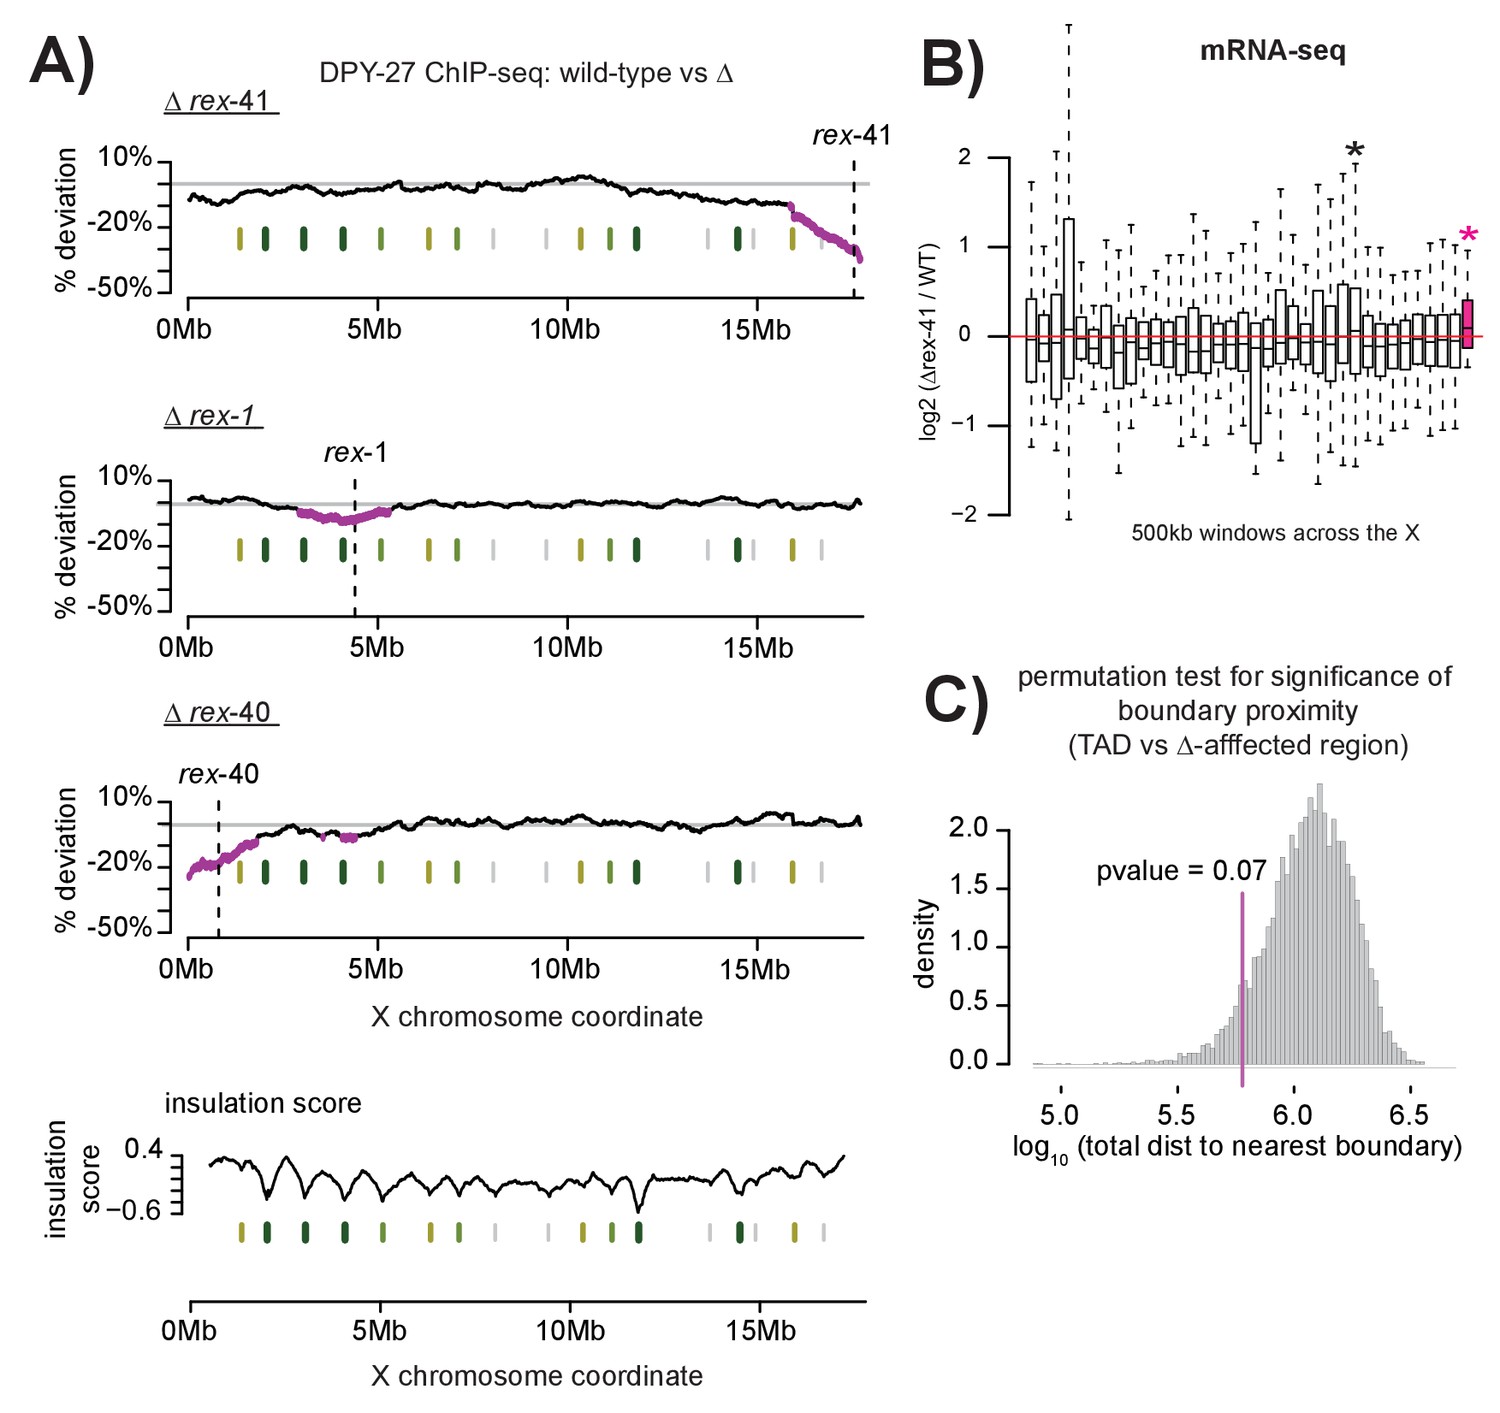
(A) DPY-27 ChIP-seq data was used to calculate percent deviation from wild-type in three different recruitment site deletion strains. Briefly, the log2 ratio between wild-type and deletion strain was calculated for all DPY-27 ChIP-seq peaks and compared to a positive control locus (rex-8, the strongest recruitment site). A variable-step sliding window (window size of 2 Mb stepped across each DPY-27 peak) was used to calculate average deviation from wild-type binding. Regions shown in pink have significantly decreased DPY-27 enrichment compared to the rest of the chromosome, p-value<0.05, determined by one tailed students t-test, comparing log2 ratios in an individual window to log2 ratios across the whole X chromosome. In each experiment, the deleted recruitment site is indicated by a dashed line. Green lines (darker with stronger insulation activity) indicate TAD boundaries (as described in [Crane et al., 2015]). (B) mRNA-seq data comparing rex-41 deletion strain to wild-type is shown. Boxplot indicates the log2 ratio between deletion and wild-type for 500 kb windows tiled contiguously across the X chromosome. The rightmost window, shown in pink, contains a significant number of genes with increased transcription compared to wild-type (fisher test, p-value=0.0126). Asterisks mark windows with p-value<0.05). (C) Summed distance between borders of deletion-affected regions from all three recruitment site deletions in (A) and nearest TAD boundary (min: 54 kb, max: 230 kb) is closer than expected by chance alone (average: 313 kb). Shuffling the boundaries of deletion-affected regions (10000 permutations) produced a normal distribution wherein the observed proximity to TAD borders is expected to occur less than 7% of the time by chance. Shown is the distribution of the summed total distance between permuted deletion boundaries and nearest TAD boundary expressed as a log10 value.
Figure 7—figure supplement 1
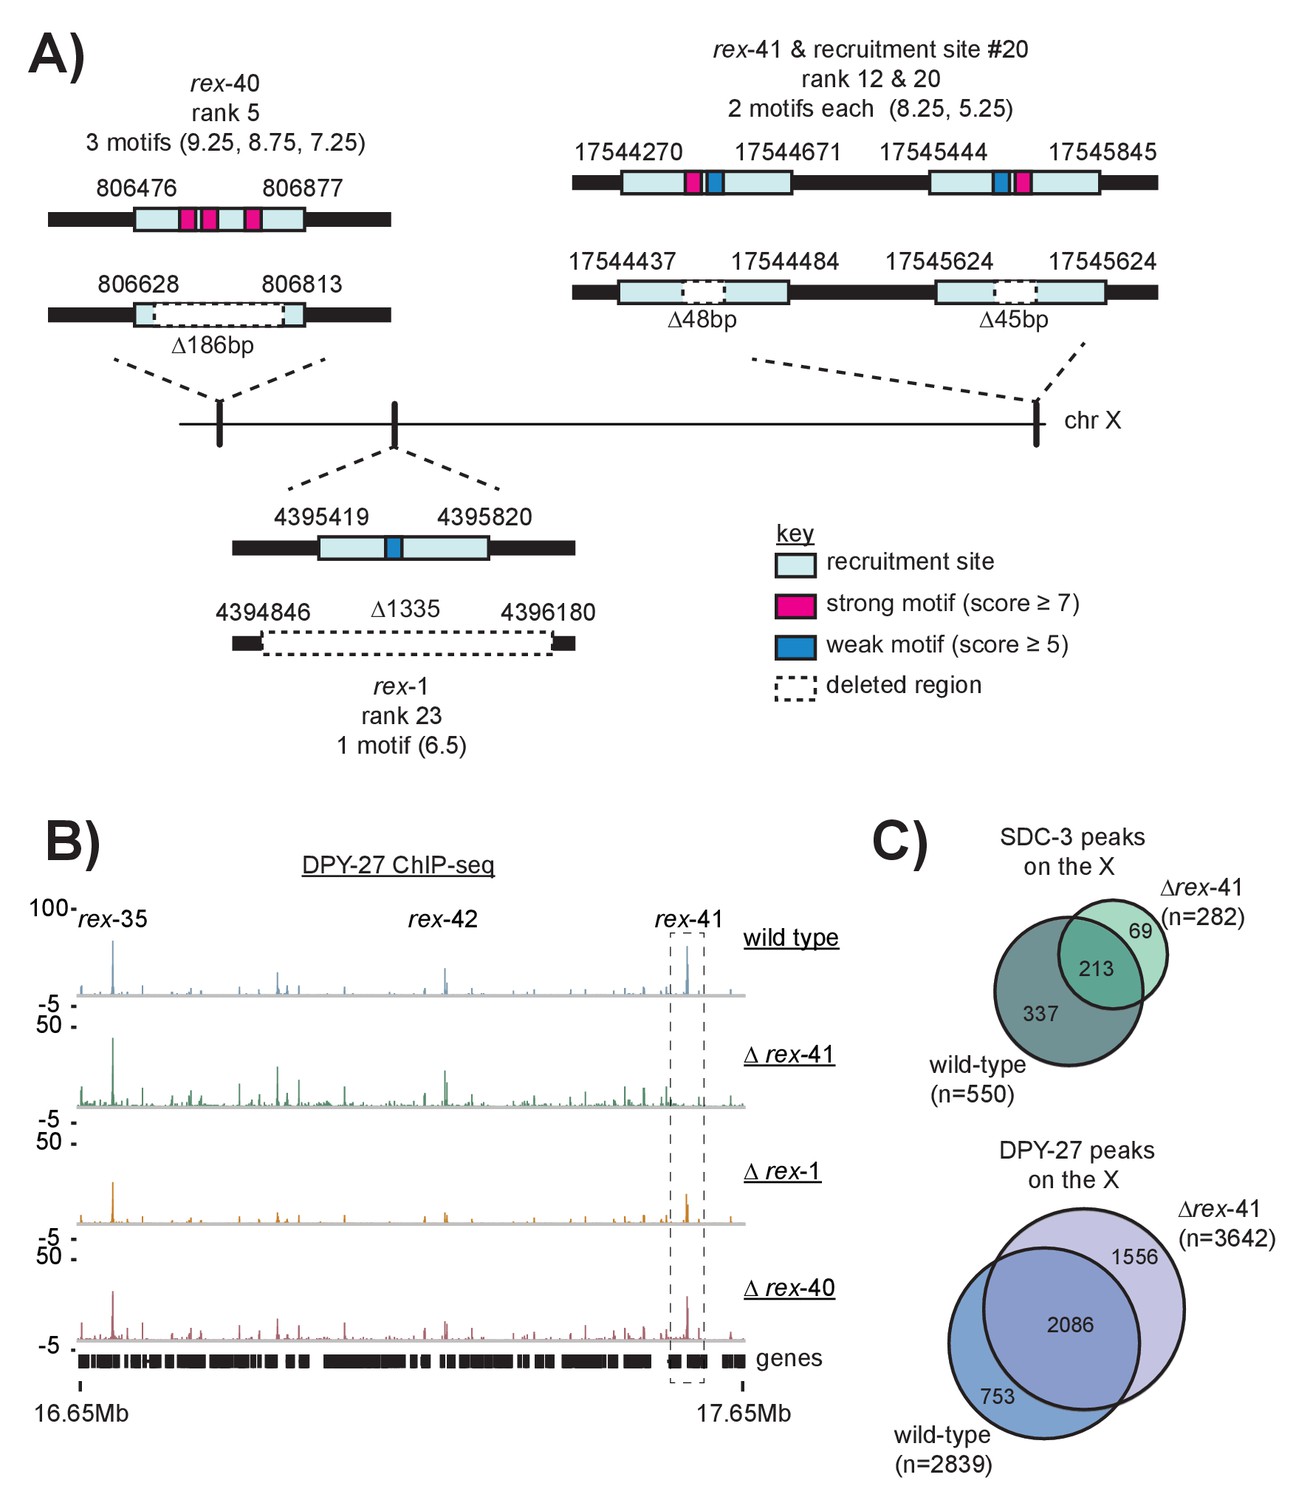
Schematic of recruitment site deletions and ChIP-seq data demonstrating DCC recruitment in the deletion strains.
(A) Cartoon indicating location and size of the deleted recruitment sites in Figure 7. Recruitment sites are shown as light blue boxes. Strong motifs are shown in pink, weak motifs are shown in blue. Deleted regions are indicated by dashed boxes. Rex-41 is part of an inverted repeat. The sgRNA used to delete rex-41 (ranked #12) simultaneously deleted its sister recruitment site (ranked #20) 1 kb downstream. (B) DPY-27 ChIP-seq enrichment for the right-most 1 Mb of the X chromosome. Data from wild-type, ∆rex-41, ∆rex-1, and ∆rex-40 is plotted. Dashed box around rex-41 shows lack of recruitment to this site is specific to the ∆rex-41 strain. (C) Overlap of SDC-3 and DPY-27 peaks in wild-type and ∆rex-41 indicate that the gross pattern of DCC binding across the X is not changed in the deletion strain.
Figure 7—figure supplement 2
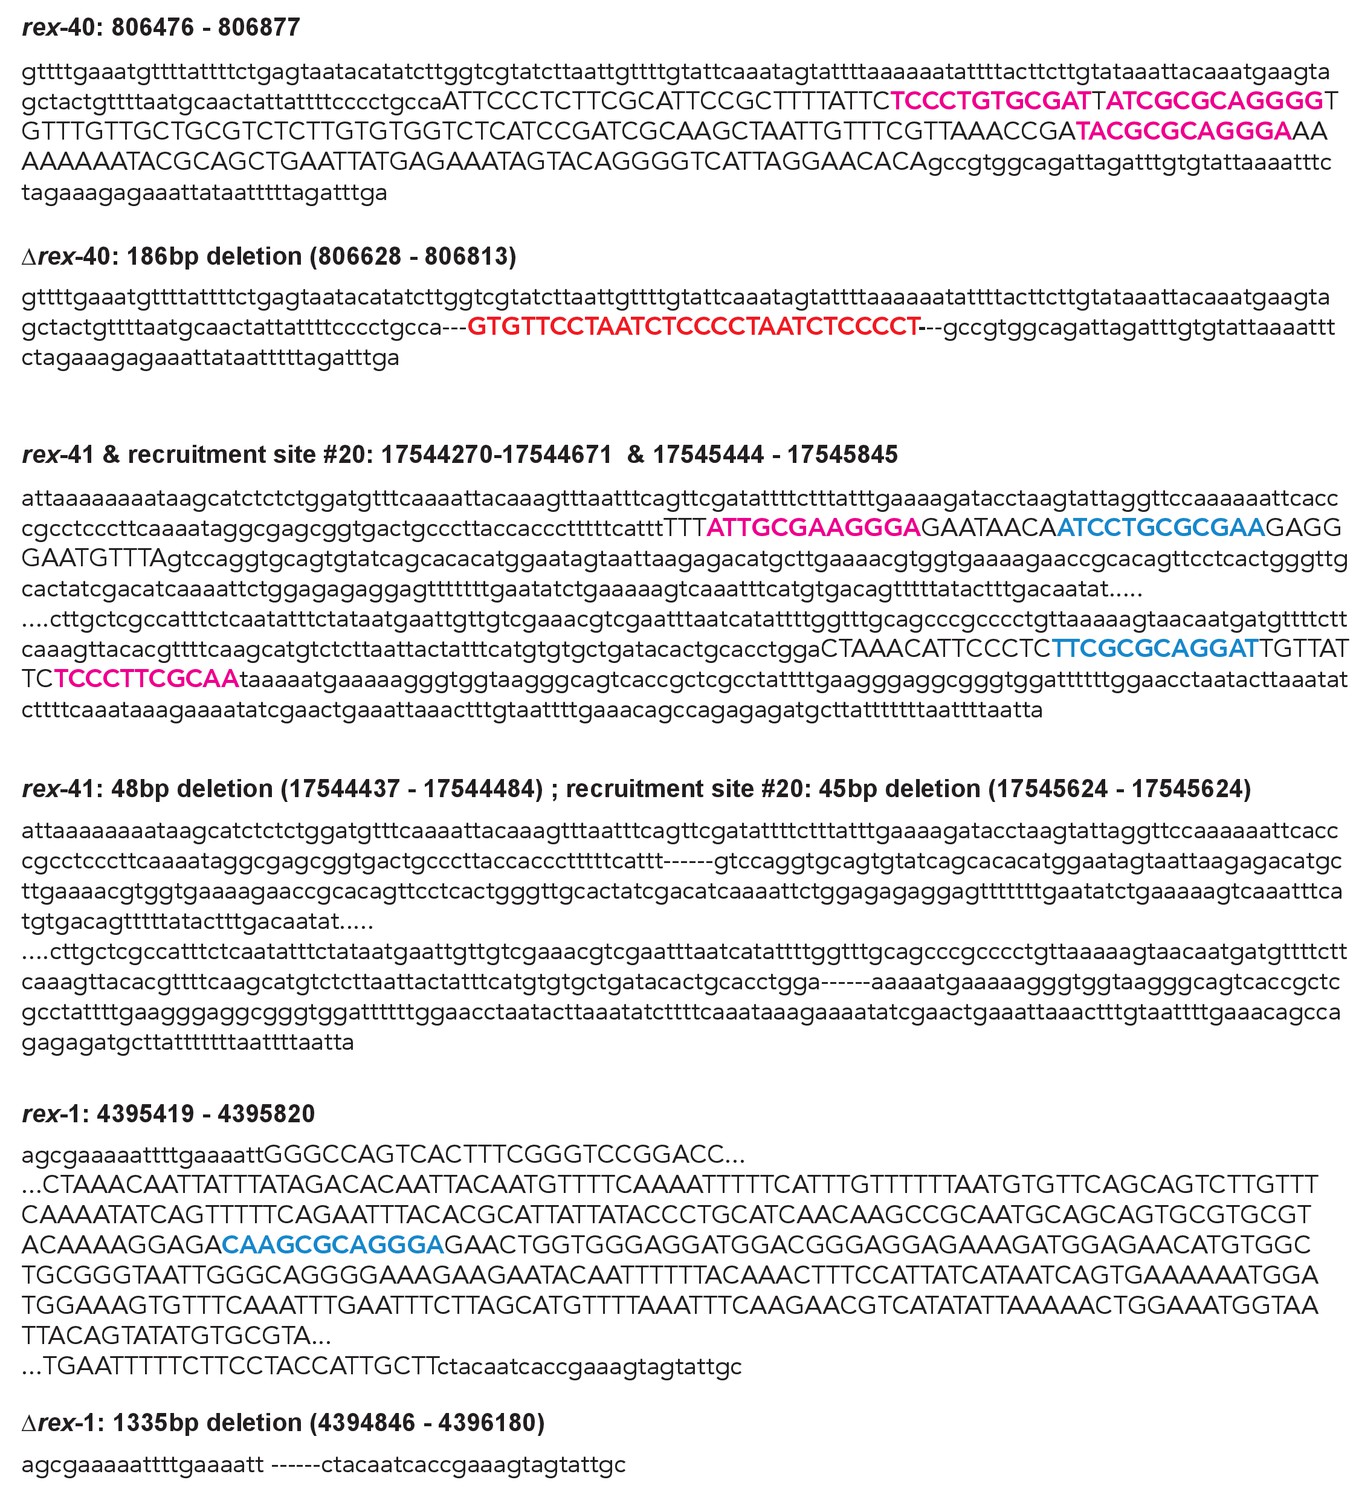
Sanger sequencing results from the wild-type and recruitment site deletion strains.
Sequence that is deleted is capitalized and in italics. Strong motifs are given in pink; weak motifs are given in blue. The rex-40 deletion bears a small insert of dpy-10 sequence, indicated in red.
Figure 7—figure supplement 3
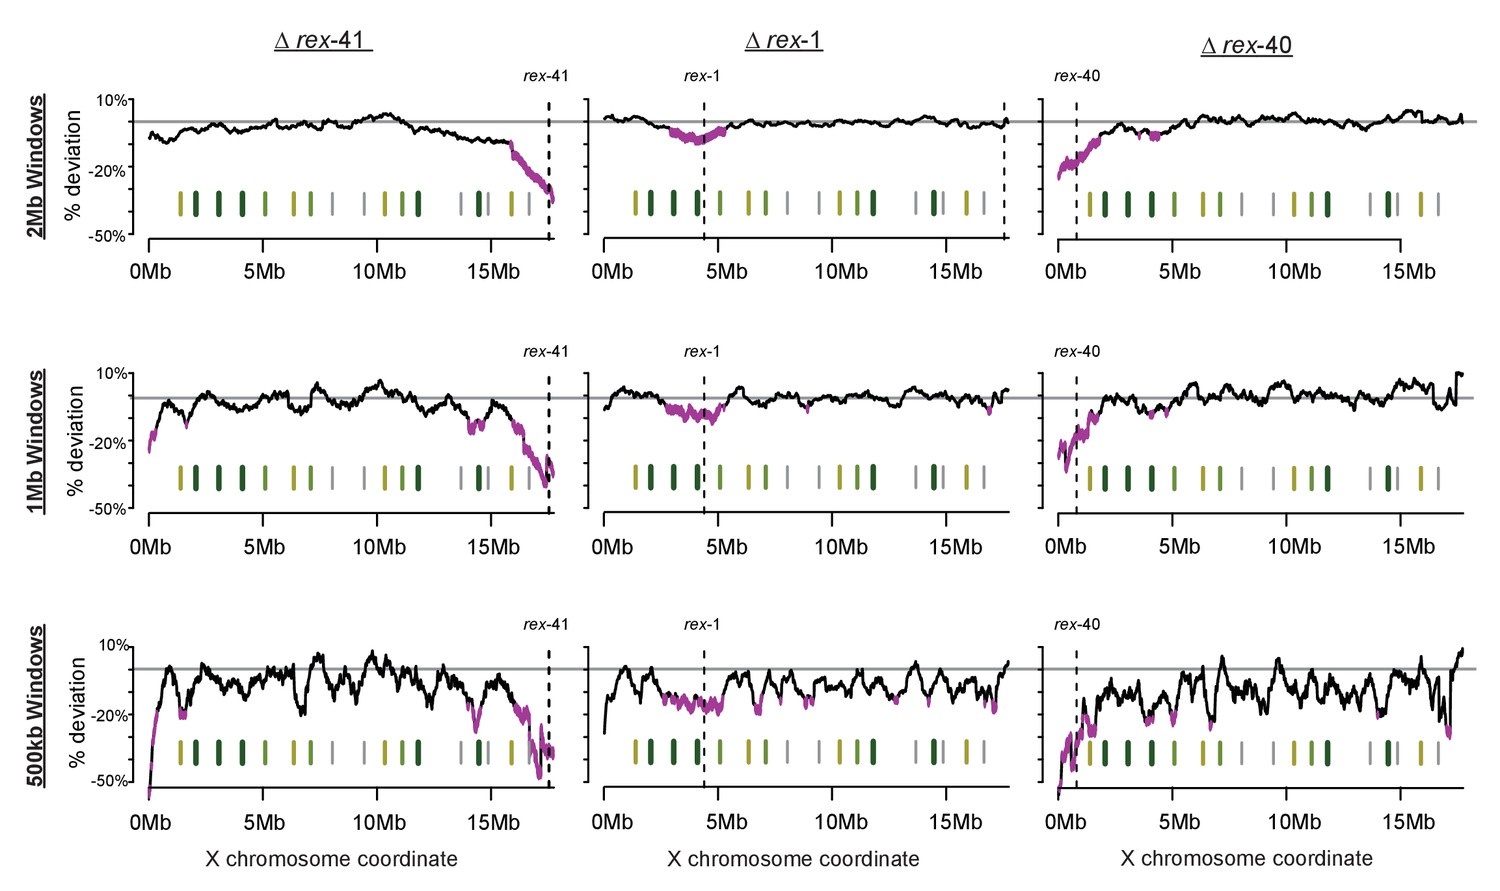
Sliding-window analysis of DCC binding change across the X chromosome using different window sizes.
As in Figure 7, DPY-27 ChIP-seq data was used to calculate percent deviation from wild-type. Analysis was repeated for 2 Mb, 1 Mb, and 500 kb windows.
Figure 7—figure supplement 4
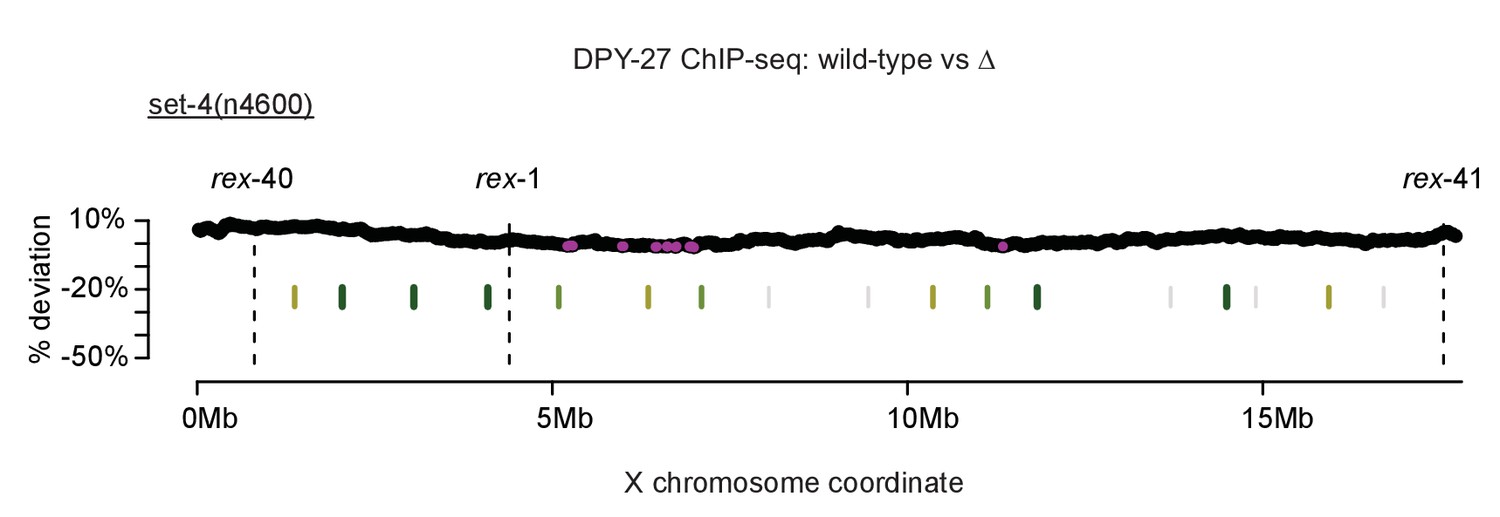
Control for sliding-window analysis of DCC binding change across the X chromosome.
As in Figure 7, DPY-27 ChIP-seq data was used to calculate percent deviation from wild-type. The set-4(n4600) mutation affects DCC function but not localization. TAD boundaries are shown in green. Regions with significantly decreased DPY-27 enrichment are shown in pink.
Figure 7—figure supplement 5
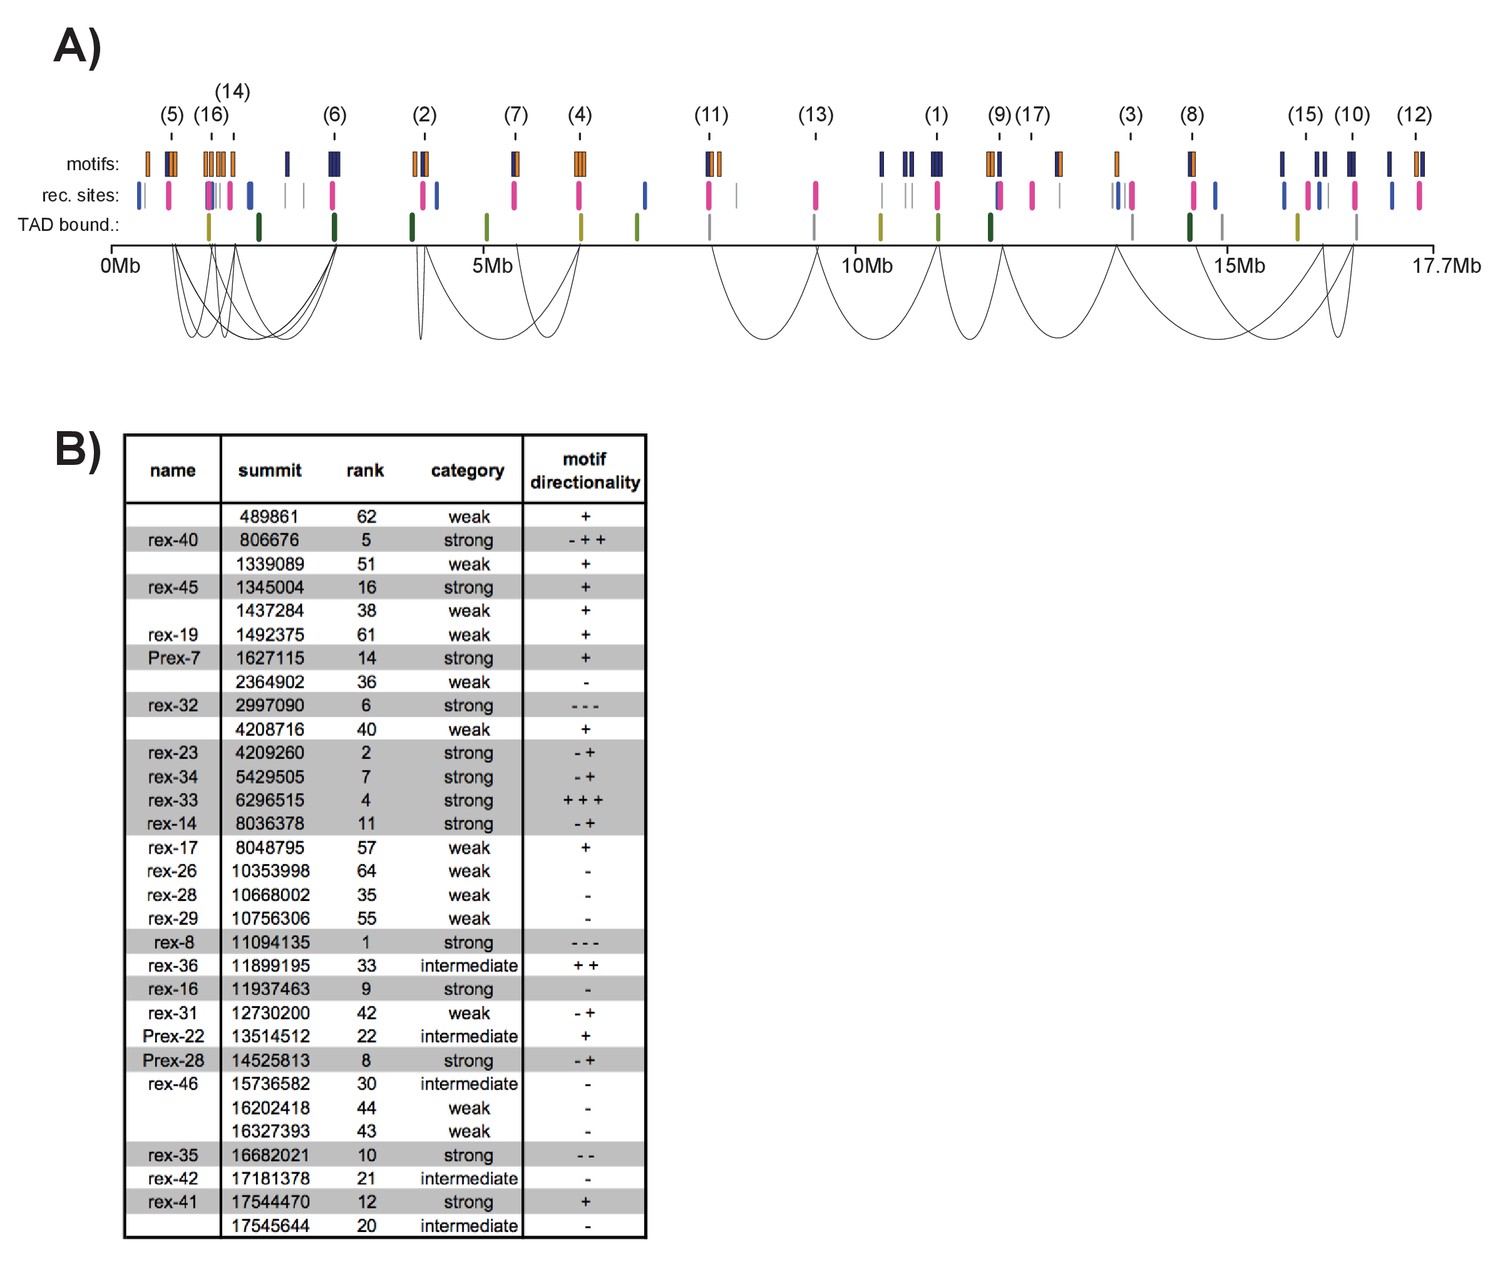
12-bp motif directionality and recruitment site interactions. .
(A) Motif directionality for all strong motifs (score ≥7) contained within annotated recruitment sites across the length of the X chromosome. The numbers in parenthesis indicate the rank of each recruitment site. Motifs on the plus strand are shown in yellow. Motifs on the minus strand are shown in blue. Locations of the recruitment sites are indicated. Strong recruitment sites are shown in pink, intermediate in blue, weak in grey. Insulation boundaries are plotted below the recruitment sites for reference. Insulation boundary strength is indicated: strongest boundaries are in dark green, weakest boundaries in light green. HiC data from (Crane et al., 2015) was used to plot the top 35% of contacts involving recruitment sites. (B) Table listing all recruitment sites, which contain at least one motif. Strong recruitment sites are highlighted. Motif directionality is indicated.
Figure 8
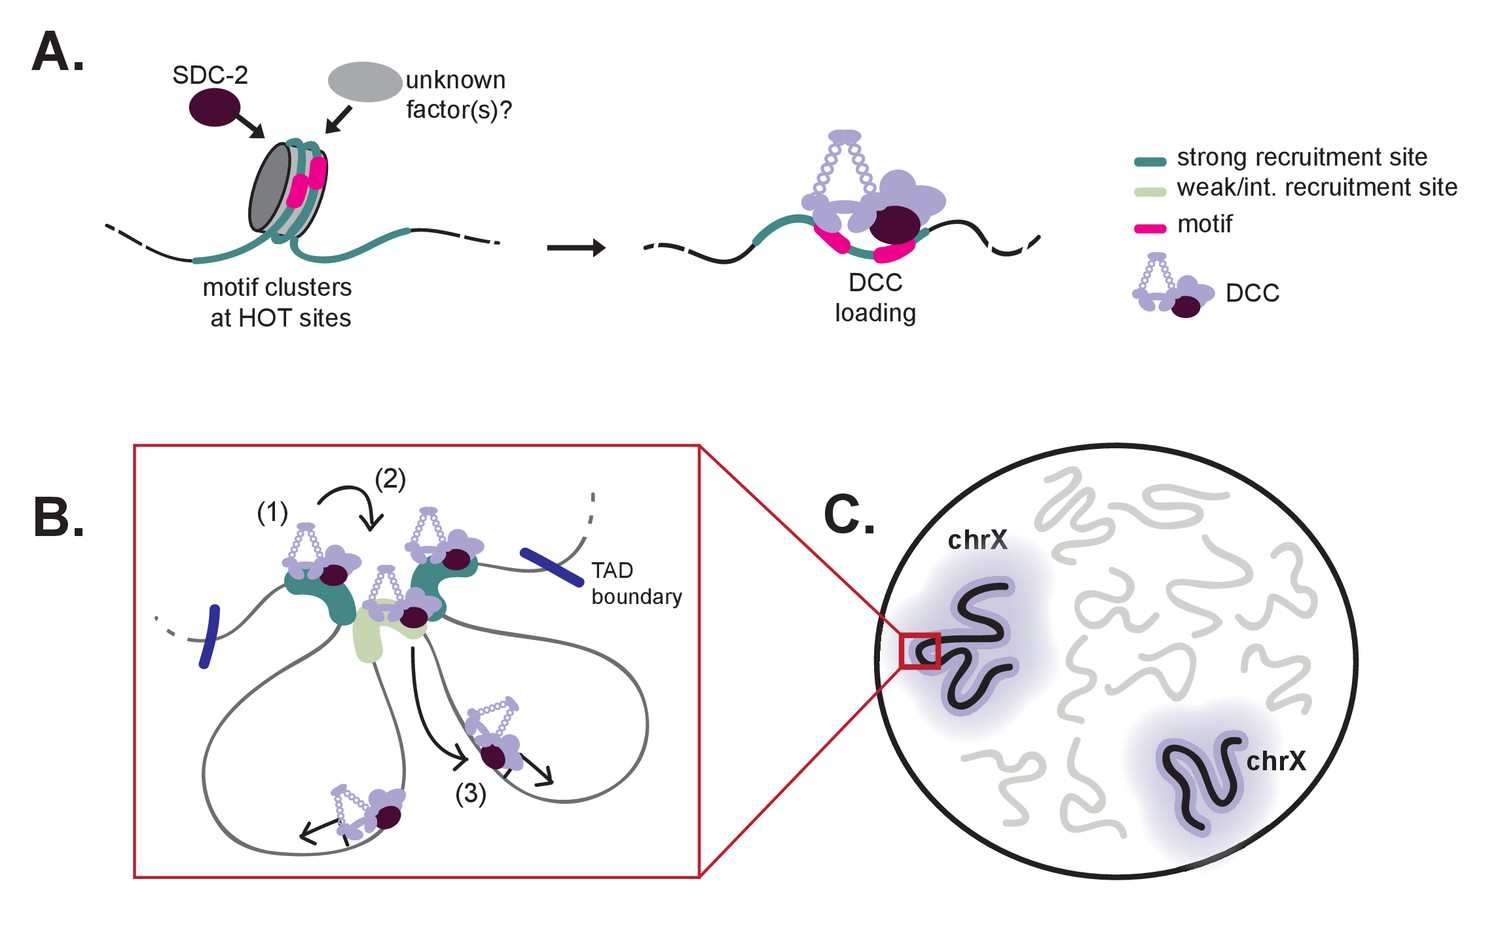
A model for X-specific DCC targeting involves SDC-2 recognizing a small number of initial recruitment sites, followed by cooperative recruitment and DCC spreading to distinct chromosomal domains.
(A) Initial X-recognition occurs at a subset of strong recruitment sites marked by motif clustering, overlap with HOT sites, and intrinsic nucleosome occupancy encoded in DNA. We hypothesize that nucleosome eviction at these HOT sites may be the function of SDC-2 and may additionally rely on yet-unidentified chromatin remodeling factors. SDC-2 binding is necessary to keep these sites open and allows for DCC binding. It is possible that, prior to sdc-2 expression, closed chromatin prevents improper DCC loading in early embryogenesis, thus ensuring hermaphrodite specificity. Furthermore, initial loading of DCC at a limited number of X-chromosome specific sites would decrease the evolutionary pressure to select for the 12 bp motif at every recruitment site. (B) Our working model is that DCC recruitment to strong recruitment sites (1) allows activation of the weaker recruitment sites (2) and spreading of the DCC within topologically associating domains (3). Robust recruitment is dependent on long-range cooperativity, which may function through some combination of long-distance physical interactions, high DCC concentration mediated by DCC sequestration, DCC post-translational modifications, and DCC spreading. (C) Cooperation between a set of hierarchical recruitment sites restricts DCC binding to the X chromosomes, establishing large, chromosome-wide transcriptionally repressive domains within the nucleus.
Additional files
-
Source code 1
Perl and R scripts for data analysis.
Perl scripts making up the ChIP-seq analysis pipeline are provided. R script and command lines for sliding window analysis of DCC binding changes across the X chromosome are provided.
- https://doi.org/10.7554/eLife.23645.021
-
Supplementary file 1
(A) Strain information.
The names and the genotypes of each strain are given in the sheet ‘strains’. Sequences for the sgRNAs and the primers used to generate the homology-mediated repair oligos are listed in the sheet ‘primers.’ Deletion and insertion coordinates as well as the inserted sequence are also indicated. (B) Data summary. The GEO accession numbers, total and mapped read counts, and antibody information are provided for the ChIP, RNA, and DNA-seq data. (C) qChIP primers. Primer sequences used for the qChIP experiments are provided. (D) Recruitment site information. The coordinates of the 64 DCC recruitment sites, the motifs contained within, and the recruitment strength category of each site are provided. (E) Motifs across the genome. Motif sequence and coordinates for all 12 bp motifs identified across the genome are provided. Supplementary file 1F: Annotation information. The annotation sources that are used in this manuscript.
- https://doi.org/10.7554/eLife.23645.022
Download links
A two-part list of links to download the article, or parts of the article, in various formats.
Downloads (link to download the article as PDF)
Open citations (links to open the citations from this article in various online reference manager services)
Cite this article (links to download the citations from this article in formats compatible with various reference manager tools)
Cooperation between a hierarchical set of recruitment sites targets the X chromosome for dosage compensation
eLife 6:e23645.
https://doi.org/10.7554/eLife.23645


