Substrate stiffness governs the initiation of B cell activation by the concerted signaling of PKCβ and focal adhesion kinase
- Tsinghua University, China
- Peking University, China
- Zhejiang University, China
- Chengdu Institute of Biology, Chinese Academy of Sciences, China
- Peking Union Medical College Hospital, Peking Union Medical College and Chinese Academy of Medical Sciences, China
- Peking University People's Hospital, China
Figures
Figure 1

Surrogate antigens tethered to stiff or soft PDMS substrate show similar surface density and accessibility for B cells.
(A) Distribution of Alexa 647-conjugated mouse IgM monoclonal antibody (clone M4) anti-chicken IgM as a surrogate antigen on the surface of PDMS substrates was equal and highly uniform as shown by confocal fluorescence microscopy. Scale bar is 3 µm. (B) Quantification of antigen density on both the surfaces of stiff and soft PDMS. (C) Representative confocal fluorescence microscope images showing the equal and highly uniform accessibility of the surrogate antigen on both the substrates as probed by the DyLight 649-conjugated Fab anti-mouse IgM antibody. Scale bar is 3 µm. (D) Quantification of antibody accessibility on both the surfaces of stiff and soft PDMS. Shown are mean ± SEM from one representative of three independent experiments. Two-tailed t tests were performed for statistical comparisons. (E) Representative images of the adhesion of DT40 B cells on the surface of either stiff or soft PDMS substrates before and after wash with 10 ml of PBS-1% FBS washing buffer. Scale bar is 50 µm. (F, G) Statistical quantification of the percentage of DT40 B cells adhered to stiff or soft substrates with or without tethered antigens. Adhesion rate is used for quantification as detailed in Materials and methods. The results were obtained using two different washing speeds of 0.5 (F) or 1 ml/sec (G) for a total amount of 10 ml of PBS-1% FBS washing buffer. Bar represents mean ± SEM from one representative of two independent experiments. Two-tailed t tests were performed for statistical comparisons.
Figure 2
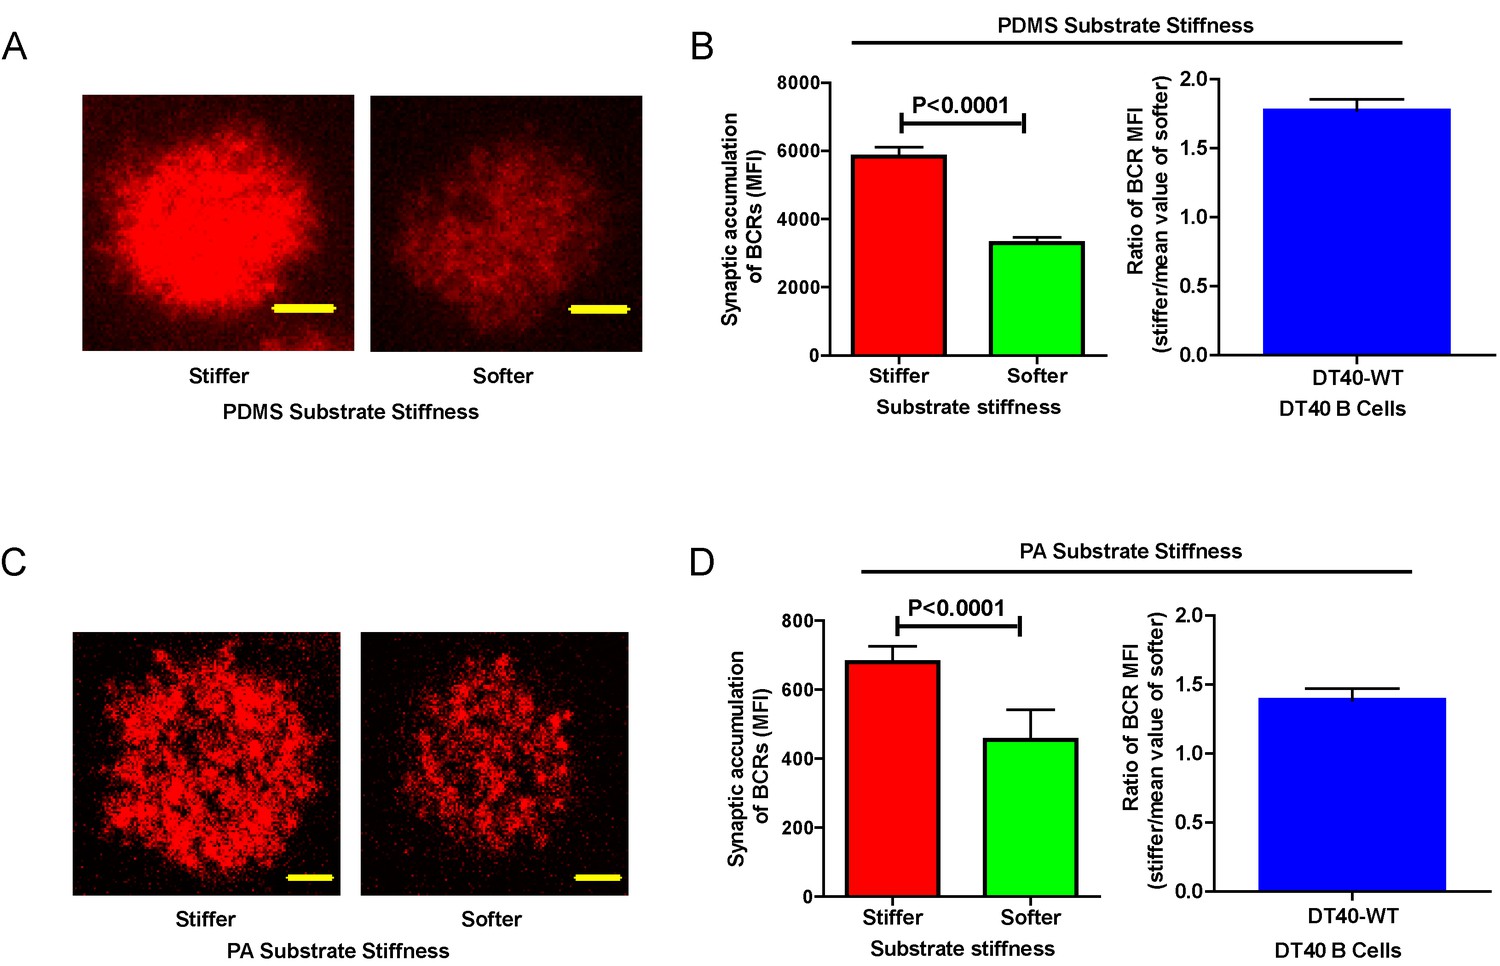
DT40-WT B cells exhibit excellent capability to discriminate substrate stiffness.
(A) Representative confocal images of DT40 B cells showing the contact interface with the antigens tethered on either stiff or soft PDMS substrates. Scale bar is 3 µm. (B) Synaptic accumulation of BCRs on either stiff or soft substrates and a ratio figure showing the BCR MFI of each cell on stiff substrates to the averaged value of the BCR MFI of all the cells on soft PDMS substrates. (C) Representative confocal images of DT40 B cells showing the contact interface with the antigens tethered on either stiff or soft PA substrates. Scale bar is 5 µm. (D) Synaptic accumulation of BCRs on either stiff or soft substrates and a ratio figure showing the BCR MFI of each cell on stiff substrates to the averaged value of the BCR MFI of all the cells on soft PA substrates. Bar represents mean ± SEM from one representative of two independent experiments. Two-tailed t tests were performed for statistical comparisons.
Figure 3 with 1 supplement

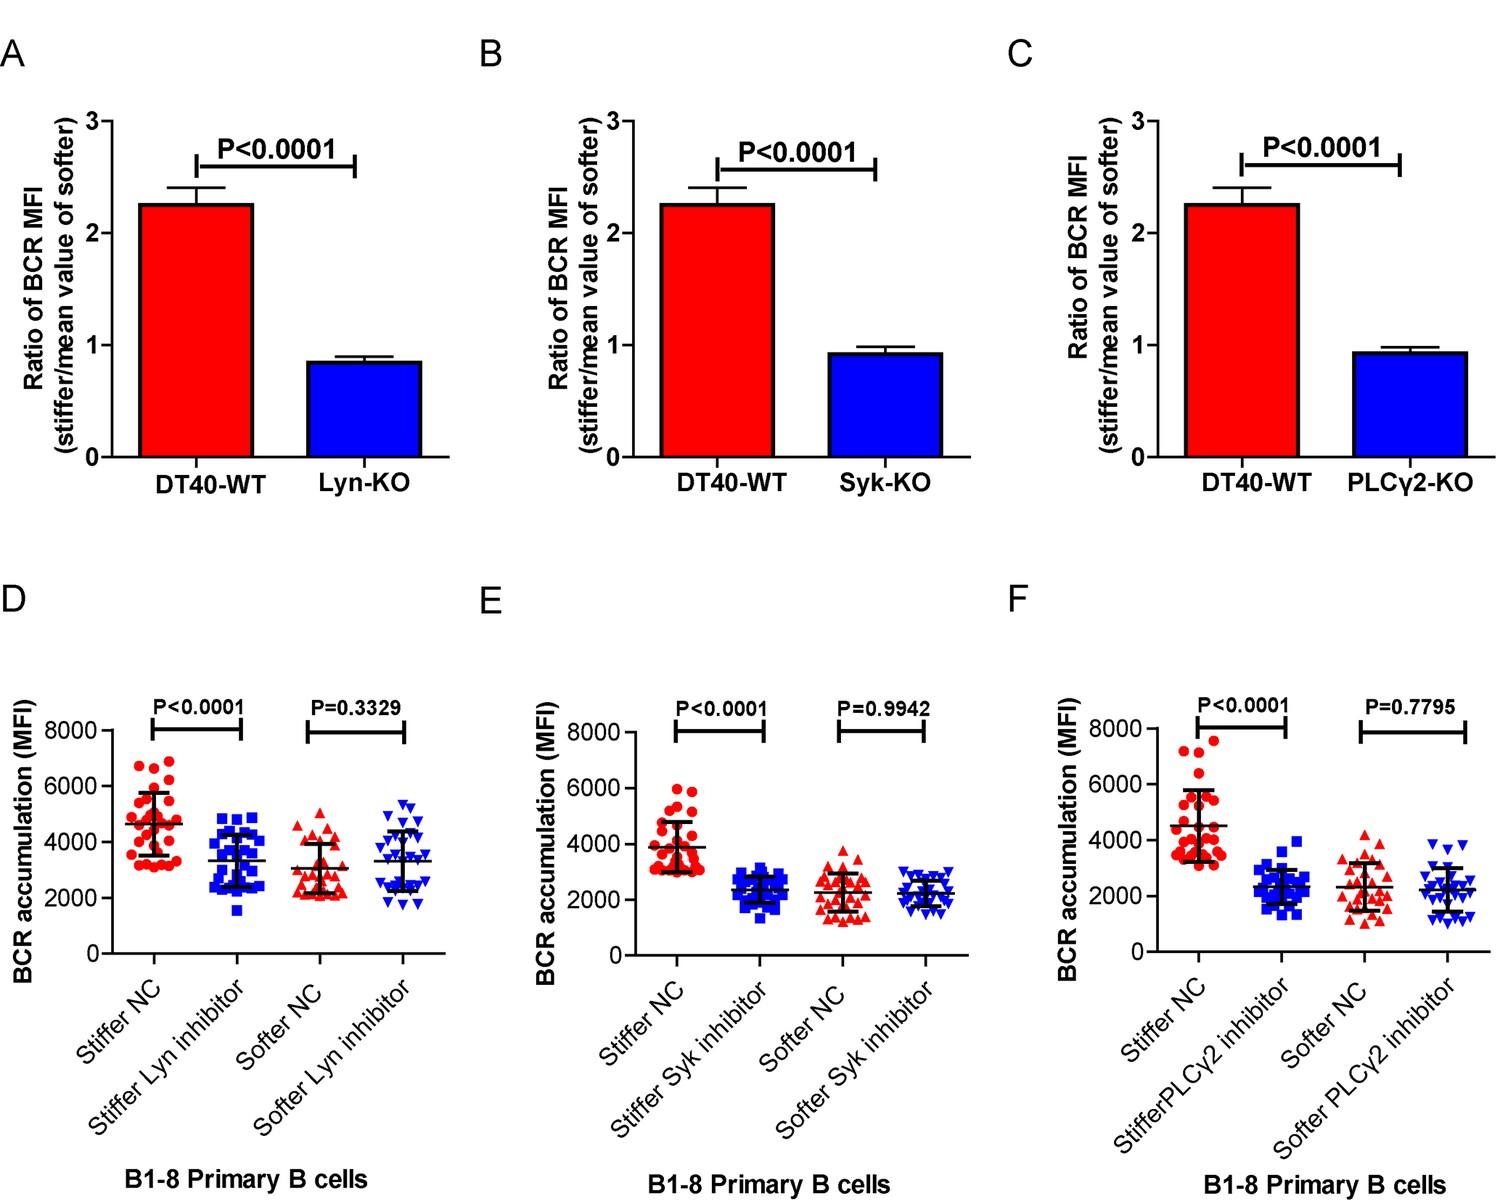
Lyn, Syk, and PLCγ2 are required for B cells to discriminate substrate stiffness.
(A–C) Statistical comparison for the substrate stiffness discrimination capability of B cells from the following three groups: (A) DT40-WT, DT40-Lyn-KO, and DT40-Lyn-Rescue cells; (B) DT40-WT, DT40-Syk-KO, and DT40-Syk-Rescue cells; (C) DT40-WT, DT40-PLCγ2-KO, and DT40-PLCγ2-Rescue cells. The calculation of ratio of BCR MFI is defined as the BCR MFI of each cell on stiff substrates to the averaged value of the BCR MFI of all the cells on soft substrates. (D–F) B1-8 primary B cell pre-treatment with DMSO as a control (NC) versus Lyn inhibitor PP2 (D), Syk inhibitor Piceatannol (E), and PLCγ2 inhibitor U73122 (E). (G–I) CH27 B cell pre-treatment with DMSO as a control (NC) versus Lyn inhibitor PP2 (G), Syk inhibitor Piceatannol (H) and PLCγ2 inhibitor U73122 (I). In (A) to (I), bar represents mean ± SEM from at least 20 cells in one representative of three independent experiments. Two-tailed t tests were performed for statistical comparisons.
Figure 3—figure supplement 1
Lyn, Syk, PLCγ2, Btk, BLNK, or PKCβ molecules are required for B cells to discriminate between stiff and soft substrates.
(A–C) Ratio data on PA substrate showing the BCR MFI of each cell on stiff substrates to the averaged value of the BCR MFI of all the cells on soft substrates in a comparison of the following groups: (A) DT40-WT, DT40-Lyn-KO, (B) DT40-WT, DT40-Syk-KO, and (C) DT40-WT, DT40-PLCγ2-KO. In (A)-(C), bar represents mean ± SEM from at least 25 cells in one representative of at least two independent experiments. Two-tailed t tests were performed for statistical comparisons. (D–F) Inhibitor treatment of signaling molecules (Lyn, Syk, PLCγ2) primarily blocked the synaptic accumulation of BCRs on stiff substrates, while the changes of BCR MFI on soft substrates were very mild in the comparison of inhibitor treated versus DMSO control B cells. In (D)-(F), bar represents mean ± SD from at least 25 cells in one representative of at least two independent experiments. Two-tailed t tests were performed for statistical comparisons.
Figure 4 with 1 supplement
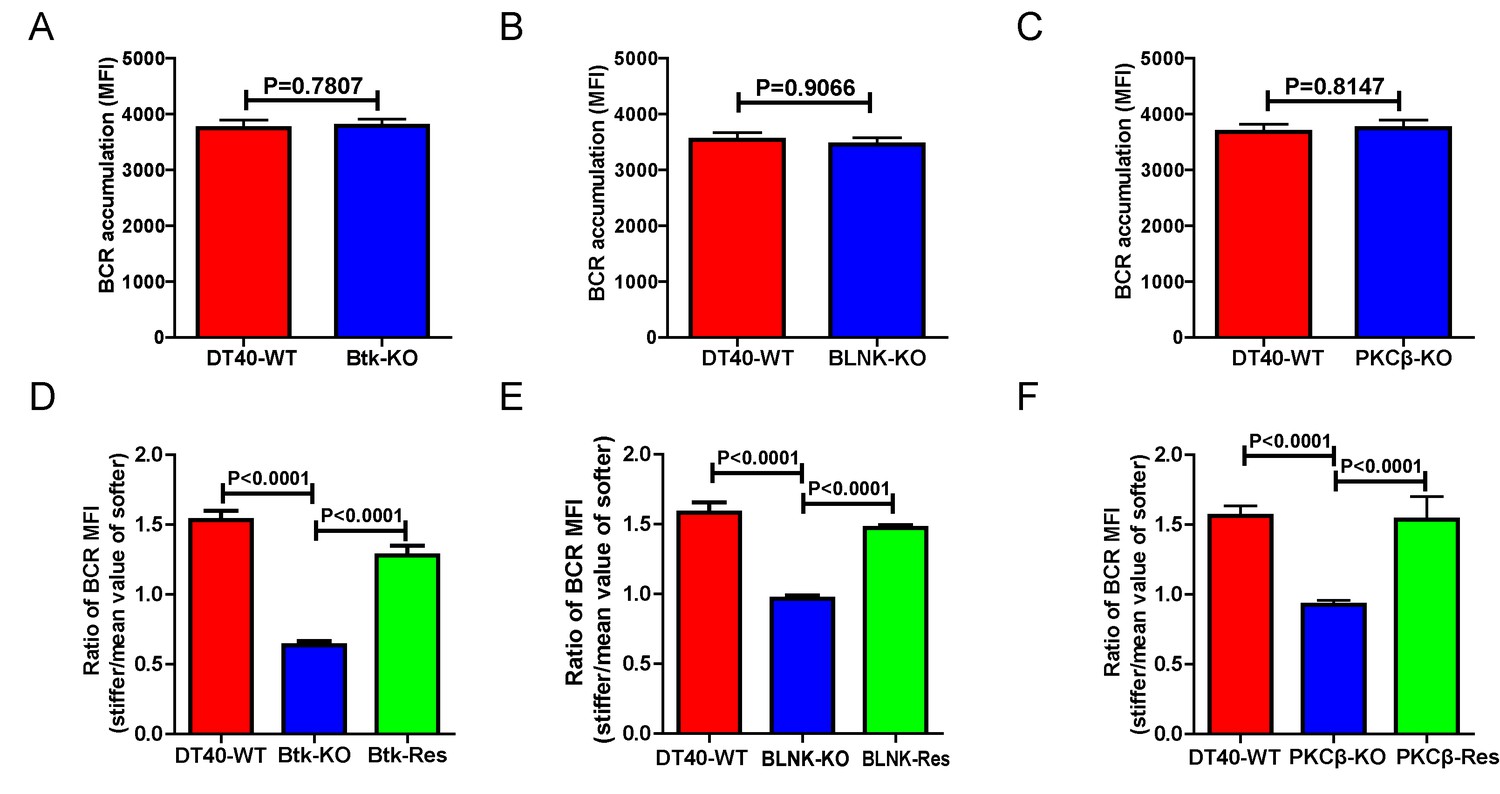
Genetic ablation of Btk, BLNK, or PKCβ blunts the ability of B cells to discriminate substrate stiffness.
(A–C) B cells showed comparable capability to accumulate BCRs into B cell IS in the following groups (A) DT40-WT and DT40-Btk-KO; (B) DT40-WT and DT40-BLNK-KO; and (C) DT40-WT, DT40-PKCβ-KO. (D–F) Statistical comparison for the substrate stiffness discrimination capability of B cells from the following three groups: (D) DT40-WT, DT40-Btk-KO, and DT40-Btk-Rescue cells; (E) DT40-WT, DT40-BLNK-KO, and DT40-BLNK-Rescue cells; (F) DT40-WT, DT40-PKCβ-KO, and DT40-PKCβ-Rescue cells. In (A)-(F), bar represents mean ± SEM from at least 27 cells in one representative of three independent experiments. Two-tailed t tests were performed for statistical comparisons.
Figure 4—figure supplement 1
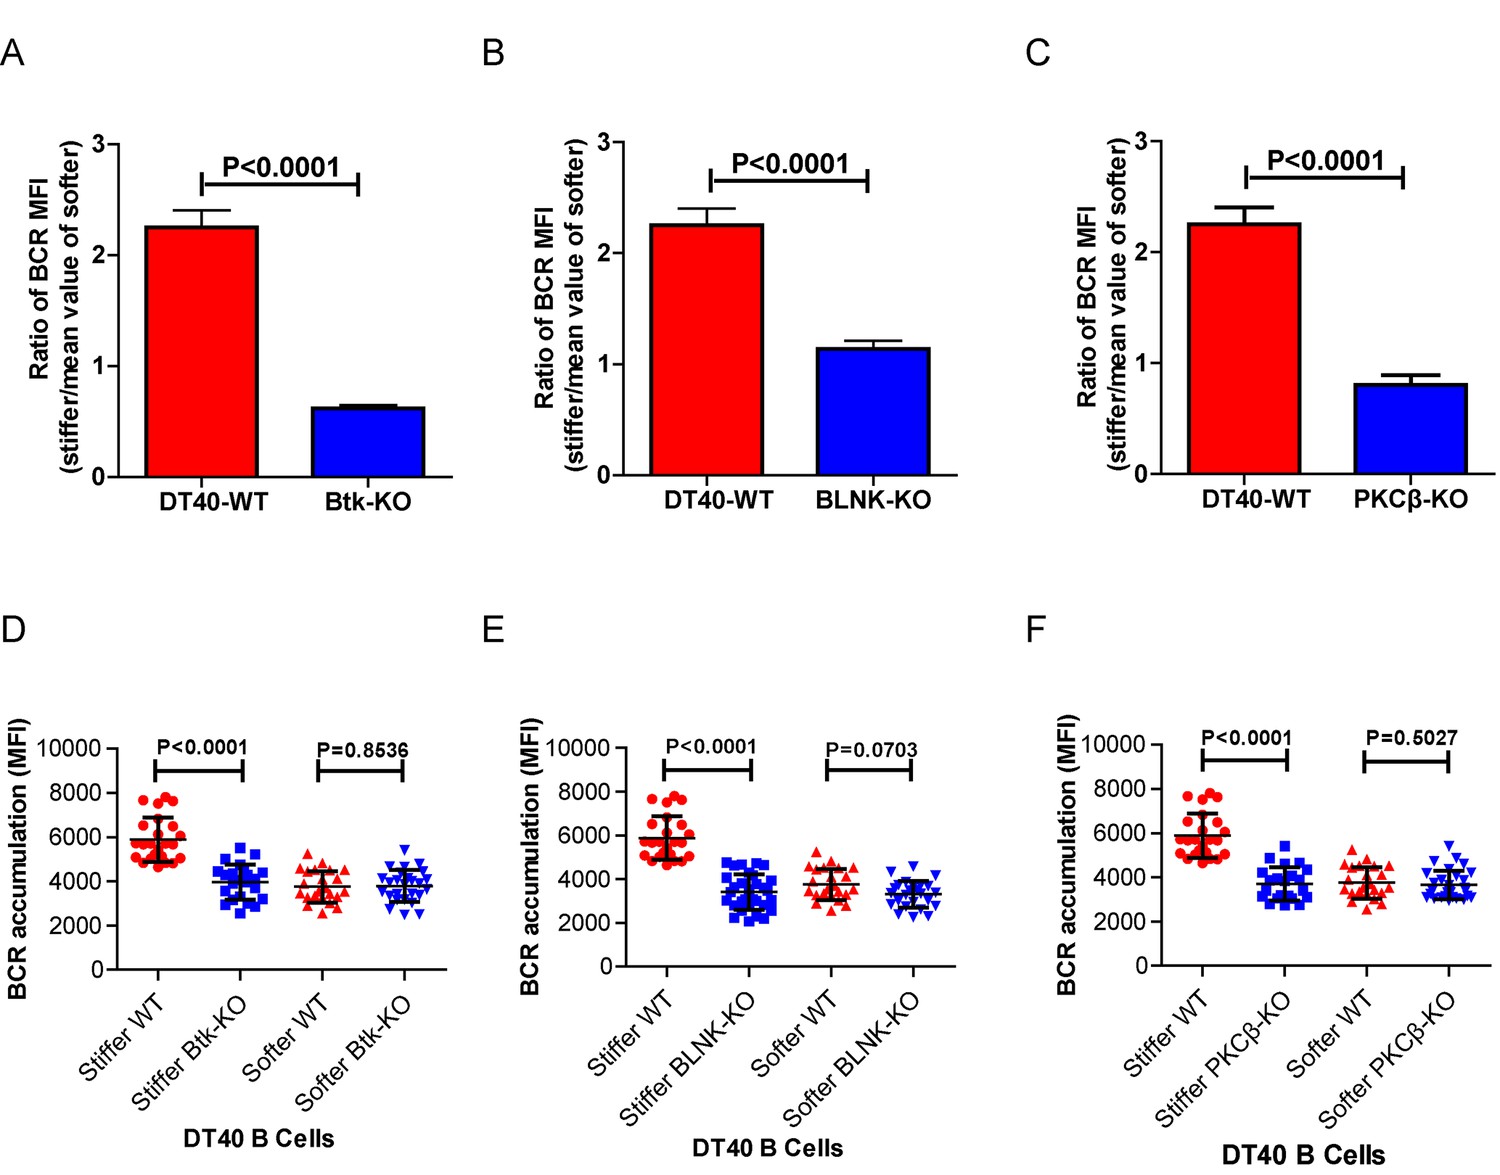
Genetic ablation of Btk, BLNK, or PKCβ blunts the ability of B cells to discriminate substrate stiffness.
(A–C) Ratio data on PA substrate showing the BCR MFI of each cell on stiff substrates to the averaged value of the BCR MFI of all the cells on soft substrates in a comparison of the following groups: (A) DT40-WT, DT40-Btk-KO, (B) DT40-WT, DT40-BLNK-KO; and (C) DT40-WT, DT40-PKCβ-KO. In (A)-(C), bar represents mean ± SEM from at least 25 cells in one representative of at least two independent experiments. Two-tailed t tests were performed for statistical comparisons. (D–F) Deficiency of proximal signaling molecules primarily blocked the synaptic accumulation of BCRs on stiff substrates, while the changes of BCR MFI on soft substrates were very mild in the comparison of KO versus WT B cells. In (D)-(F), bar represents mean ± SD from at least 25 cells in one representative of at least two independent experiments. Two-tailed t tests were performed for statistical comparisons.
Figure 5

PMA-induced activation of PKCβ can bypass the requirements of Btk and PLCγ2 for B cells to discriminate substrate stiffness.
(A–D) Statistical comparison for the substrate stiffness discrimination capability of PMA pre-treated B cells in the following groups: (A) DT40-WT and DT40-PLCγ2-KO; (B) DT40-WT and DT40-Btk-KO; (C) DT40-WT and DT40-BLNK-KO; and (D) DT40-WT and DT40- PKCβ-KO. (E) DT40-WT versus DT40-PKCβ-KO B cells that were pre-treated with high concentration of 100 ng/ml PMA. (F) DT40 WT B cells treated with PMA plus DMSO as a control or PMA plus PKCβ inhibitor. In (A)-(F), bar represents mean ± SEM from at least 21 cells in one representative of three independent experiments. Two-tailed t tests were performed for statistical comparisons.
Figure 6 with 1 supplement
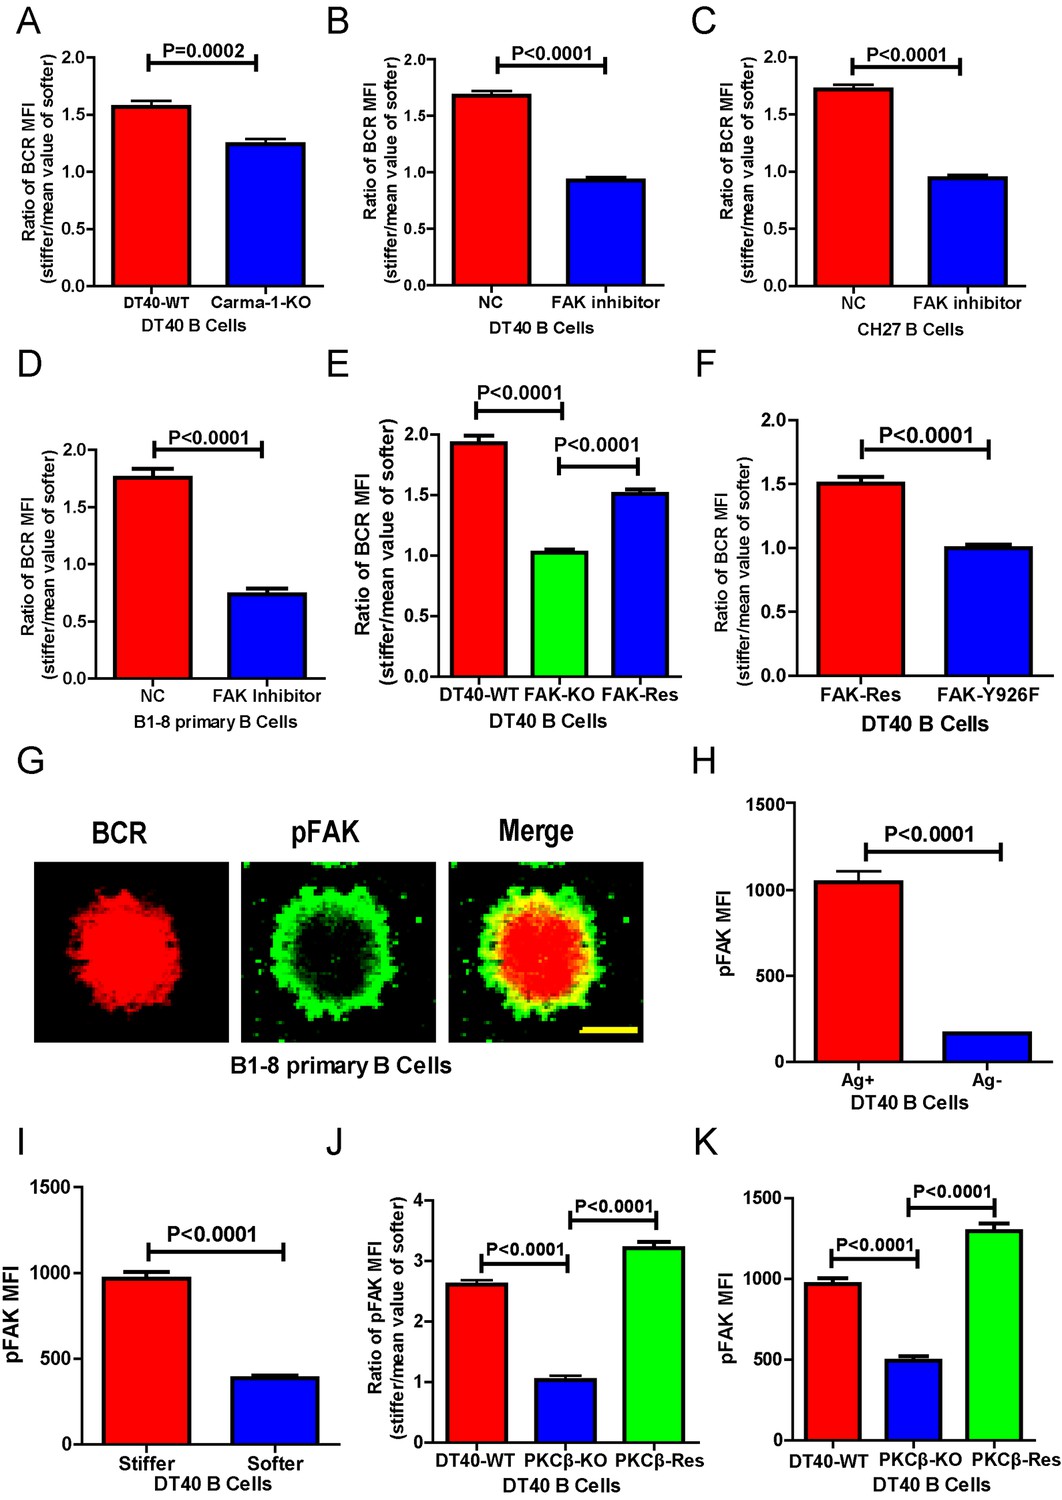
PKCβ-dependent FAK activation accounts for B cells to discriminate substrate stiffness.
(A) Statistical comparison for the substrate stiffness discrimination capability of DT40-WT versus DT40-Carma-1-KO B cells. (B–D) Statistical comparison for the substrate stiffness discrimination capability of DT40-WT (B), CH27 (C), or B1-8 primary (D) B cells that were pre-treated with either DMSO as a control (NC) or FAK inhibitor PF573-228 (FAK inhibitor). (E) Statistical comparison for the substrate stiffness discrimination capability of DT40-WT, DT40-FAK-KO, and DT40-FAK-Rescue B cells. (F) Statistical comparison for the substrate stiffness discrimination capability of DT40-FAK-Rescue and FAK-Y926F Mutant B cells. (G) The representative confocal images of B1-8 primary B cells showing the spatial co-distribution of BCR and pFAK (Tyr 925) molecules within the B cell immunological synapse. Scale bar is 4 µm. (H) Statistical comparison of the MFI of pFAK molecules within the B cell immunological synapse of DT40-WT B cells that were placed on the PDMS substrates presenting antigen or lacking antigen. (I) Statistical comparison of the MFI of pFAK molecules within the B cell immunological synapse of DT40-WT B cells that were placed on the antigen-presenting surfaces of either stiff or soft PDMS substrates. (J) Statistical comparison for the substrate stiffness discrimination capability of DT40-WT, DT40-PKCβ-KO, and DT40-PKCβ-Rescue B cells. (K) Statistical comparison of the MFI of pFAK molecules within the B cell immunological synapse of DT40-WT, DT40-PKCβ-KO, and DT40-PKCβ-Rescue B cells in response to antigen stimulation. In (A)–(F) and (H)–(K), bar represents mean ± SEM from at least 30 cells in one representative of three independent experiments. Two-tailed t tests were performed for statistical comparisons.
Figure 6—figure supplement 1
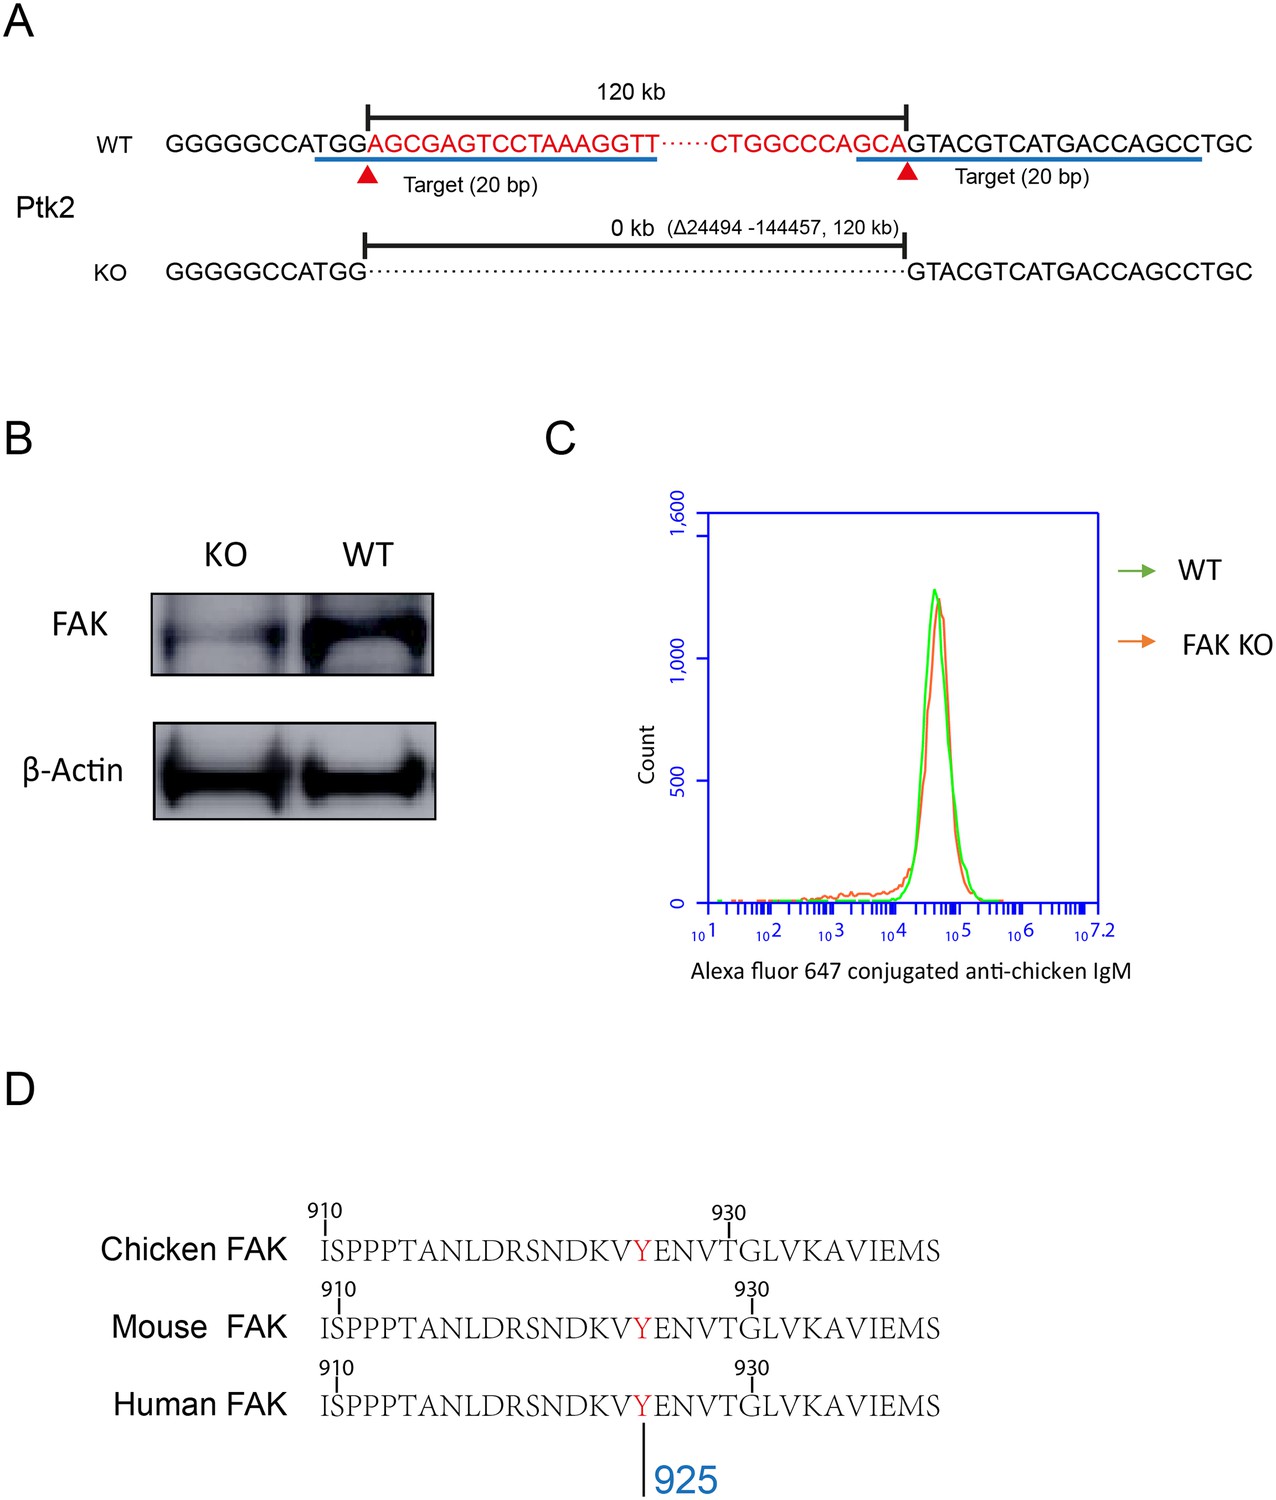
PKCβ-dependent FAK activation accounts for B cells to discriminate substrate stiffness.
(A) FAK (PTK2) gene knock-out through CRISPR/Cas9 technique. (B) Western blot confirmed the FAK-KO efficiency compared with that of the WT. (C) DT40-WT and FAK-KO B cells showed equal BCR expression levels. (D) Sequence homology comparison showed the similarity of DT40-FAK-Tyr926 with Mouse and Human FAK-Tyr925.
Figure 7
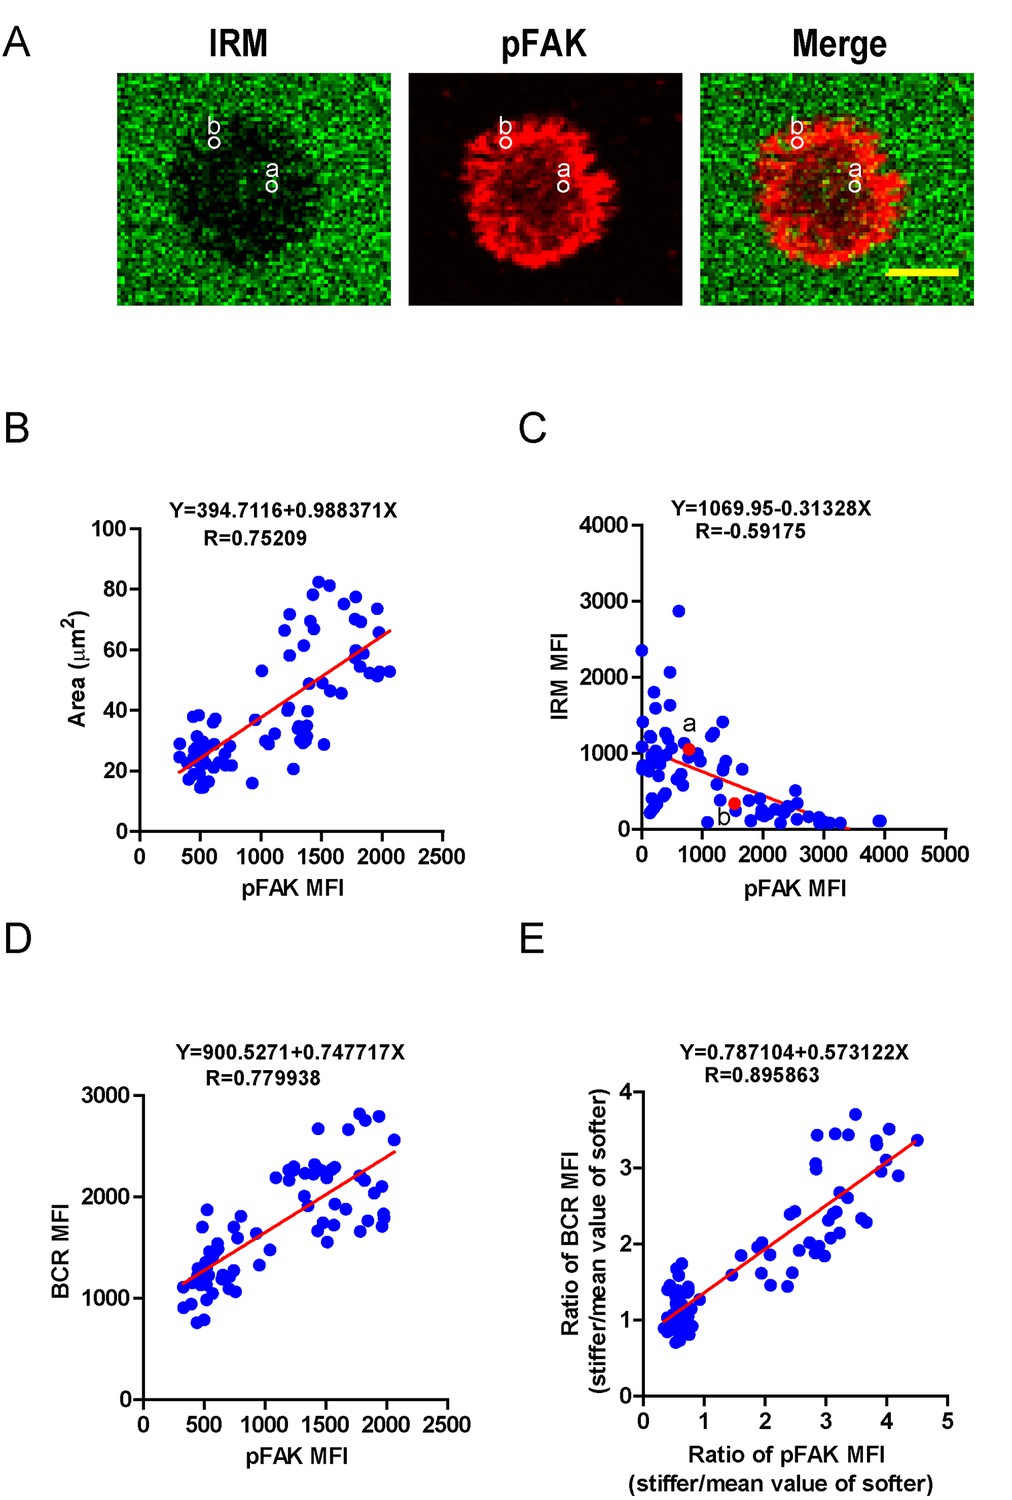
PKCβ-dependent FAK activation accounts for B cell discrimination capability by potentiating B cell spreading and adhesion responses.
(A) Representative confocal images showing the adhesion strength of B cells on the basis of IRM. In both IRM and pFAK images, two representative region of interests (ROIs, (a and b) demonstrated the calculation of the IRM and pFAK MFI within the same ROI. Scale bar is 4 µm. (B–D) Correlation analysis of the pFAK MFI with the size of spreading area (B), the adhesion strength on the basis of IRM MFI (C), or the BCR MFI (D). (E) Correlation analysis of the ratio of the pFAK MFI to the ratio of BCR MFI. Data in B, D, E were analyzed based on the contact area of a single cell, thus one dot represents one cell; while data in (C) were analyzed based in a ROI within a cell’s contact area as demonstrated in (A), thus one dot represents one ROI. In (B)–(E), inserted correlation function was the linear regression analysis; data are one representative of at least two independent experiments.
Figure 8
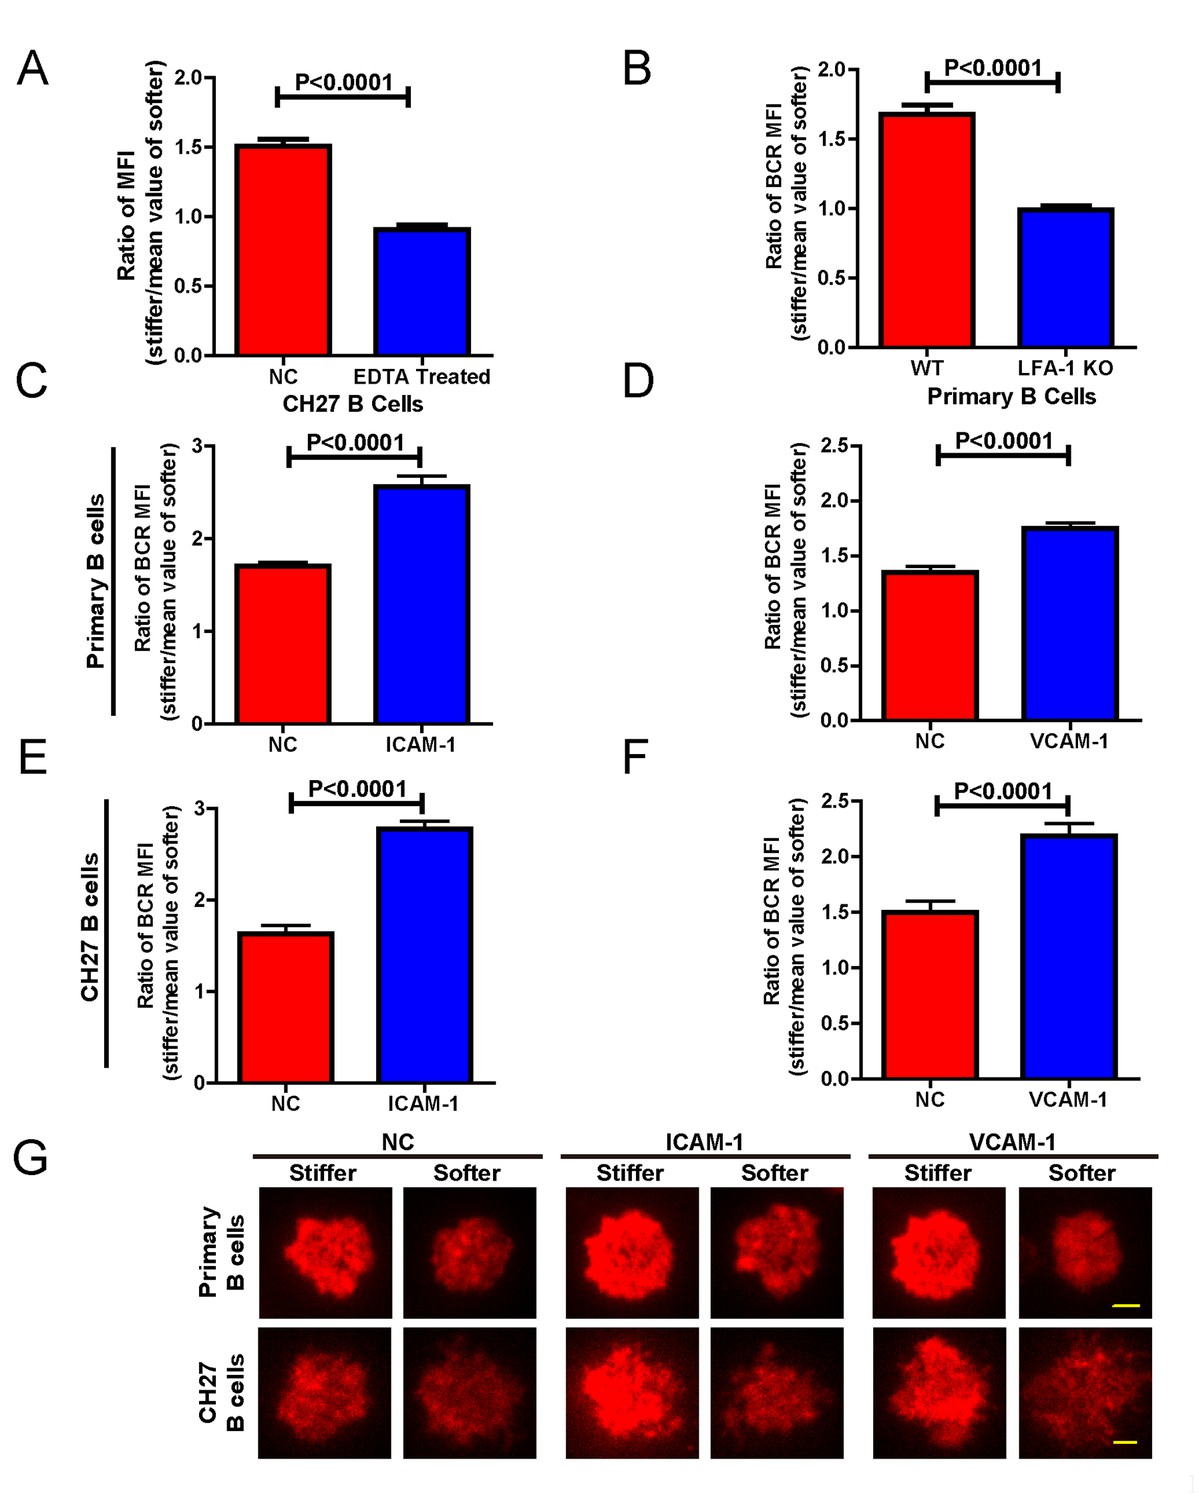
Adhesion molecules enhance B cell’s capability to discriminate between stiff and soft substrates.
(A) Blocking the integrin with EDTA reduces the ratio of BCR MFI of CH27 B cells. (B) LFA-1 KO primary B cells lost the substrate stiffness discrimination compared with the WT B cells. (C–F) Adhesion molecules, ICAM-1 and VCAM-1, enhanced the B cell’s capability to discriminate between stiff and soft substrates as shown in B1-8 primary B cells (C, D) or CH27 B cells (E, F). (G) Representative confocal images showing the synaptic accumulation of BCRs from either B1-8 Primary B cells or CH27 B cells that were placed on antigen-presenting substrates with the additional condition of lacking (NC) or presenting adhesion molecules. Scale bar is 3 µm. Bar represents mean ± SEM from one representative of three independent experiments. Data were from at least 20 cells. Two-tailed t tests were performed for statistical comparisons.
Figure 9 with 3 supplements
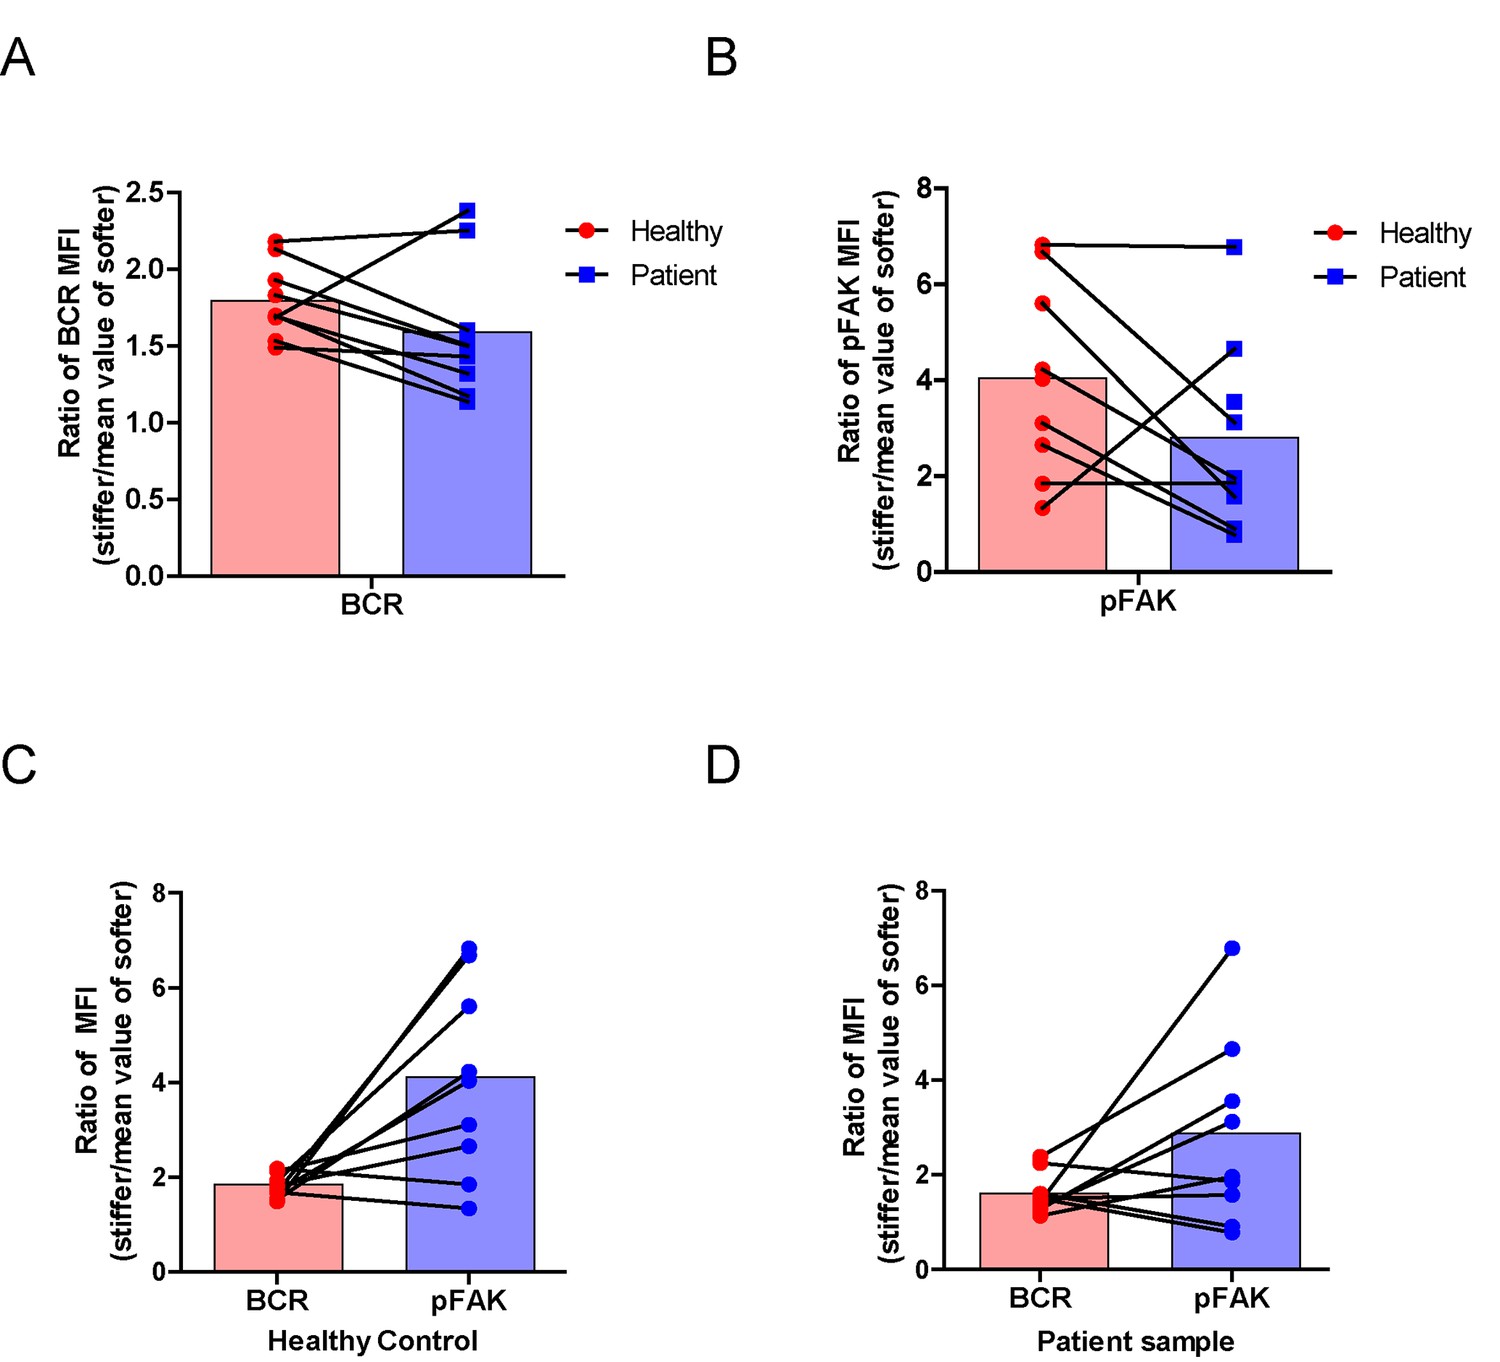
RA patient B cells exhibited disordered capability to discriminate substrate stiffness.
(A, B) Paired comparison of healthy control and RA patient B cells on the basis of ratio of either BCR MFI (A) or pFAK MFI (B). (C, D) Paired comparison of the ratio of BCR MFI and pFAK MFI on the basis of either healthy control or RA patient B cells.
Figure 9—figure supplement 1
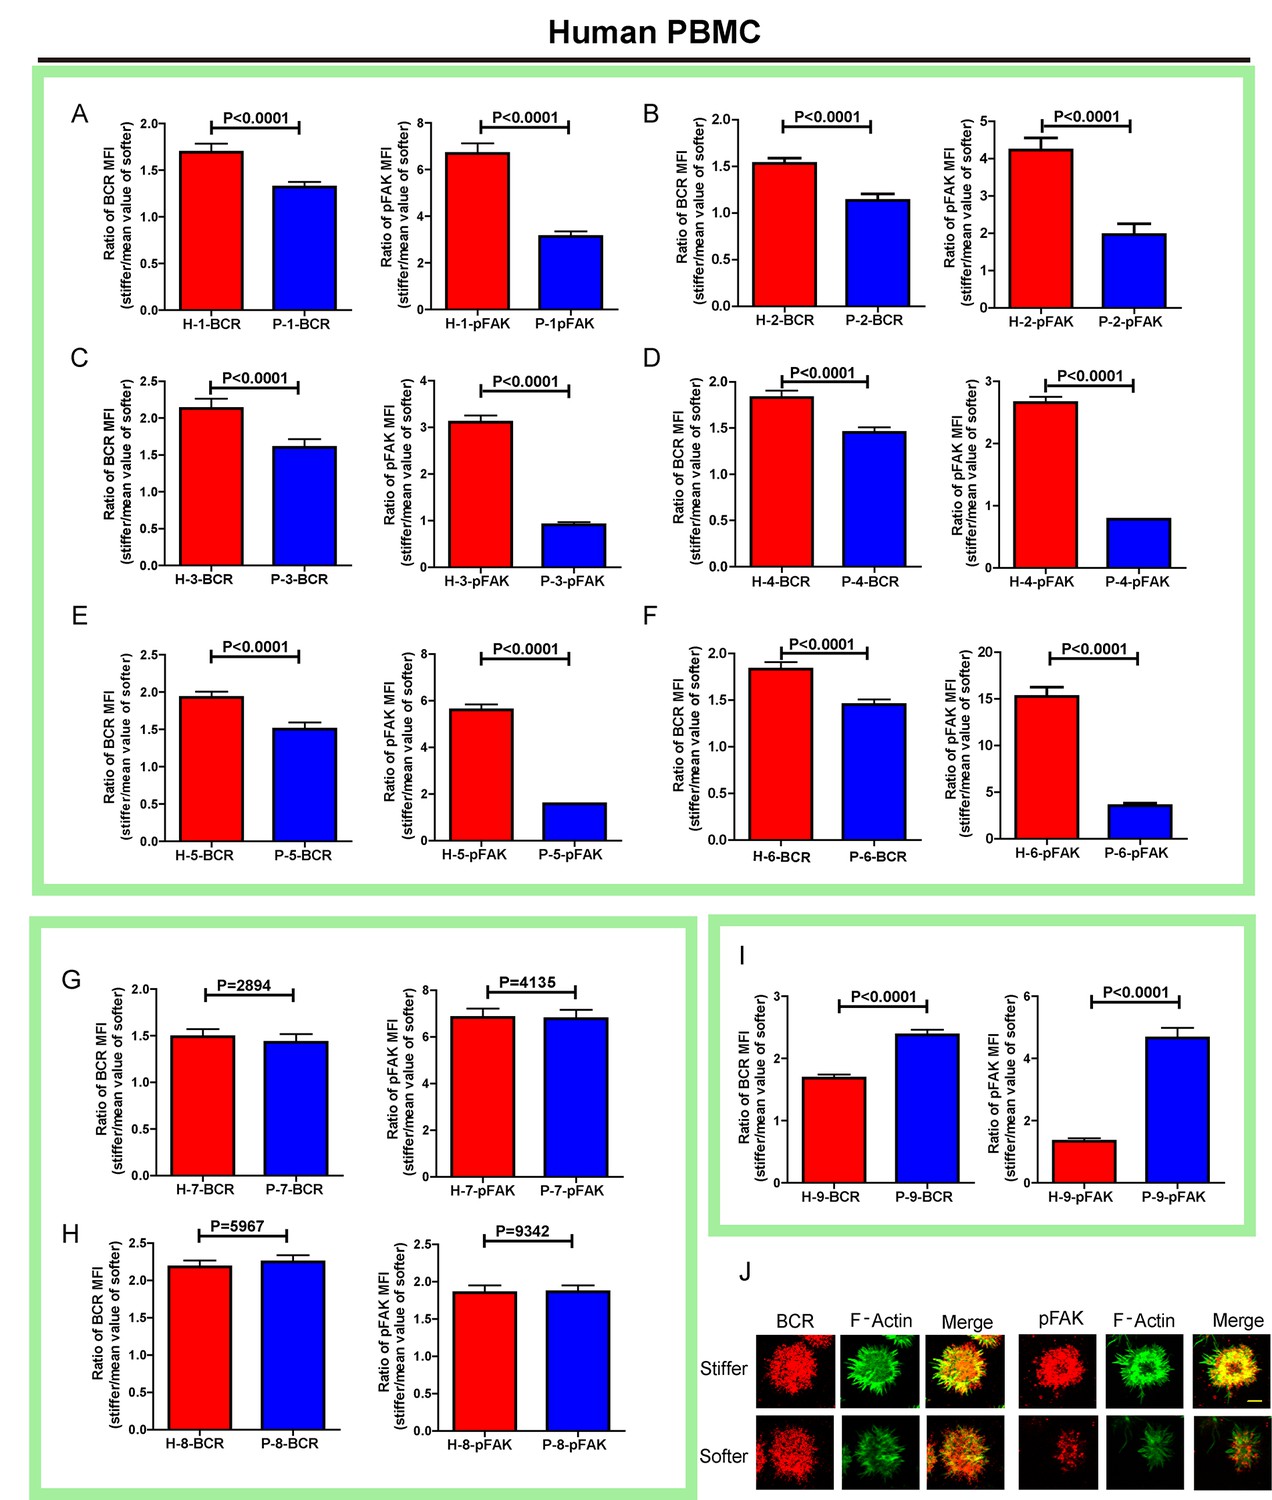
RA patient B cells exhibited disordered capability to discriminate substrate stiffness.
(A–I) Comparison of original ratio data of BCR or pFAK MFI between first six pairs of the healthy control and RA patient B cells in which patients showed weak discrimination capability of substrate stiffness (A–F); two pairs showed comparable substrate stiffness discrimination between healthy control and RA patient B cells (G–H); while one pair showed a higher level of substrate stiffness discrimination in RA patient B cells than healthy control B cells (I). Bar represents mean ± SEM from at least 20 cells. Two-tailed t tests were performed for statistical comparisons. (J) Representative confocal Images showing the colocalization of BCR and F-actin or the colocalization between pFAK and F-actin on stiff or soft PDMS substrate. Scale bar is 3 µm.
Figure 9—figure supplement 2

RA patient B cells exhibited disordered capability to discriminate substrate stiffness.
(A-1) Comparison of the BCR MFI of B cells from the paired healthy controls versus RA patients on either stiff or soft substrates. The results show that B cells from healthy controls preferentially enhanced the synaptic accumulation of BCR microclusters on stiff substrates, while RA patient B cells exhibited a different preference of mainly enhancing the BCR accumulation on soft substrates. Bar represents mean ± SD from at least 20 cells. Two-tailed t tests were performed for statistical comparisons.
Figure 9—figure supplement 3
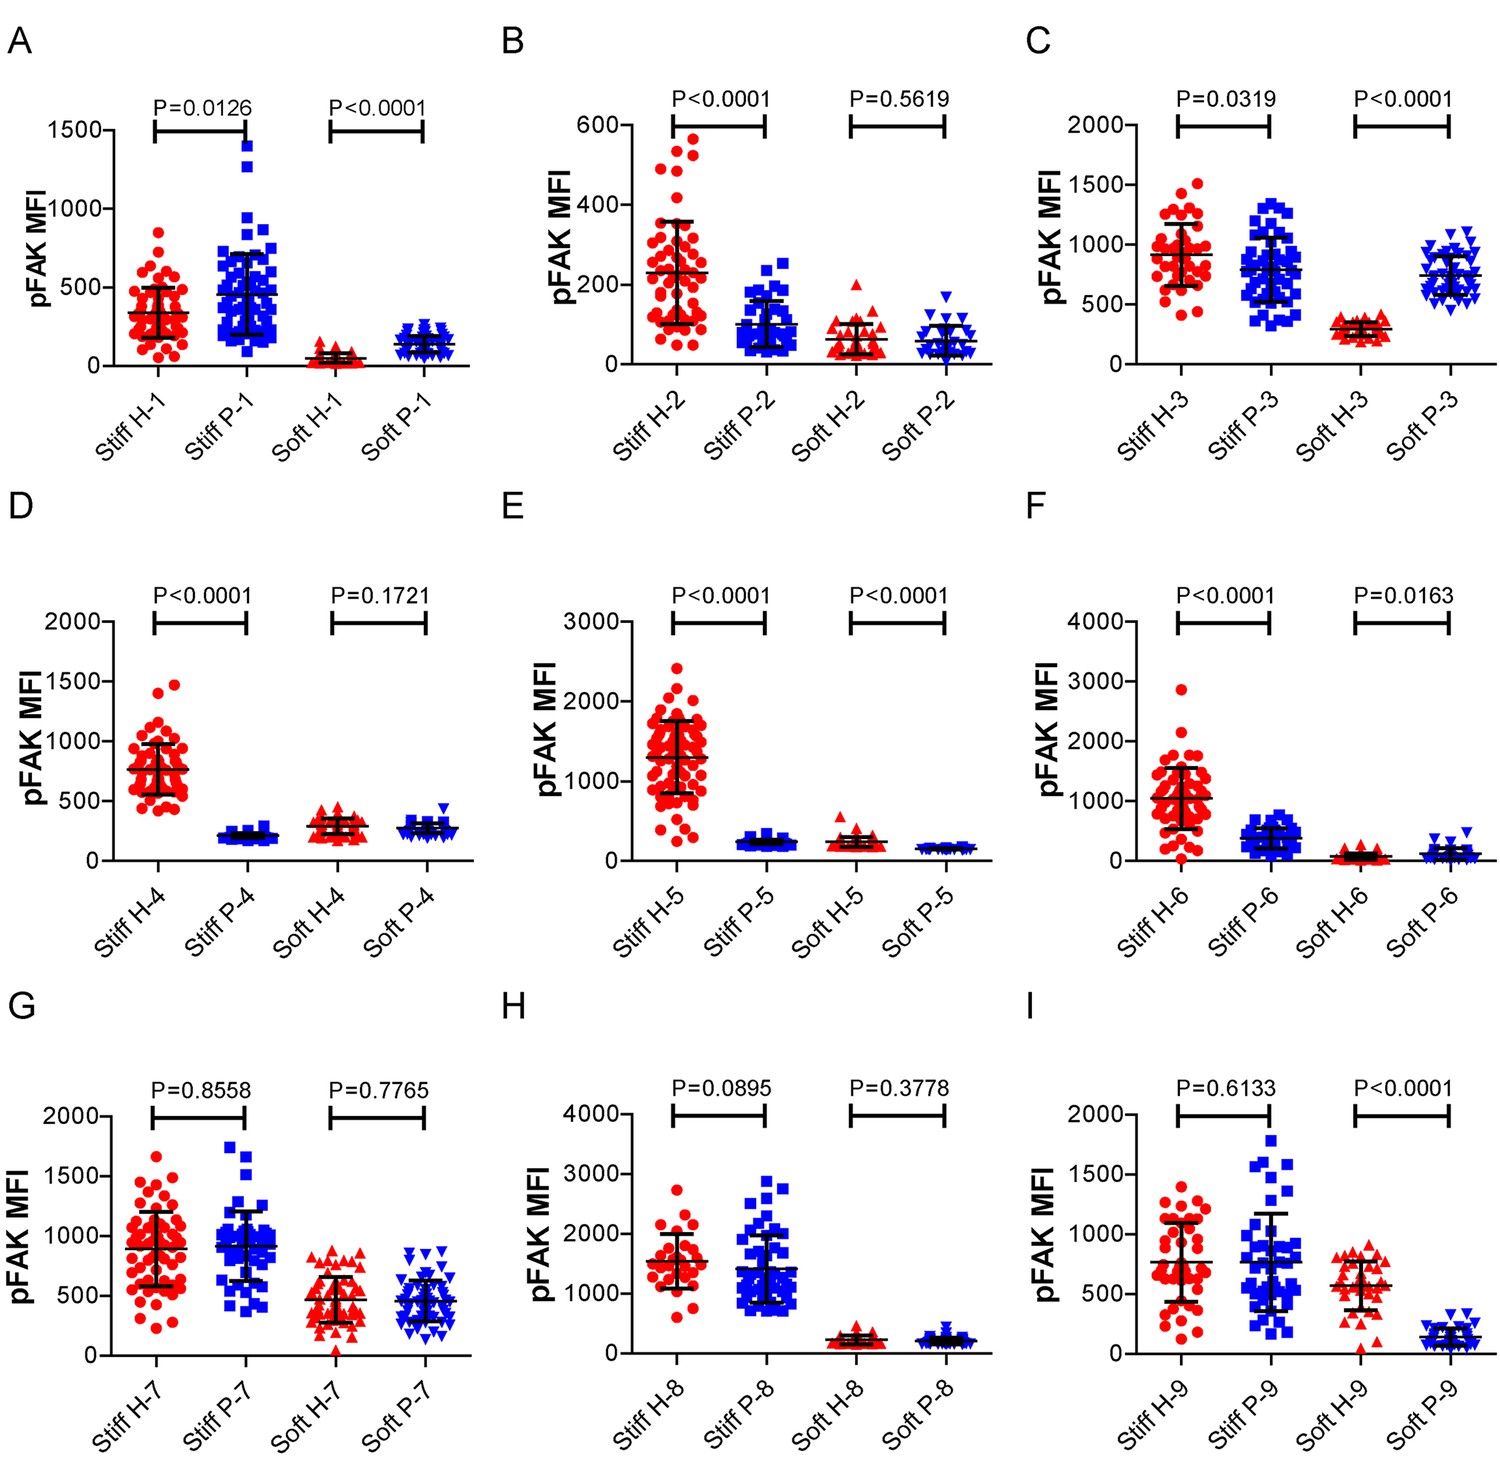
RA patient B cells exhibited disordered capability to discriminate substrate stiffness.
(A-I) Comparison of the pFAK MFI of B cells from the paired healthy controls versus RA patients on either stiff or soft substrates. The results showed that B cells from healthy controls preferentially enhanced pFAK MFI on stiff substrates, while RA patient B cells exhibited a different preference of mainly enhancing pFAK MFI on soft substrates. Bar represents mean ± SD from at least 20 cells. Two-tailed t tests were performed for statistical comparisons.
Tables
Table 1
Primer sequences used to amplify cDNA
| Gene name | Upstream primer | Downstream primer |
|---|---|---|
| Lyn | atgggatgtataaaatcaaaaagga | ctatggctgctgttgatattgcc |
| Syk | atggcttccaacatggccaacc | aatcaccctttacagcattatcatcaaggcatt |
| PLCγ2 | atgcctcgaaagagtgtagattatg | ttaagagtagaatttgctgttactg |
| Btk | atggccagcatcatcctg | tcacggctcttcgtctg |
| PKCβ | gcctaccccaagtccatgt | cttggtcatgagccctttg |
| FAK | ggcagcagcttaccttgatcc | ggcctggactggctgatcatt |
| BLNK | gcggccgcaccggtctgcagctagctggacaagctgaataagataactg | ctcaccatcgaagcagctcctcctcctgaaaccttcacagcatatttcagtc |
Download links
A two-part list of links to download the article, or parts of the article, in various formats.
Downloads (link to download the article as PDF)
Open citations (links to open the citations from this article in various online reference manager services)
Cite this article (links to download the citations from this article in formats compatible with various reference manager tools)
Substrate stiffness governs the initiation of B cell activation by the concerted signaling of PKCβ and focal adhesion kinase
eLife 6:e23060.
https://doi.org/10.7554/eLife.23060


