Transcriptional networks specifying homeostatic and inflammatory programs of gene expression in human aortic endothelial cells
- University of California, San Diego, United States
- University of Arizona, United States
- University of Western Michigan, United States
Figures
Figure 1 with 3 supplements
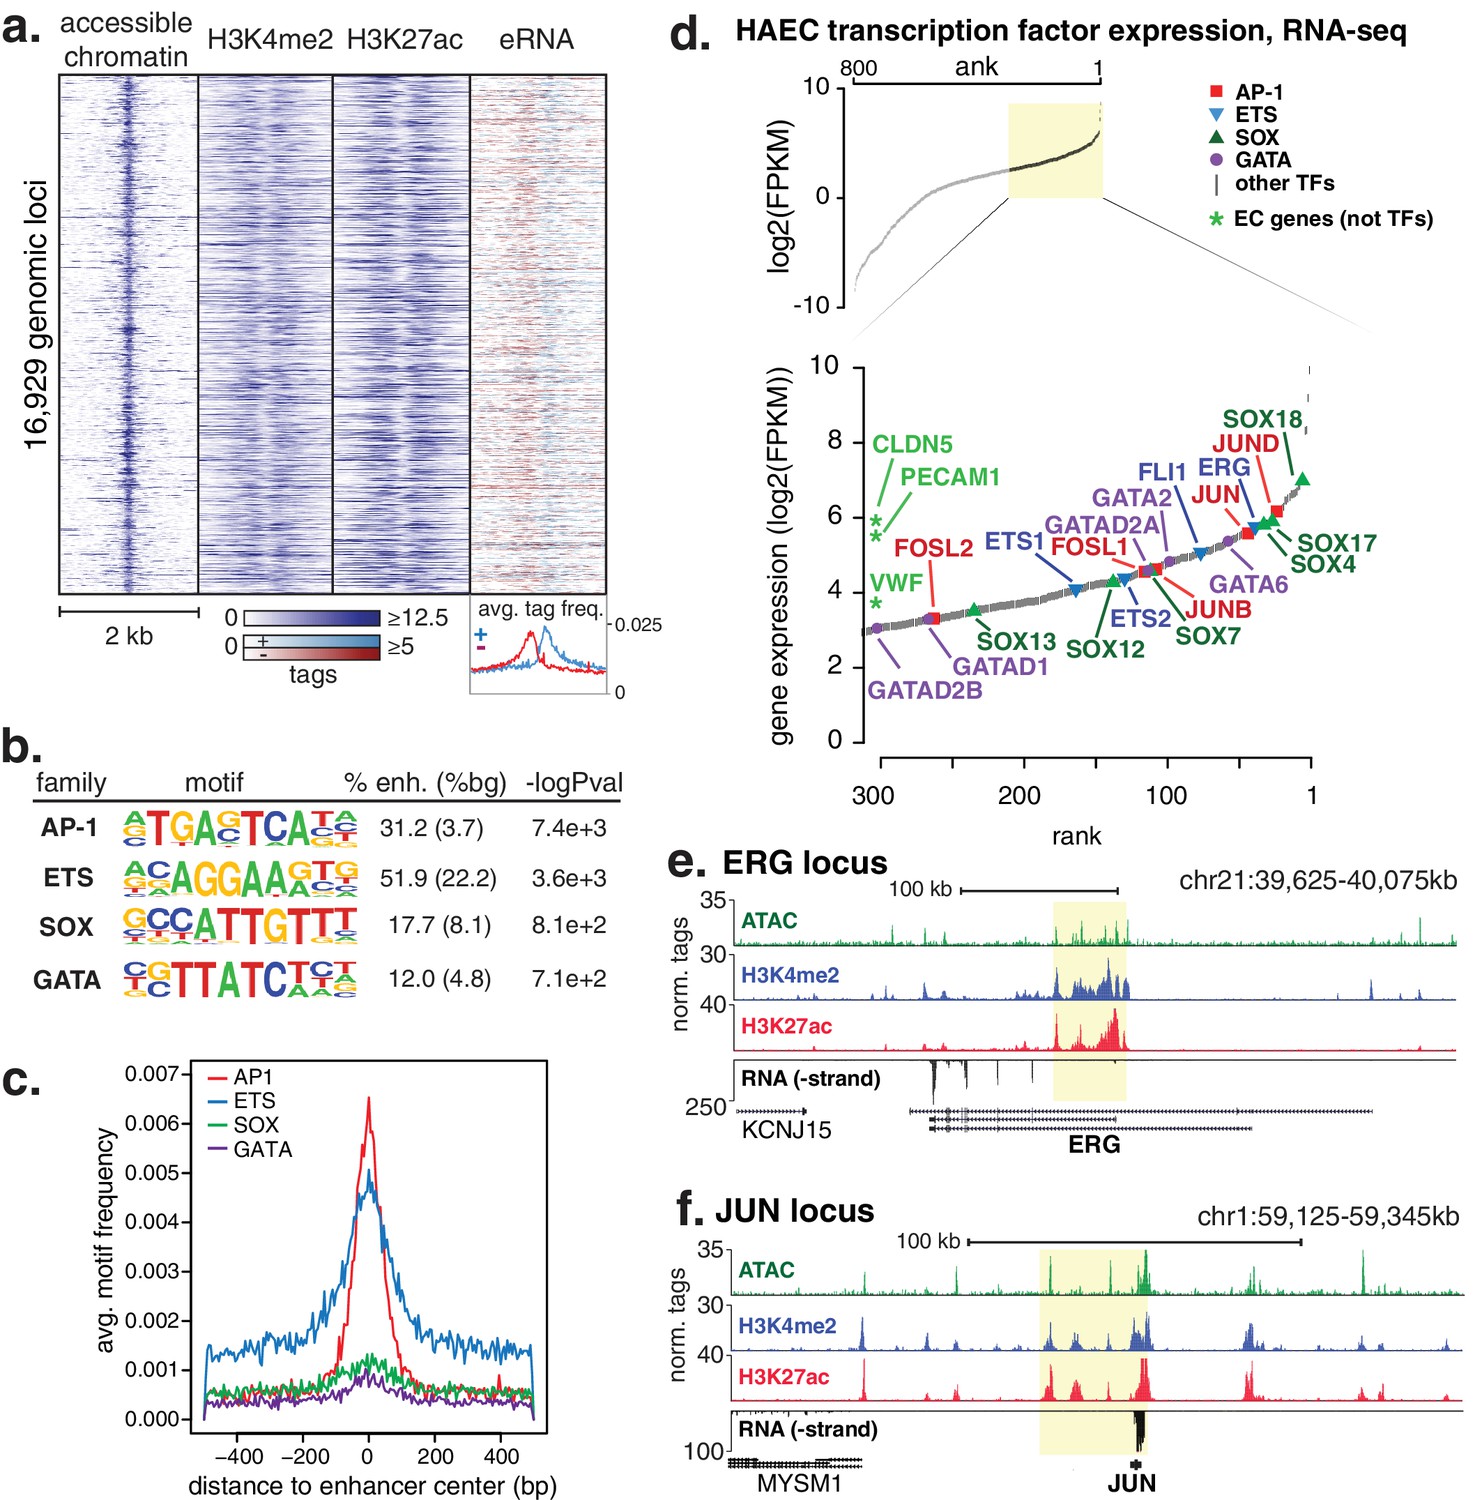
HAECs display a distinct repertoire of enhancers that nominate combinations of the AP1, ETS, SOX and GATA TF families as major orchestrators of HAEC gene expression.
(a) A heatmap of 16,929 enhancer-like regions were selected by: accessible chromatin (ATAC-seq), coincident with H3K4me2 and H3K27ac deposition (ChIP-seq) in gene-distal positions (≥3 kb from promoters). Rows are enhancer loci, repeated for each data type in columns. Bidirectional transcription of enhancer RNAs (eRNAs) is also evident (GRO-seq). (b) The top four enriched motifs that occur in enhancers from a are shown. The transcription factor (TF) family, de novo motif matrix, percentage motif occurrence at enhancer loci versus random loci, and enrichment -logPvalues are indicated. Enrichment was calculated from 200 bp sequence, centered on chromatin accessibility. (c) The positional enrichment of the enriched motifs are shown relative to the center of the enhancer-like elements from a, where 0 bp is the center of the accessibility signal. (d) Gene expression measured by RNA-seq and limited to TFs is ranked by FPKM values to nominate the most highly expressed TFs in the AP1, ETS, SOX, and GATA families. (e, f) RNA expression, histone modifications, and super enhancer (SE) definitions are shown for: (e) ERG and (f) JUN loci. SE regions are highlighted in yellow and were defined using H3K27ac. More related data in Figure 1—figure supplements 1–3.
Figure 1—figure supplement 1
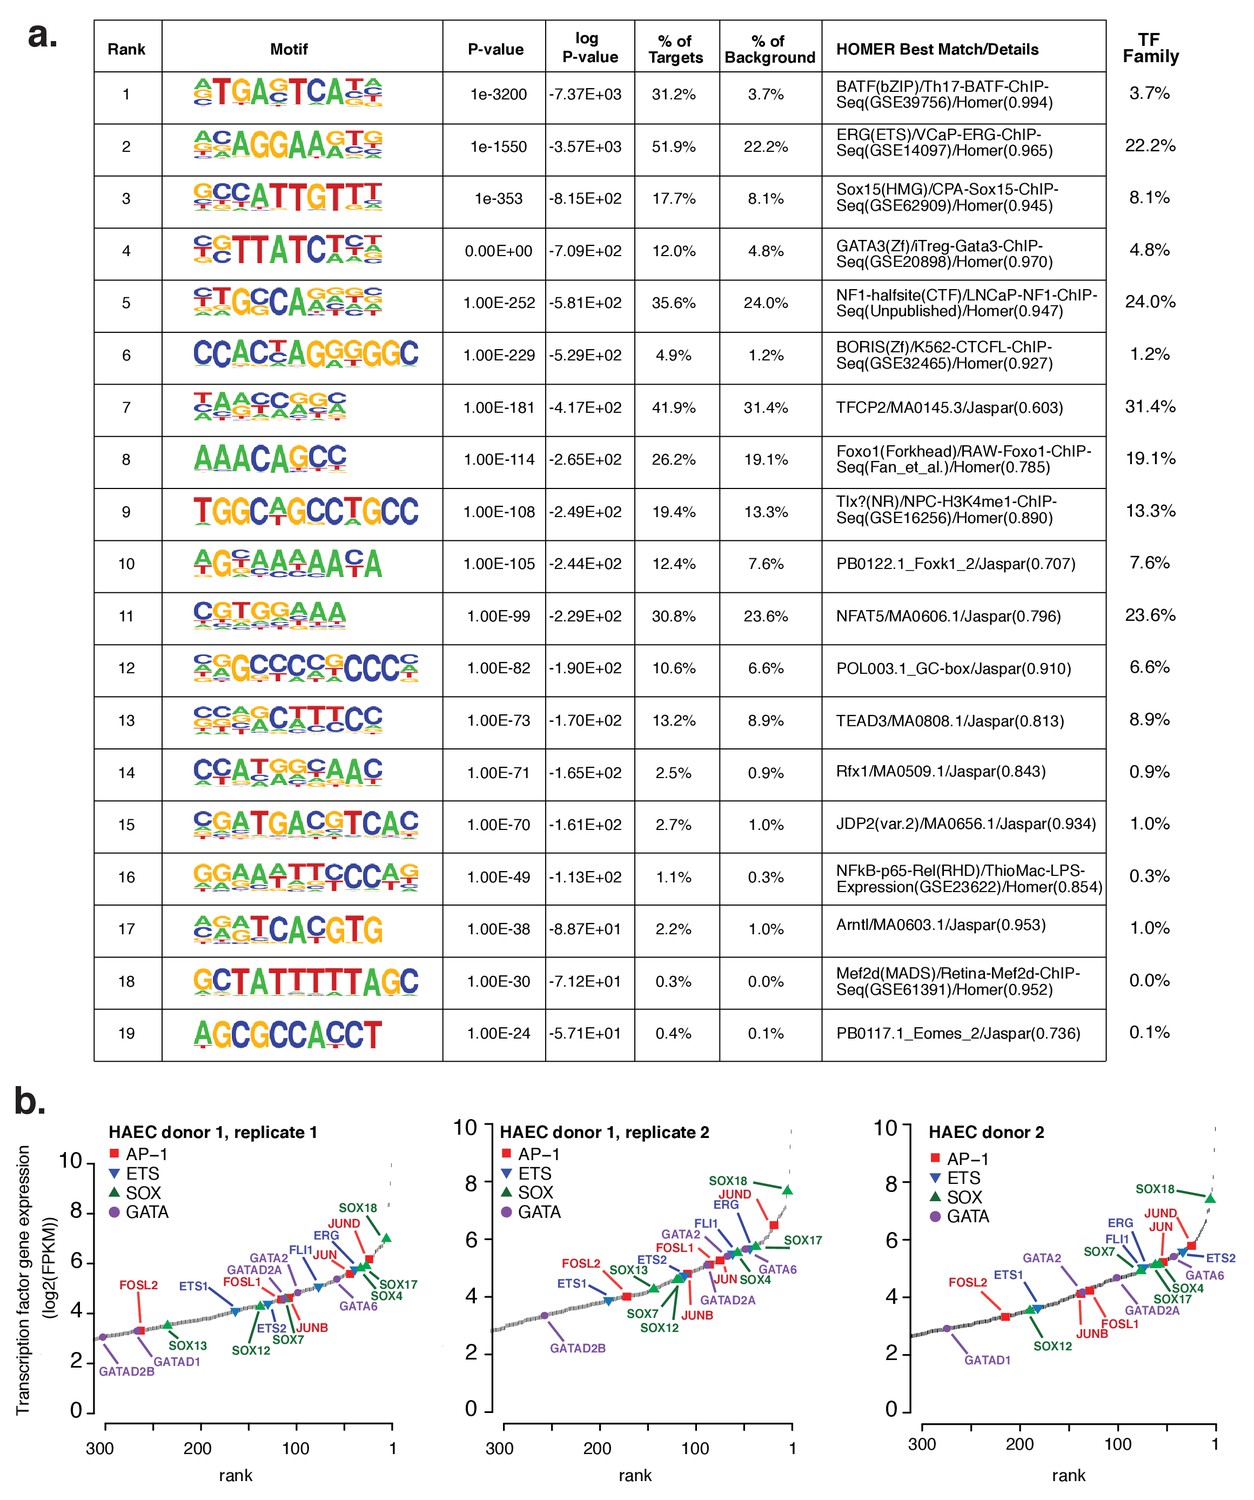
Analysis of motifs and expression of associated transcription factors.
(a) The Top 19 enriched motifs that occur in active endothelial cell enhancers (Figure 1a) calculated from 200 bp sequences centered on chromatin accessible regions. (b) Ranked TF gene expression measured by RNA-seq in two donors, with a replicate of donor 1.
Figure 1—figure supplement 2

Genetic loci for JUN, JUNB, and JUND.
Chromatin accessibility, histone modifications, and RNA expression of JUN, JUNB, and JUND. SE regions are highlighted in yellow as determined by H3K27ac.
Figure 1—figure supplement 3
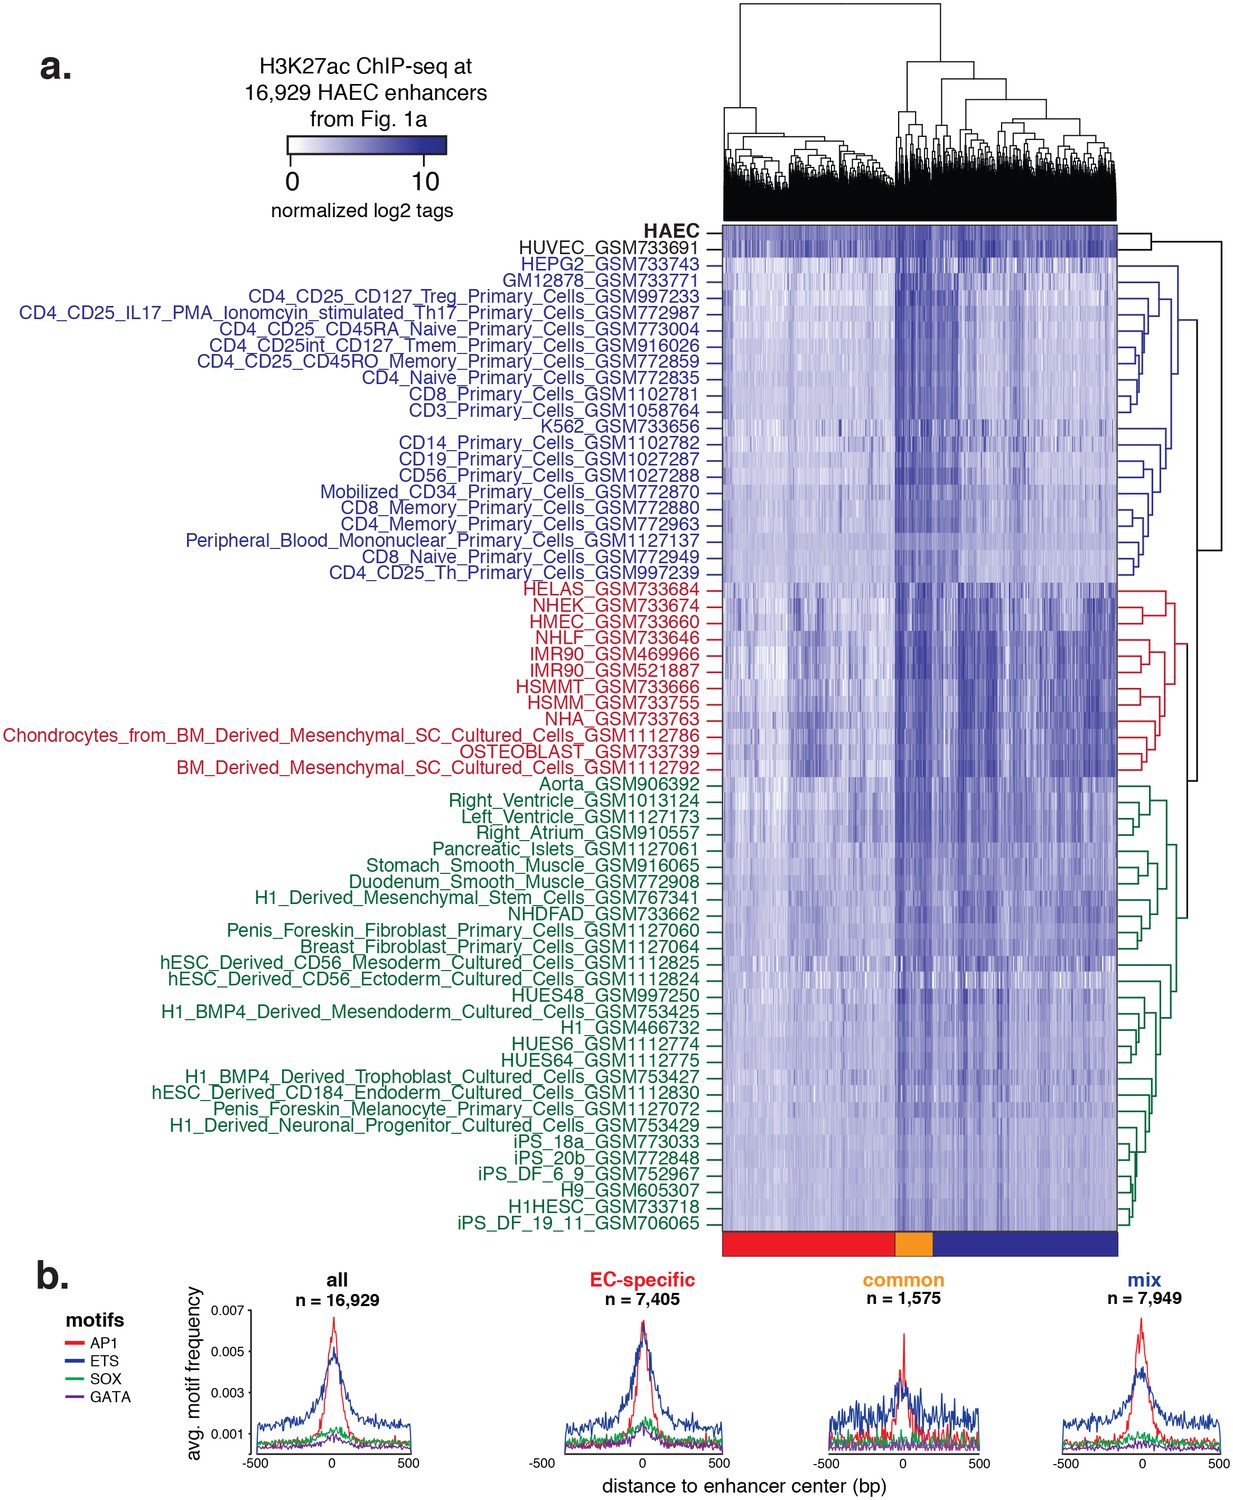
Hierarchical clustering of enhancers.
(a) H3K27ac ChIP-seq datasets were downloaded from ENCODE and Roadmap Epigenomics and quantified at 16,929 HAEC enhancers from Figure 1a (x-axis). Enhancers are clustered using hierarchical clustering into three groups: EC-specific (red), common (orange), and mixed (blue). (b) Motif analysis of highly expressed TF families AP, ETS, SOX, and GATA within each of the enhancer clusters outlined in (a).
Figure 2 with 2 supplements
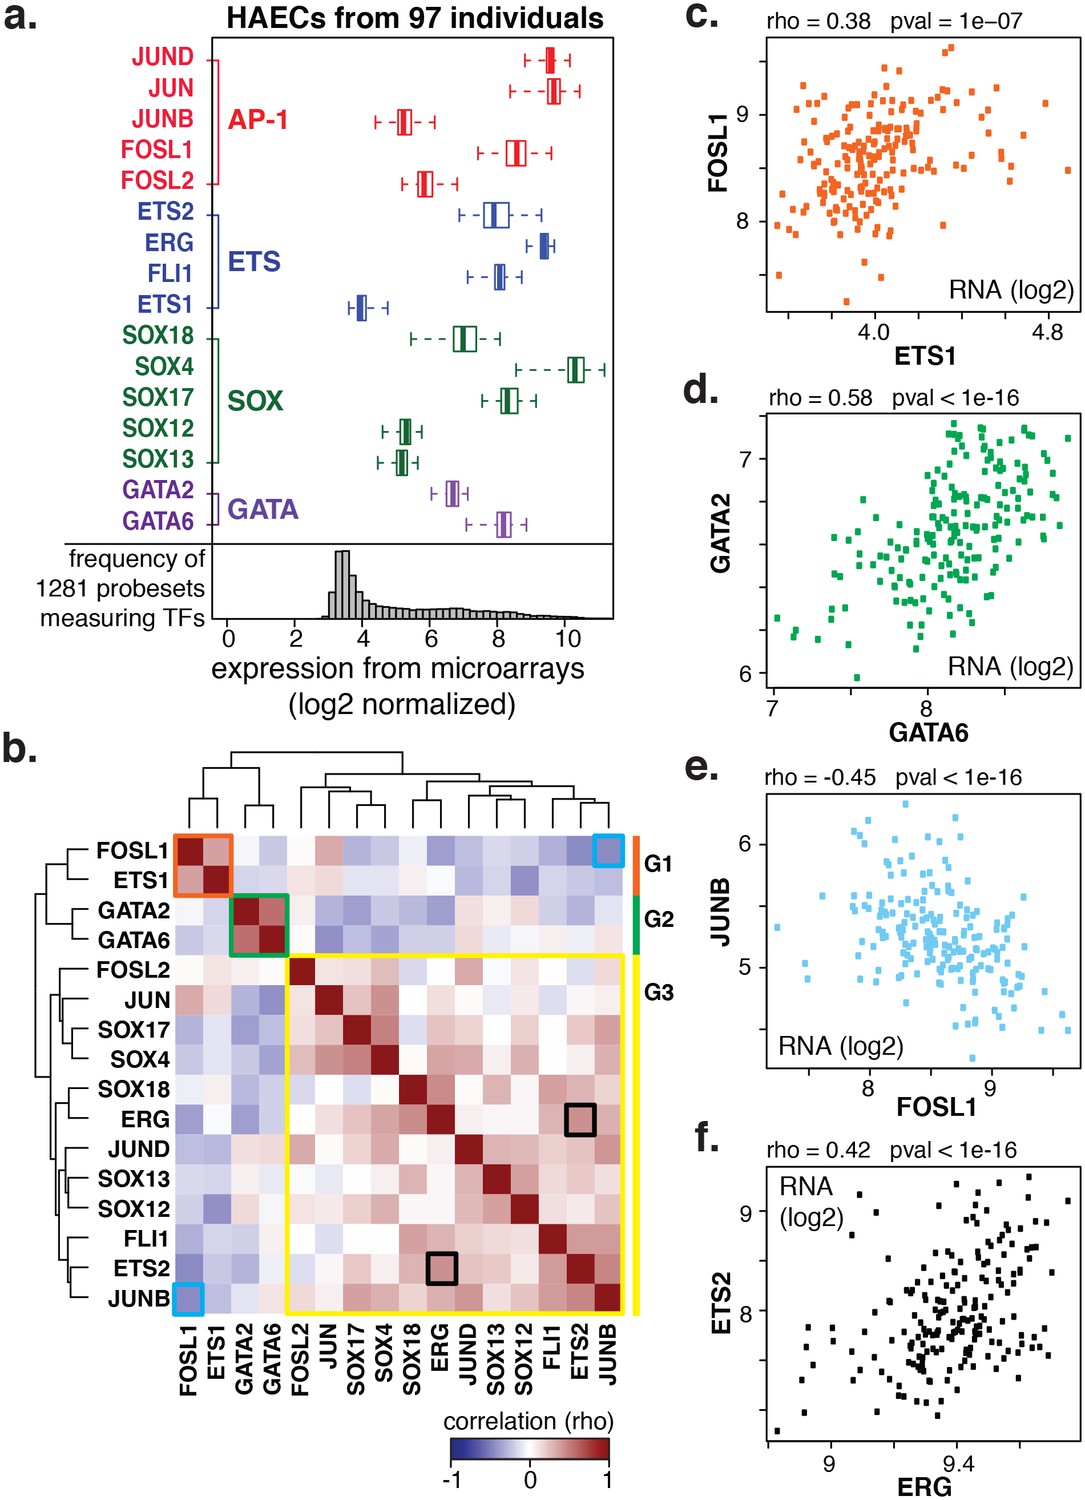
Coordinate gene expression across 96 genetically distinct HAEC donors identifies three regulatory programs among ETS, AP1, SOX, and GATA family members.
(a) TF gene expression measured by AffyHU133A array is shown across a population of 97 unique HAEC donors. Array probe set IDs were manually confirmed to cover expressed transcript isoforms of the indicated TFs based on RNA-seq data. Boxplots midlines are medians, box edges are 1st and 3rd quartiles, and whiskers 95% confidence intervals. (b) A heatmap of clustered pairwise Spearman correlation coefficients across 97 HAEC donors and module designations (colored sidebar) is shown with modules and pairs of interest highlighted by colored outlines. (c–f) Pairwise Spearman correlations between indicated mRNAs from b where each dot is a genetically distinct HAEC donor. More related data in Figure 2—figure supplements 1 and 2.
Figure 2—figure supplement 1

The HAEC gene correlation network.
A clustered heatmap of correlation coefficients calculated between the TFs of interest (x-axis) and 7738 transcripts having significant correlation to at least one TF (Pearson correlation p<0.05) on the y-axis. Correlations were measured across 97 HAEC donors. Module designation from Figure 2b is shown by the colored bar.
Figure 2—figure supplement 2
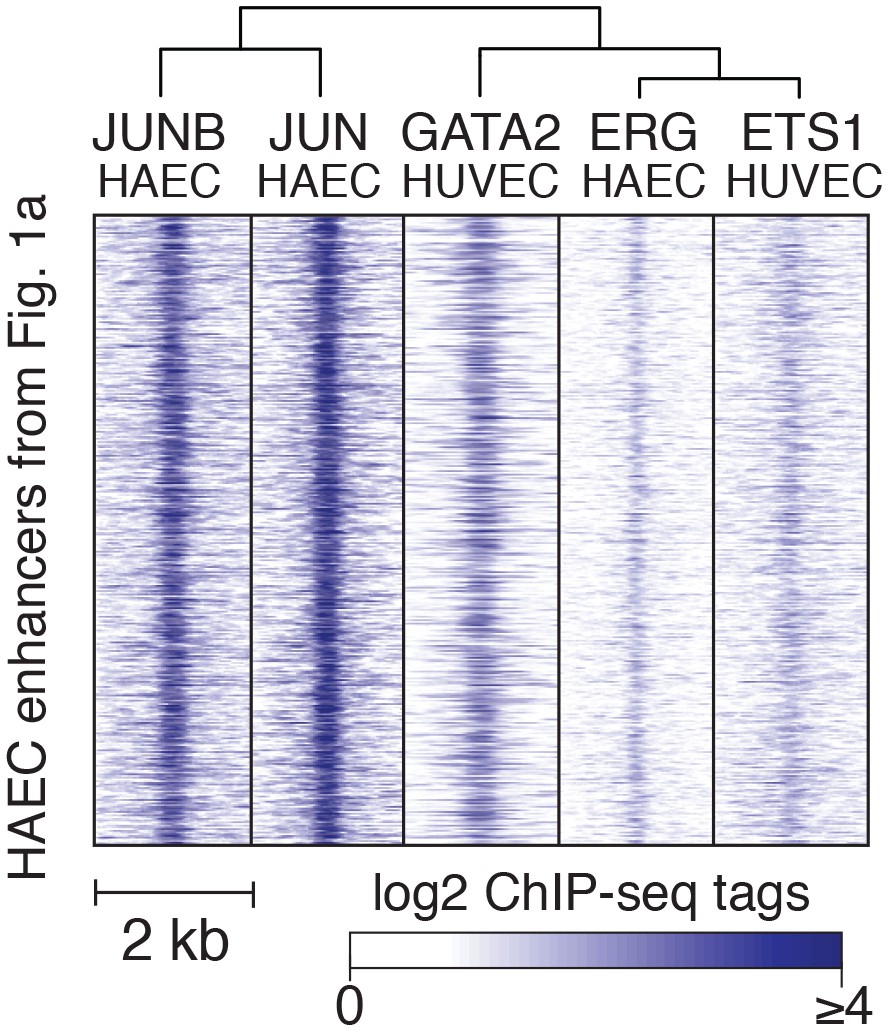
TF binding at HAEC enhancers.
JUNB, JUN, GATA2, ERG, and ETS1 bind at the center of the enhancer-like regions (from Figure 1a). JUNB, JUN, and ERG binding was measured in HAECs and GATA2 and ETS1 in HUVECs.
Figure 3 with 2 supplements
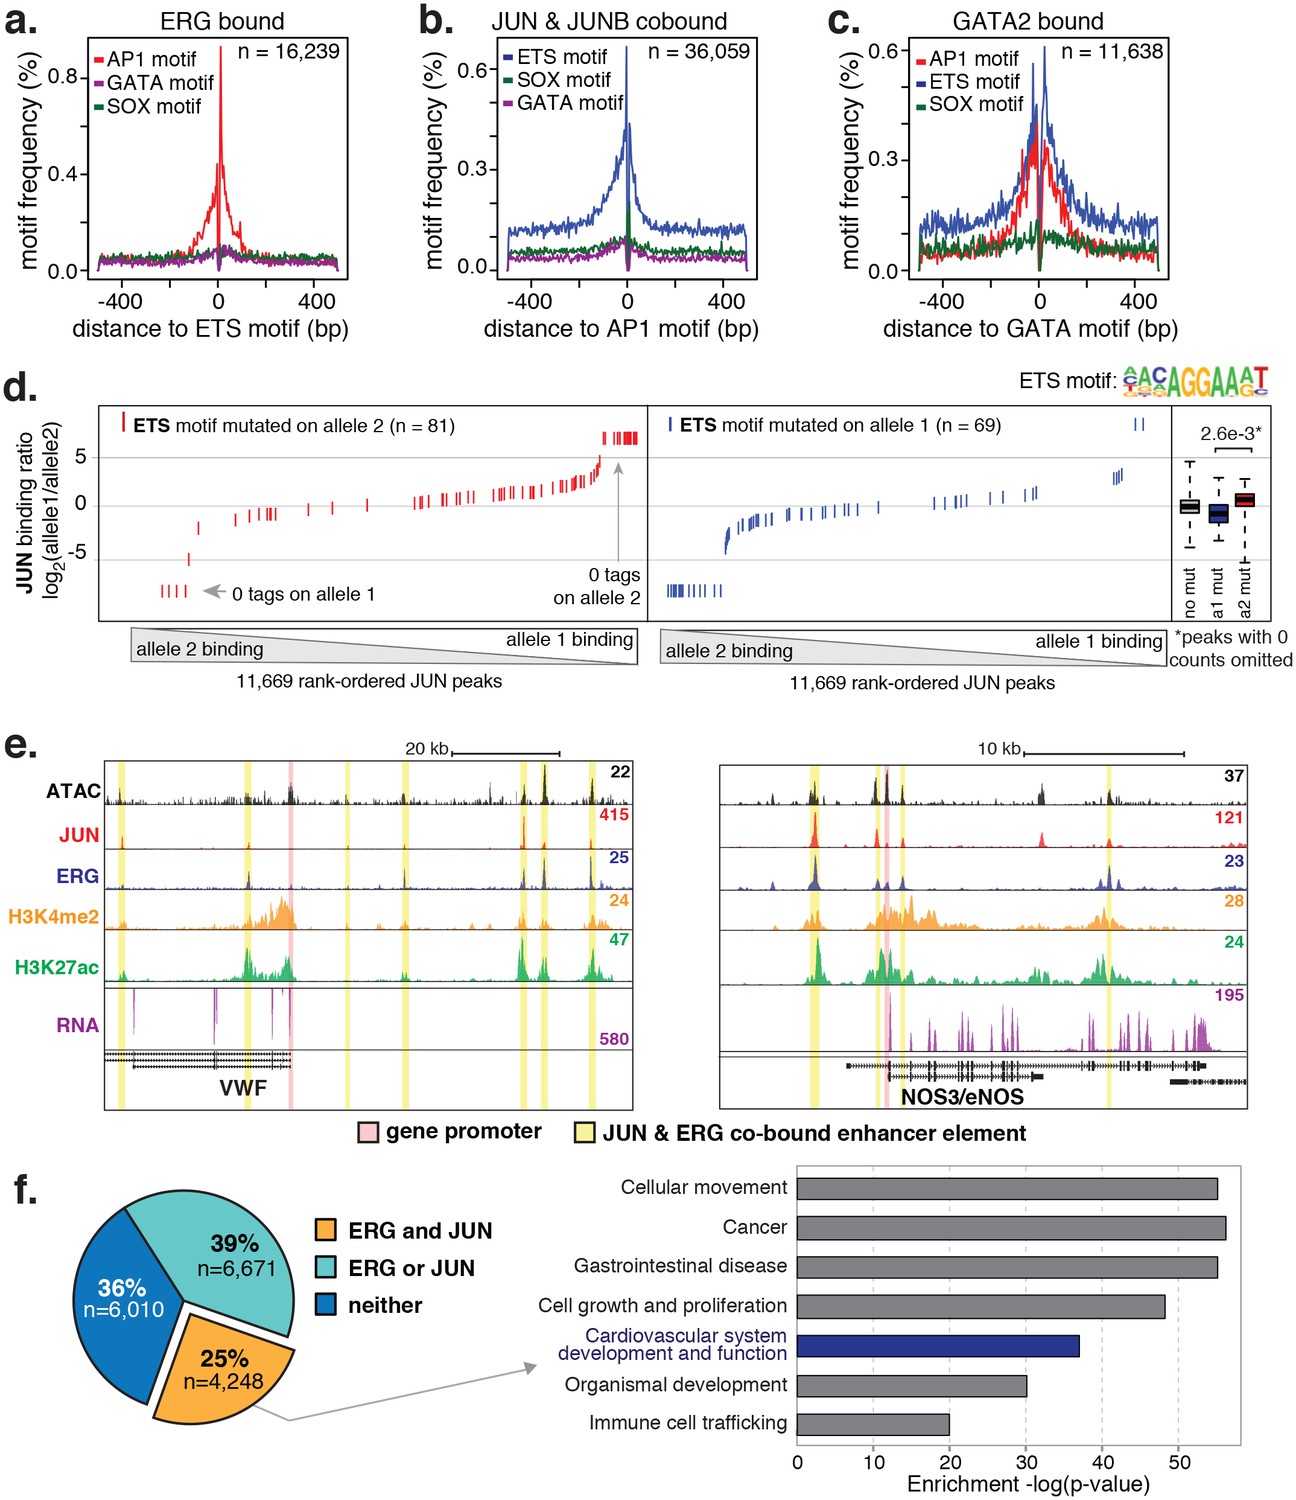
ERG and JUN co-bind EC enhancers and are enriched at EC-specific genes.
(a–c) Promoter-distal regions bound by ERG, JUN, and JUNB, or GATA2 are shown in a, b, and c respectively in a one kilobase window. Each set was centered on the corresponding binding motif, and the frequency of other enriched motifs are shown on the y-axis. GATA2 binding was measured in HUVECs. (d) Allele-specific JUN binding (y-axis) as a function of allele-specific ETS motif mutations (colored lines). Each vertical line represents a single JUN peak identified via ChIP-seq. For a more complete explaination see the Figure 3—figure supplement 1 legend and methods section. (e) TF binding for JUN and ERG, the histone modifications H3K4me2 and H3K27ac and RNA abundance are shown at the genetic loci for VWF and NOS3. Promoters are highlighted in pink and JUN/ERG co-bound enhancers are highlighted in yellow. (f) The HAEC enhancer set from Figure 1a is annotated for JUN and/or ERG binding. Ingenuity Pathway Analysis results are shown for the genes nearest the 4248 JUN/ERG co-bound enhancers in the right panel. More related data in Figure 3—figure supplements 1 and 2.
Figure 3—figure supplement 1
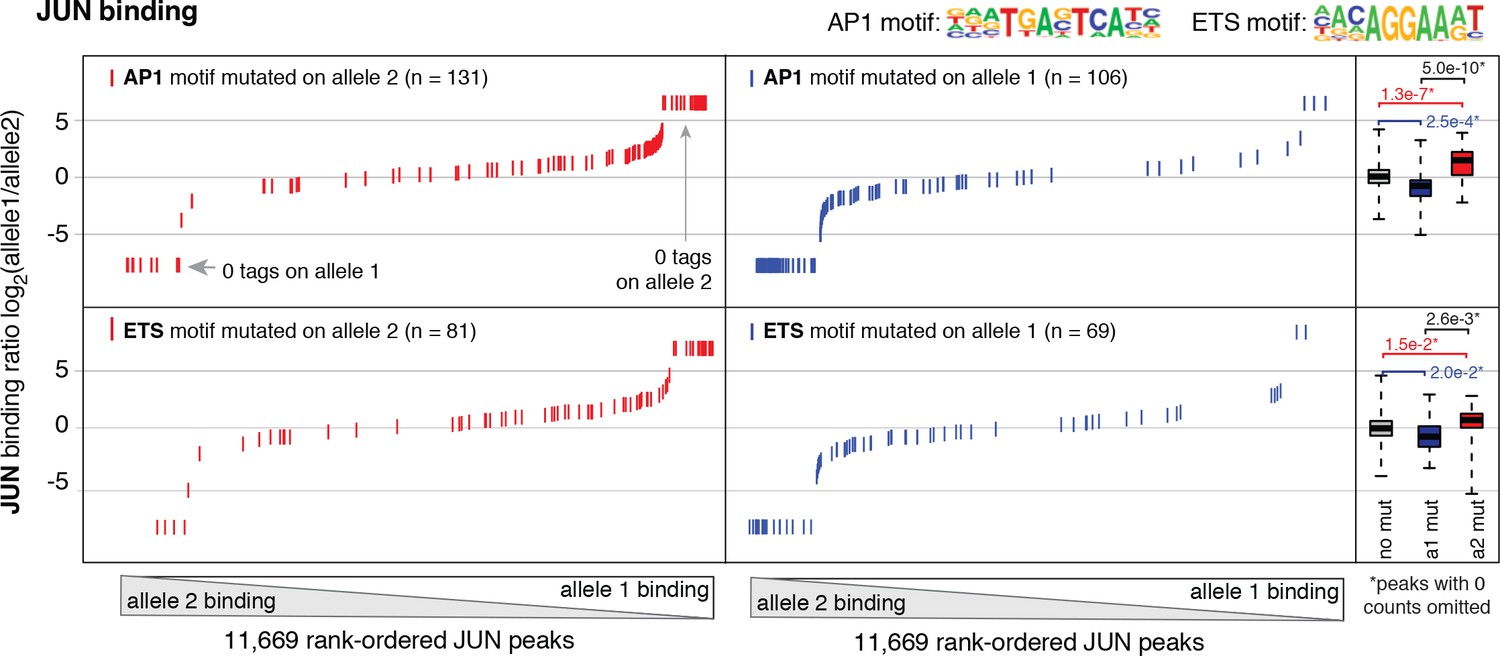
Allele-specific JUN binding at loci with mutated motifs.
JUN binding was measured by ChIP-seq in a HAEC donor with whole-genome sequencing information. Allele-specific JUN binding was calculated at heterozygous loci (y-axis is JUN binding ratio between alleles). Allele-specific motif mutations were calculated as instances where an allele mutated the AP1 (top panels) or ETS (bottom panels) canonical binding motif. Box plots to the right show the distribution of JUN peaks in one of three categories: all heterozygous peaks without mutations in grey; peaks where motifs were mutated on allele one in blue; and peaks where motifs were mutated on allele 2 in red. p-values result from two-sided t-test and exclude peaks where 0 counts are observed on one of the two alleles. These sites were excluded because the allele-specific binding ratio (y-axis) should be ± infinity in instances of 0 counts on one allele. To avoid complications this brings to the t-test, we excluded these sites. Thus, our p-values are very conservative because the sites with 0 counts on one allele are highly informative for the effect of motif mutations on binding (i.e. they are the most extreme examples).
Figure 3—figure supplement 2

JUN and ERG co-occupy loci near EC-specific genes.
ATAC-seq, binding for JUN and ERG, histone modifications H3K4me2 and H3K27ac, and RNA abundance are shown at the genetic loci for CDH5, EGFL7, TEK/TIE2, and PECAM1. Promoters are highlighted in pink, and JUN/ERG co-bound enhancers are highlighted in yellow.
Figure 4 with 2 supplements
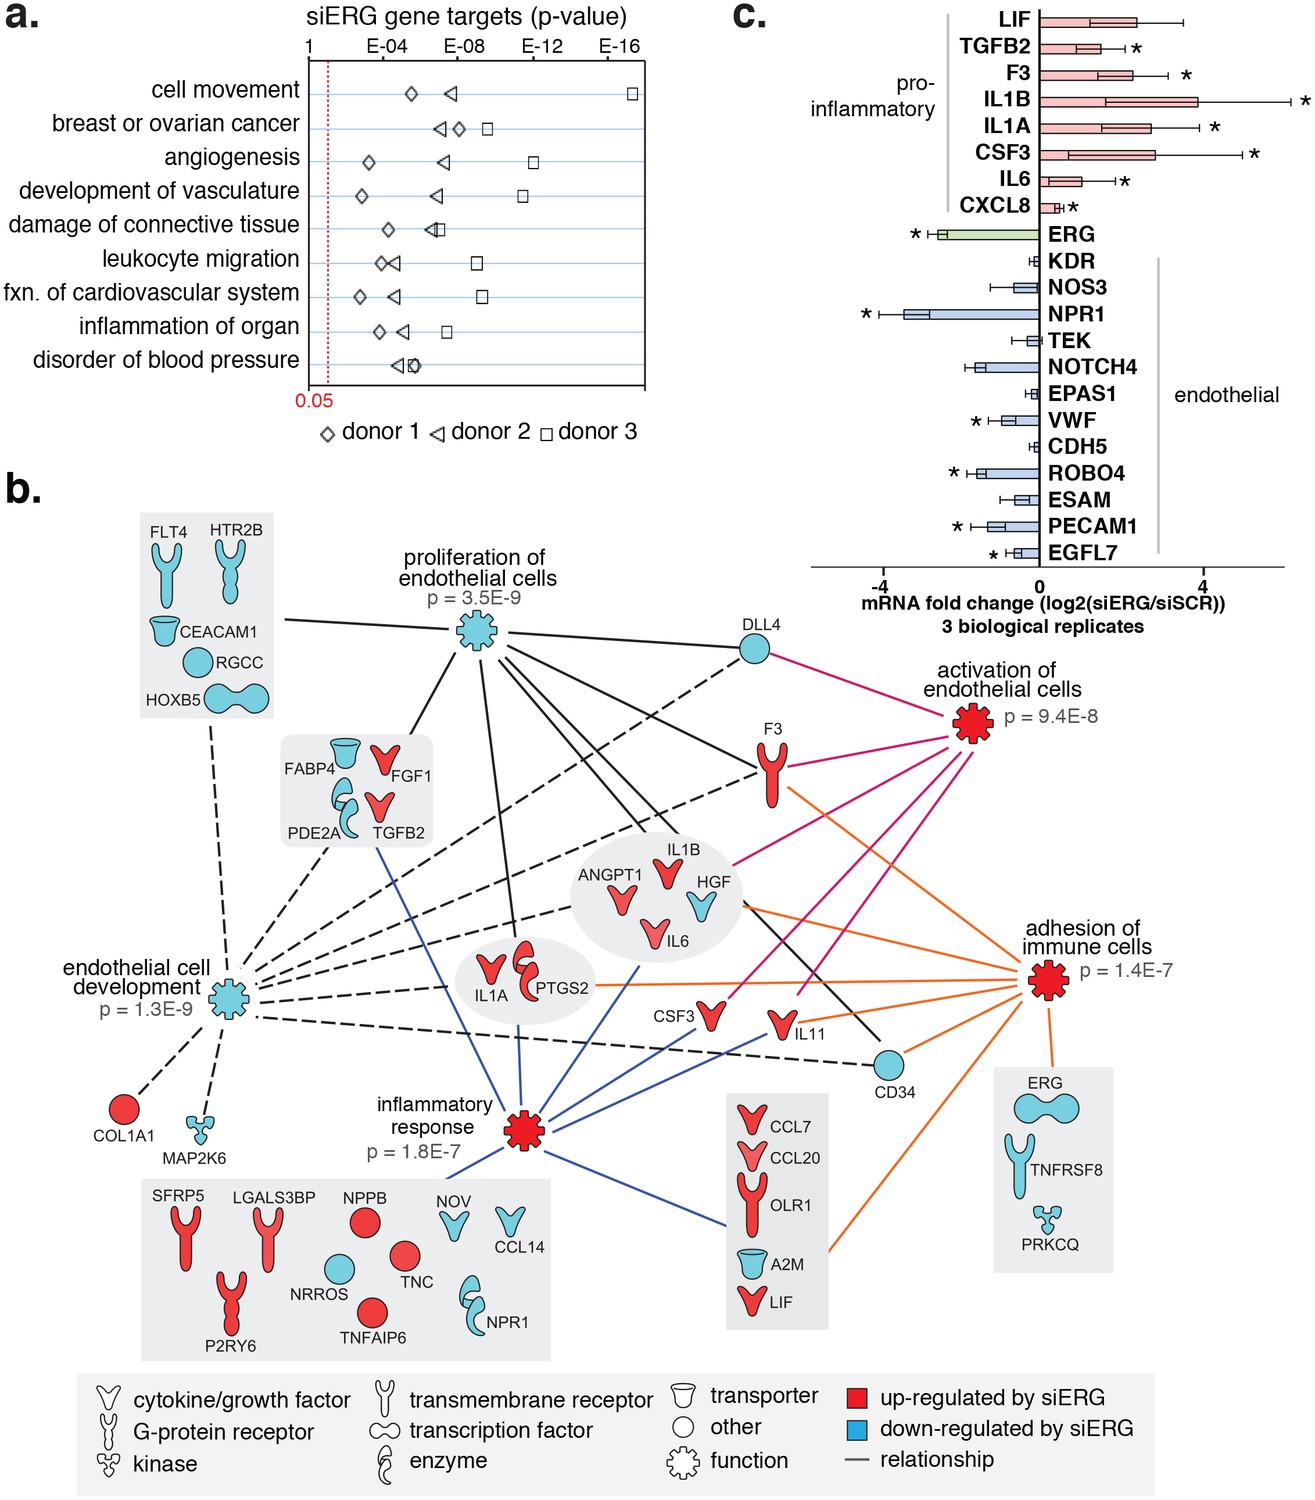
ERG knockdown elicits a pro-inflammatory gene profile in HAECs.
(a) Genes up-regulated by ERG knockdown (≥4 fold, 5% FDR) were enriched in the indicated functional pathways using Ingenuity Pathway Analysis (IPA). Results are from three experiments using cells from different HAEC donors. ERG levels are shown in c. (b) A network of molecules regulated by ERG knockdown (red = up-regulated; blue = down-regulated) with membership (lines) to five functional processes. The predicted state of the functional processes is shown by color (activation in red; and inhibited in blue). Network analysis was performed using IPA and p-values correspond to pathway enrichments. (c) The log2 fold change caused by siERG knock-down is shown for endothelial-specific genes (blue) and pro-inflammatory genes (pink). Plotted is mean ± SD of fold changes measured in three HAEC donors. Per donor/gene effects are included in Figure 5—figure supplement 1. Asterisk indicates p-value<0.05 from a paired t-test of siERG to siSCR values across three donors. More related data in Figure 4—figure supplements 1 and 2.
Figure 4—figure supplement 1
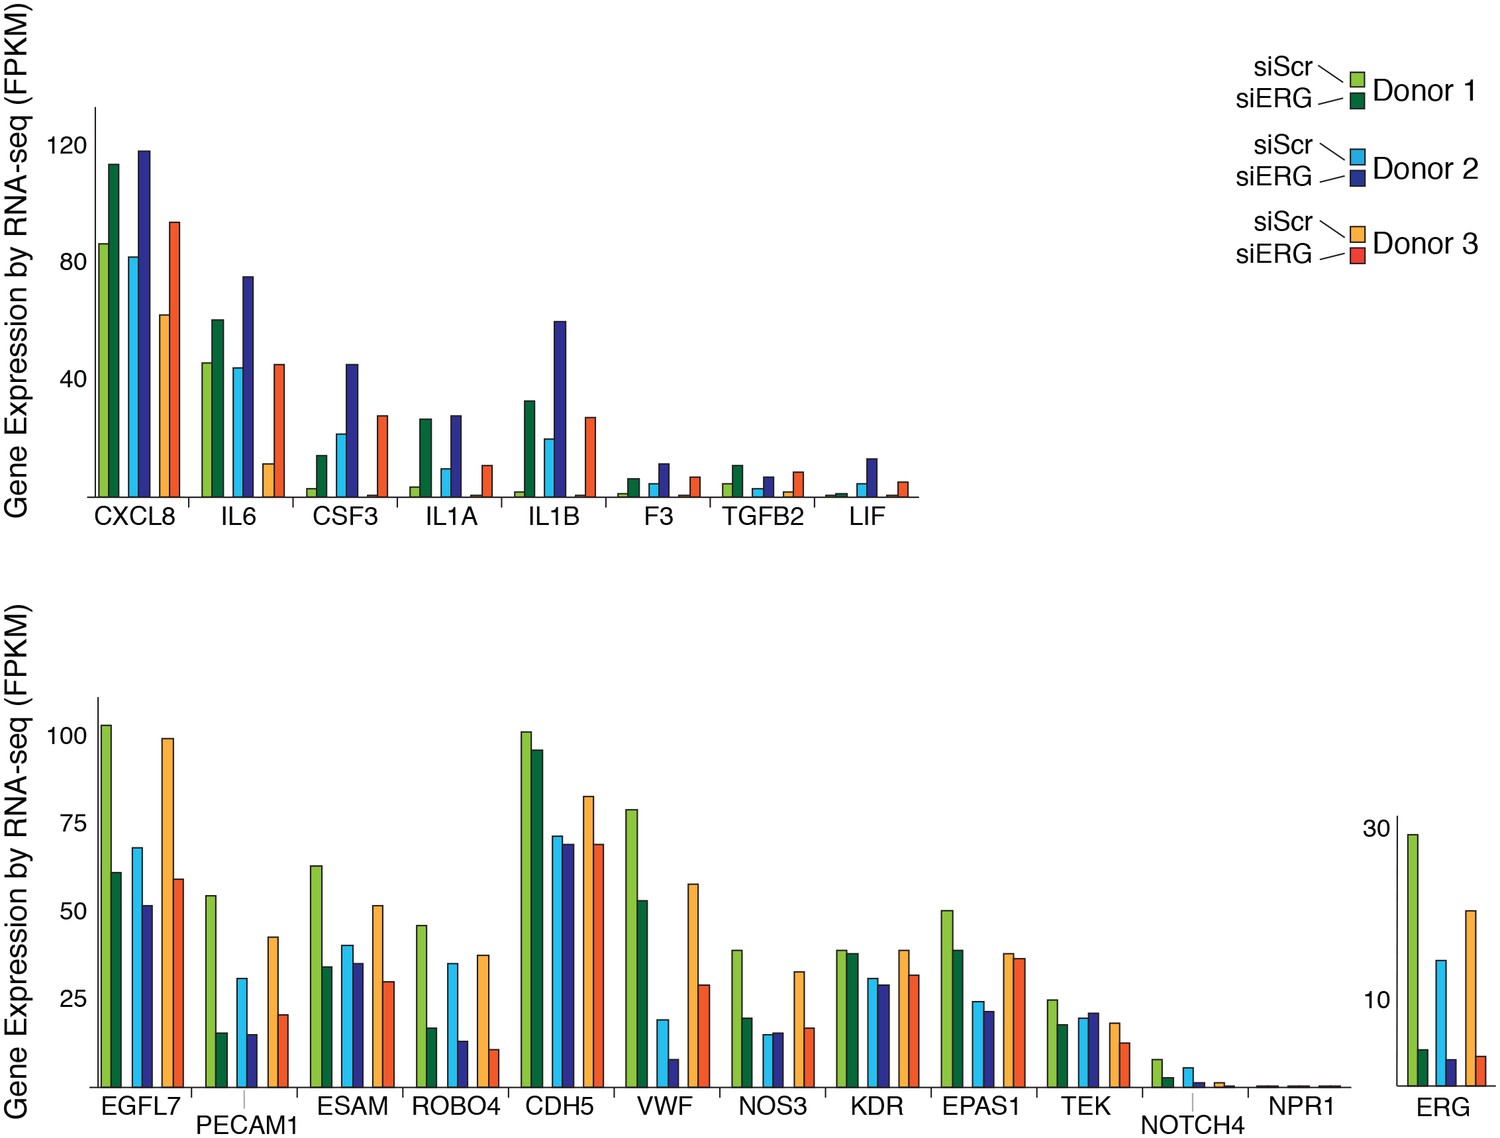
Changes in gene expression with ERG knockdown measured by RNA-seq.
Gene expression levels of various genes according to RNA-seq data in three different donors, each in control (siSCR) and ERG knockdown (siERG) conditions.
Figure 4—figure supplement 2

Changes in gene expression with ERG knockdown measured by RT qPCR.
Gene expression measured by RT- qPCR in no transfection controls, with scrambled siRNA, individual siERG oligos, and pooled siERG oligos for genes that either inflammatory or endothelial-specific genes. List of primers and oligos used is in Supplementary file 3.
Figure 5 with 4 supplements

Inflammatory signals activate enhancer-like elements with distinct motifs and suggest that CEBP and IRF members mediate responsiveness to TNFα and IL1β.
(a) A schematic for de novo enhancer activation by combinations of signal-dependent and collaborative TFs. (b) Enrichments of the NRF2, NFκB, IRF, C/EBP, AP1, and ETS motifs (y-axis) are shown for de novo enhancer sets activated after 4 hr by either 40 µg/ml oxPAPC (ox), 10 ng/ml TNFα, or 2 ng/ml IL1β (x-axis). Blue bars show the percent of de novo enhancers containing the motif and red bars indicate the percentage of GC-matched random genome sequence containing the motif. Motifs were considered within 200 basepair windows of enhancers. (c) ChIP-seq analysis of p65-binding sites shows regions of the genome that are co-bound by p65 and JUN, p65 and ERG, all three, or solely p65 post treatment by 10 ng/ml IL1β and 2 ng/ml TNFα treatment. (d) Gene expression, measured by RNA-seq is shown by heatmap for TFs of the C/EBP and IRF families. Expression values are shown from two HAEC donors and replicate samples. (e) RT-qPCR analysis shows CEBPB, CEBPD, and IRF1 expression from 0 to 24 hr post treatment by 10 ng/ml IL1β and 2 ng/ml TNFα treatment. Plotted are mean ± S.D., experiment performed with biological triplicates. * represents p<0.05 by t-test. More related data in Figure 5—figure supplements 1–4.
-
Figure 5—source data 1
Motif enrichments in 100 bp sequences defined by promoter-distal (≥3 kb) loci gaining ATAC-seq and H3K27ac upon 4 hr oxPAPC, TNFα, and IL1β treatments.
- https://doi.org/10.7554/eLife.22536.018
Figure 5—figure supplement 1
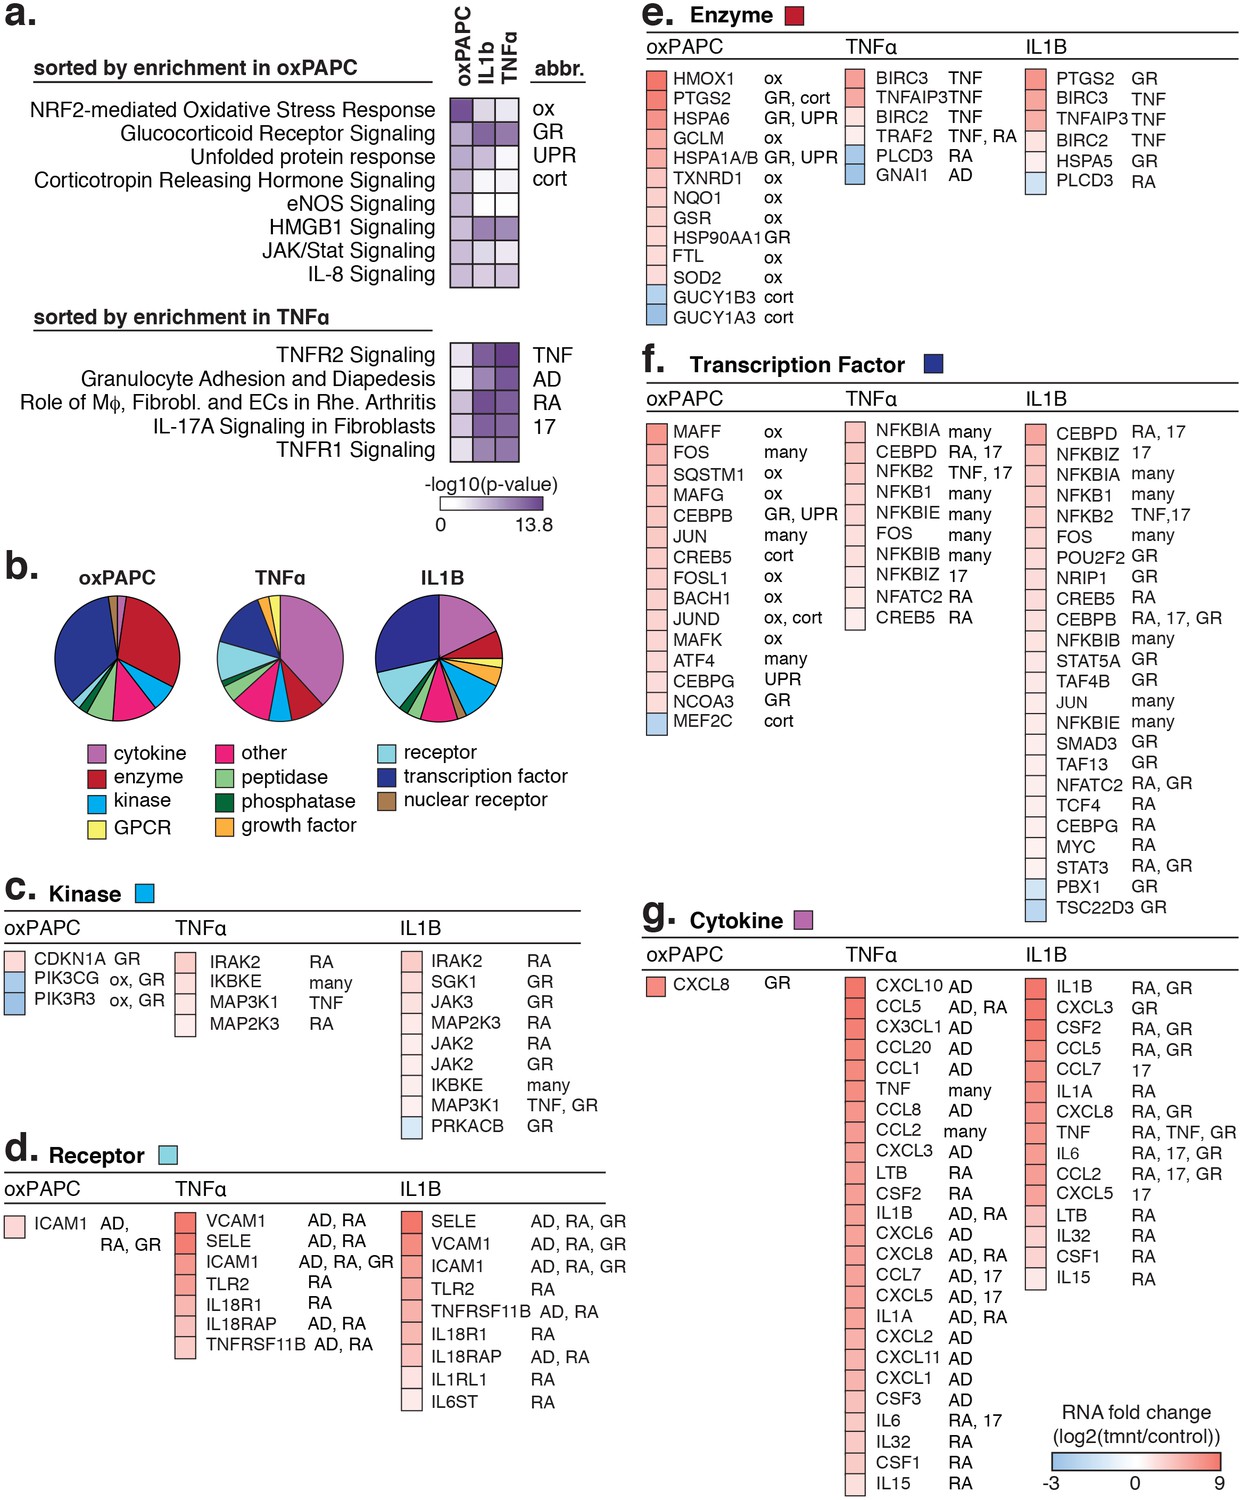
The transcriptional response to oxPAPC, TNFα, and IL1β.
(a) Enriched pathways for genes regulated after 4-hr treatment with 40 µg/ml oxPAPC, 10 ng/ml IL1β, and 2 ng/ml TNFα are shown. (b) The proportion of molecule types regulated per cell treatment. (c–g) The direction and degree of gene regulation is shown by heatmap for genes in the top four enriched pathways (from a). These include d-receptors, e-enzymes, f-transcription factors, and g-cytokines.
Figure 5—figure supplement 2
Signal-responsive transcription factor NRF2 binds endothelial enhancers.
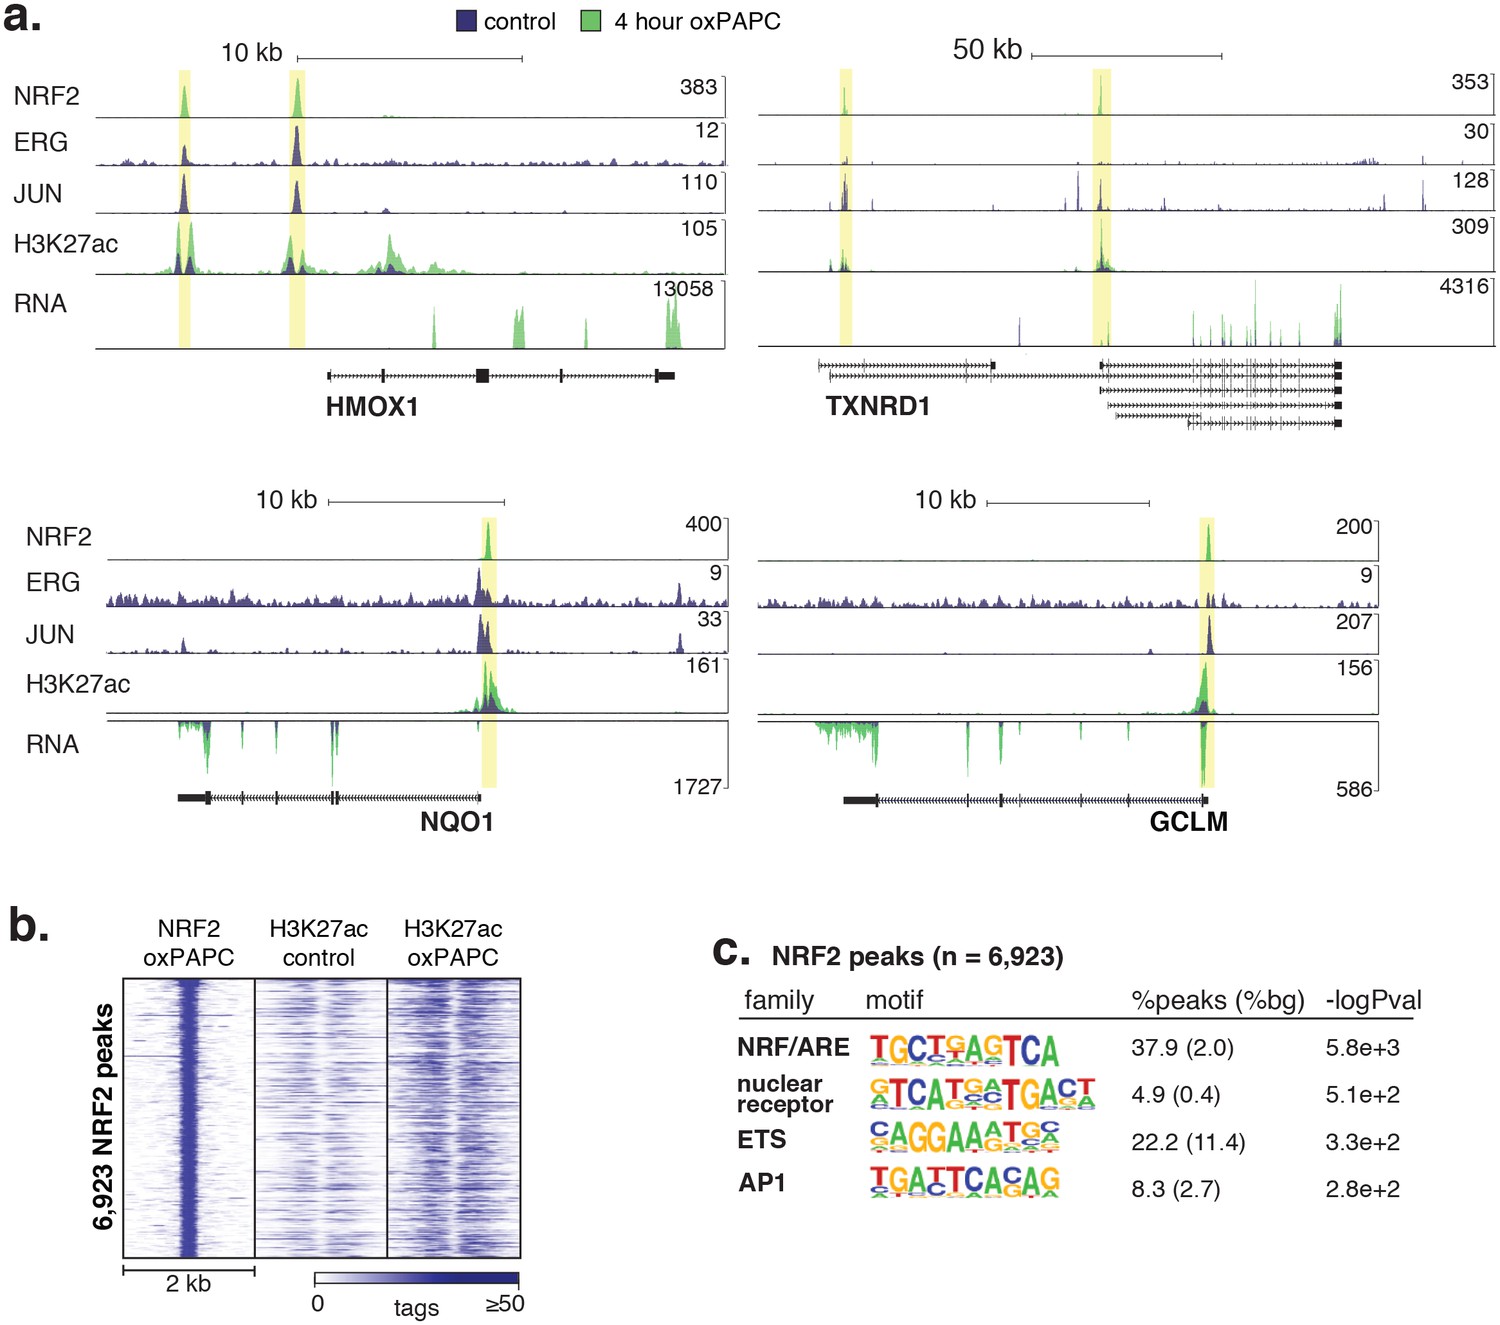
(a) HMOX1, TXNRD1, NQO1, and GCLM loci are co-bound by ERG, JUN and NRF2 and acquire H3K27ac upon oxPAPC treatment. (b) NRF2 binding was measured by ChIP-seq after oxPAPC treatment and coincides with increased H3K27ac on adjacent nucleosomes. (c) The top most enriched motifs at NRF2 peaks. (d) NF-κB component p65 ChIP-seq identified 36,363 distal loci that largely gained H3K27ac upon TNFα treatment. (e–f) Top enriched motifs at distal TNFα-induced (e) and IL1β-induced (f) p65-bound loci.
Figure 5—figure supplement 3

Signal-responsive transcription factor NFκB binds endothelial enhancers.
(a) The heme oxygenase 1 (HMOX1) and thioredoxin reductase 1 (TXNRD1) loci are co-bound by ERG, JUN and NRF2 and accumulate H3K27ac upon 4-hr oxPAPC treatment. (b) NRF2 binding was measured by ChIP-seq after 4-hr oxPAPC treatment and coincides with increased H3K27ac on adjacent nucleosomes. (c) The top most enriched motifs at NRF2 peaks. (d) NF-κB component p65 ChIP-seq identified 36,363 distal loci that largely gained H3K27ac upon TNFα treatment. (e–f) Top enriched motifs at distal TNFα-induced (e) and IL1β-induced (f) p65-bound loci.
Figure 5—figure supplement 4
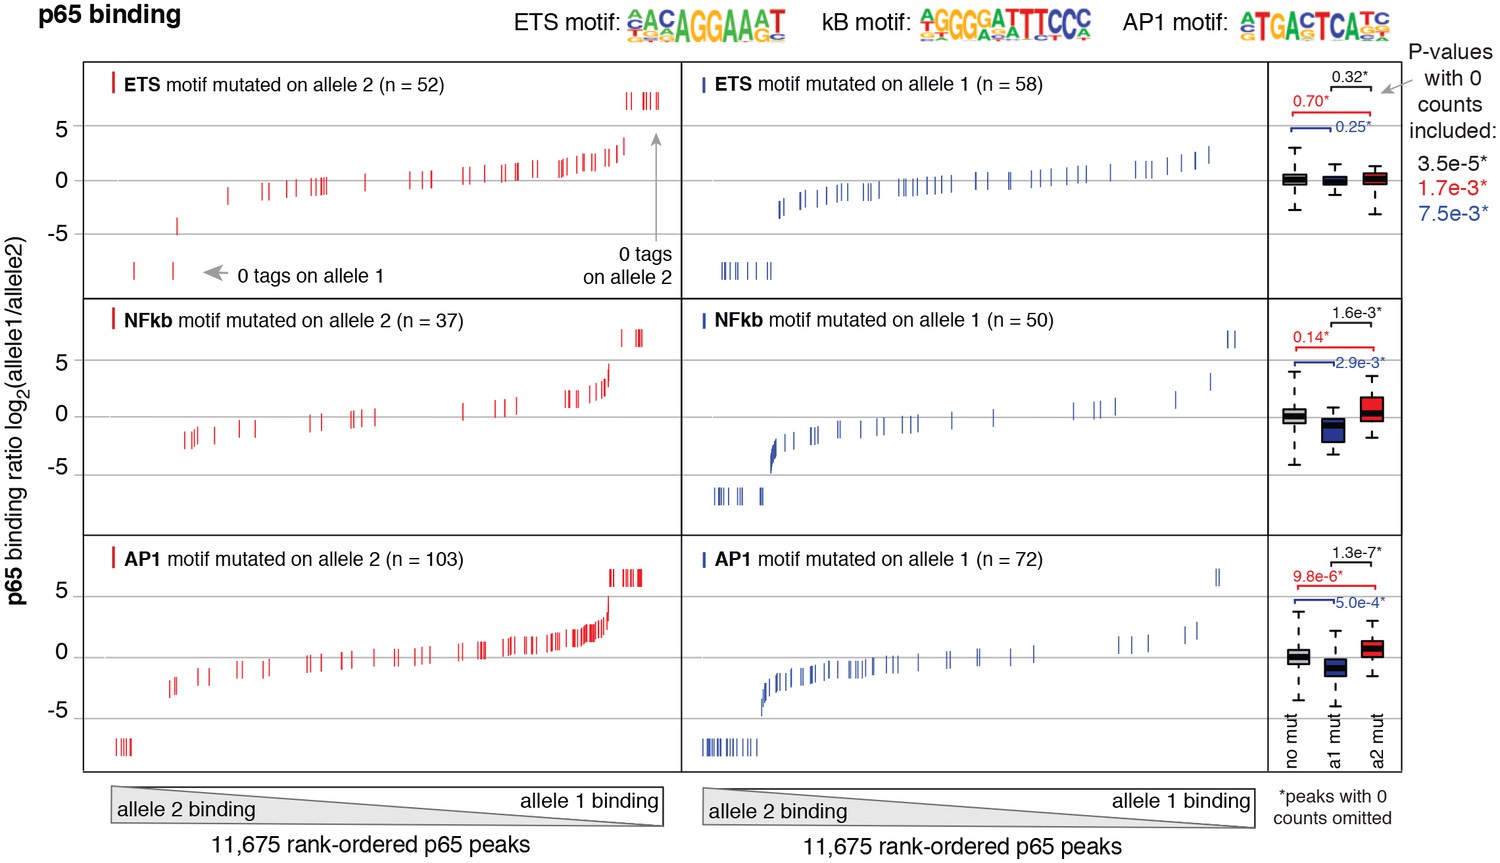
Binding of p65 at mutated motifs at each allele p65 (NFκB) binding was measured by ChIP-seq in a HAEC donor with whole-genome sequencing information.
Allele-specific p65 binding was calculated at heterozygous loci (y-axis is p65 binding ratio between alleles). Allele-specific motif mutations were calculated as instances where an allele mutated the ETS (top panels), NFκB (middle panels), or AP (bottom panels) canonical binding motif. Box plots to the right show the distribution of p65 peaks in one of three categories: all heterozygous peaks without mutations in grey; peaks where motifs were mutated on allele one in blue; and peaks where motifs were mutated on allele2 in red. p-values result from two-sided t-test and exclude peaks where 0 counts are observed on one of the two alleles. These sites were excluded because the allele-specific binding ratio (y-axis) should be ± infinity in instances of 0 counts on one allele. To avoid complications this brings to the t-test, we excluded these sites. Thus, p-values are very conservative because the sites with 0 counts on one allele are highly informative for the effect of motif mutations on binding (i.e. they are the most extreme examples). The exception is the top panel, where the p-value was only significant when peaks with 0 counts were scaled to ± 7.5.
Figure 6 with 1 supplement

CEBPD and IRF1 knockdown effect on gene expression response to TNFα.
(a) Binding of p65, CEBPD, and IRF1 was measured by ChIP-seq and is shown at de novo enhancers elicited by IL1β (e) and TNFα (f). Factor binding was measured by CHIP-seq upon 4-hr cytokine treatment, with binding of CEBPD measured after IL1β only. (b) Factor binding, H3K27ac, and mRNA expression is shown at the CEBPD locus in control-treated and TNFα-treated HAECs. CEBPD mRNA is shown in the bottom three tracks as a function of control knockdown (siSCR), CEBPD knockdown, and ERG knockdown. (c) A global view of mRNA responses to TNFα as a function of CEBPD knockdown (y-axis) compared to control (x-axis); mean ± S.D. (d) The response to TNFα is shown for molecules of interest in control (siSCR) and CEBPD knockdown HAECs. (e) The IFIT locus, highlighting elements co-bound by IRF1 and NFκB (p65). More related data in Figure 6—figure supplement 1.
-
Figure 6—source data 1
Transcripts up-regulated by more than twofold by CEBPD knockdown in untreated HAECs compared to scrambled control.
Differential expression performed in DEseq.
- https://doi.org/10.7554/eLife.22536.024
Figure 6—figure supplement 1
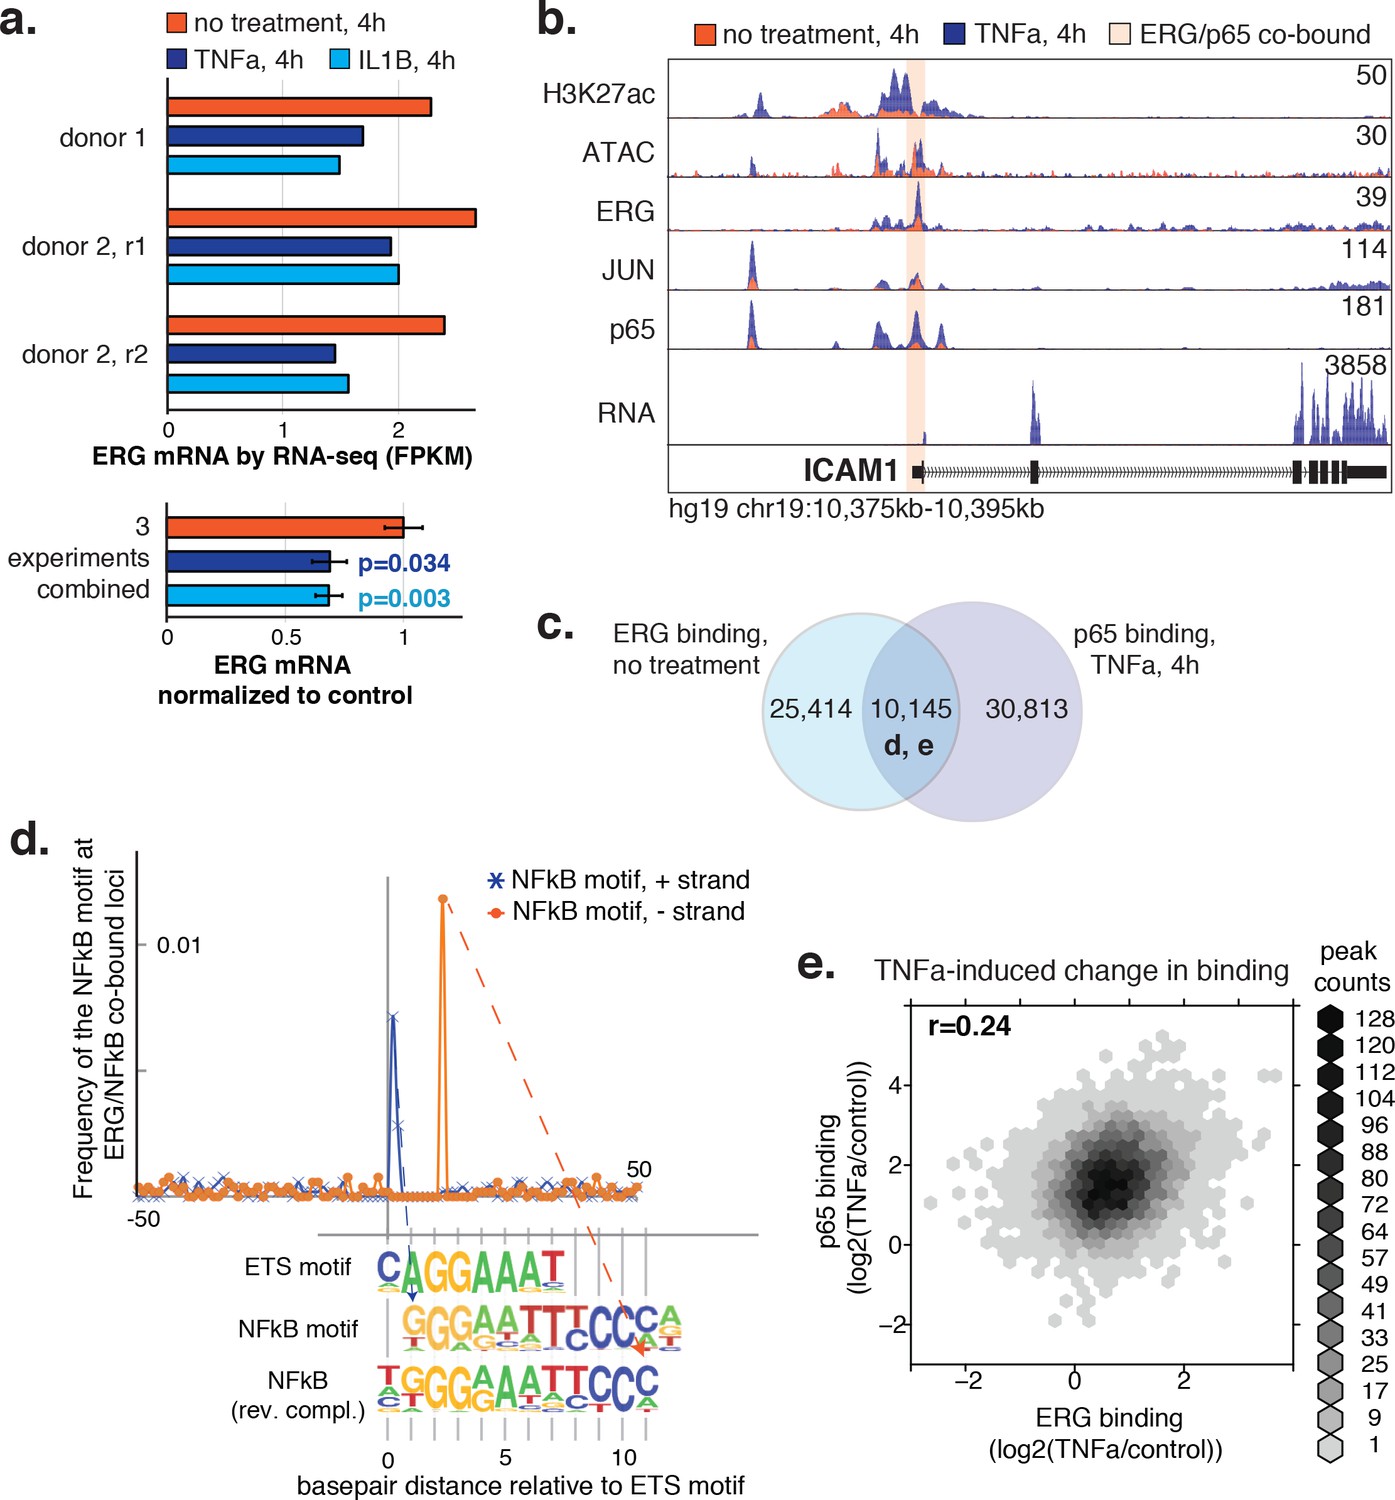
ERG and p65 co-bind loci with a distinctive ETS/NFκB motif.
(a) ERG mRNA was measured in HAECs by RNA-seq in three independent experiments in media lacking (no treatment) or containing 2 ng/µl TNFα or 10 ng/µl IL1β for 4 hr. (b) ATAC-seq, RNA-seq, and ChIP-seq data for H3K27ac, ERG, JUN, and p65 are shown at the ICAM1 locus in no treatment and TNFα conditions. Normalized tag counts are shown on the y axis. (c) A Venn diagram showing the number of loci bound by ERG and/or p65. (d) Distance of NFκB motifs relative to the central ETS motif (x-axis = 0) at 5326 loci co-bound by ERG and p65 is shown. Note that the remaining ~ 5000 co-bound loci that did not contain a canonical ETS motif were omitted from this analysis. (e) The log2 ratio of normalized TF binding was calculated for ERG and p65 at all co-bound loci between TNFα-treated and the no treatment control. The density of peaks per area is plotted via the hexbin R package.
Tables
Table 1
Overlap of HAEC enhancers with GWAS loci reported for coronary artery disease (CAD) or hypertension (HT). Associated SNPs were downloaded from the NHGRI-EBI Catalog of published genome-wide association studies. SNPs in linkage disequilibrium (LD) to GWAS association traits were calculated when r2 >0.8 according to the European reference population of the 1000 Genomes Project. HAEC enhancers defined in Figure 1a were overlapped by physical position (hg19 genome build). The GWAS SNP, p-value, GWAS trait, gene reported, PMID, overlapping HAEC enhancer coordinates and enhancer type are shown.
| GWAS SNP | HAEC enhancer | |||||||
|---|---|---|---|---|---|---|---|---|
| SNP in enhancer | LD to lead SNP from study | p-Value of lead | Trait | Reported gene of lead | PubMed ID | Position (chr, start bp, end bp) | Nearest gene | Type |
| rs12091564 | Lead | 2.0E-07 | CAD | HFE2 | 21626137 | 1, 145395579, 145395699 | LOC101928979 | common |
| rs72701850 | LD, rs12091564, r2 = 0.95346 | 2.0E-07 | CAD | HFE2 | 21626137 | 1, 145396840, 145397006 | LOC101928979 | common |
| rs72701850 | LD, rs10218795, r2 = 0.95346 | 2.0E-07 | CAD | HFE2 | 21626137 | 1, 145396840, 145397006 | LOC101928979 | common |
| rs56348932 | LD, rs17114036, r2 = 0.916823 | 4.0E-19 | CAD | PLPP3 | 21378990, 24262325 | 1, 56988477, 56988661 | PLPP3 | EC-specific |
| rs56348932 | LD, rs9970807, r2 = 0.942868 | 2.0E-09 | CAD | PLPP3 | 26343387 | 1, 56988477, 56988661 | PLPP3 | EC-specific |
| rs56348932 | LD, rs17114046, r2 = 0.942868 | 3.0E-07 | CAD | PLPP3 | 21846871, 21378988 | 1, 56988477, 56988661 | PLPP3 | EC-specific |
| rs10047079 | LD, rs2229238, r2 = 0.866848 | 7.0E-07 | CAD | ILR6 | 22319020 | 1, 154468114, 154468189 | SHE | EC-specific |
| rs55916033 | LD, rs10496288, r2 = 1 | 2.0E-09 | HT | intergenic | 21626137 | 2, 83278987, 83279062 | LOC1720 | EC-specific |
| rs55916033 | LD, rs10496289, r2 = 1 | 2.0E-09 | HT | intergenic | 21626137 | 2, 83278987, 83279062 | LOC1720 | EC-specific |
| rs72836880 | LD, rs10496288, r2 = 1 | 2.0E-09 | HT | intergenic | 21626137 | 2, 83308909, 83309314 | LOC1720 | EC-specific |
| rs72836880 | LD, rs10496289, r2 = 1 | 2.0E-09 | HT | intergenic | 21626137 | 2, 83308909, 83309314 | LOC1720 | EC-specific |
| rs112798061 | LD, rs10496289, r2 = 1 | 2.0E-09 | HT | intergenic | 21626137 | 2, 83308909, 83309314 | LOC1720 | EC-specific |
| rs3748861 | LD, rs13420028, r2 = 0.916266 | 1.0E-10 | HT | GPR39 | 21626137 | 2, 133196310, 133196505 | GPR39 | mix |
| rs3748861 | LD, rs10188442, r2 = 0.916266 | 1.0E-10 | HT | GPR39 | 21626137 | 2, 133196310, 133196505 | GPR39 | mix |
| rs144505847 | LD, rs6725887, r2 = 1 | 1.0E-09 | CAD | WDR12 | 21378990, 24262325 | 2, 203672243, 203672412 | ICA1L | EC-specific |
| rs144505847 | LD, rs7582720, r2 = 1 | 3.0E-08 | CAD | WDR12 | 24262325 | 2, 203672243, 203672412 | ICA1L | EC-specific |
| rs56155140 | LD, rs17087335, r2 = 0.979112 | 5.0E-08 | CAD | NOA1, REST | 26343387 | 4, 57824385, 57824541 | NOA1 | mix |
| rs5869162 | LD, rs6452524, r2 = 0.924698 | 2.0E-07 | HT | XRCC4 | 21626137 | 5, 82393827, 82393921 | XRCC4 | EC-specific |
| rs5869162 | LD, rs6887846, r2 = 0.924698 | 2.0E-07 | HT | XRCC4 | 21626137 | 5, 82393827, 82393921 | XRCC4 | EC-specific |
| rs6475604 | LD, rs7865618, r2 = 0.940597 | 2.0E-27 | CAD | MTAP | 21606135 | 9, 22052677, 22052823 | CDKN2B | EC-specific |
| rs17293632 | LD, rs72743461, r2 = 1 | 1.0E-07 | CAD | SMAD3 | 26343387 | 15, 67442510, 67442670 | SMAD3 | common |
| rs17293632 | LD, rs56062135, r2 = 0.988489 | 5.0E-09 | CAD | SMAD3 | 26343387 | 15, 67442510, 67442670 | SMAD3 | common |
| rs17227883 | LD, rs17228212, r2 = 0.981438 | 2.0E-07 | CAD | SMAD3 | 17634449 | 15, 67442769, 67443128 | SMAD3 | common |
| rs1563966 | LD, rs1231206, r2 = 0.844151 | 9.0E-10 | CAD | intergenic | 21378990 | 17, 2095878, 2096222 | LOC101927839 | mix |
| rs1563966 | LD, rs216172, r2 = 0.909315 | 1.0E-09 | CAD | SMG6, SRR | 21378990, 26343387 | 17, 2095878, 2096222 | LOC101927839 | mix |
| rs7408563 | LD, rs7246657, r2 = 0.900512 | 7.0E-06 | CAD | ZNF383 | 23870195 | 19, 37808501, 37809067 | HKR1 | common |
Table 2
Molecular trait changes observed upon HAEC exposure to pro-inflammatory stimuli. Differential expression was determined in DESeq with duplicate RNA-seq experiments.
| Stimulus | Regulated genes (>2 fold, 5%FDR) | de novo enhancers increased H3K27ac and accessibility upon stimulation |
|---|---|---|
| oxPAPC 4 hr (40 µg/ml) versus control | 322 (242 up, 80 down) | 839 |
| TNFα 4 hr (2 ng/ml) versus control | 840 (611 up, 229 down) | 266 |
| IL1β 4 hr (10 ng/ml) versus control | 1174 (807 up, 367 down) | 3199 |
Additional files
-
Supplementary file 1
Public H3K27ac ChIP-seq datasets used to define endothelial-specific enhancer-like regions.
The GEO accession number and cell or tissue type is listed for each dataset in the analysis.
- https://doi.org/10.7554/eLife.22536.026
-
Supplementary file 2
Knockdown of ERG with siRNA modulates transcription of numerous other HAEC transcription factors.
Above are the transcription factors shown to be modulated in two separate HAEC donors (by poly-A RNA-sequencing, greater than twofold change in transcript level, adjusted p<0.05).
- https://doi.org/10.7554/eLife.22536.027
-
Supplementary file 3
List of primers and siRNA oligos used in study
- https://doi.org/10.7554/eLife.22536.028
Download links
A two-part list of links to download the article, or parts of the article, in various formats.
Downloads (link to download the article as PDF)
Open citations (links to open the citations from this article in various online reference manager services)
Cite this article (links to download the citations from this article in formats compatible with various reference manager tools)
Transcriptional networks specifying homeostatic and inflammatory programs of gene expression in human aortic endothelial cells
eLife 6:e22536.
https://doi.org/10.7554/eLife.22536


