Structural reorganization of the chromatin remodeling enzyme Chd1 upon engagement with nucleosomes
- University of Dundee, United Kingdom
- University of St Andrews, United Kingdom
- Hamburg Outstation, European Molecular Biology Laboratory, Germany
- Ulm University, Germany
- Universitat Würzburg, Germany
Figures
Figure 1 with 2 supplements
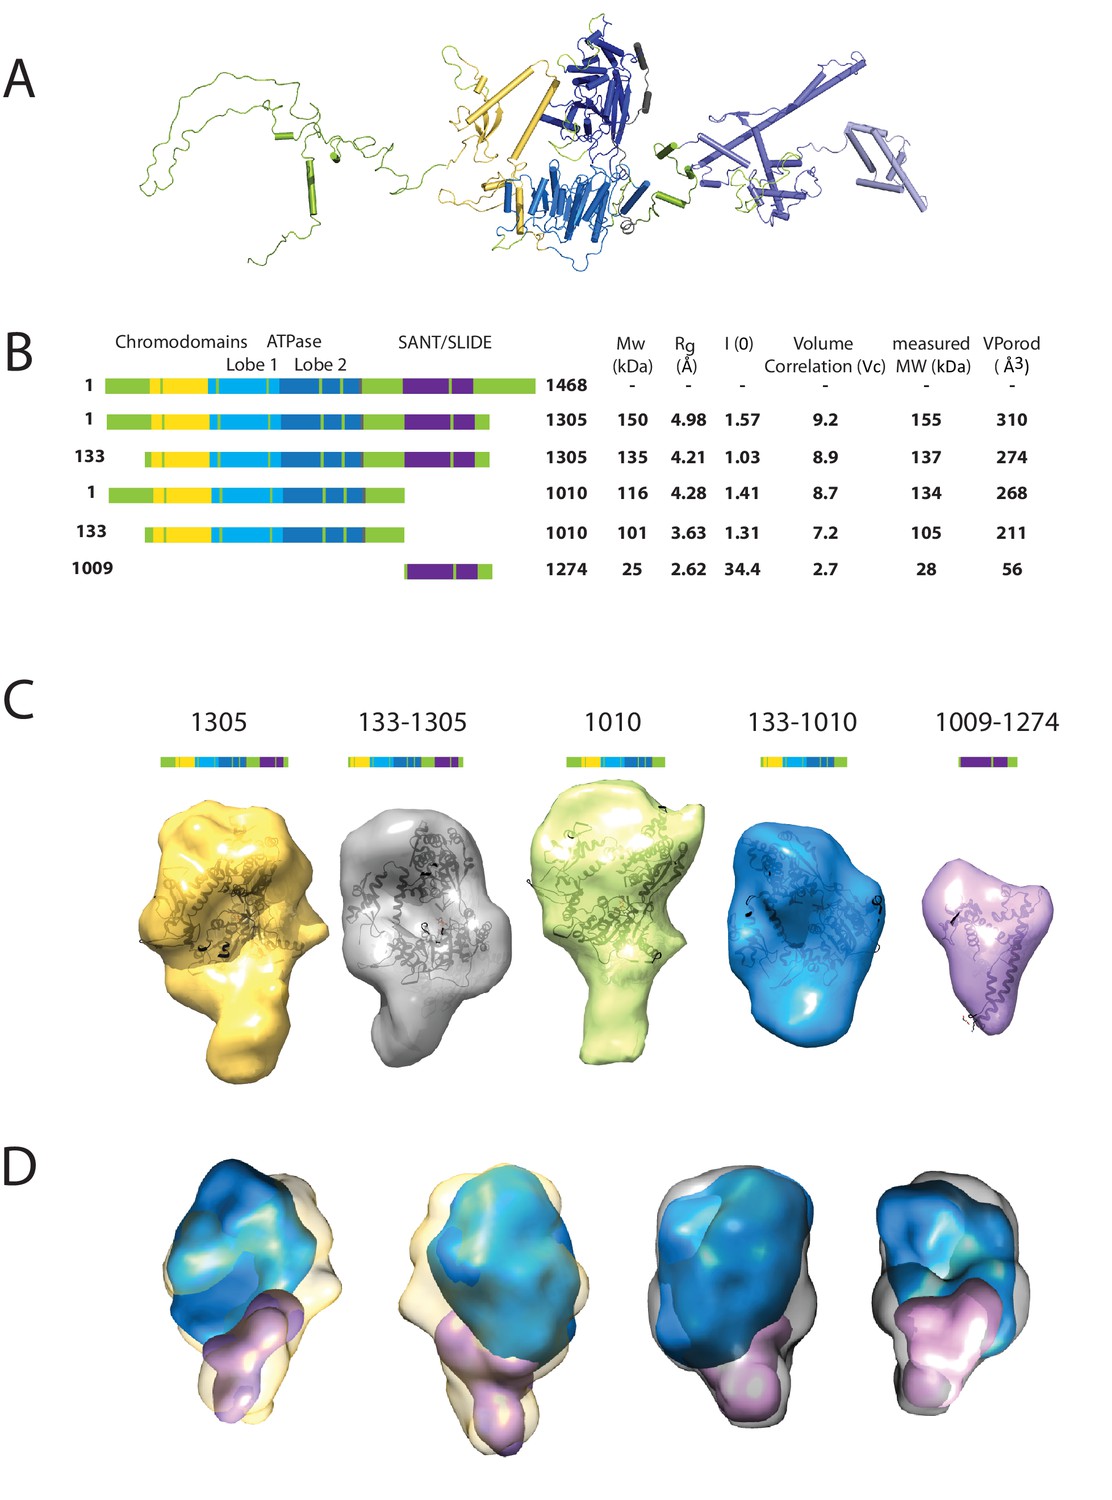
Characterising the solution structure of Chd1 by small angle X-ray scattering (SAXS).
(A) The overall structure of S. cerevisiae Chd1 molecule. Previously characterised structural features including the chromoATPase (3MWY) (Hauk et al., 2010) with chromodomains coloured yellow, ATPase lobe 1 - marine, ATPase lobe 2 – blue. The DNA binding domain (2XB0) (Ryan et al., 2011) is coloured deep blue with the NMR structure of the C-terminal extension (2N39) (Mohanty et al., 2016) in pale blue. The unresolved structural elements are coloured pale green and a cartoon representation of their predicted secondary structure provided to give an idea of scale. (B) On the left Illustration of various Chd1 truncations. The known domains within the truncation are labelled and coloured. On the right, the data (hydrodynamic radius (Rg), extrapolated zero intensity (I(0)), molecular weight (MW)) obtained from the SAXS analysis of the respective construct protein. (C) Ab-initio bead models generated from the one-dimensional scattering curves using GASBOR for different constructs. Known Chd1 crystal structures are docked into the respective volume. (D) The volumes for 133–1010 (blue) and 1009–1274 (pink) are fitted into 1305 (yellow) and 133–1305 (grey) volume maps using SASREF.
Figure 1—figure supplement 1
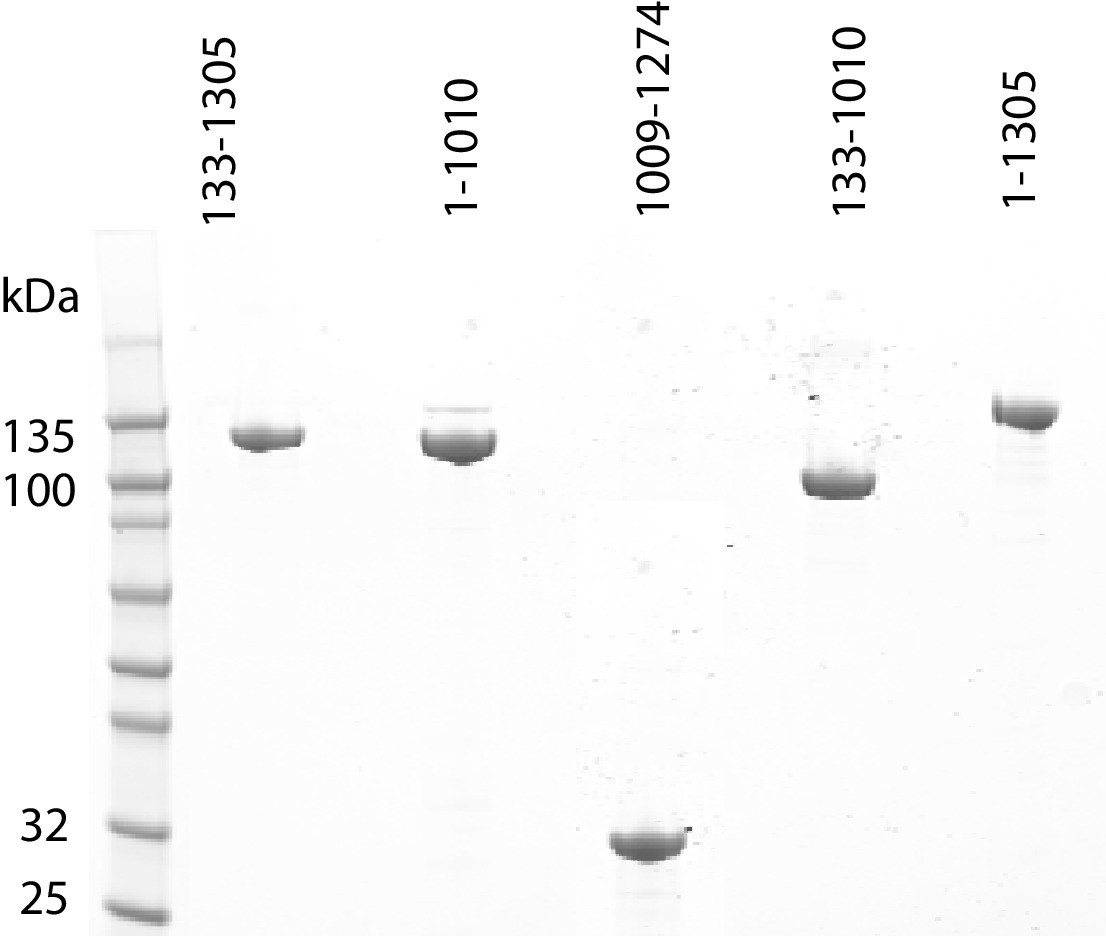
Purification of fragments of Chd1 protein.
Fragments of purified Chd1 protein used in this study were loaded on an SDS-PAGE gel and stained with coomassie. Numbers refer to amino acid positions within the S. cerevisiae sequence.
Figure 1—figure supplement 2
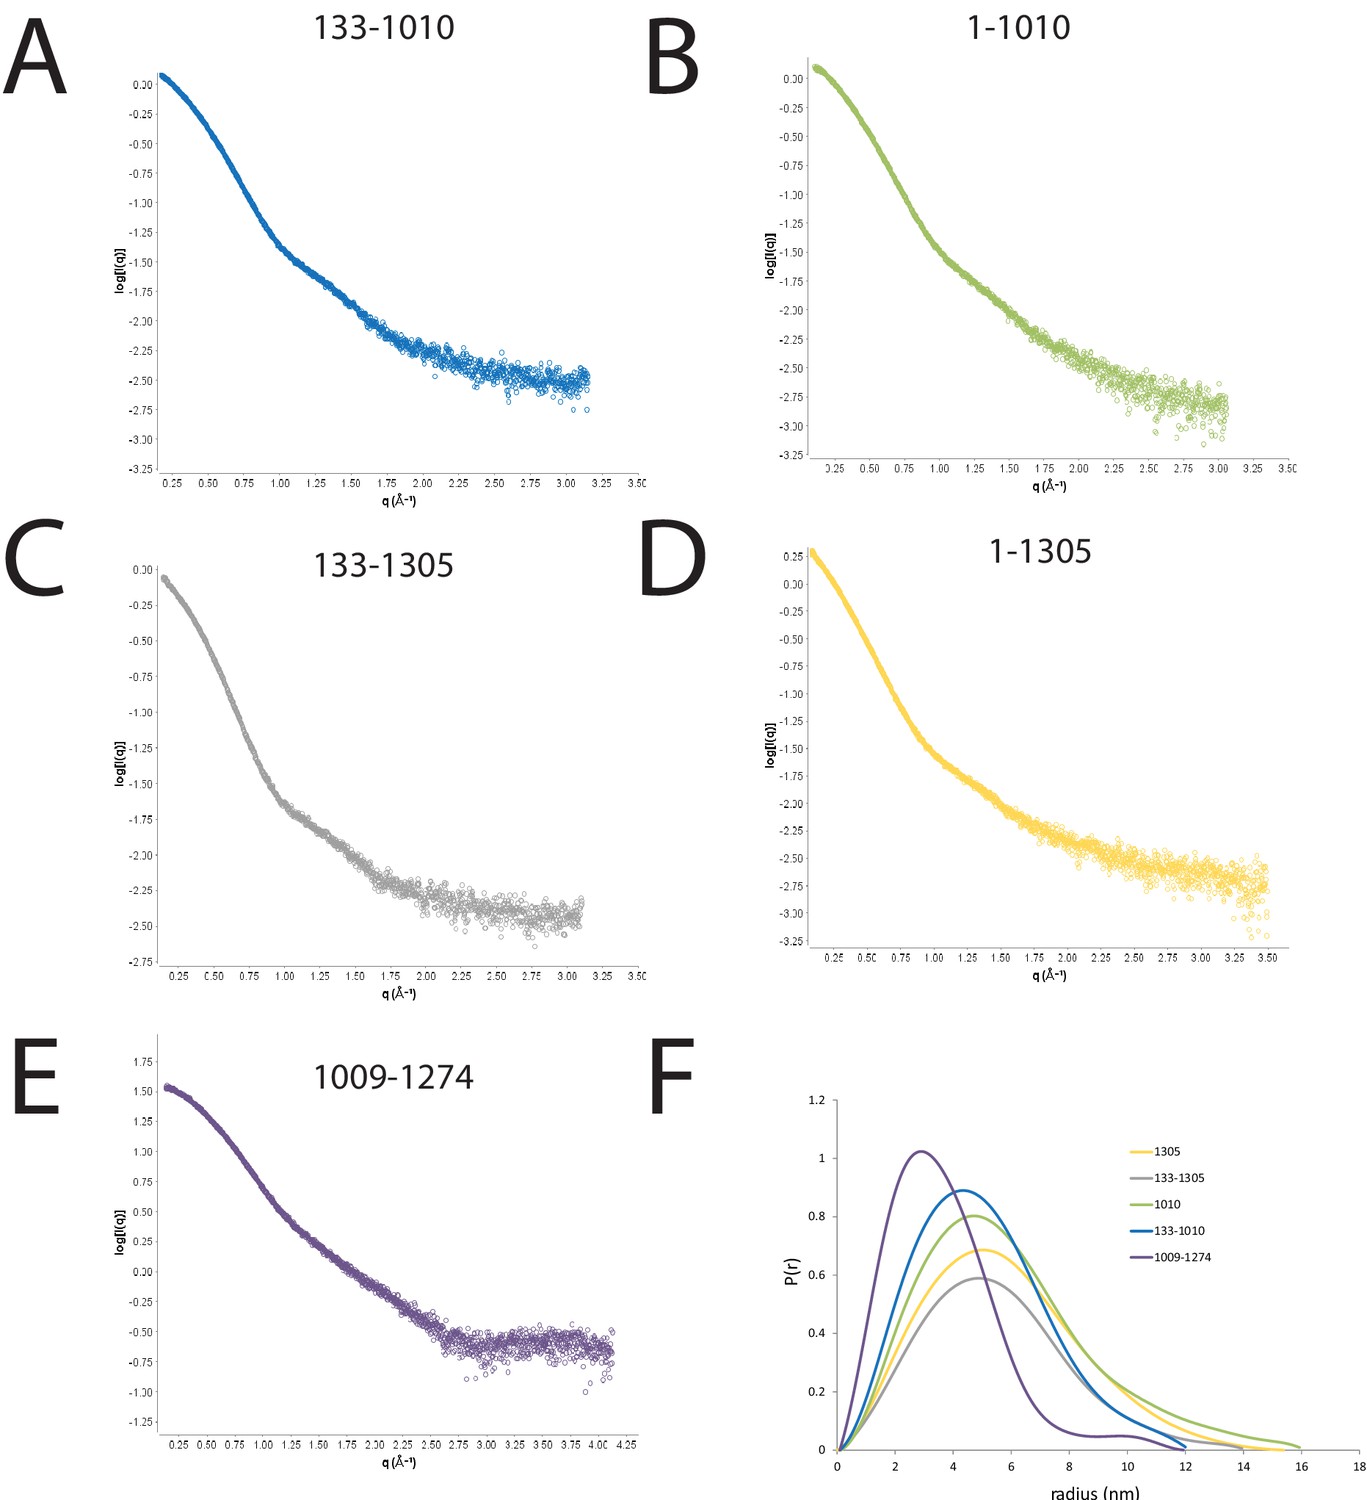
SAXS scattering curves for Chd1 fragments.
(A–E) plots of the scattering intensity against the scattering vector for the following Chd1 fragments (A) 133–1010, (B) 1–1010, (C) 133–1305, (D) 1–1305, (E) 1009–1274. (F) shows the probability distribution for the radius of gyration for each fragment.
Figure 2 with 7 supplements
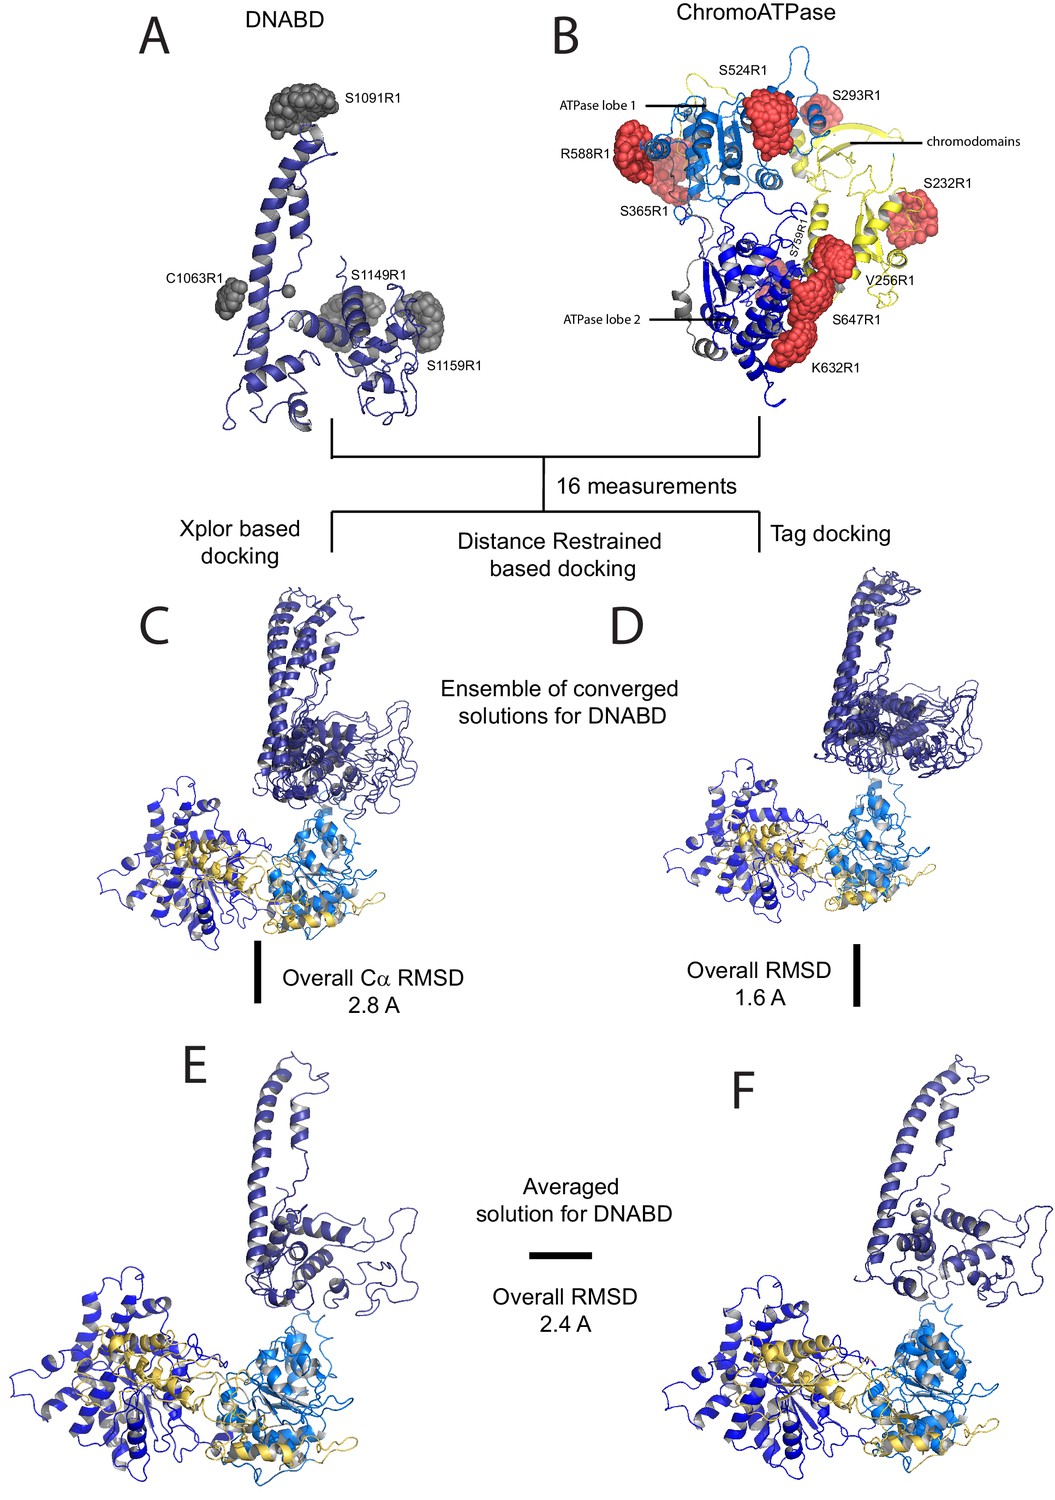
A model for the solution structure of Chd1 based on pulsed EPR measurements.
(A) Structure of DNA-binding domain and (B) chromoATPase domains of Chd1 shown in cartoon representation. The ensemble nitroxide atom distributions correspond to different molecular dynamics simulated conformers of the MTSSL spin label and shown as grey spheres on the DNA-binding domain and as red spheres on the chromoATPase domains. Chromo domain in yellow, ATPase lobe1 in marine, ATPase lobe 2 in blue and the linker region NegC in grey. (C) Converged solutions of the DNA-binding domain orientation relative to the chromo helicase domain determined by rigid body docking using sparse PELDOR data as distance restraints in Xplor-methods. The overall Cα RMSD of the converged structures is indicated. (D) An alternative approach using the Tagdocking method was amended for rigid body docking of the DNA-binding domain on to the chromo helicase. The Cα RMSD of the converged structures is indicated. (E,F) Final averaged structure and the relative Cα RMSD between the structure obtained with two methods are shown in cartoon representation.
Figure 2—figure supplement 1
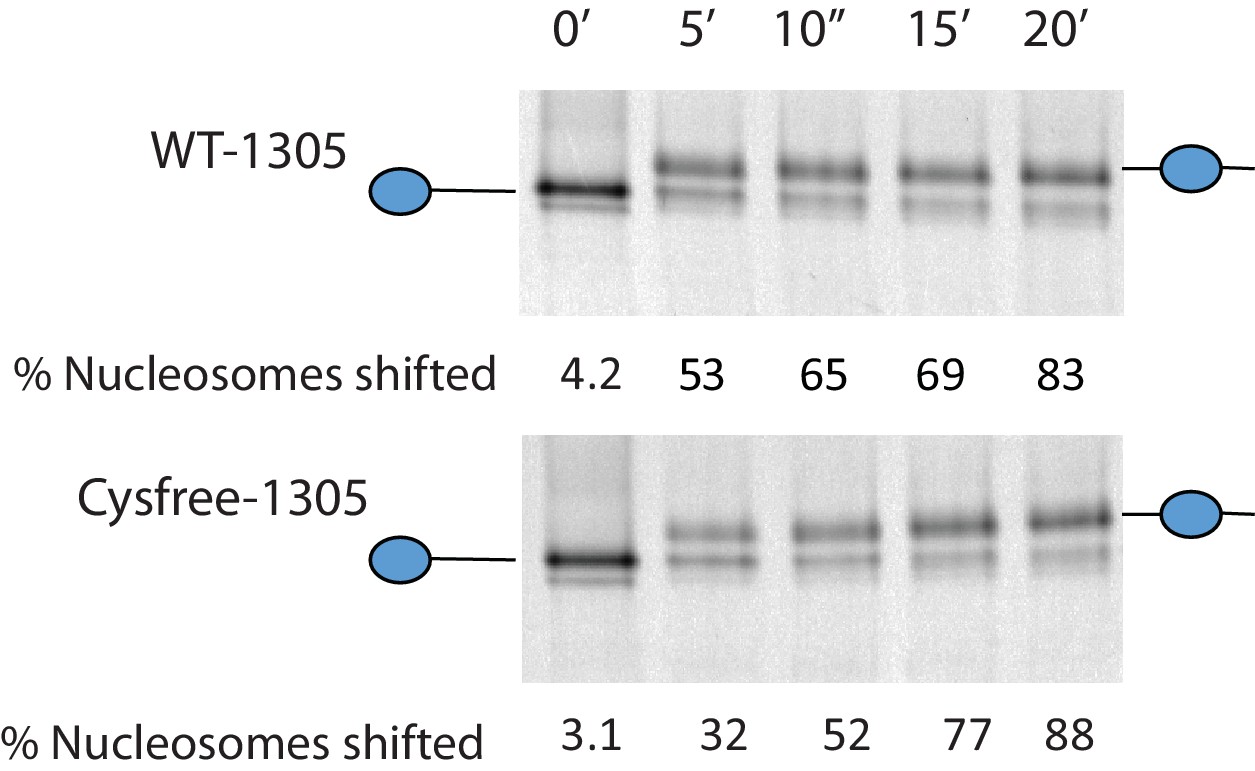
Activity of Chd1 following removal of native cysteines.
Nucleosomes assembled onto the fragment 0W47 labelled with cy3 were used as a substrate for repositioning assays using Chd1 1–1305 (top panel) or Chd1 1–1305 with the six native cysteins mutated to serines. Both proteins cause a time-dependent increase in the mobility of nucleosomes in the presence of ATP that is consistent with repositioning to a more central locations. Quantification of the proportion of nucleosomes repositioned indicates that the activities of the two proteins are comparable.
Figure 2—figure supplement 2
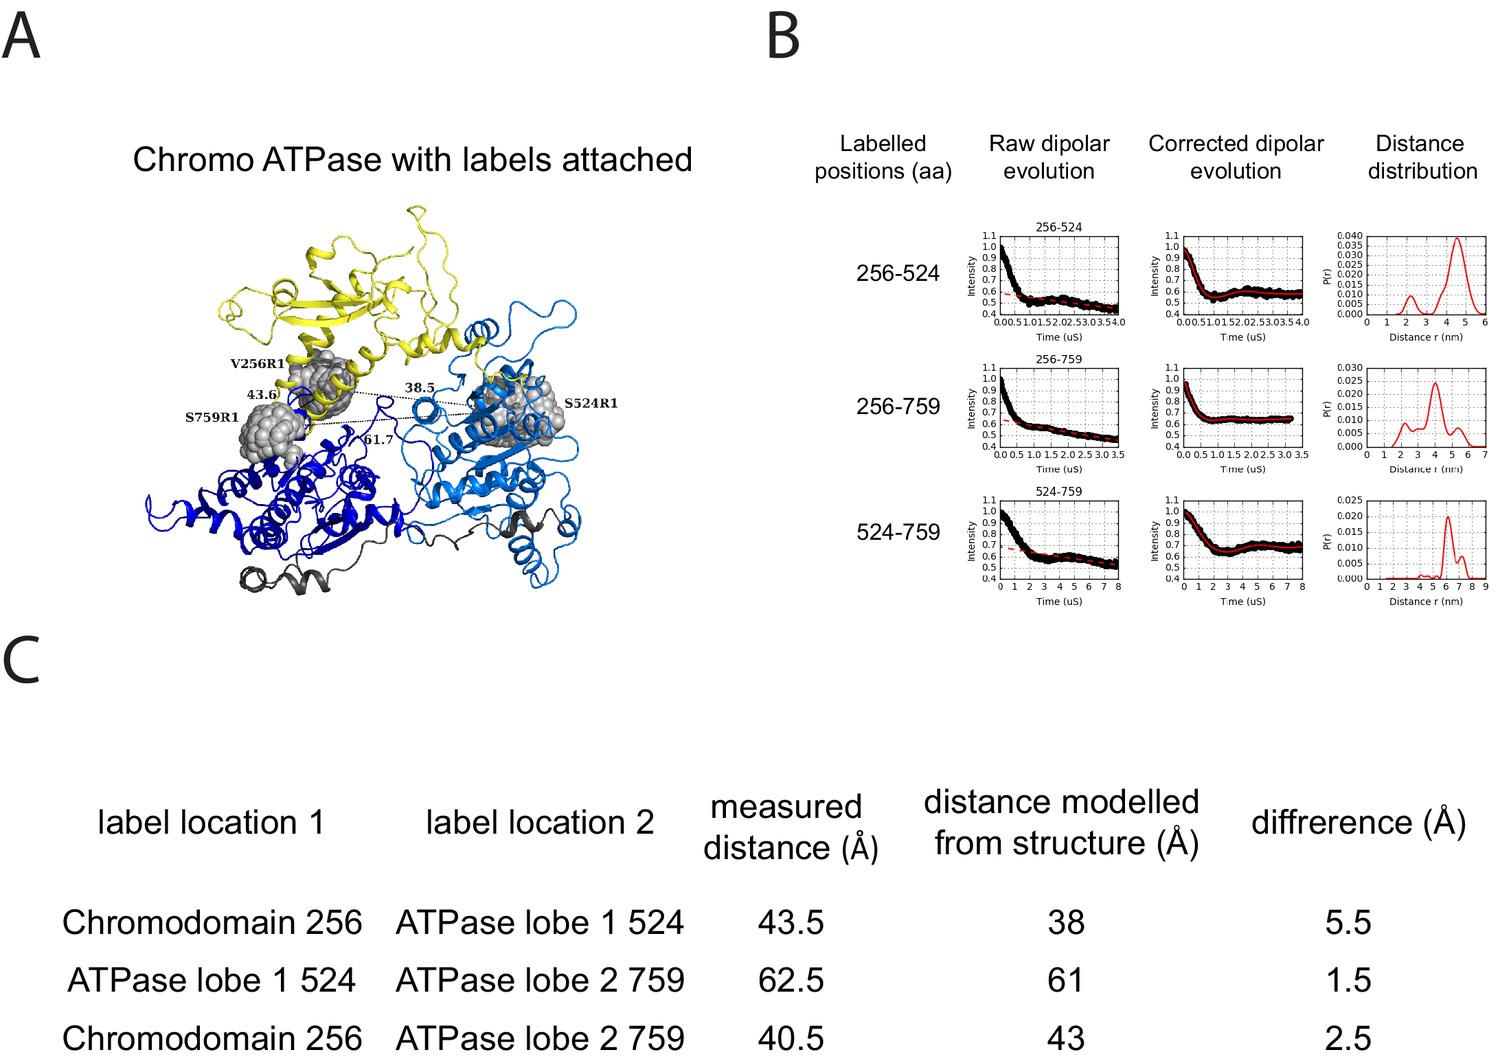
PELDOR measurements within the chromoATPase domains of Chd1.
(A) Cartoon representation of the chromo helicase domain with molecular dynamics simulated conformers of MTSSL spin label nitroxide atom drawn as spheres. (B) PELDOR time traces performed between these labelling sites. (C) The measured distance determined experimentally is compared with the distance anticipated based upon modelling to the crystal structure of the chromoATPase domains and the difference between these measurements is shown.
Figure 2—figure supplement 3
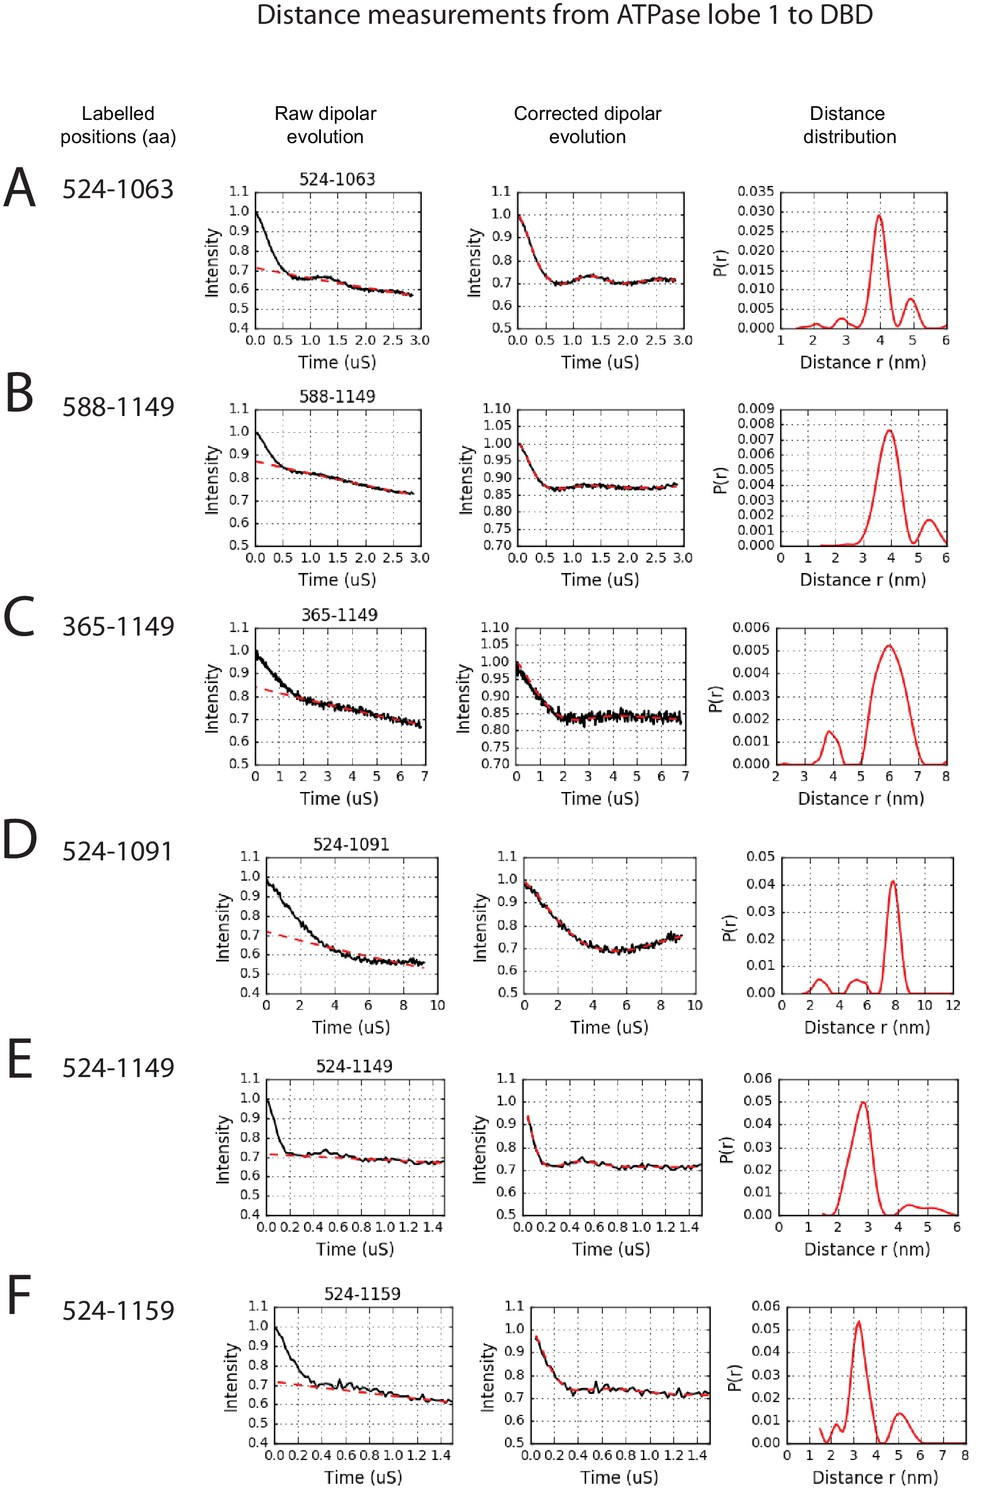
PELDOR measurements between ATPase lobe1 and the DNA-binding domain.
PELDOR data for pairs of spin labels attached to the indicated sites on ATPase lobe 1 and the DNA-binding domain of Chd1 (1-1305). Raw dipolar evolution, background corrected evolution and distance distribution obtained after Tikhonov regularisation are shown for the indicated sites.
Figure 2—figure supplement 4
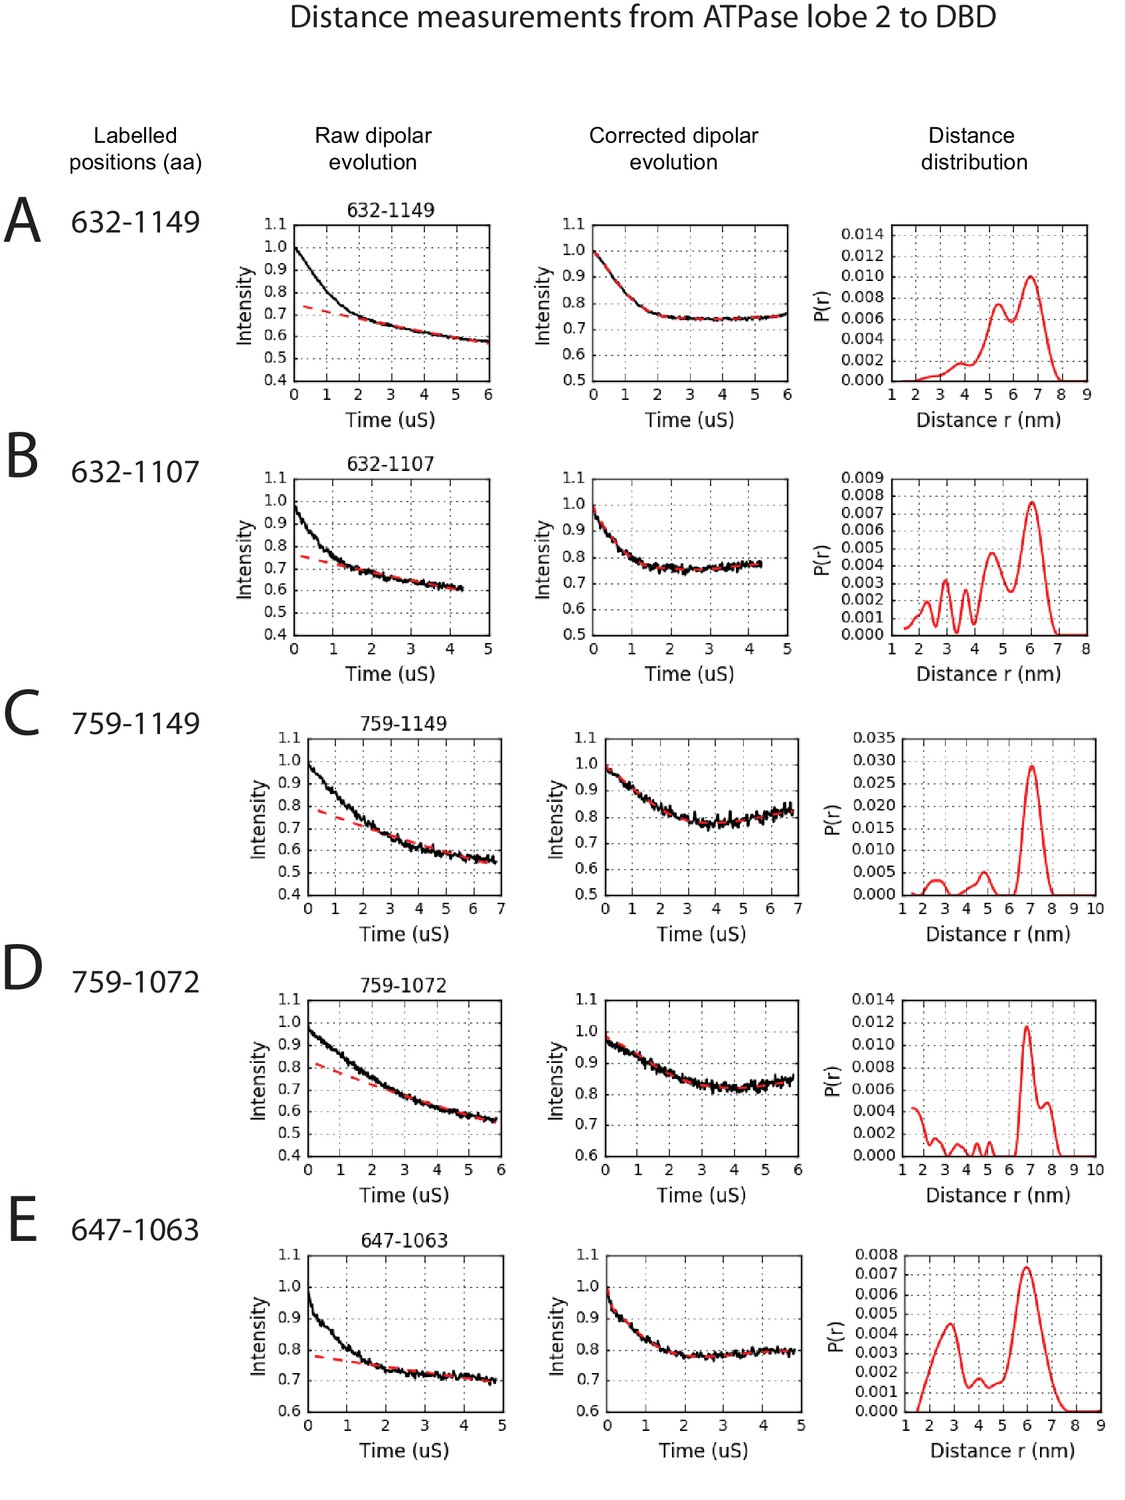
PELDOR measurements between ATPase lobe 2 and the DNA-binding domain.
PELDOR data for pairs of spin labels attached to ATPase lobe 2 and the DNA-binding domain of Chd1 (1-1305). Raw dipolar evolution, background corrected evolution and distance distribution obtained after Tikhonov regularisation are shown for the indicated sites.
Figure 2—figure supplement 5
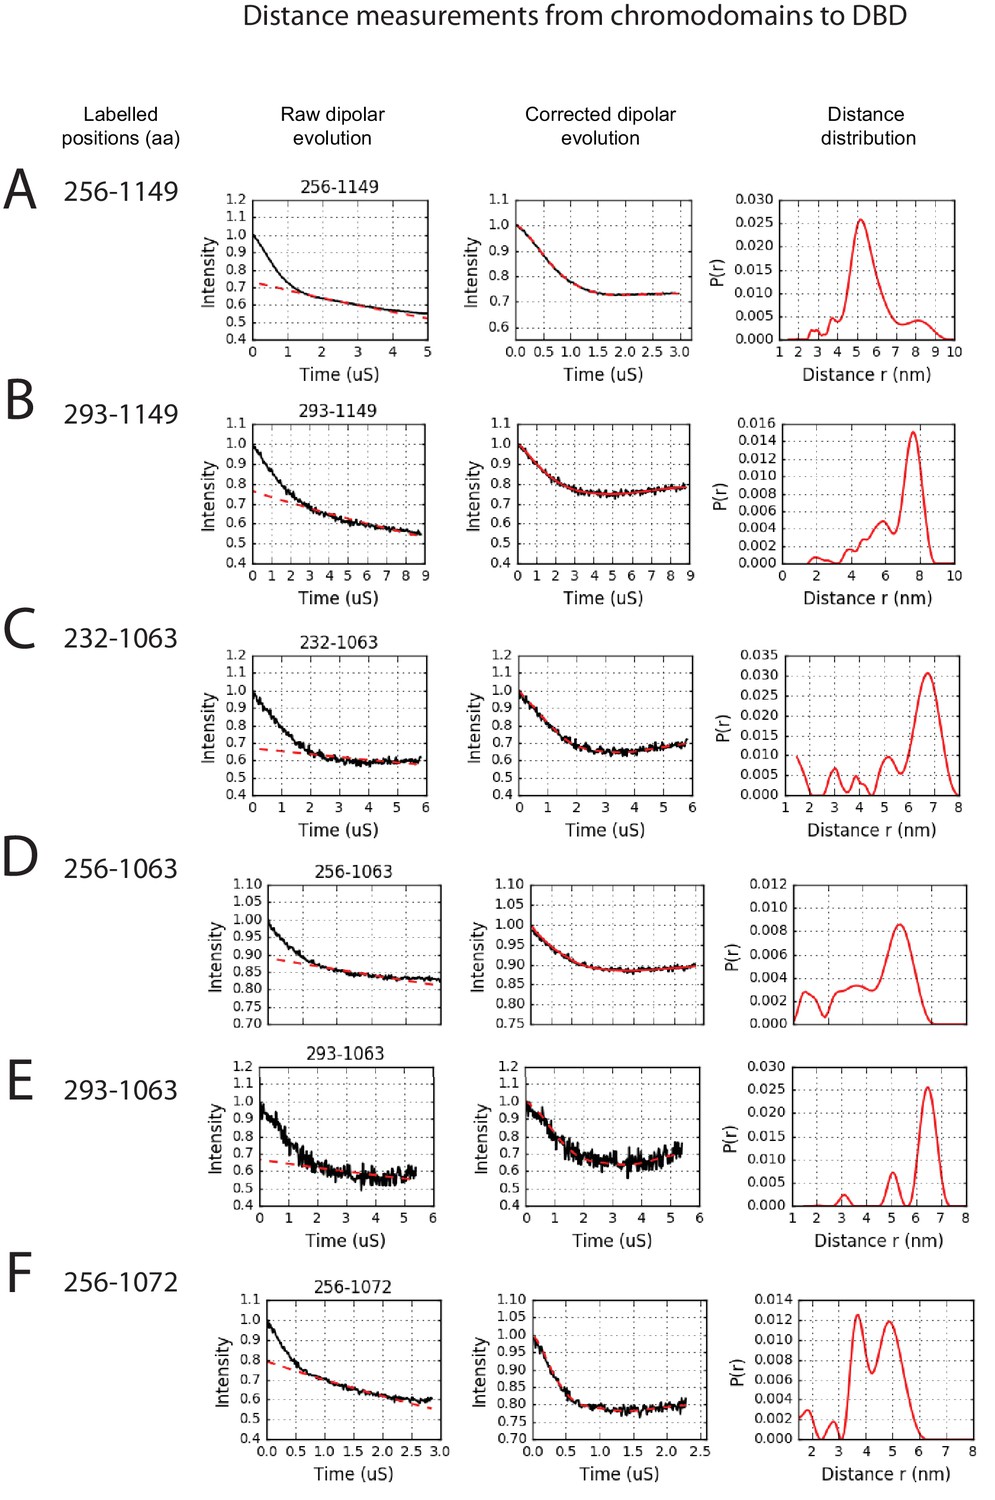
PELDOR measurements between chromodomains and the DNA-binding domain.
PELDOR data for pairs of spin labels attached to the chromodomains and sites on the DNA-binding domain of Chd1 (1-1305). Raw dipolar evolution, background corrected evolution and distance distribution obtained after Tikhonov regularisation are shown for the indicated sites.
Figure 2—figure supplement 6
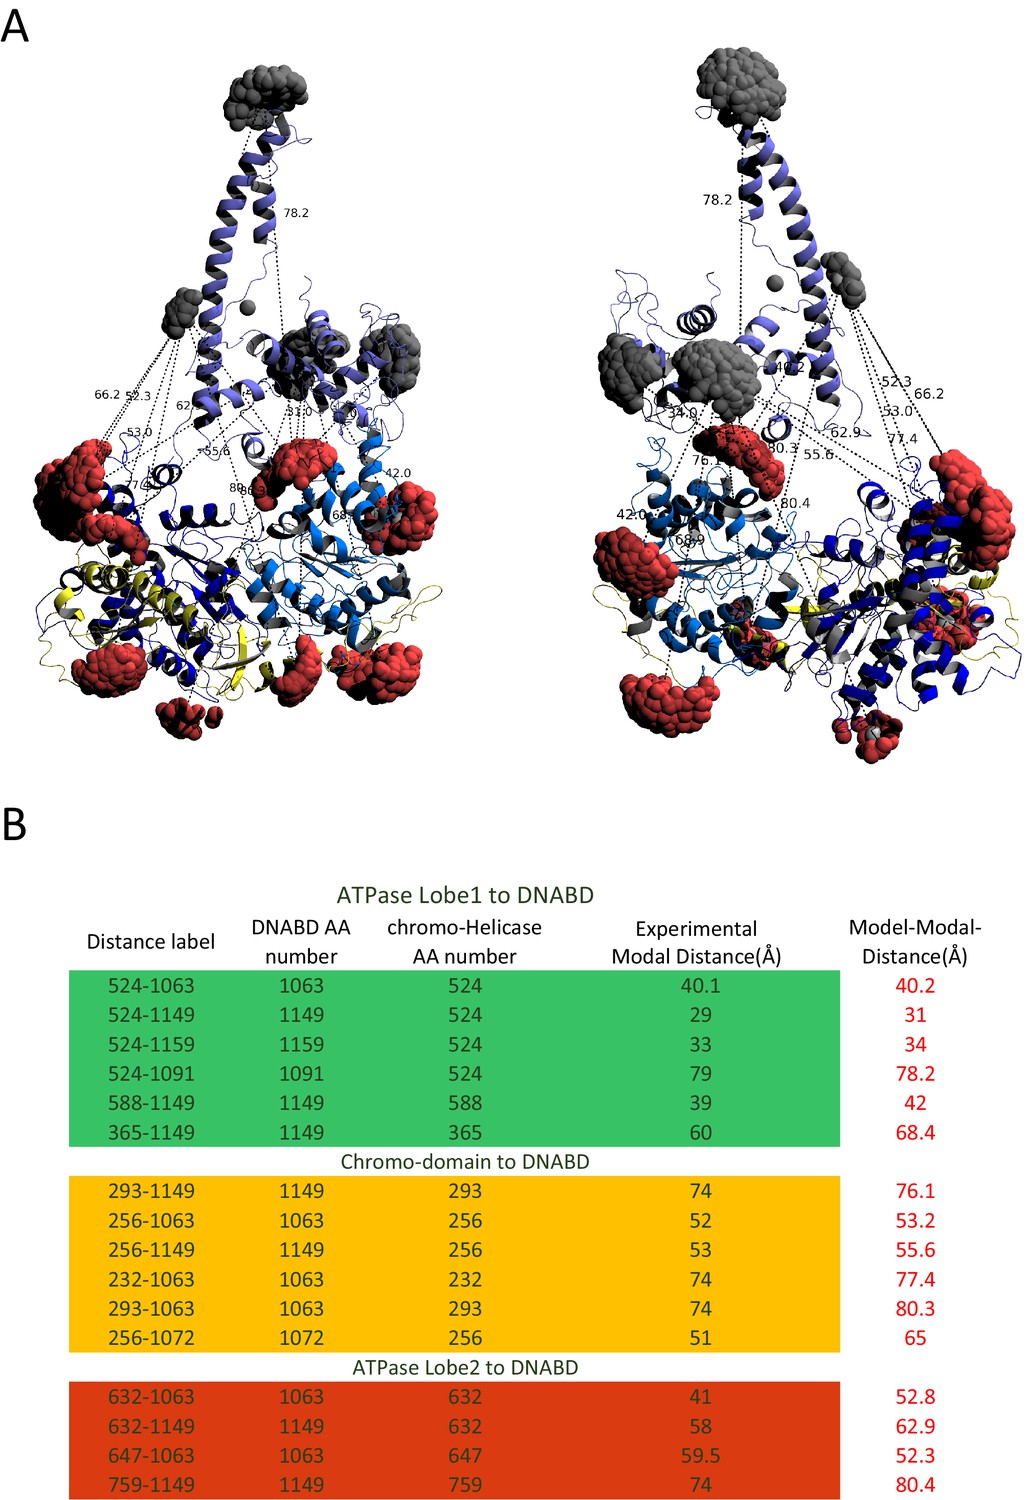
Modelled orientation of chromoATPase and DNA-binding domain.
(A) Cartoon representation of the chromo helicase and DNA-binding domain with measured distances indicated. (B) The measured distances determined experimentally are compared with the distances anticipated based on the averaged model obtained in Figure 2E.
Figure 2—figure supplement 7

Fit of PEDOR model for Chd1 into SAXS volume.
(A) Ab-initio generated SAX volume obtained for Chd1 1-1305 is shown in two orientations. The structure fitted into volume is the model generated from rigid body docking of known crystal structures using sparse PELDOR distance distribution measurements. The difference volume coloured in red-orange indicates the unresolved structures of Chd1 protein (1-175aa in the N-terminal and 932–1010). (B) Comparison of the theoretical scattering curve generated by the alignment of the DNA-binding domain and chromoATPase using the PEDLDOR model (solid red) X2 = 11.5 and following inclusion of N-terminal and linker regions as dummy residues (dashed green) X2 = 2.08 with the experimentally obtained scattering from Chd1 1–1305 (black spots).
Figure 3 with 1 supplement
The N-terminus of Chd1 mediates interactions with the DNA-binding domain.
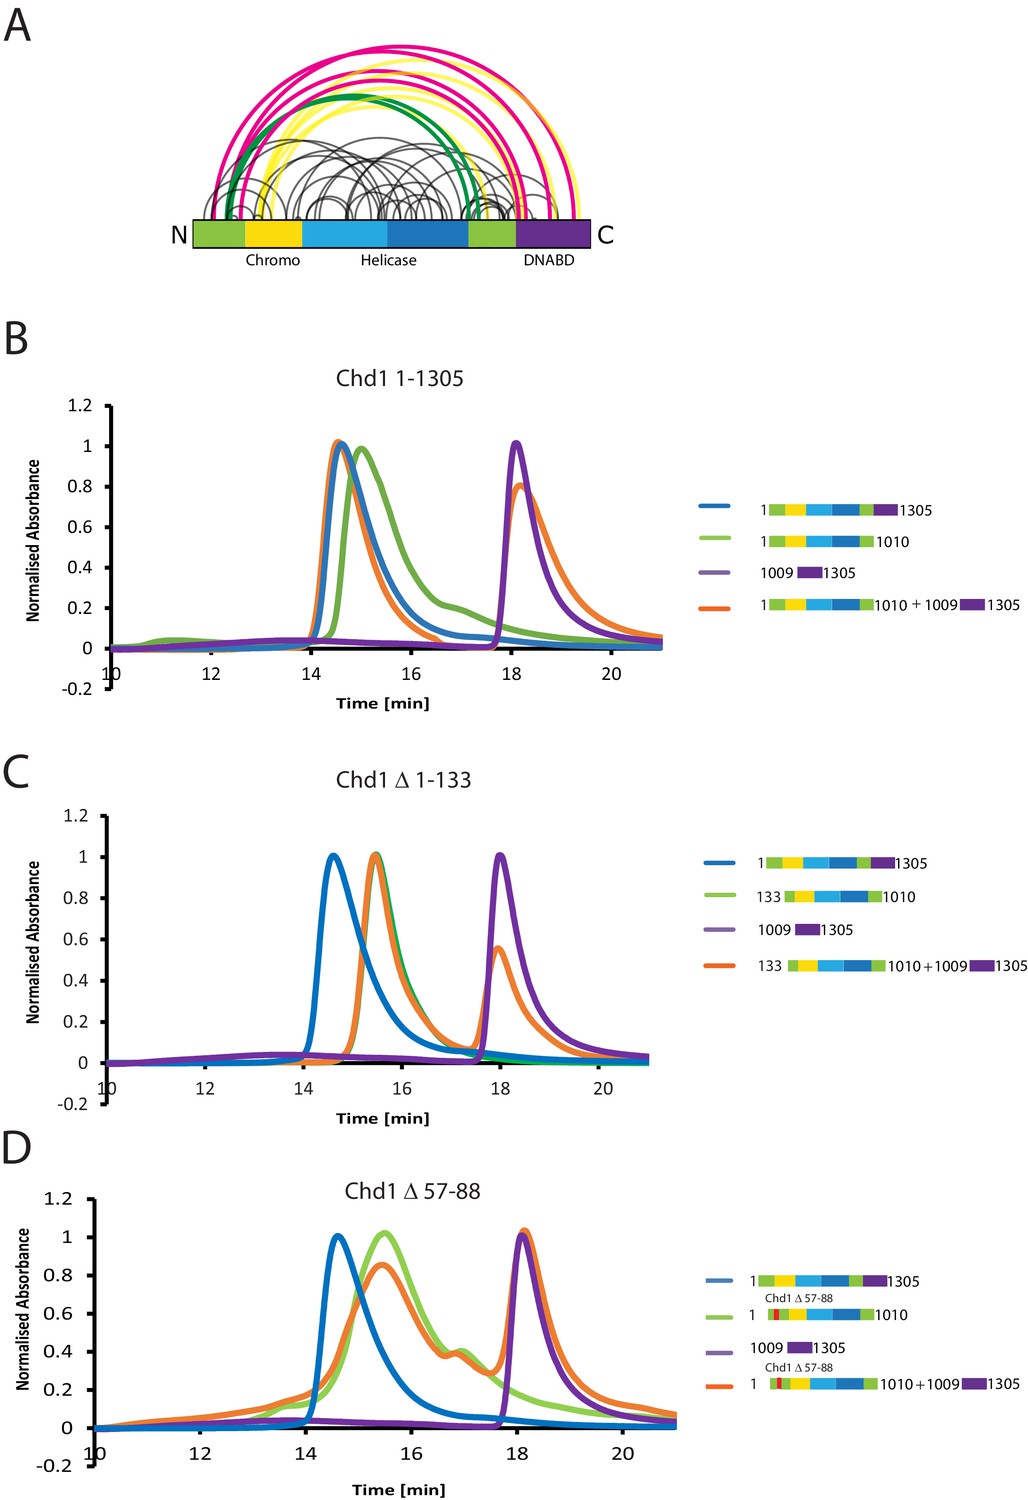
(A) Sites covalently linked by the crosslinker BS3 were identified by mass spectrometry and are represented graphically using a plot generated with Xvis (Grimm et al., 2015). Thick red and green lines indicates crosslinks between the N-terminal and C-terminal regions. (B) Size exclusion chromatography (SEC) elution profiles of selected Chd1 fragments. Normalised elution profile of DBD (1009–1305) in purple, chromo-helicase with intact N-terminal region (1–1010) in green, and Chd1 (1–1305) in blue. The elution profile for a 3:1 mixture of the DBD with the chromoATPase (1–1010 + 1009–1305) is shown in orange. The chromoATPase elutes at low volume consistent with the formation of a complex between the N- and C-terminal fragments. (C) Normalised elution profile of Chromo-helicase missing the N-terminal 133 amino acids is coloured green. Other profiles are similar to as described in Figure 3A. Loss of the N-terminal 133 amino acids prevents association with the C-terminal DBD. (D) Similar SEC experiment performed using a Chd1 N-terminal fragment that includes the internal deletion △ 57–88. This also prevents association between the two halves of the protein.
Figure 3—figure supplement 1
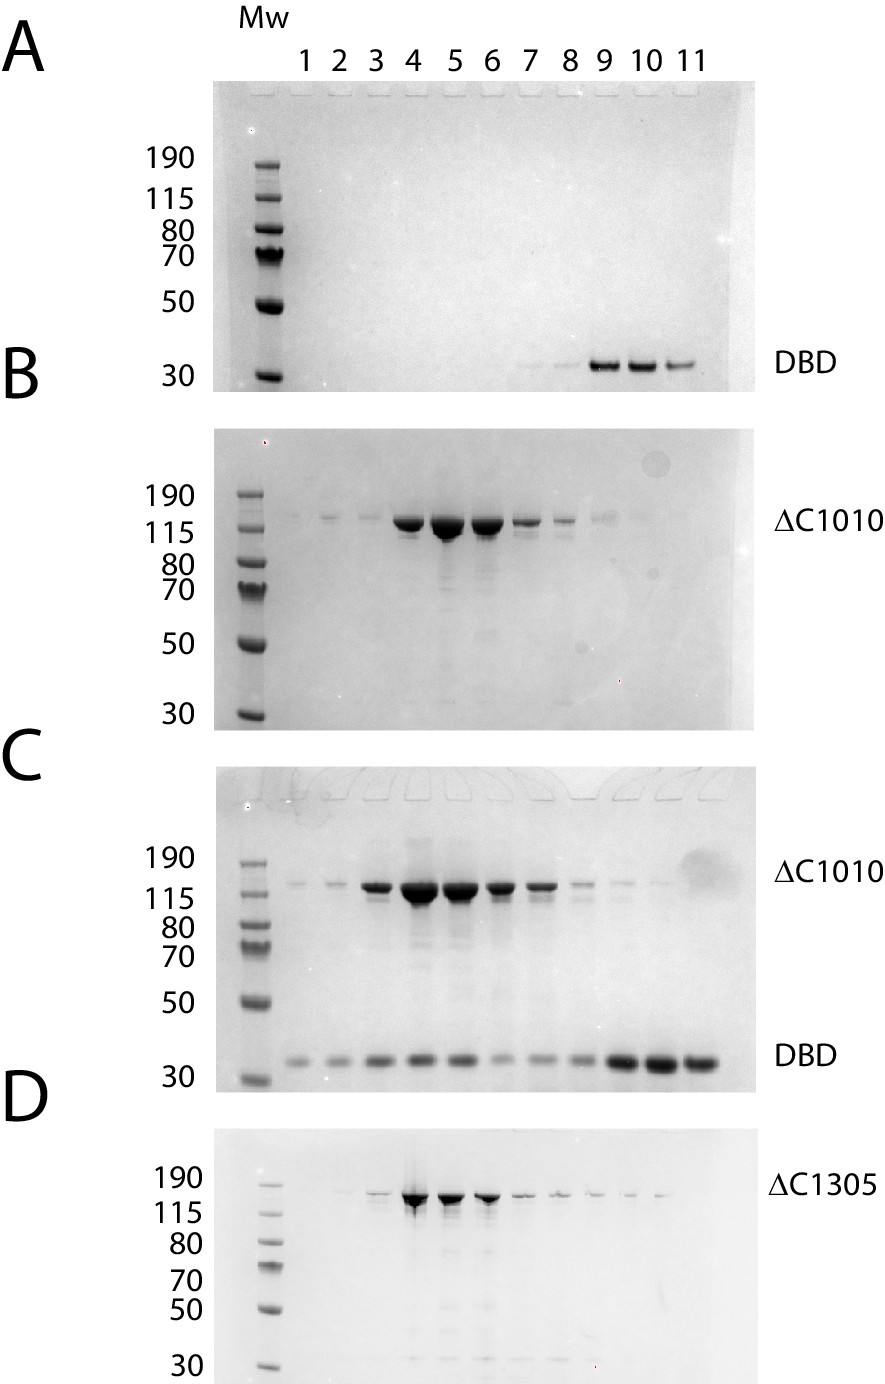
Protein composition of SEC peaks.
Fractions from size exclusion column chromatography as illustrated in Figure 3B. (A) Chd1 1009–1305 elutes as a peak centred on fraction 10 (volume 2.7 ml), (B) Chd1 1–1010 elutes in fraction 5 (2.2 ml), (C) When a mixture of Chd1 1–1010+Chd1 1009–1305 is resolved by SEC, Chd1 1009–1305 elutes one fraction earlier, fraction 4 (2.1 mL), at a similar location to intact Chd1 1–1305 (D). A proportion of Chd1 1009–1305 elutes in higher molecular weight fractions consistent with dynamic equilibrium with the N-terminal fragment. Molecular weight markers are loaded in the left hand lane of each gel.
Figure 4
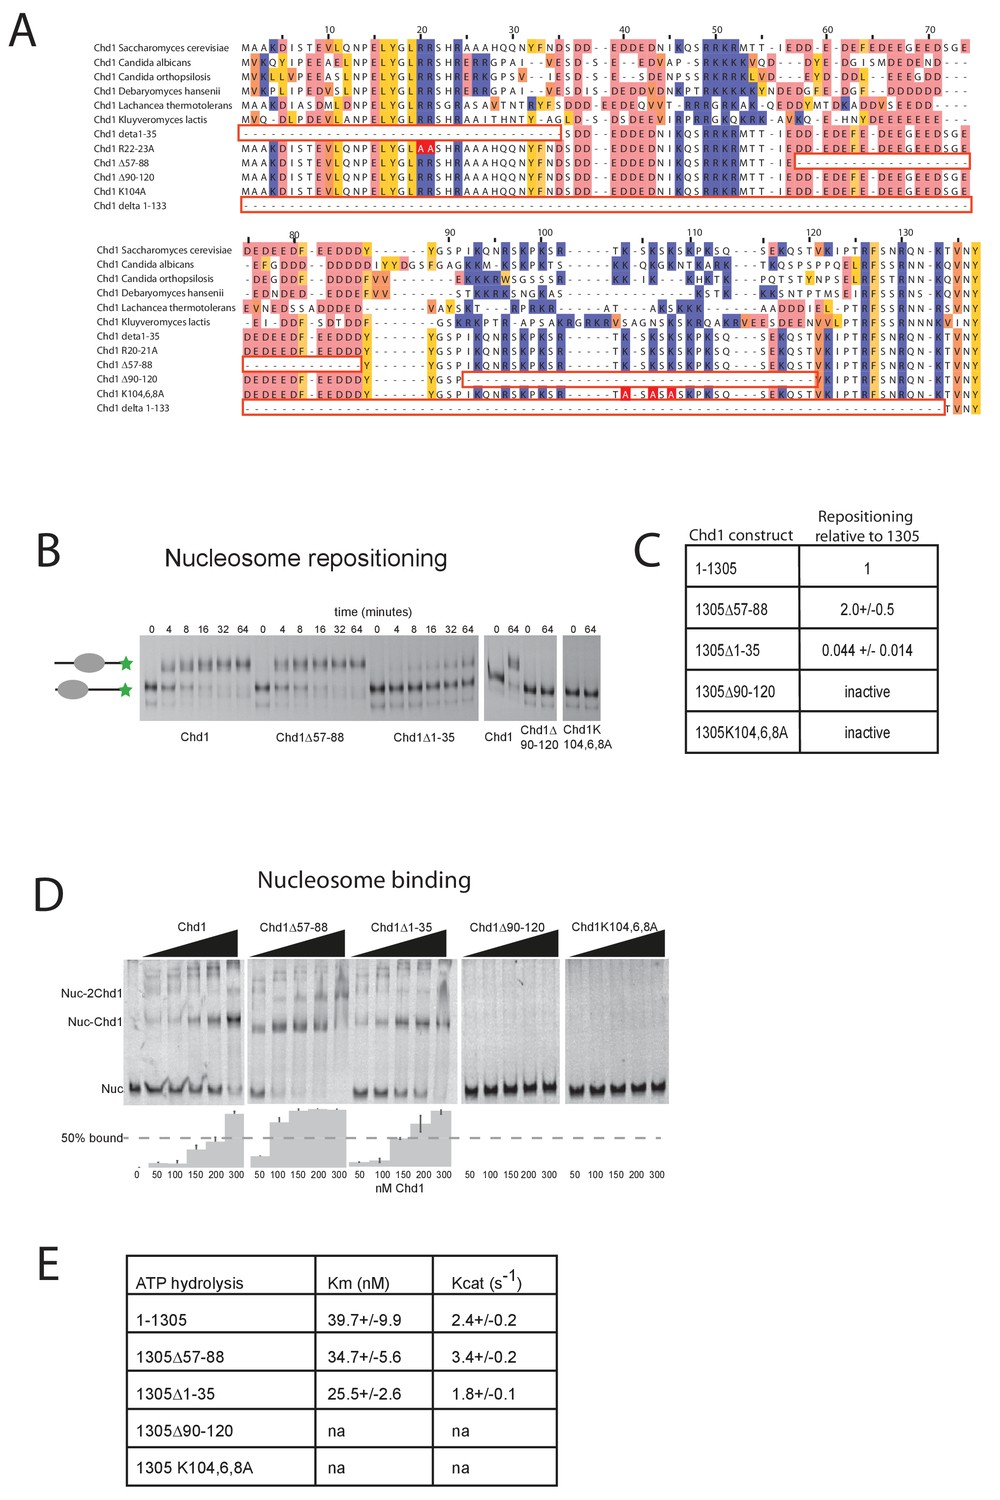
Mutations to the Chd1 N-terminus have positive and negative effects on activity.
(A) Alignment of Chd1 proteins from the indicated yeast species indicates that sequences in the N-terminal region are conserved. Below this mutations to the N-terminal region characterised in this study are indicated. Numbering is to the Saccharomyces cerevisiae sequence. (B) 100 nM nucleosomes assembled on a DNA fragment consisting of the 601 nucleosome positioning sequence flanked by 47 bp linker DNA on one side were incubated at 30°C with 2 nM enzyme, aliquots of the reaction were stopped at 0, 4, 8, 16, 32, and 64 min. Repositioning of the nucleosome to the DNA centre show an increase in activity for the △57–88 and a decrease for the △1–35 mutation. As mutations in the basic patch resulted in no measurable repositioning, the reaction was run for t = 0 and 64 min. (C) Initial reaction rates relative to wild type were determined from a non-linear fit, and are presented as mean +/- standard deviation for N = 3. (D) 25 nM nucleosomes were incubated with increasing concentrations of enzyme (50, 100, 150, 200, and 300 nM). Representative gel images are shown with bar graphs below showing the mean +/- standard deviation of percent bound from triplicate experiments. At high concentrations of Chd1 super-shifted complexes corresponding to two or more Chd1 molecules binding a nucleosome are observed. (E) 5 nM enzyme was reacted with increasing amounts of nucleosome (10, 20, 40, 80, and 160 nM) and phosphate release from ATP hydrolysis was monitored by fluorescence intensity. Non-linear regression of triplicate experiments was used to define Km as the nucleosome concentration at half maximal reaction rate and kcat as the enzyme turnover at maximum rate. R squared values for the fits were above 0.9 in all cases. Phosphate release with high nucleosome concentration was not above background signal in either basic patch mutant, making calculation of kinetic parameters unfeasible.
Figure 5 with 3 supplements
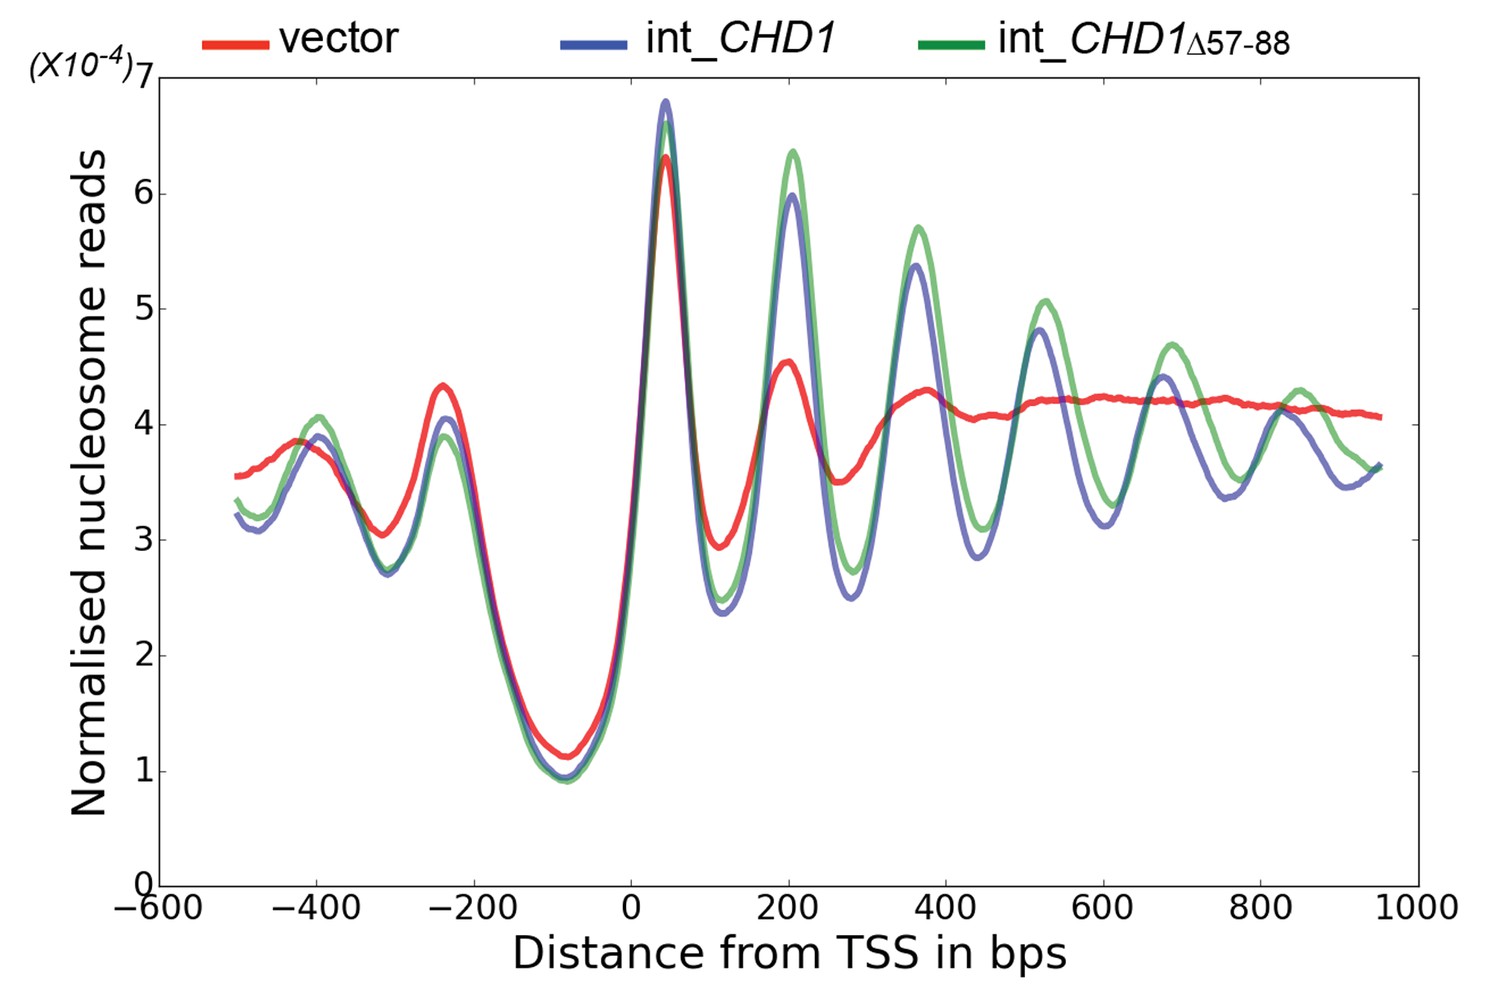
Chd1 △ 57–88 exhibits increased internucleosome spacing in vivo.
MNase-Seq was carried out on a chd1△isw1△ strain transformed with CHD1 and chd1△57-88(integrated at the CHD1 locus) to obtain genome-wide nucleosome occupancy profiles. TSS-aligned nucleosome occupancy profiles are plotted and show restoration of nucleosome organisation with both Chd1 proteins, but with a downstream shift in the locations of nucleosomes organised by the chd1 △57–88 mutant.
Figure 5—figure supplement 1
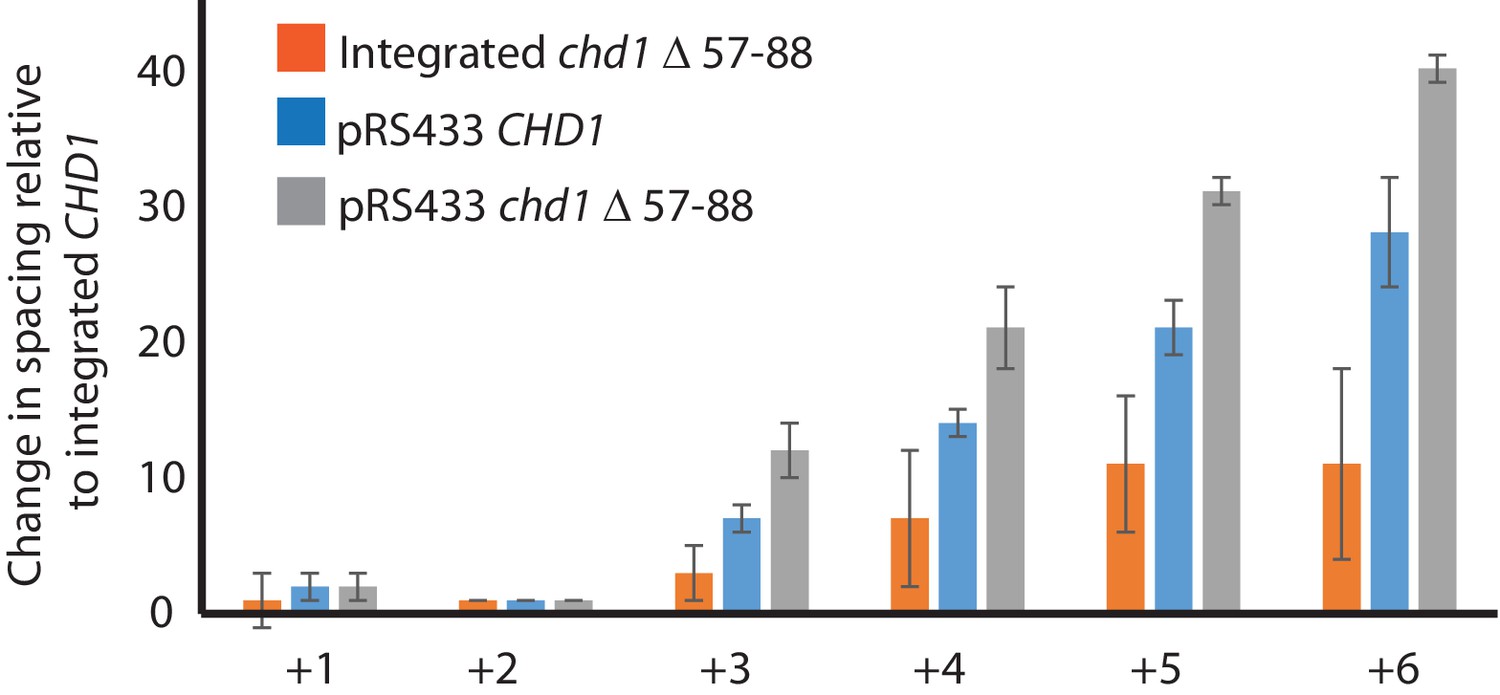
Changes in nucleosome positioning following reintroduction of different Chd1 constructs.
Quantitative changes in nucleosome spacing in coding in strains expressing Chd1 (wt/(△57–88) at low (int-integrated) or high (Ectopically expressed from multicopy plasmid pRS423) levels. The shift in nucleosome positions (+1 to +6) in the coding region was calculated relative to integrated-CHD1. The progressive increase in the positioning defect for more distal nucleosomes indicates a difference in average nucleosome spacing. Error bars indicate the standard deviation from three independent repeats.
Figure 5—figure supplement 2
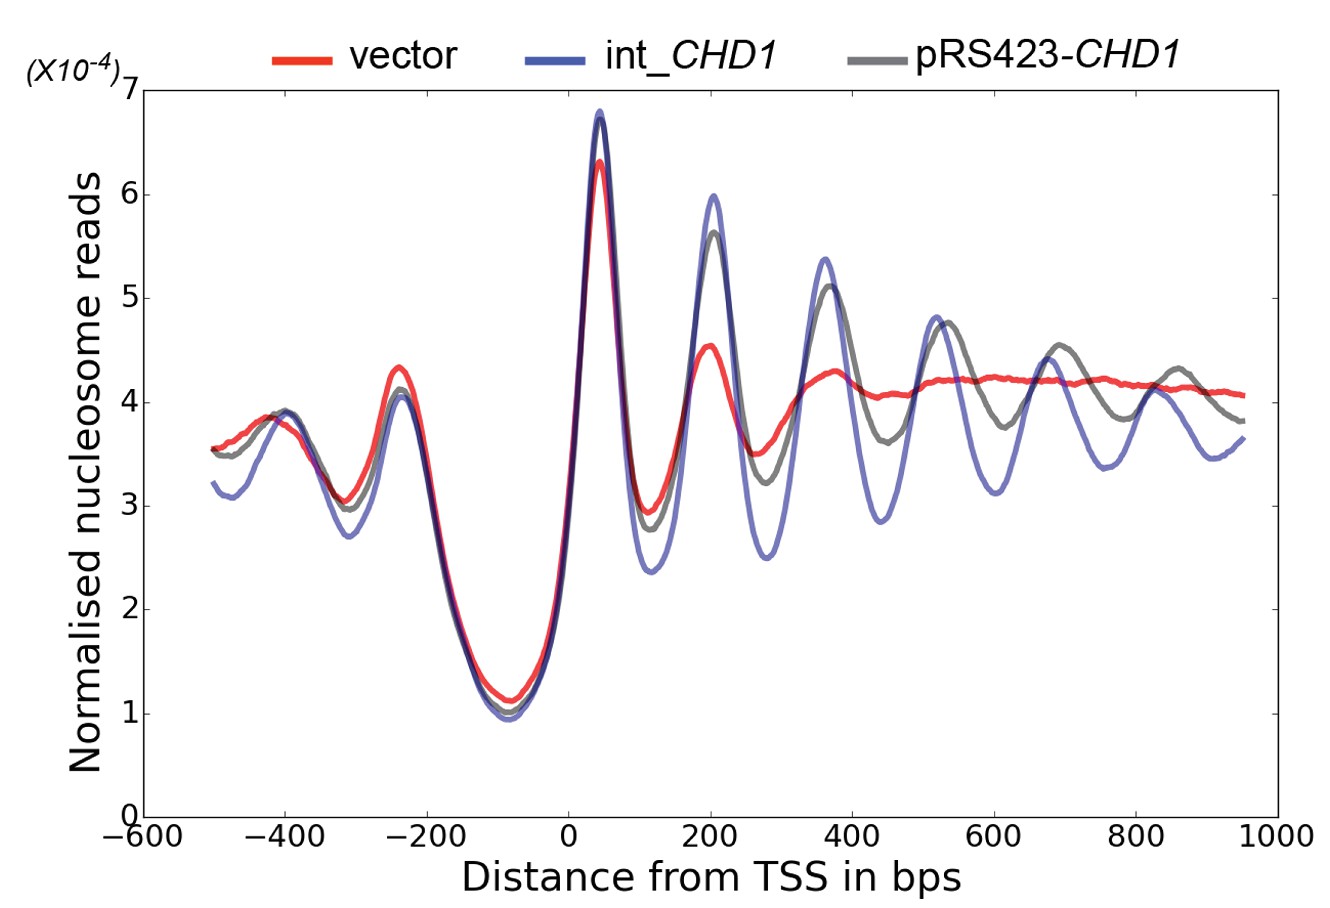
Changes in nucleosome positioning following reintroduction of CHD1 at low or high copy number.
Changes in nucleosome spacing in coding regions were measured in isw1△, chd1△ strains transformed with a control vector (vector, red) or in which CHD1 was reintroduced integrated onto the chromosome in single copy (int-CHD1, blue) or at high copy on the multi-copy plasmid pRS423 (pRS423-CHD1, green). TSS-aligned nucleosome occupancy profiles were plotted for the above strains show increased spacing in the strains with higher levels of CHD1.
Figure 5—figure supplement 3
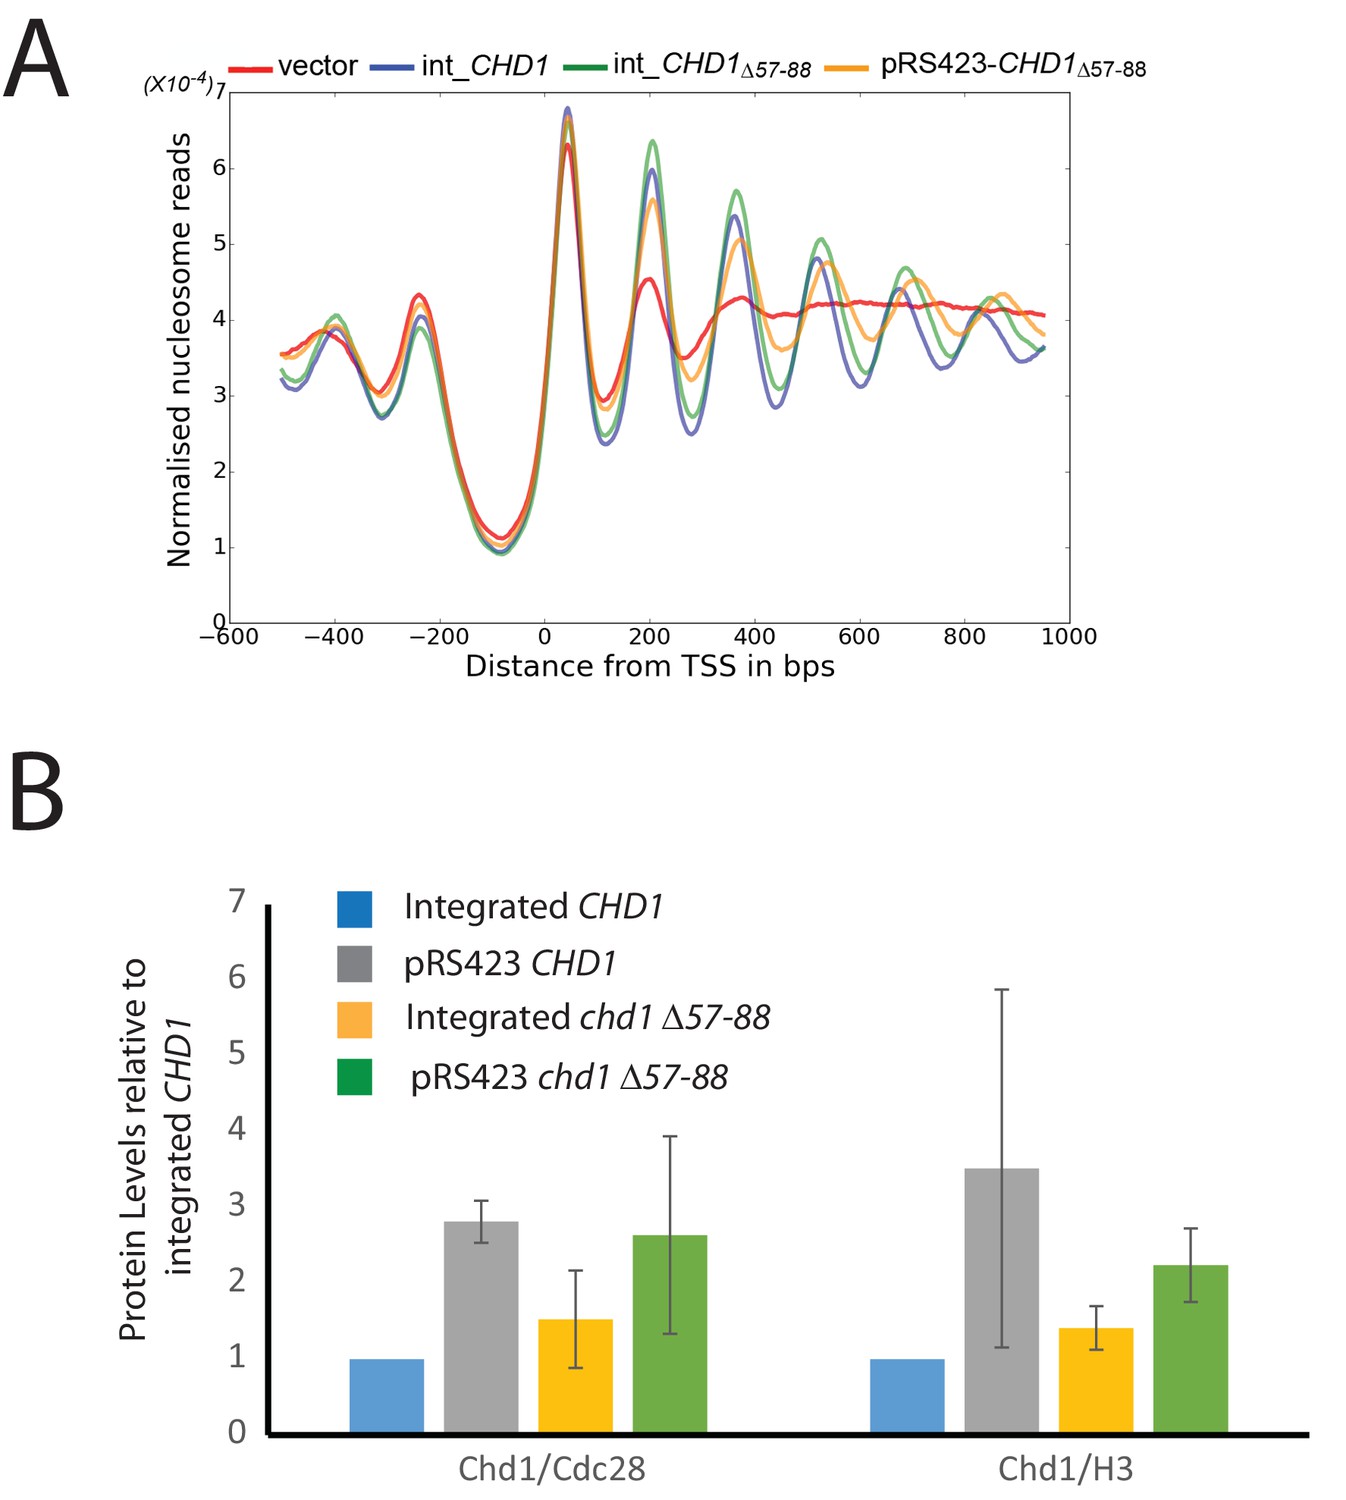
Changes in nucleosome positioning following reintroduction of chd1△57–88 at low or high copy number.
(A) Changes in nucleosome spacing in coding regions were measured in strains expressing chd1△57–88 re-integrated in single copy at the CHD1 locus (int_CHD1△57–88, green) or at higher copy number on pRS423 (pRS423_CHD1△57–88, orange). Vector only (red) and CHD1 wt reintroduced integrated onto the chromosome in single copy (int-CHD1, blue) from Figure 5 are also shown for comparison. TSS-aligned nucleosome occupancy profiles show increased spacing in strains with chd1△57–88 compared to wild-type CHD1 (int_ CHD1). Replacement on a high copy plasmid results in two- to fourfold increased Chd1 expression. (B) Quantitative measurement of protein levels in strains expressing CHD1wt or chd1△57–88 at low (int) or high (pRS423) copy number. For all strains described in A, Chd1 was N-terminally flag tagged and anti-FLAG Western blotting used to plot protein levels relative to int-CHD1wt. Quantitation is plotted following normalisation against total histone H3 and Cdc28 as indicated. Error bars indicate standard error from 3–4 measurements.
Figure 6
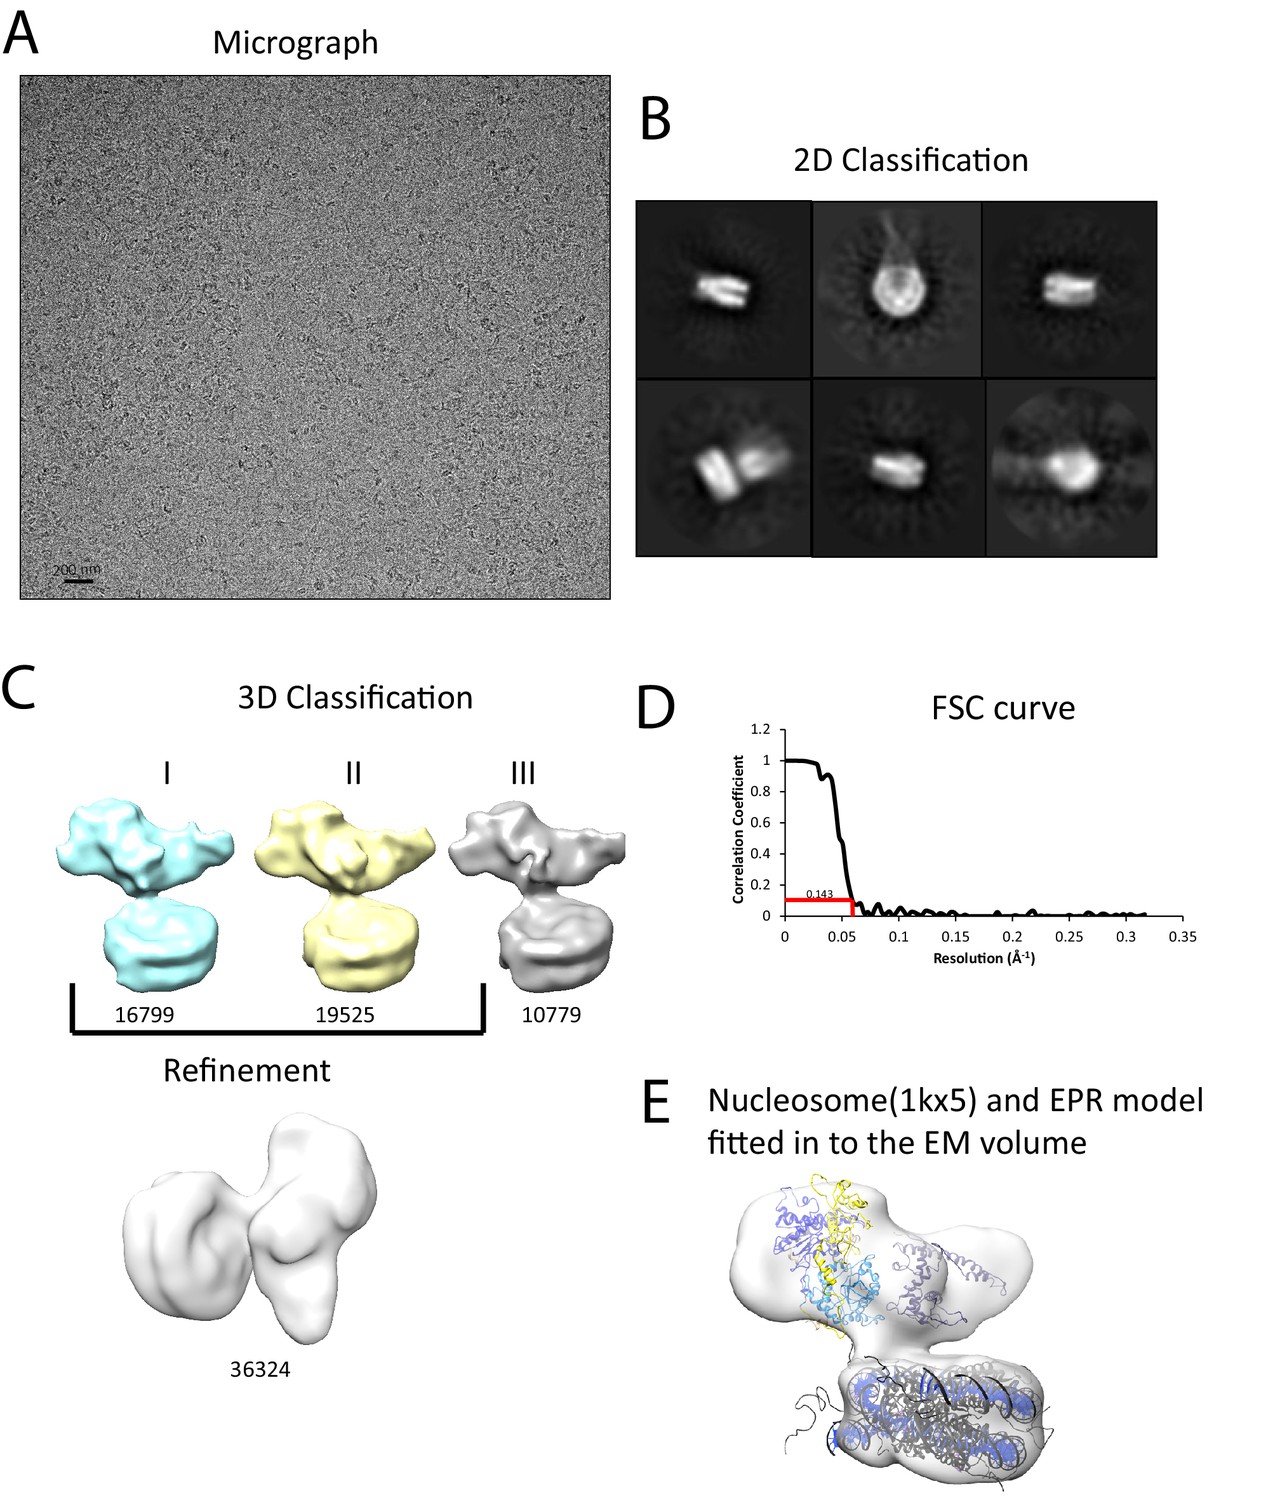
Interaction of Chd1 with nucleosomes in the APO state.
(A) Representative micrograph of frozen hydrated nucleosome-Chd1 apo complex. (B) Two-dimensional class averages of the CTF corrected auto picked particles is shown. (C) Volume maps are drawn for the three classes obtained from the 3D classification of the particles and final refined volume of the set of 3D classified particles from merging two similar 3D classes as indicated. (D) Fourier-Shell correlation after gold-standard refinement and conservative resolution estimate at 0.143 correlation. (E) Electron density map obtained for nucleosome-Chd1 apo complex is shown in semi-transparent surface. The constructed Chd1 solution structure and the nucleosome (1KX5) are docked into the volume.
Figure 7 with 4 supplements
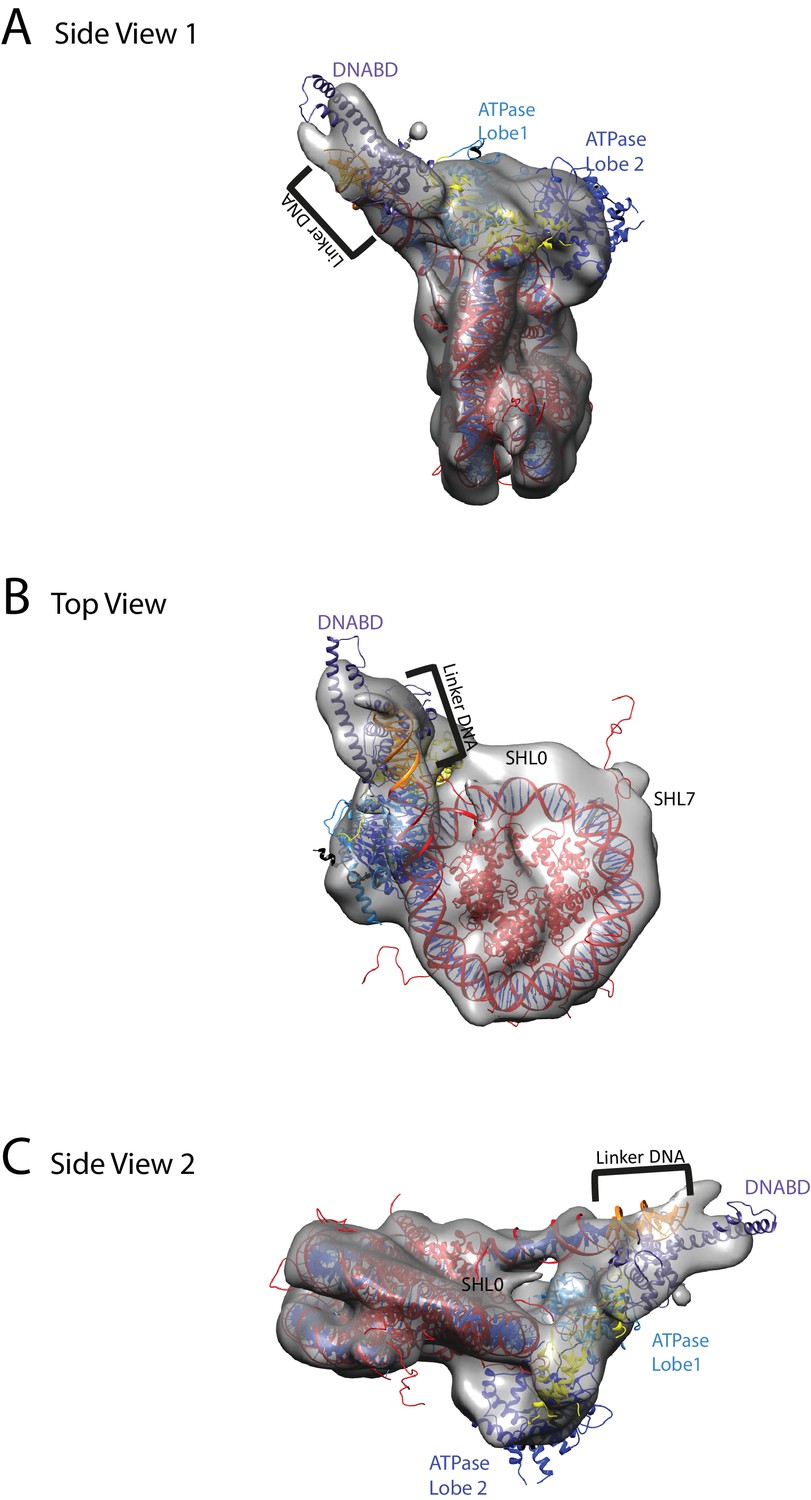
Chd1 bound to nucleosomes via its DNA binding and ATPase domains.
(A) Side view 1 of the electron density map shown in semi-transparent grey surface with docked nucleosome (red, 1KX5) and the Chd1, chromoATPase (3MWY) and DNA-binding domain (3TED) crystal structures shown in cartoon representation. The various domains of Chd1 are labelled. ATPase lobe1 in marine, ATPase lobe2 in blue, chromo domain in yellow and the DNA-binding domain in deep blue. The 11 bp DNA linker region defined in the electron density map is coloured orange and indicated. (B) Top view of the nucleosome-bound Chd1 complex. The dyad axis of the nucleosome is labelled as SHL0 (super helical location 0) and edge of the nucleosome is indicated as SHL7. (C) Side view 2 of the nucleosome-Chd1 complex.
Figure 7—figure supplement 1
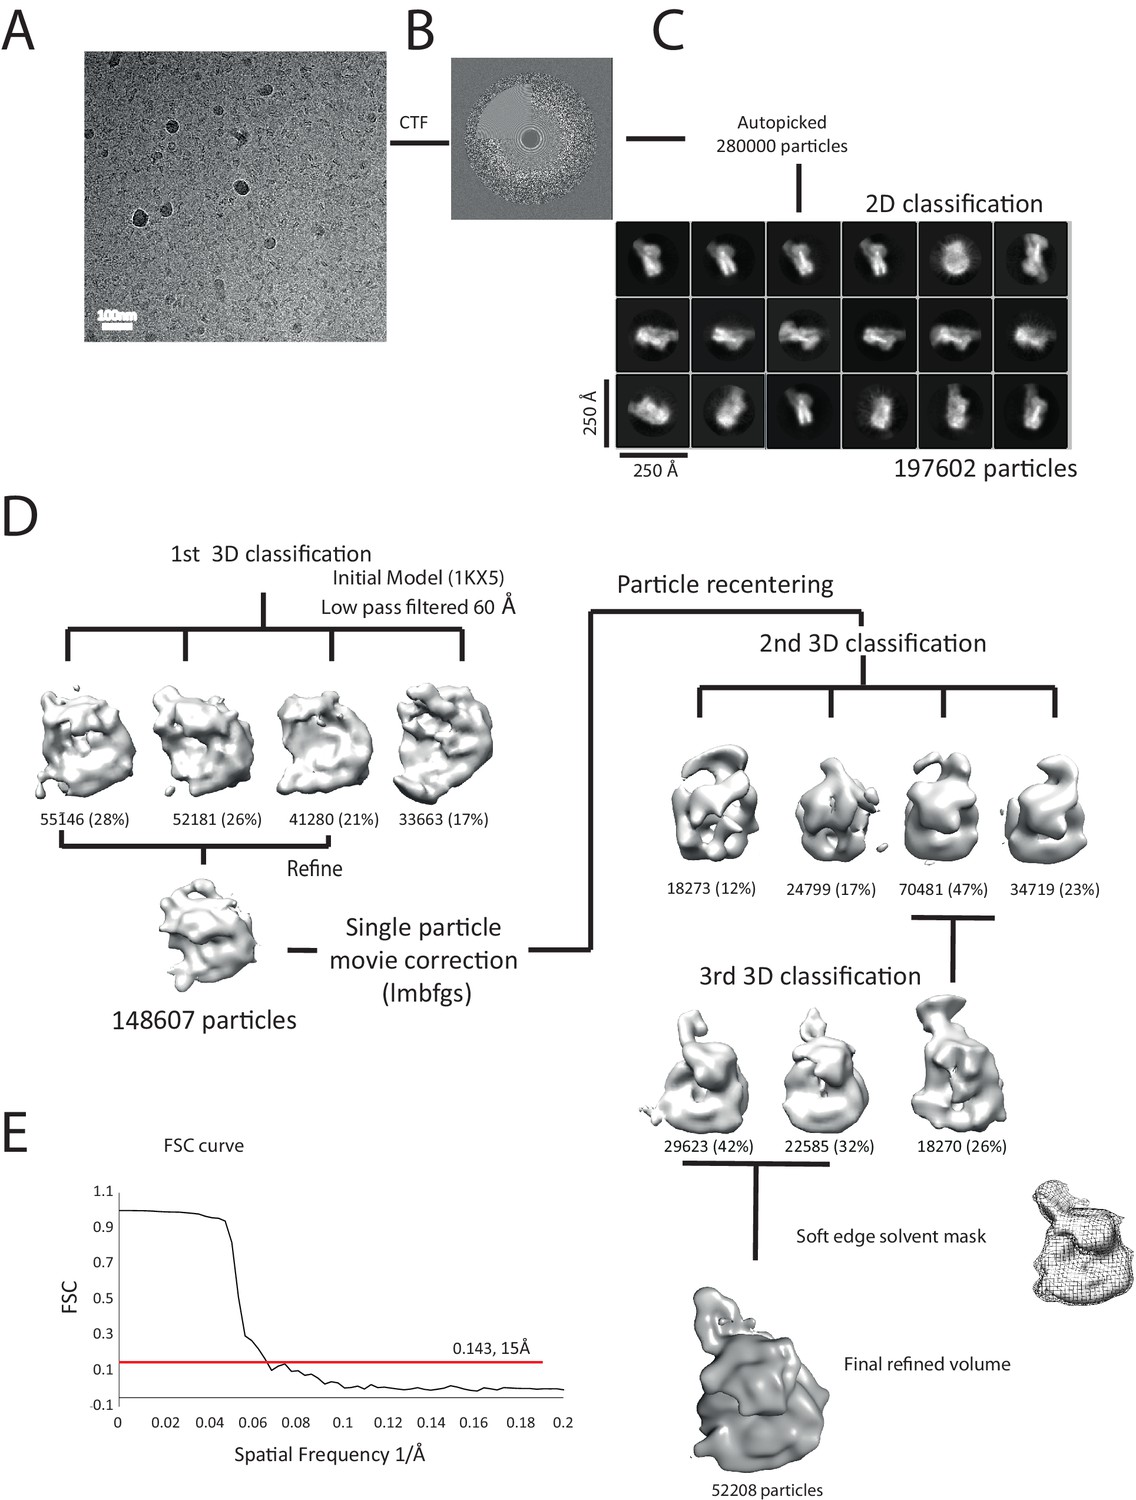
Overview of the cryoEM-data.
(A) Representative micrograph of frozen hydrated nucleosome-Chd1 complex. (B) The CTFFIND4 output generated from the micrograph shown in (A). The experimentally observed Thon rings align with the predicted Thon rings (shown as a quadrant). (C) Two-dimensional class averages of the CTF corrected auto picked particles is shown. Many of the classes have a visible attachment adjacent to the nucleosome. (D) Workflow of the three-dimensional classification and structure refinement. In the first 3D classification, the crystal structure of the nucleosome (1KX5) was converted to a low-pass filtered volume map and used as reference map. The particle numbers in each class are indicated. For the single particle movie correction, lmbfgs (Limited Memory Broyden–Fletcher–Goldfarb–Shanno) algorithm was used. The two major classes from the third 3D classification were subject to refinement following application of a solvent mask applied using Relion 1.4. The final refined volume has 52208 particles and estimated resolution of 15 Å. (E) Gold standard Fourier-Shell correlation and resolution using the 0.143 criterion.
Figure 7—figure supplement 2
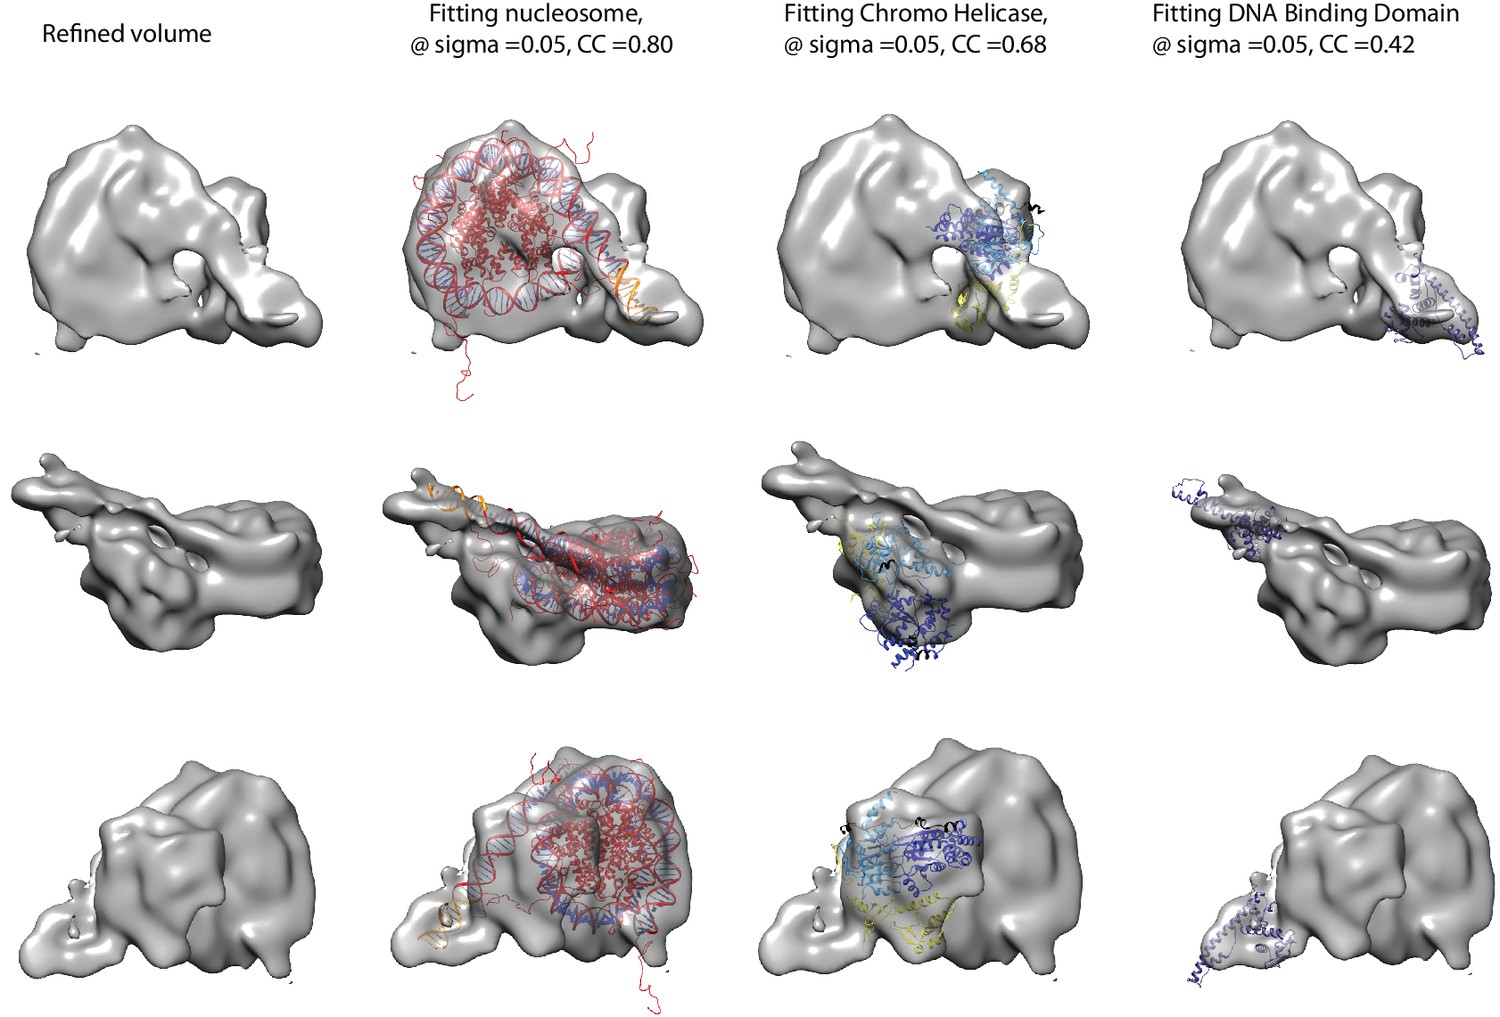
Fitting of nucleosome and Chd1 crystal structures into cryoEM map.
Three views of the final refined electron density map of the nucleosome-Chd1 complex and the docked crystal structures of nucleosome (1KX5) with the extended linker DNA, chromo-helicase (3MWY) and the DNA-binding domain are shown. The correlation coefficient calculated for the rigid body fit @ 0.05 sigma level is indicated.
Figure 7—figure supplement 3
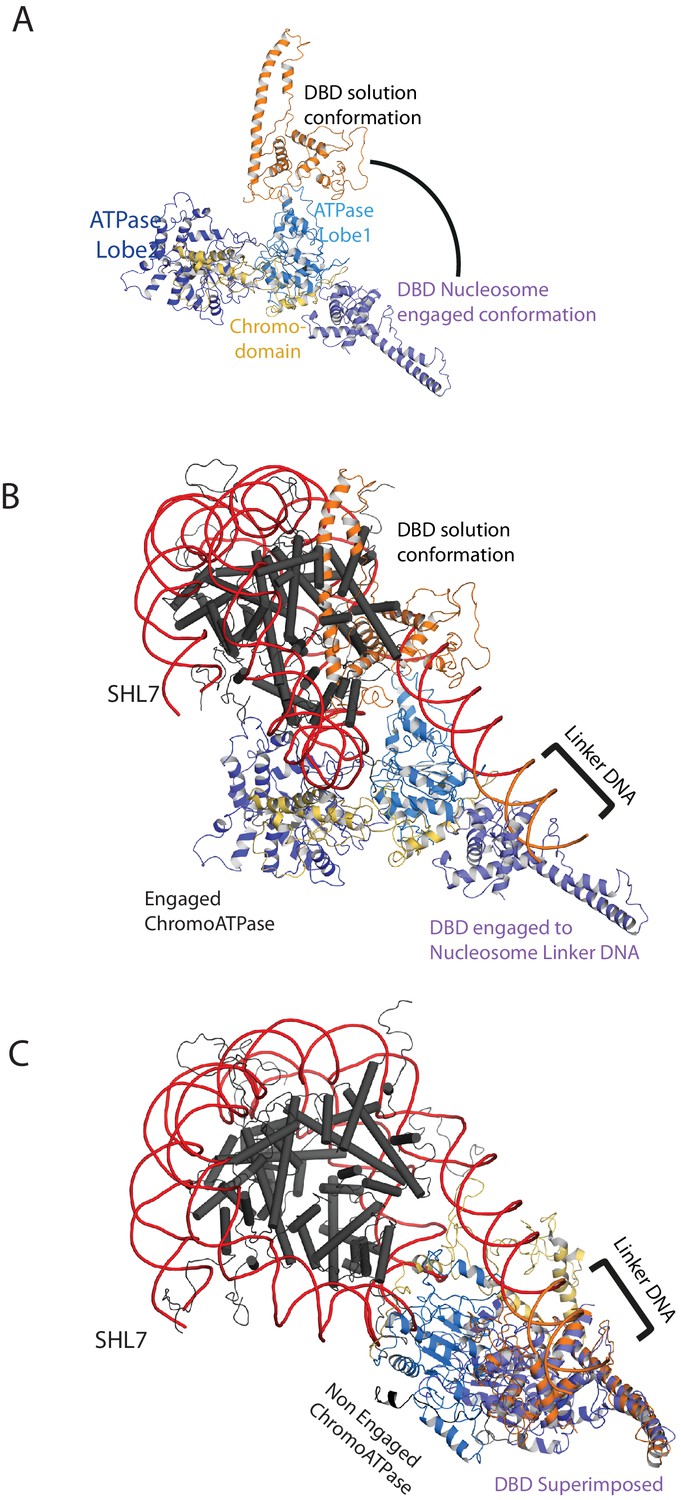
Comparison of DNA-binding domain orientation in solution structure and when engaged with nucleosomes.
(A) Solution of the structural model for Chd1 in solution derived from Figure 2 is superimposed on to Chd1 in the conformation observed when it is engaged with nucleosomes. The DBD domain from the solution model is coloured in orange and the nucleosome-bound state in deep blue. (B) The solution model for Chd1 is docked onto a nucleosome using the location of the ATPase domains within the engaged state as a reference point. This conformation is not feasible as there are major clashes with the histone octamer. (C) The solution model for Chd1 is docked onto a nucleosome using the location of DBD in the nucleosome-engaged state as a reference point. This conformation is related to that observed for Chd1 in the apo state (Figure 6).
Figure 7—figure supplement 4
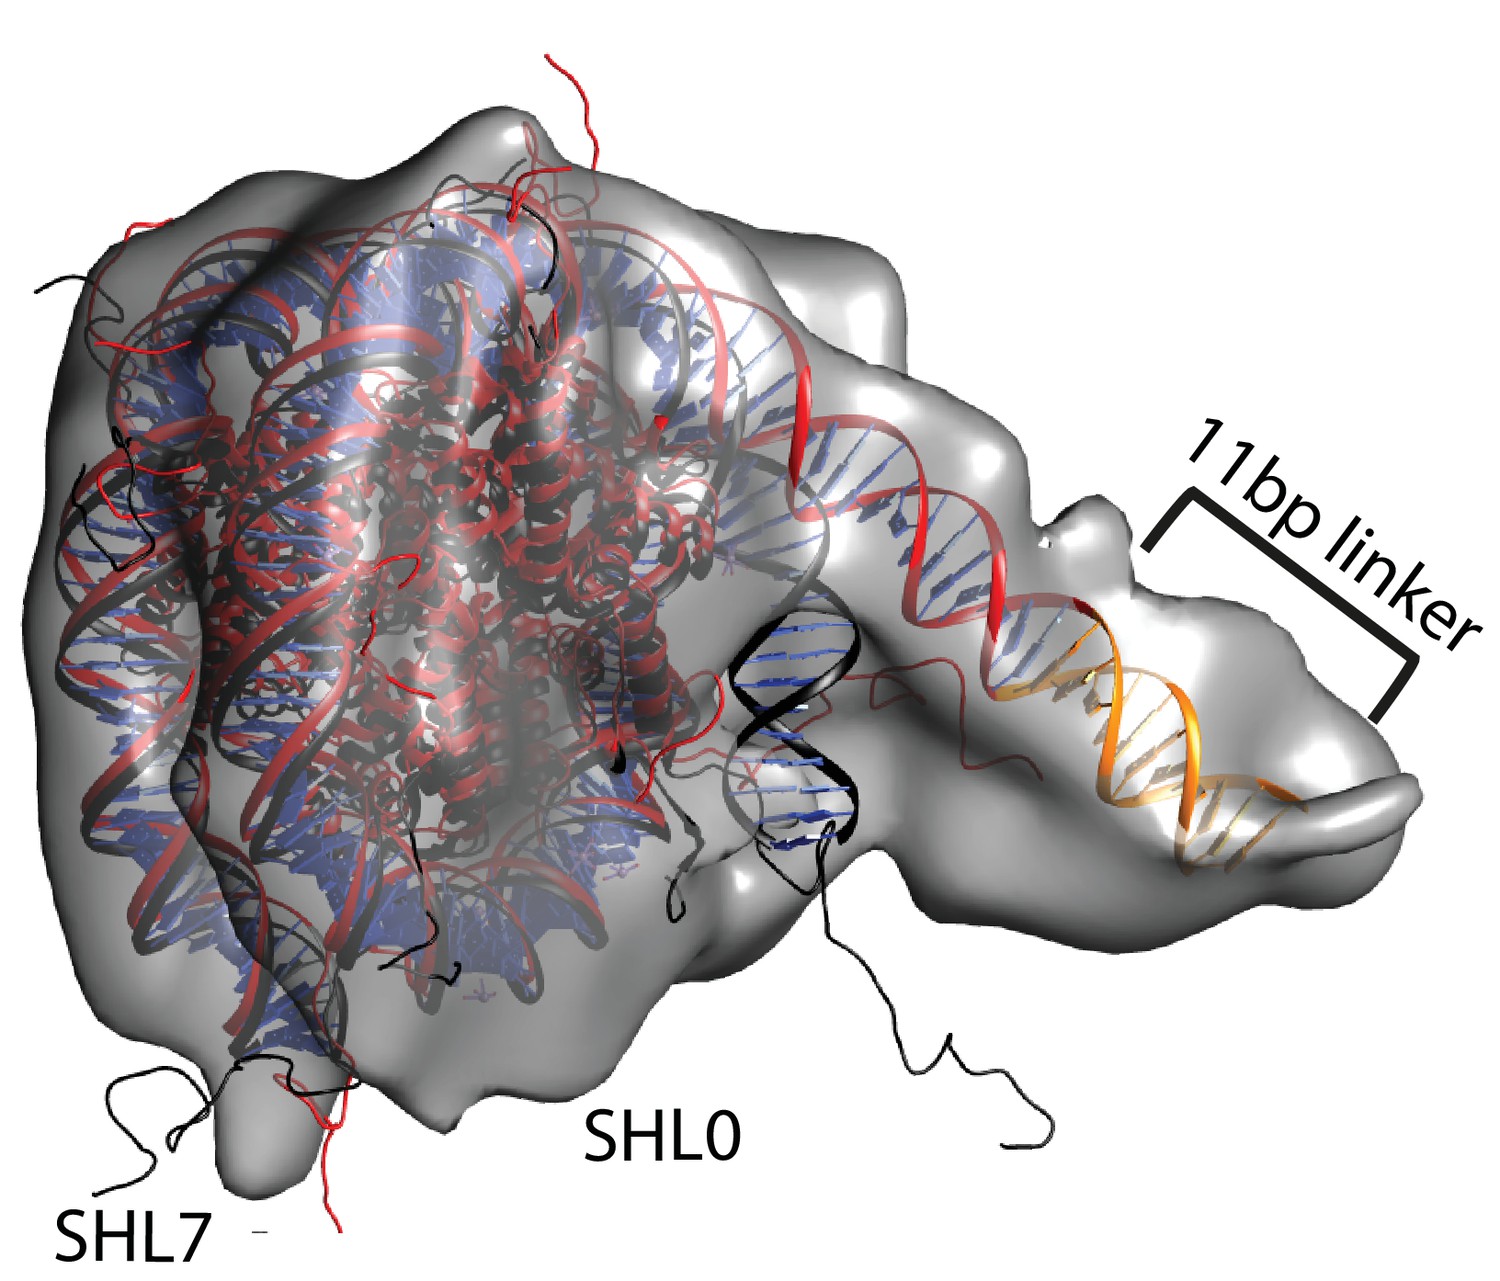
Unravelling of nucleosomal DNA adjacent to the bound linker.
Refined cryoEM map of nucleosome-Chd1 complex is shown in semi-transparent with docked nucleosome (1KX5) crystal structure. The extended 11 bp linker DNA on one side of the nucleosome as defined in the electron density map is coloured in orange. The modelled nucleosome in the cryoEM map (red) is compared with the nucleosome crystal structure (Black). The outer turn of a fully wrapped nucleosome protrudes out of the envelope supporting unwrapping to accommodate the altered trajectory. The nucleosome dyad axis is marked as SHL0 and the linker free side of the nucleosome is marked as SHL7.
Figure 8 with 3 supplements
Nucleotide binding affects DNA wrapping in Chd1-nucleosome complexes.
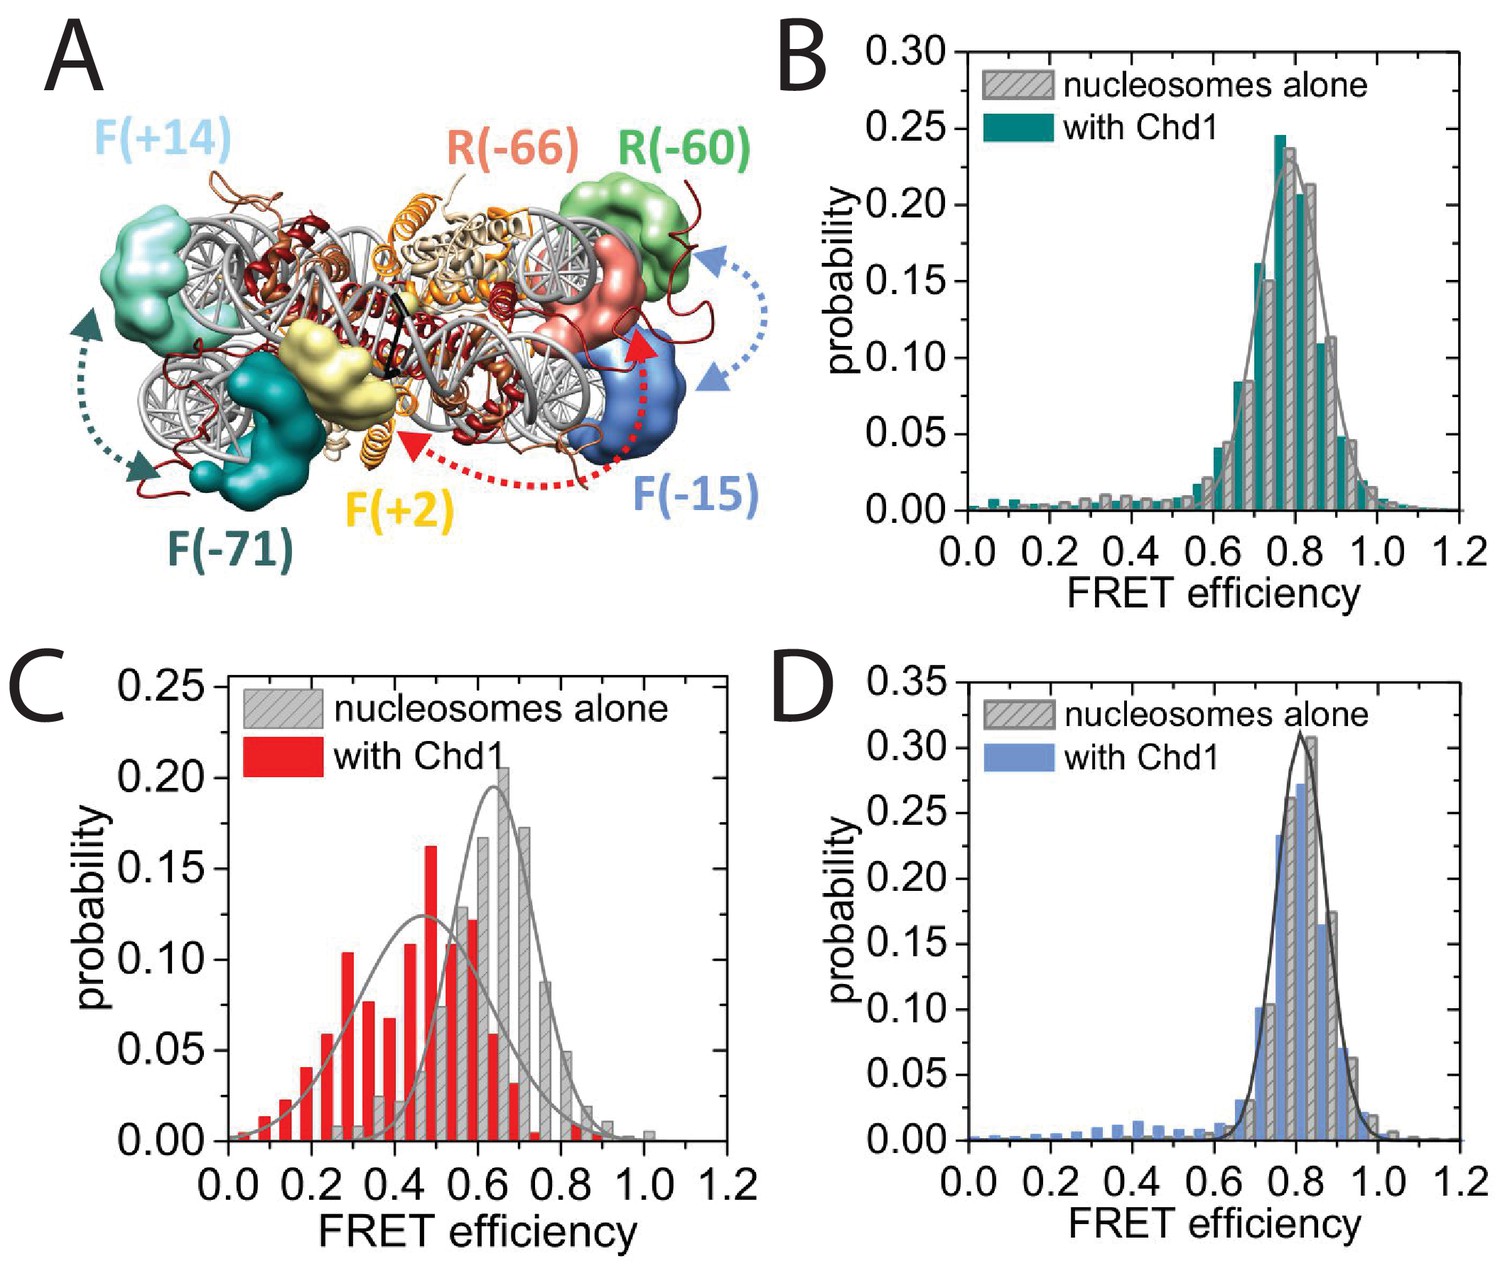
Experiments were performed using nucleosomes with dye labels attached to two specific positions alone and in presence of Chd1 1–1305. (A) Schematic illustration of the dye positions for the smFRET measurements. (B–D) Histograms of measured smFRET efficiencies for nucleosomes alone (grey) and in presence of Chd1 1–1305 and 150 µM AMP-PNP (colored) for dyes attached to positions F-71 - Alexa647 and to F + 14 - Tamara (B, dark cyan). In this case 2072 complexes without and 1922 complexes with Chd1 were assessed. For dyes at positions F + 2 Tamra and to R-66 - Alexa647 (C, red) 365 complexes were studied without Chd1 and 222 with. With dyes at F-15 - Tamara and to R-60-Alexa647 (D, light blue) 306 complexes were studied without Chd1 and 292 molecules with.
Figure 8—figure supplement 1
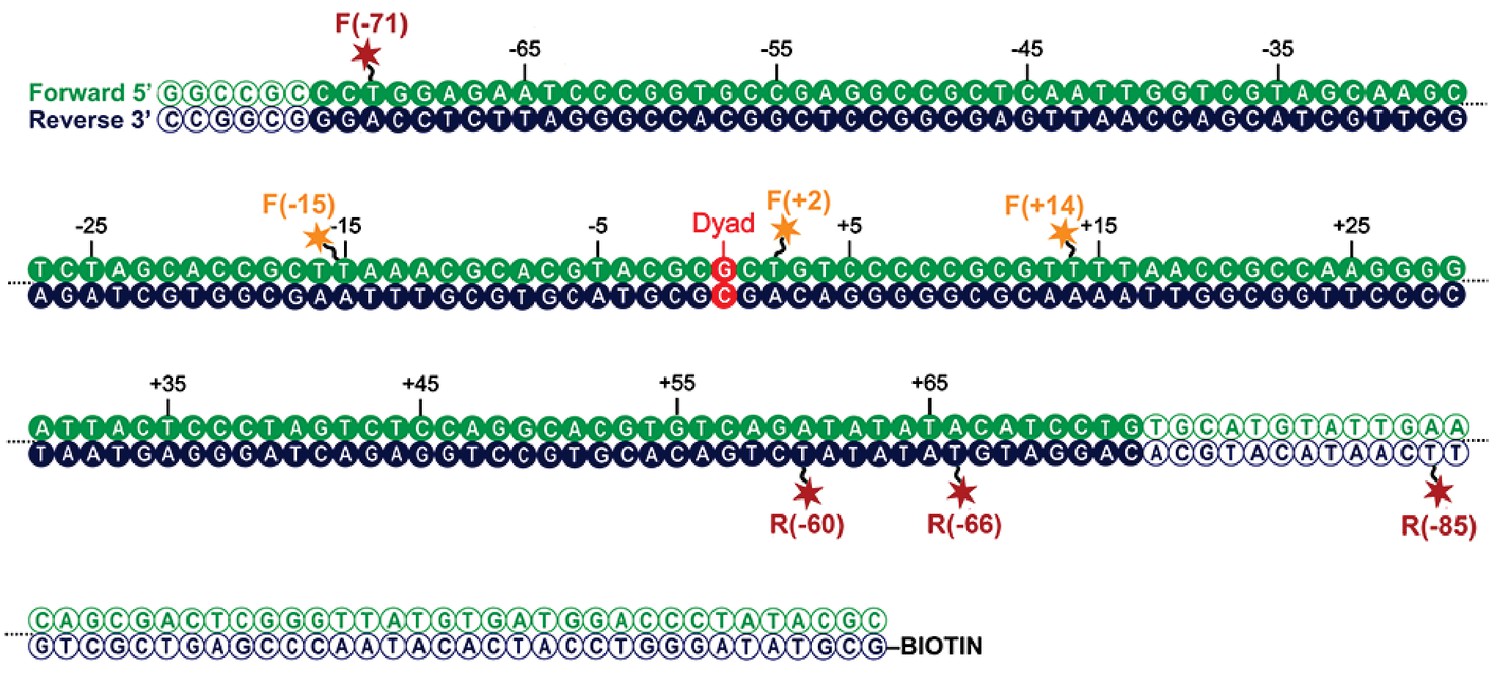
Map indicating locations to which fluorescent dyes are attached.
Schematic illustration of the nucleosomal DNA and designed label positions, depicted as stars (red, acceptor dye Alexa647; yellow, donor dye Tamra). Nucleotides marked as open circles constitute the linker DNA, whereas nucleotides shown as filled circles are part of the 601 sequence and therefore constitute DNA inside the nucleosome core.
Figure 8—figure supplement 2

smFRET analysis of DNA unwrapping with Chd1 △57–88 and in the presence of ADP-BeFx.
(A) FRET efficiency histogram for nucleosomes labelled with dyes at positions F + 2 Tamra and to R-66 in the absence (grey - 365 nucleosomes) and presence of Chd1 △57–88 (blue – 363 complexes) in the presence of AMP-PNP. Similar DNA unwrapping is observed when compared to Chd1 1–1305 (Figure 8C). (B) A FRET change is also observed at this location in the presence of ADP-BeFx (orange – 148 complexes).
Figure 8—figure supplement 3
Quantitative smFRET analysis of DNA linker dynamics introduced by Chd1 binding.
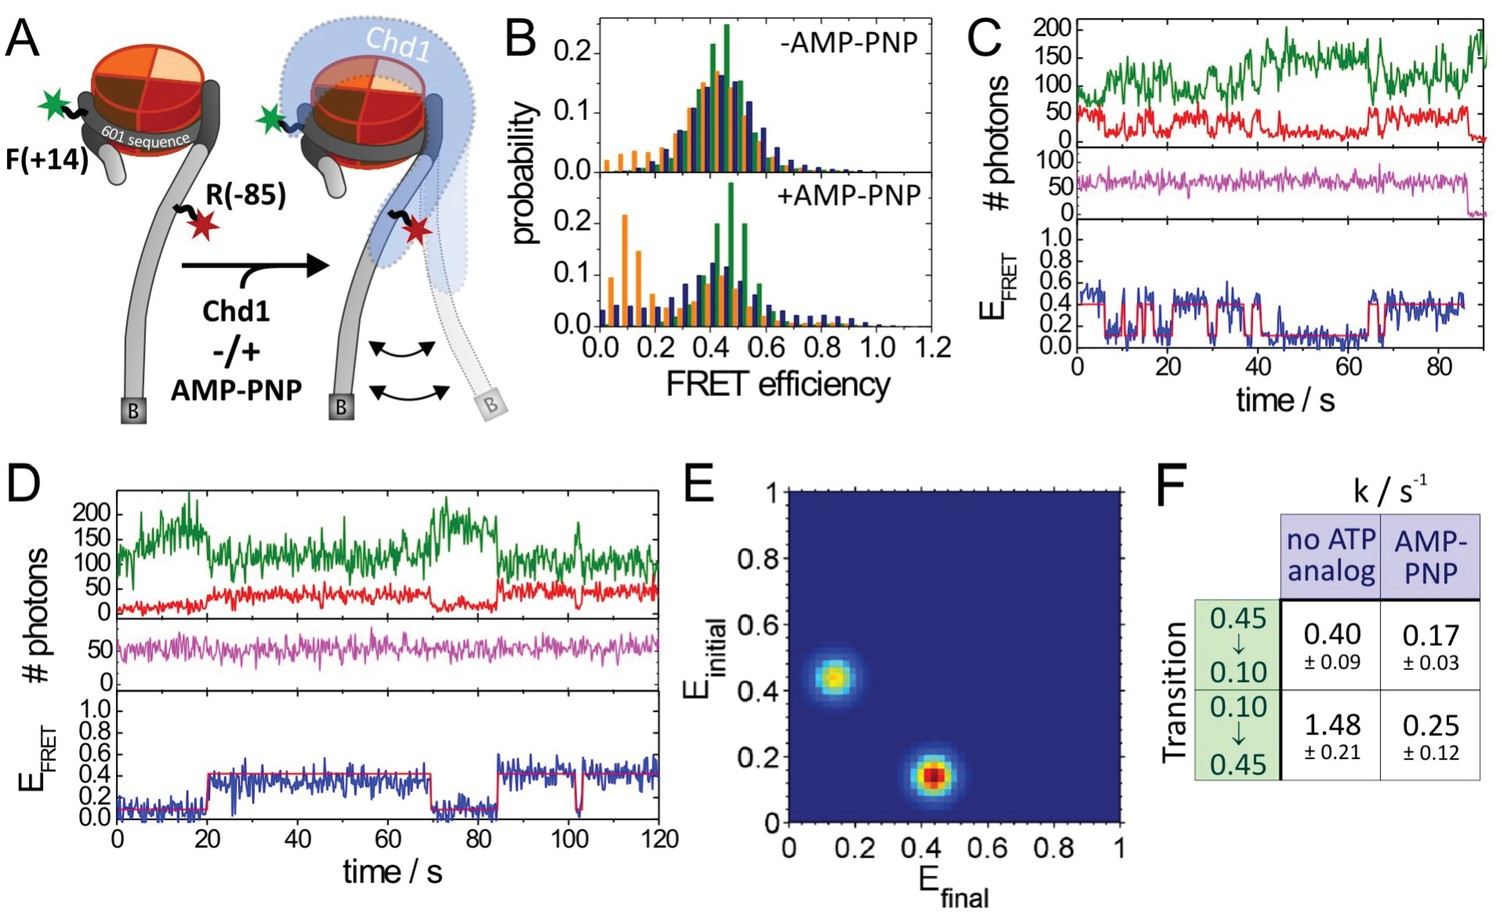
(A) Cartoon illustrating the smFRET measurement of nucleosomes labelled at position R-85 with Alexa647 and at position F + 14 with Tamra. Observed dynamics of the linker DNA (see panel C–F) in the presence of Chd1 (shaded blue shape) are indicated. (B) FRET efficiency histograms of nucleosomes alone (green), nucleosomes in the presence of 50 nM Chd1 showing static FRET (blue) as well as dynamic FRET trajectories (orange). The upper panel shows data of the measurements without ATP analog (Green:720 molecules, blue:779 molecules, orange 184 molecules) and the lower panel shows data of the measurements with 150 µM AMP-PNP PNP (green: 1415 molecules, blue: 624 molecules, orange: 188 molecules). (C) Typical dynamic FRET time trace in the presence of Chd1 without AMP-PNP. Time trace of donor fluorescence (green, upper panel) and acceptor fluorescence upon green excitation (red, upper panel) are shown together with the acceptor fluorescence upon direct excitation at 637 nm (magenta, middle panel). In the lower panel, the computed FRET efficiency (blue) is presented together with the time-dependent transitioning between different FRET states as identified by HMM analysis (red). (D) Example of a dynamic FRET time trace in the presence of Chd1 and AMP-PNP. Same colour coding as in panel (C). (E) Transition density plot (TDP) for transitions resulting from HMM analysis of a total of 188 dynamic traces of nucleosomes in the presence of Chd1 alone showing 189 transitions. (F) Table presenting transition rates and their standard deviations in extracted from a mono-exponential fit to the cumulative distribution of dwell times of each transition.
Download links
A two-part list of links to download the article, or parts of the article, in various formats.
Downloads (link to download the article as PDF)
Open citations (links to open the citations from this article in various online reference manager services)
Cite this article (links to download the citations from this article in formats compatible with various reference manager tools)
Structural reorganization of the chromatin remodeling enzyme Chd1 upon engagement with nucleosomes
eLife 6:e22510.
https://doi.org/10.7554/eLife.22510


