Epstein-Barr virus ensures B cell survival by uniquely modulating apoptosis at early and late times after infection
- Center for Virology, Duke University School of Medicine, United States
- Imperial College London, United Kingdom
- Harvard Medical School, United States
- University of Wisconsin School of Medicine and Public Health, United States
- Duke University, United States
Figures
Figure 1 with 1 supplement
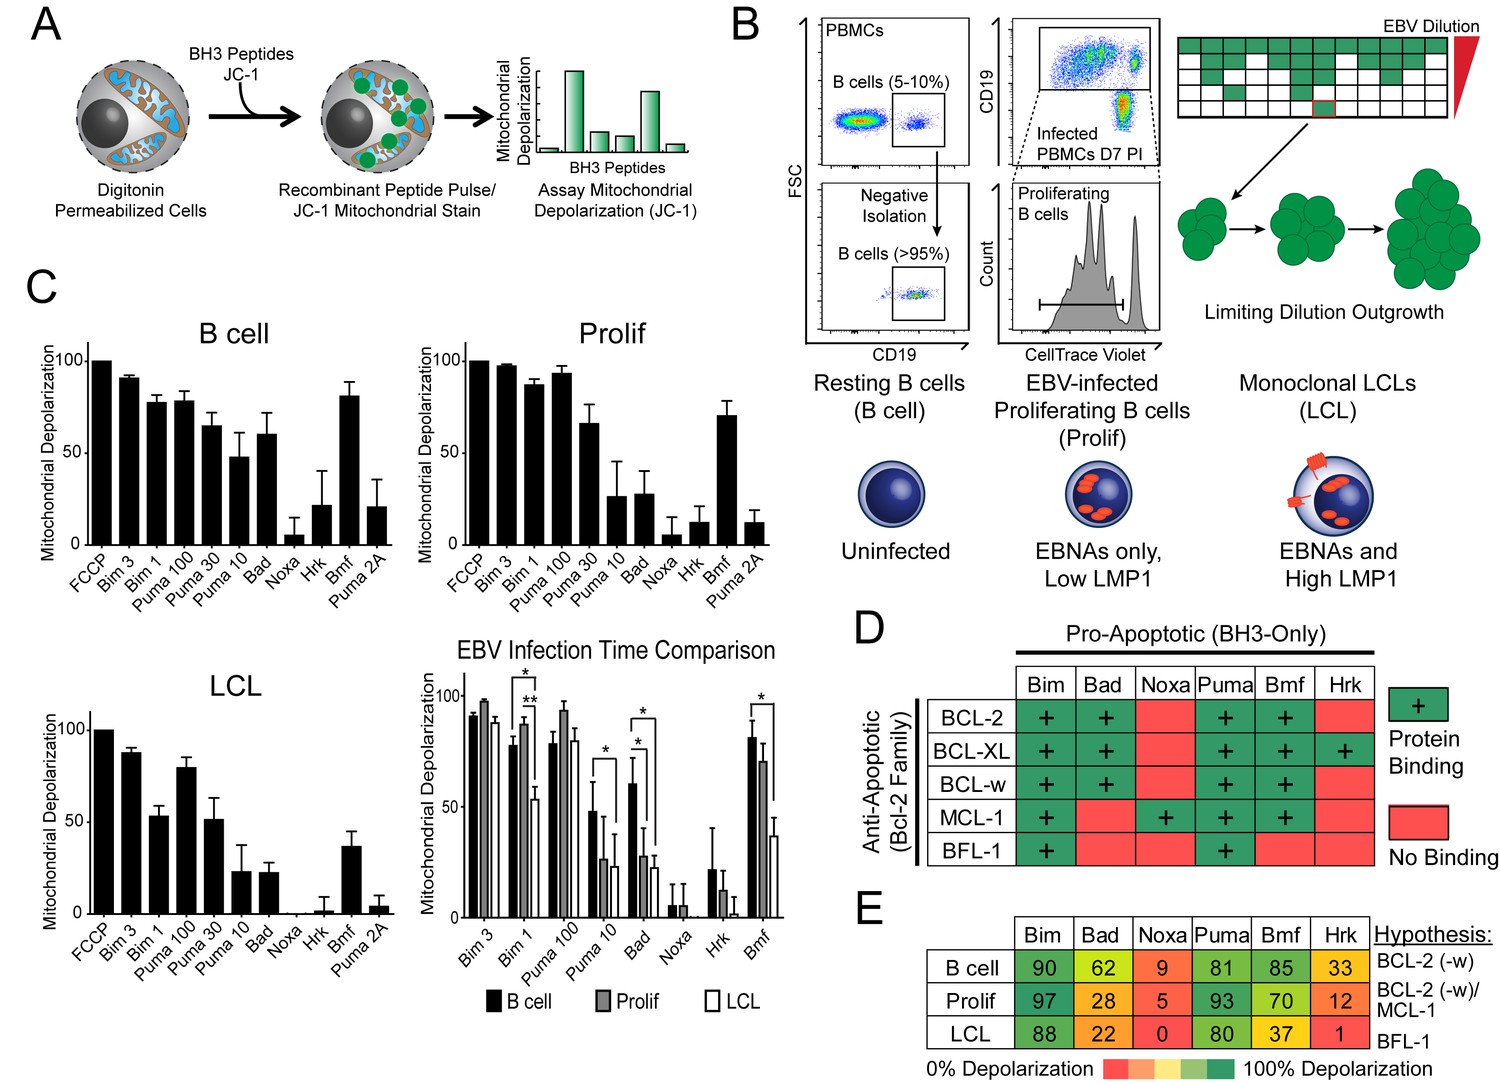
BH3 profiling reveals two distinct stages of mitochondrial priming after EBV infection.
(A) Schematic of the BH3 profiling technique, which involves first permeabilizing the outer membrane followed by incubation with BH3-only peptides to induce depolarization of the mitochondrial membrane. Depolarization is measured by fluorescent JC-1 dye and quantified. (B) Schematic of EBV-mediated outgrowth of infected CD19+ B cells into a lymphoblastoid cell line (LCL). Negative isolation of peripheral blood mononuclear cells (PBMCs) yields CD19+ B cells of >95% purity. Proliferating cells (Prolif) are analyzed by flow cytometry based on the dilution of the fluorescent proliferation tracking dye CellTrace Violet and cells that have divided more than once are sorted to purity. Monoclonal LCLs are grown out from PBMCs that have been infected with a limiting dilution of EBV. (C) Analysis of the mitochondrial depolarizations from uninfected B cells, hyper-proliferating infected cells (Prolif), and LCLs when treated with 100 µM of the indicated BH3-only peptides (horizontal axis). Mitochondrial depolarization, normalized to an FCCP control, is reported as the mean value from five different donors. Error bars indicate standard error of the mean (SEM) from five matched human donors. (bottom, right) Compiled, side-by-side comparisons of mitochondrial depolarization of the three cell types and more detailed statistical results from paired t-tests are shown below. *p<0.05, **p<0.01 (D) Schematic of the selective interactions between pro-apoptotic BH3-only and anti-apoptotic BCL2 members. Green boxes and plus signs indicate protein-binding interactions that lead to mitochondrial depolarization, red boxes indicate no interactions. (E) Schematic of BH3 profiles compiled from uninfected B cells, hyper-proliferating infected cells (Prolif), and LCLs. Shown is the 10 µM Bim treatment, all other treatments are 100 µM. Numbers and color scale correspond to percentage of mitochondrial depolarization. Formulated hypotheses regarding pro-survival BCL2 members that account for each profile are in the column to the right.
-
Figure 1—source data 1
Source data for individual responses to BH3 peptides of uninfected, early-infected, and late-infected B cells.
- https://doi.org/10.7554/eLife.22509.004
-
Figure 1—source data 2
Source data for individual responses to Bim 1, Puma 10, Bad, and Bmf BH3 peptides of uninfected, early-infected, and late-infected B cells.
- https://doi.org/10.7554/eLife.22509.005
Figure 1—figure supplement 1
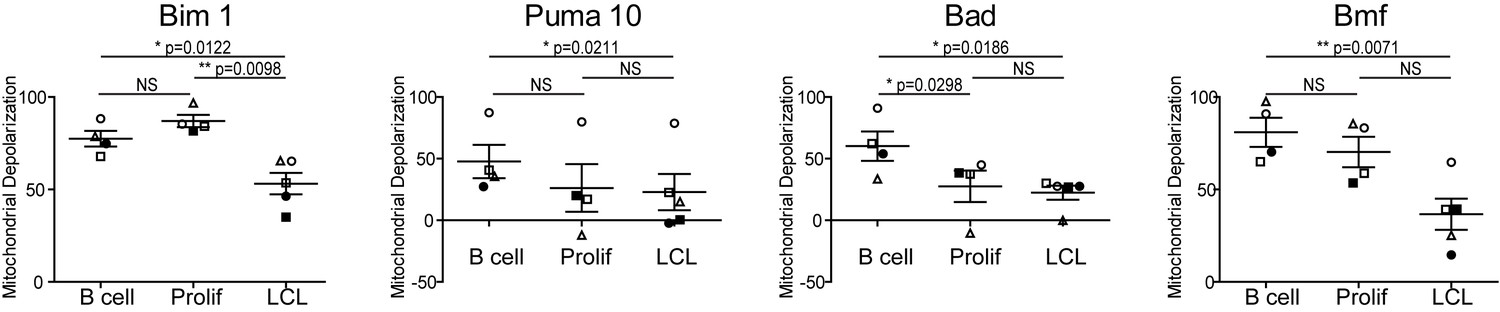
Varying sensitivity to select BH3-only peptides reveals differences in apoptotic regulation during early- and late-infection with EBV.
Paired t-test analysis of the mitochondrial depolarizations from uninfected B cells, hyper-proliferating infected cells (Prolif), and LCLs when treated with 1 µM Bim, 10 µM Puma, and 100 µM of Bad and Bmf BH3-only peptides. Error bars indicate standard error of the mean (SEM) from five matched human donors (Donor 1 Δ, Donor 2 ●, Donor 3 □, Donor 4 ■, Donor 5 ○) NS, not significant; *p<0.05; **p<0.01.
Figure 2
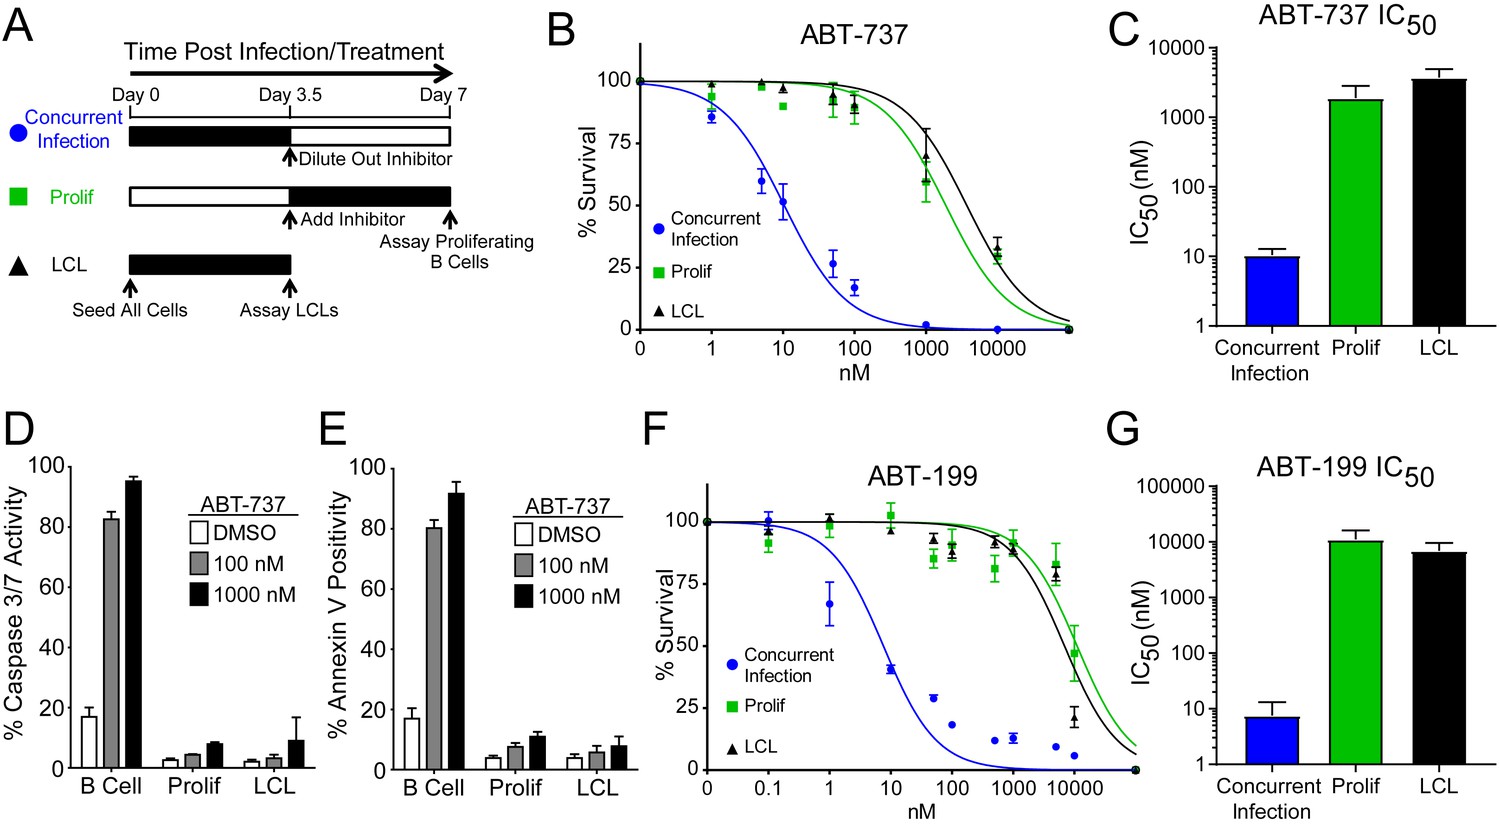
EBV Infection promotes potent resistance to BCL-2 antagonists.
(A) Schematic of drug treatment time course. (B) Dose-response curves generated from treating 3–5 human donors with the BCL-2, -xL, and –w inhibitor ABT-737. Percent survival is the percent of proliferating CD19+ B cells compared to DMSO-treated controls at each time point. (C) Average IC50 with 95% confidence intervals are plotted for ABT-737 treatment at three different times post infection. (D) Analysis of caspase activity induced by ABT-737. A fluorescent caspase 3/caspase 7 reporter was used and analyzed by FACS; values are reported as average plus SEM of three human donors. (E) Analysis of phosphatidylserine exposure induced by ABT-737. Fluorescent Annexin-V was used and analyzed by FACS; values are reported as average plus SEM of three human donors. (F) Same as (B), except the dose-response is to the BCL-2-specific inhibitor ABT-199. (G) Average IC50 with 95% confidence intervals are plotted of ABT-199 treatment of 2–3 human donors at three different times post infection.
-
Figure 2—source data 1
Source data for cell counts and apoptosis assays performed with BH3 mimetics targeting BCL-2.
- https://doi.org/10.7554/eLife.22509.008
Figure 3 with 1 supplement
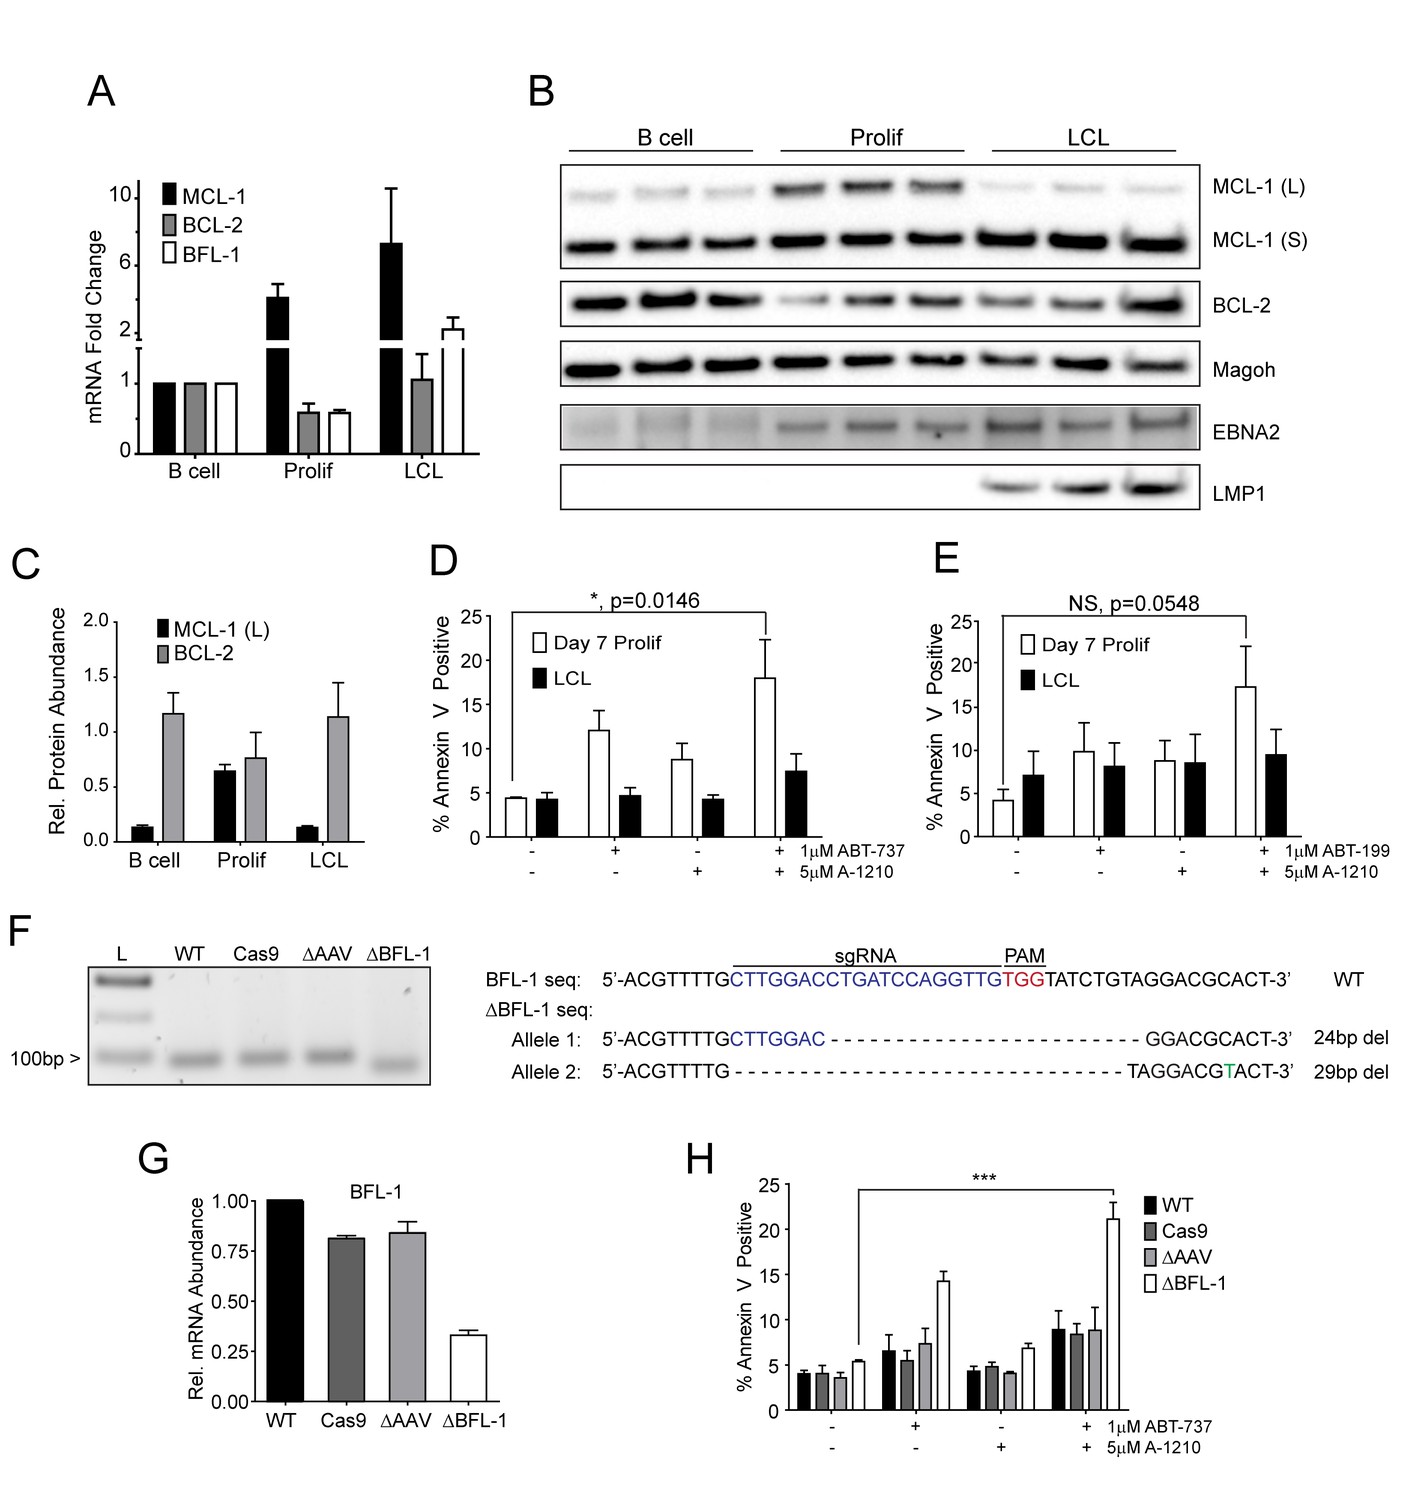
MCL-1 collaborates with BCL-2 to protect EBV-infected proliferating B cells early after infection while BFL-1 additionally protects LCLs late after infection.
(A) Quantitative PCR (qPCR) of MCL-1, BCL-2, and BFL-1 mRNA levels post EBV infection. Average plus SEM of three human donors is plotted. (B) Immunoblot analysis of MCL-1 isoforms, BCL-2, EBNA2, LMP1, and Magoh (loading control) during B cell immortalization. Protein lysates from three matched donors were obtained from uninfected B cells and infected B cells sorted Day seven post-infection for proliferating cells (Prolif). Three unmatched LCLs were also included. (C) Protein levels of MCL-1(L) and BCL-2 from (B) were quantified by densitometry and normalized to the Magoh loading control. Average relative protein abundance is reported plus SEM of three donors. (D) Analysis of apoptosis by Annexin-V positivity in Day seven proliferating EBV-infected cells and LCLs that were treated with A1210477 (A-1210) with or without concurrent ABT-737 for 24 hr. Measurements were taken as a percentage of the proliferating B cell population and plotted as average plus SEM of three human donors. Data were analyzed by 2-way ANOVA, which showed a significant interaction between cell type and drug treatment (p=0.0352). *p=0.0146, by two-tailed Student’s t-test. (E) Same as (D) but with ABT-199 for 24 hr. Measurements were taken as a percentage of the proliferating B cell population and plotted as average plus SEM of three human donors. Data were analyzed by 2-way ANOVA. No significant interaction between cell type and drug treatment (p=0.6288). (F) (Left) Agarose gel of RT-PCR products from ΔBFL-1 mutant cell line generated with the CRISPR/Cas9 system. Controls included are from a matched LCL wildtype (WT), Cas9-only expressing (Cas9) LCL, and Cas9-expressing LCL that was transduced with an sgRNA specific to the adeno-associated virus integration site (AAVS1) on the human genome (ΔAAV). Ladder (L) on the left is included. (Right) The sequences for the wildtype and mutant BFL1 sequences with the BFL1-specific sgRNA (in blue), PAM site (in red), and allele-specific SNP (in green). (G) qPCR of BFL-1 mRNA levels in WT, Cas9, ΔAAV, and ΔBFL-1 cell lines. Average plus SEM of three independent experiments are plotted. (H) Analysis of apoptosis by Annexin-V positivity in WT, Cas9, ΔAAV, and ΔBFL-1 cell lines that were treated with A-1210 with or without concurrent ABT-737 treatment. Measurements were taken as a percentage of the proliferating B cell population and plotted as average plus SEM of three independent experiments. Data were analyzed by 2-way ANOVA, which showed a significant interaction between cell type and drug treatment (p=0.0004). ***p=0.0002, by two-tailed Student’s t-test.
-
Figure 3—source data 1
Source data for protein and mRNA expression levels of anti-apoptotic members, apoptotic assays, and characterization of a BFL1-CRISPR mutant.
- https://doi.org/10.7554/eLife.22509.010
-
Figure 3—source data 2
Source data for Figure 3—figure supplement 1.
Source data for mRNA levels and apoptosis assays for cells treated with flavoporidol.
- https://doi.org/10.7554/eLife.22509.011
Figure 3—figure supplement 1
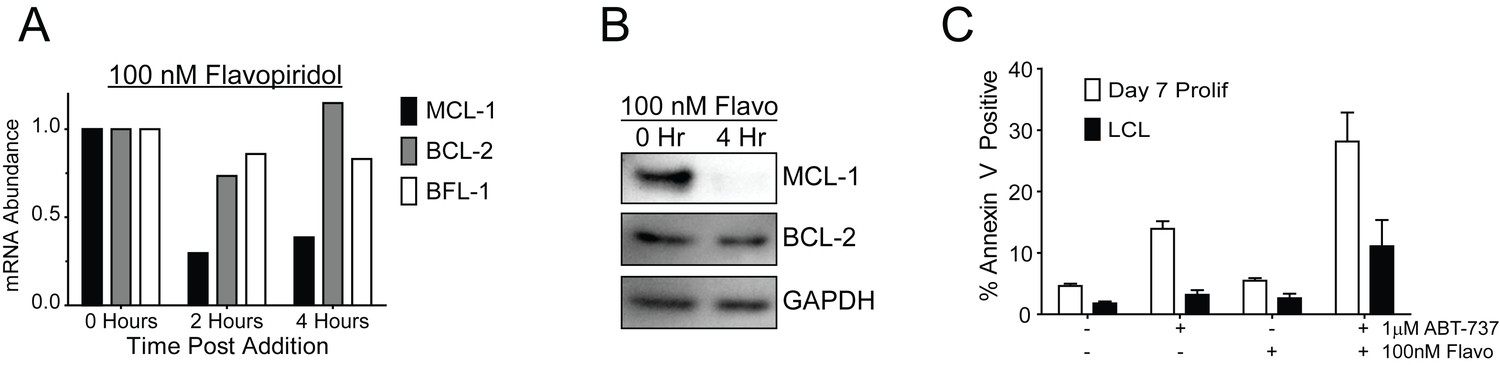
Flavopiridol sensitizes EBV-infected early-proliferating B cells to ABT-737.
(A) qPCR of one donor LCL in triplicate shows that treatment with 100 nM flavopiridol reduces MCL-1 mRNA levels over time without affecting mRNA levels of BCL-2 or BFL-1. (B) Representative immunoblot from one donor LCL shows that the protein level of MCL-1, but not BCL-2, is significantly reduced by 100 nM flavopiridol. GAPDH, loading control. (C) Combined treatment of 1 µM ABT-737 for 24 hr and 100 nM flavopiridol for 4 hr sensitizes EBV-infected early-proliferating B cells to apoptosis more so than LCLs to apoptosis. Data shown is the average and SEM from four human donors.
Figure 4
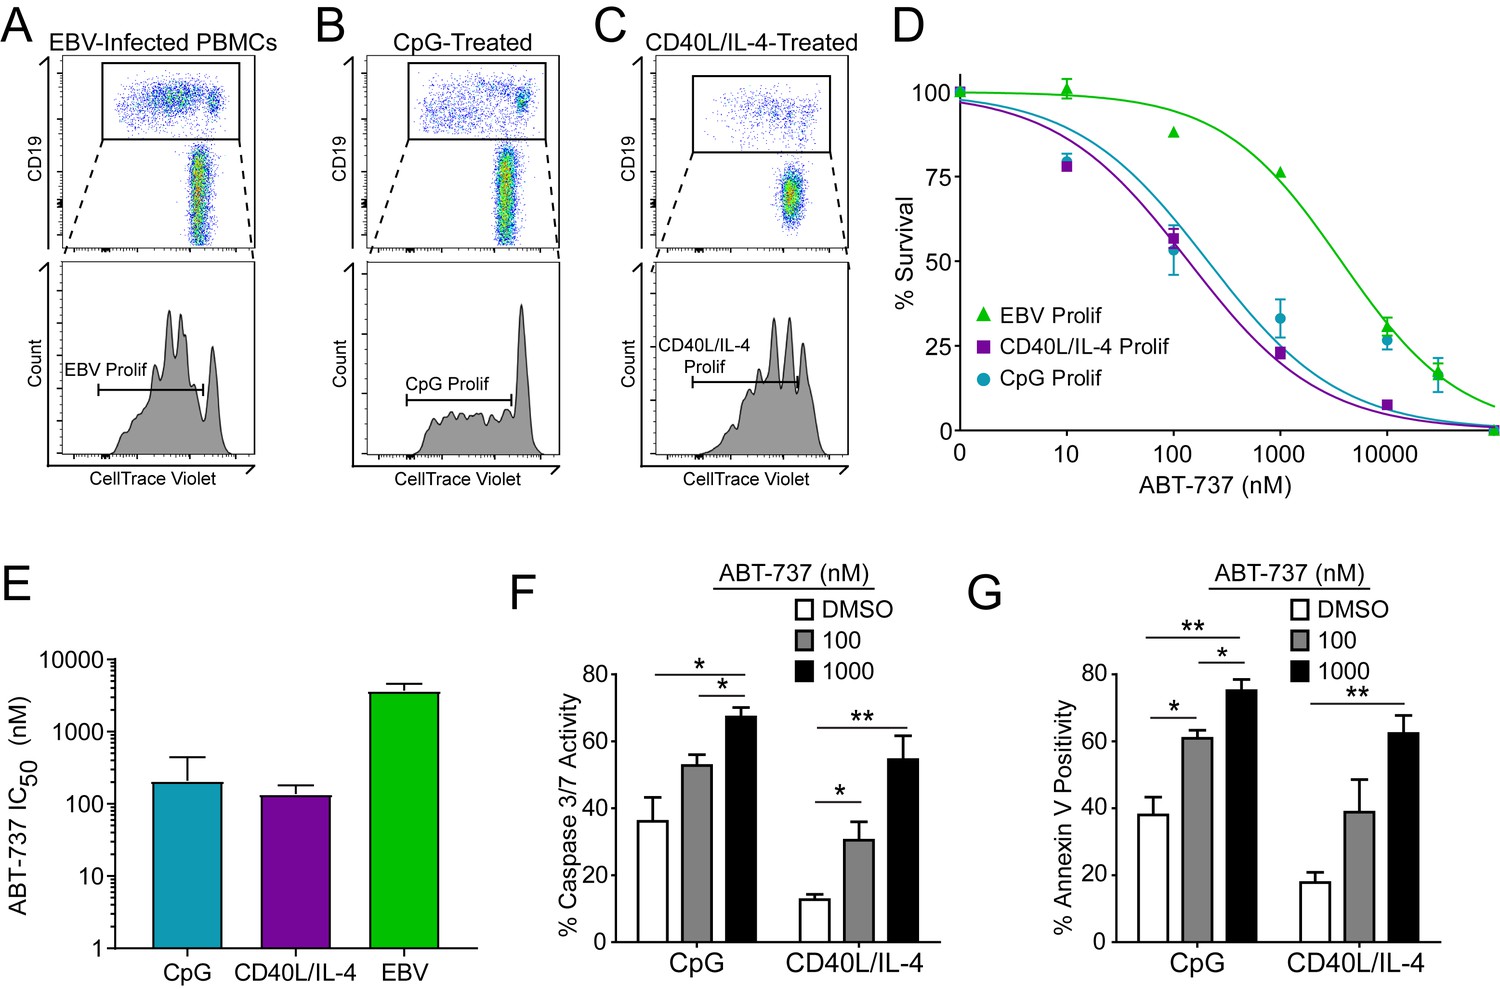
Resistance to BCL-2 antagonism is virus specific.
(A) Flow cytometry plot of proliferating (Prolif) EBV-infected PBMCs. (B) Same as in (A), but treated with the TLR9-ligand CpG DNA. (C) Same as in (A), but treated with soluble recombinant CD40L and IL-4. (D) Dose-response curves generated from treating EBV-infected or mitogen-stimulated proliferating B cells with ABT-737 on Day 3.5 post infection/stimulation and reading percent survival on Day seven post infection/stimulation. Percent survival is the percent of proliferating CD19+ B cells compared to DMSO-treated controls at each time point. Data are from three human donors. (E) Average IC50 with 95% Confidence Intervals are plotted for ABT-737 treatment on EBV-infected or mitogen-stimulated cells. (F) Caspase 3/7 activity in proliferating CpG and CD40L/IL-4 stimulated cells increases with increasing concentrations of ABT-737; values are reported as average plus SEM of three human donors. Two-tailed t-test results: CpG, DMSO vs 1000 nM (*p=0.0157); CD40L/IL-4, DMSO vs 1000 nM (**p=0.0046). (G) Annexin V positivity in proliferating CpG and CD40L/IL-4 stimulated cells increases with increasing concentrations of ABT-737; values are reported as average plus SEM of three human donors. Two-tailed t-test results: CpG, DMSO vs 1000 nM (**p=0.0042); CD40L/IL-4, DMSO vs 1000 nM (**p=0.0002).
-
Figure 4—source data 1
Source data for cell counts and apoptotic assays of uninfected, mitogen-stimulated B cells.
- https://doi.org/10.7554/eLife.22509.014
Figure 5 with 1 supplement
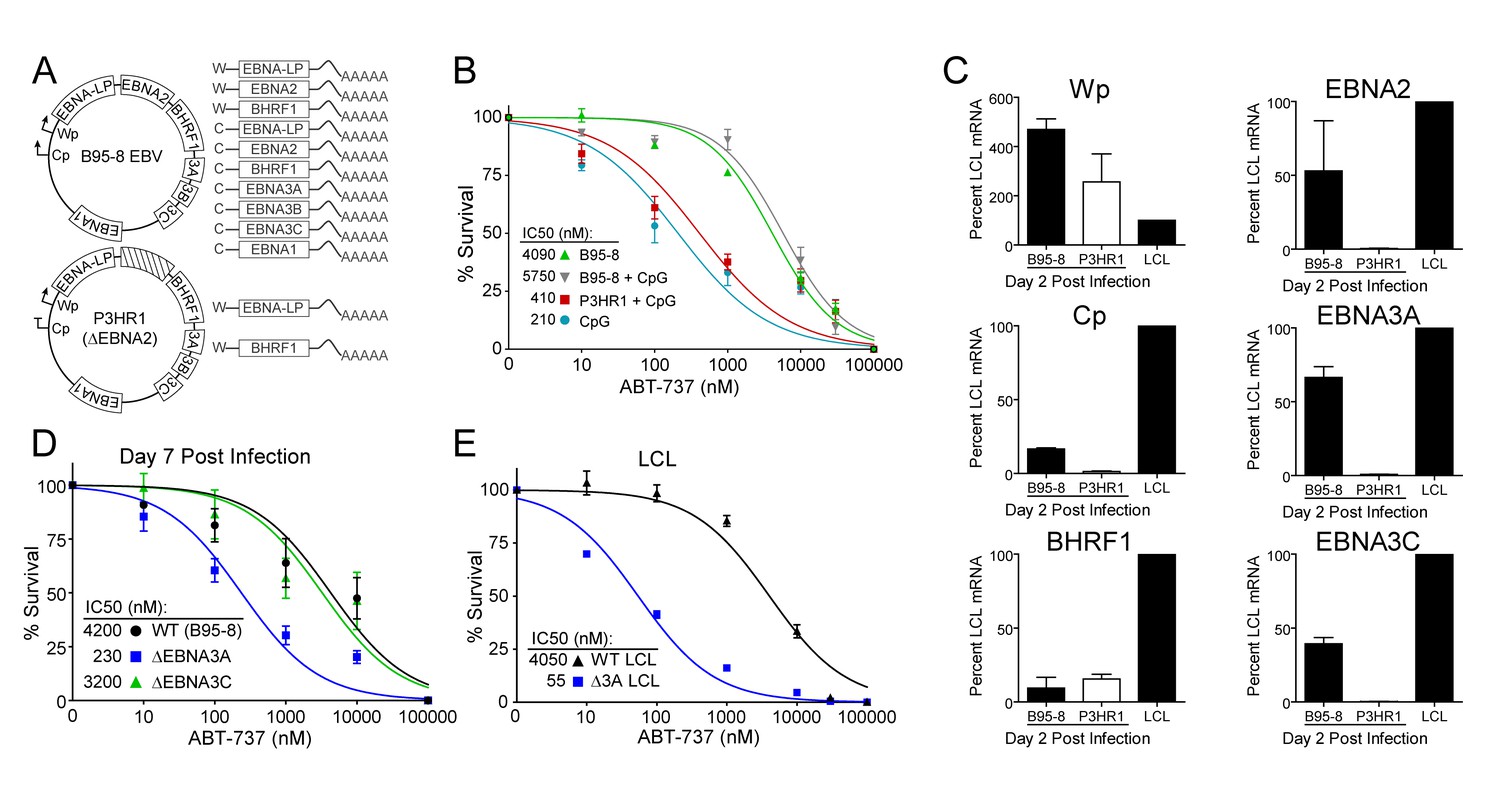
EBV-induced resistance to BCL-2 antagonism is mediated by EBNA3A.
(A) Schematic to show the genetic differences between prototypical transforming strain of EBV (B95-8) and P3HR1 (EBNA2-deleted) strain. (B) Dose-response curves to assess ABT-737 sensitivity in proliferating prototypical (B95-8) EBV-infected cells and EBNA2-deleted (P3HR1) EBV-infected cells. To induce proliferation, P3HR1-infected cells required additional co-treatment with CpG DNA. Data are from three human donors. Average IC50 is shown (inset). (C) qPCR showing early viral mRNAs expressed at day two post infection normalized to a B95-8 LCL. Data are shown as SEM of two matched human donors. While P3HR1 produces the same relative amount of Wp-driven transcripts and BHRF1, P3HR1 does not induce C promoter (Cp)-driven transcripts or the viral EBNA2, −3A, and −3C transcripts. (D) Early-infected proliferating EBNA3A-deleted (△EBNA3A) EBV-infected cells are sensitive to ABT-737, while EBNA3C-deleted (△EBNA3C) EBV-infected cells and wildtype-infected proliferating cells maintain high levels of ABT-737 resistance. Percent survival is the percent of proliferating CD19+ B cells compared to DMSO-treated controls at each time point. Data shown are from 3 to 6 human donors with SEM. Average IC50 is shown (inset). (E) EBNA3A-deleted LCLs (△3A LCL) are more sensitive to ABT-737 than wildtype LCLs. Data are from three biological replicates with SEM. Average IC50 is shown (inset).
-
Figure 5—source data 1
Source data for cell counts performed with cells infected with EBV mutant strains and mRNA levels of EBV viral transcripts.
- https://doi.org/10.7554/eLife.22509.016
-
Figure 5—source data 2
Source data for Figure 5—figure supplement 1.
Source data for cell counts
- https://doi.org/10.7554/eLife.22509.017
Figure 5—figure supplement 1
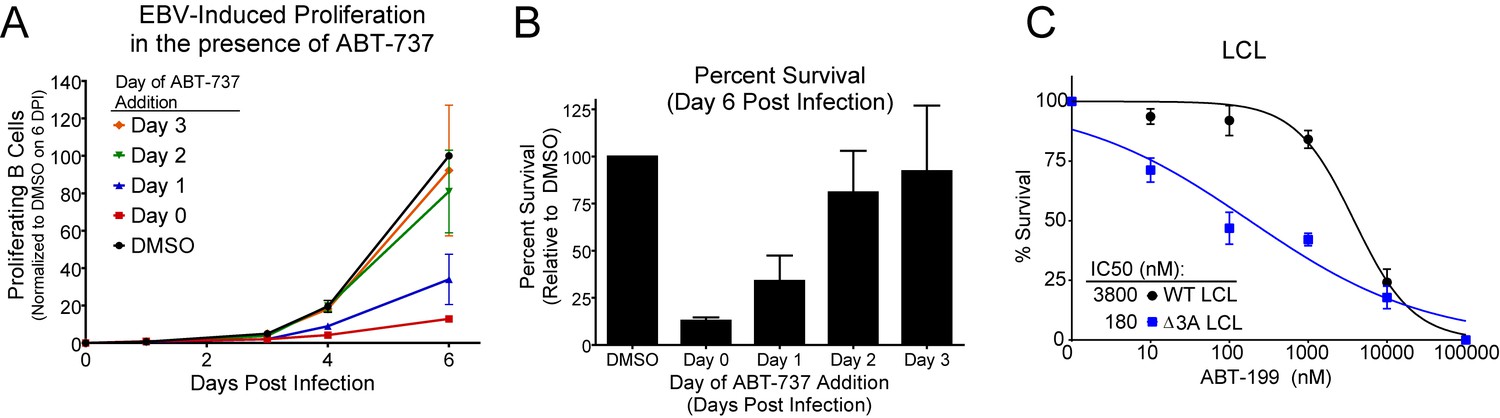
ABT-737 resistance is gained within two days post infection.
(A) Growth curve showing the effect of ABT-737 addition on proliferating EBV-infected B cells on different days of addition. Data is shown as the SEM of two matched human donors normalized to the number of proliferating cells in the DMSO vehicle control on day six post infection. (B) Relative amount of surviving EBV-infected proliferating B cells on day six post infection normalized to vehicle control (DMSO). Data is shown as the SEM of two matched human donors. ABT-737 treatment concurrent with or soon after infection drastically reduces the number of proliferating B cells, but full resistance is gained two days post EBV infection. (C) EBNA3A-deleted (△EBNA3A) LCLs are sensitive to ABT-199, while donor-matched wildtype-infected LCLs maintain high levels of ABT-199 resistance. Percent survival is the percent of proliferating CD19+ B cells compared to DMSO-treated controls at each time point. Data shown are from three human donors with SEM. Average IC50 is shown (inset).
Figure 6 with 1 supplement
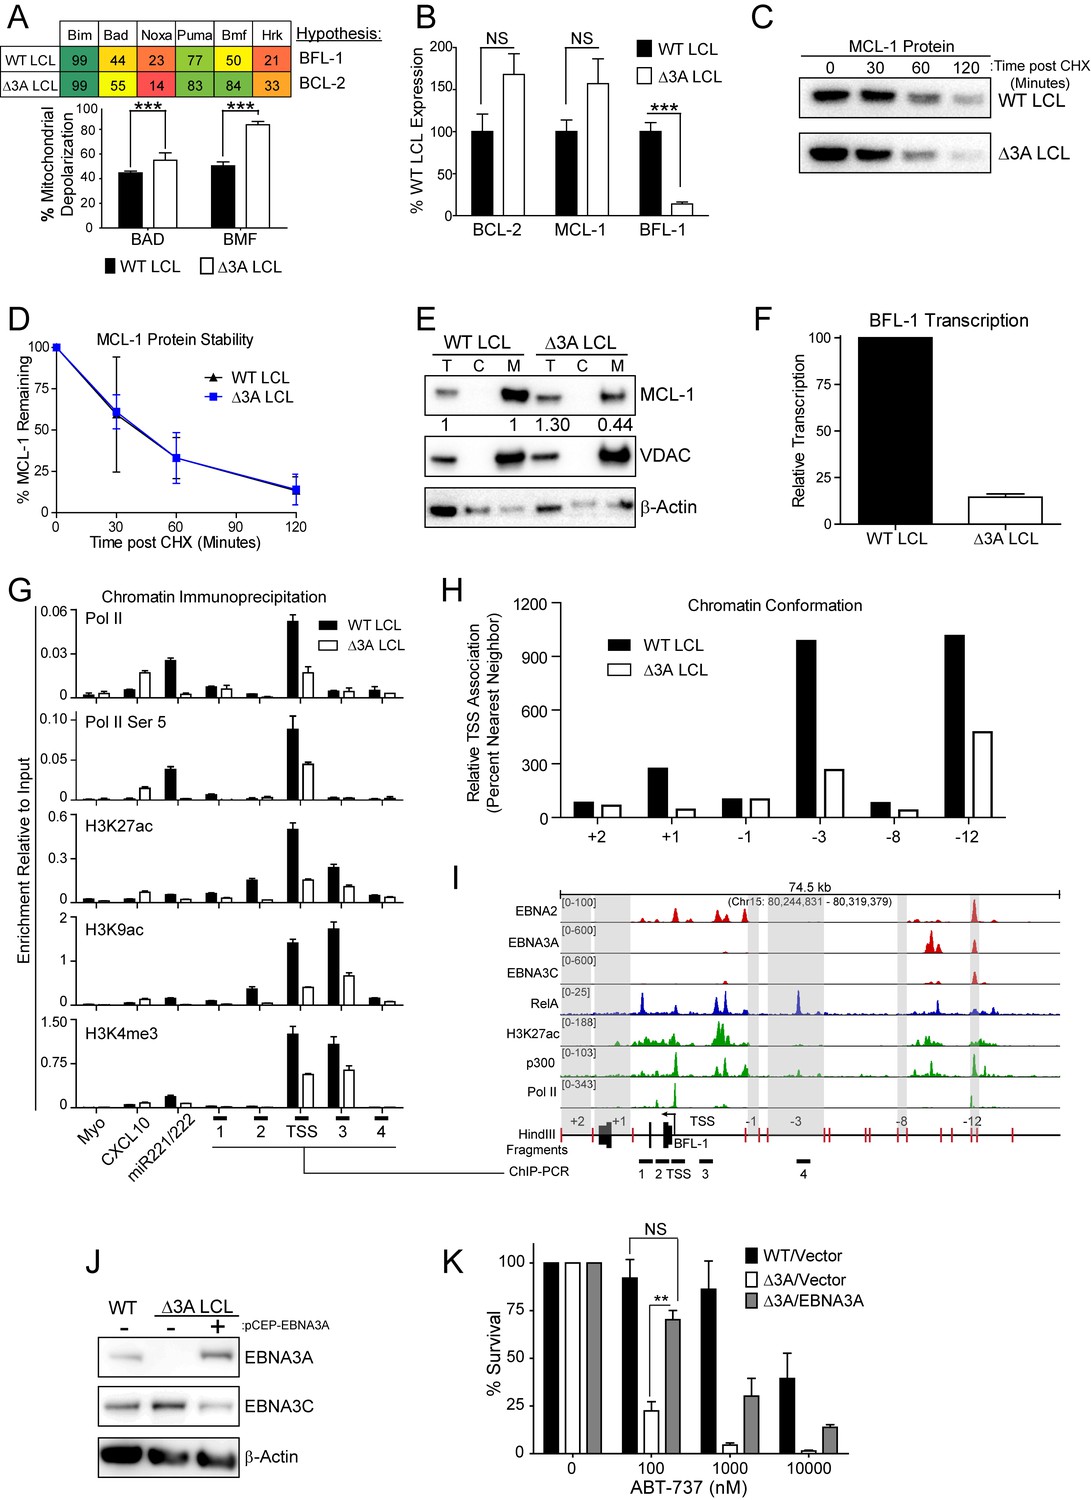
EBV EBNA3A is required for MCL-1 mitochondrial localization and BFL-1 transcription.
(A) BH3 profile shows increased sensitivity to Bad and Bmf peptides in EBNA3A-deleted LCLs compared to wildtype LCLs, indicative of a BCL-2 dependence. Three technical replicates with seven repeated measures each over time were averaged and plotted with SEM. Data were analyzed by paired 2-tailed t-test, *p<0.001. (B) qPCR of BCL-2, MCL-1, and BFL-1 mRNA levels in matched wild type and EBNA3A-deleted LCLs from four human donors. NS, not significant, ***p=0.002 (C) Western blot of MCL-1 in WT or △3A LCLs treated with 15 µM cycloheximide (CHX) over two hours. (D) The relative mean densitometry from panel (C) plotted over time from two biological replicates plus SEM. (E) Sub-cellular fractionation into total (T), cytoplasmic (C), or mcitochondrial (M) compartments reveals MCL-1 mislocalization in an EBNA3A-deleted LCL compared to a Wildtype LCL. Immunoblot for MCL-1, VDAC (mitochondrial localization control), and β-Actin (total lysate control). Quantified levels of MCL-1 in total and mitochondrial compartments are normalized to their respective WT levels and VDAC control. (F) Relative transcription rate of BFL-1 in WT and △3A LCLs ascertained by qPCR on pulldown of nascent mRNAs. Data is shown as the average and SEM of three biological replicates. (G) Chromatin immunoprecipitation (ChIP) was performed on extracts from WT and △3A LCLs using antibodies for total RNA Pol II (Pol II), Pol II phospho-Ser 5 (Pol II Ser 5), H3K27ac, H3K9ac, and H3K4me3. Primer pairs for Myo were used as a negative control, CXCL10 as an EBNA3A-repressed control, and miR221/222 as an EBNA3A-activated control. Primer pairs surrounding the BFL-1 TSS are shown annotated in panel (I) in their proper locations. Values represent ratio of chromatin precipitated, after correction for IgG, relative to 2.5% of input. Data are shown as the mean and standard deviation (SD). (H) Chromatin conformation capture (CCC) was performed on WT and △3A LCLs, and the BFL-1 loci were interrogated for interaction after digesting with HindIII. Relative interaction frequency to the BFL-1 TSS fragment (panel I bottom) was assayed by qPCR and normalized to the interaction frequency of the nearest neighbor (−1) fragment set at 100% relative interaction. Results are the average of two independent experiments. (I) ChIP-Seq data for EBNA2, EBNA3A, EBNA3C, NFκB (RelA), Histone H3K27ac, p300, and RNA Pol II (Pol II) from an LCL on the BCL2A1 (BFL-1) locus. (J) EBNA3A protein expression can be rescued to wild-type LCL levels in a △3A LCL using an episomal EBNA3A expression vector. (K) Rescuing EBNA3A expression in △3A LCLs restores resistance to ABT-737. Three individual clones of WT, △3A, or △3A/EBNA3A were subjected to ABT-737 treatment for three days and then analyzed for viability by FACS. Remaining viable cells on day three post treatment are normalized to the untreated (0 nM) cells. Data were analyzed by 2-way ANOVA and showed that there was a significant interaction (p<0.001) between cell type and drug treatment. NS, not significant; **p=0.01 by two-tailed t-test.
-
Figure 6—source data 1
Source data for individual responses to BH3 peptides, mRNA and protein levels.
- https://doi.org/10.7554/eLife.22509.020
Figure 6—figure supplement 1
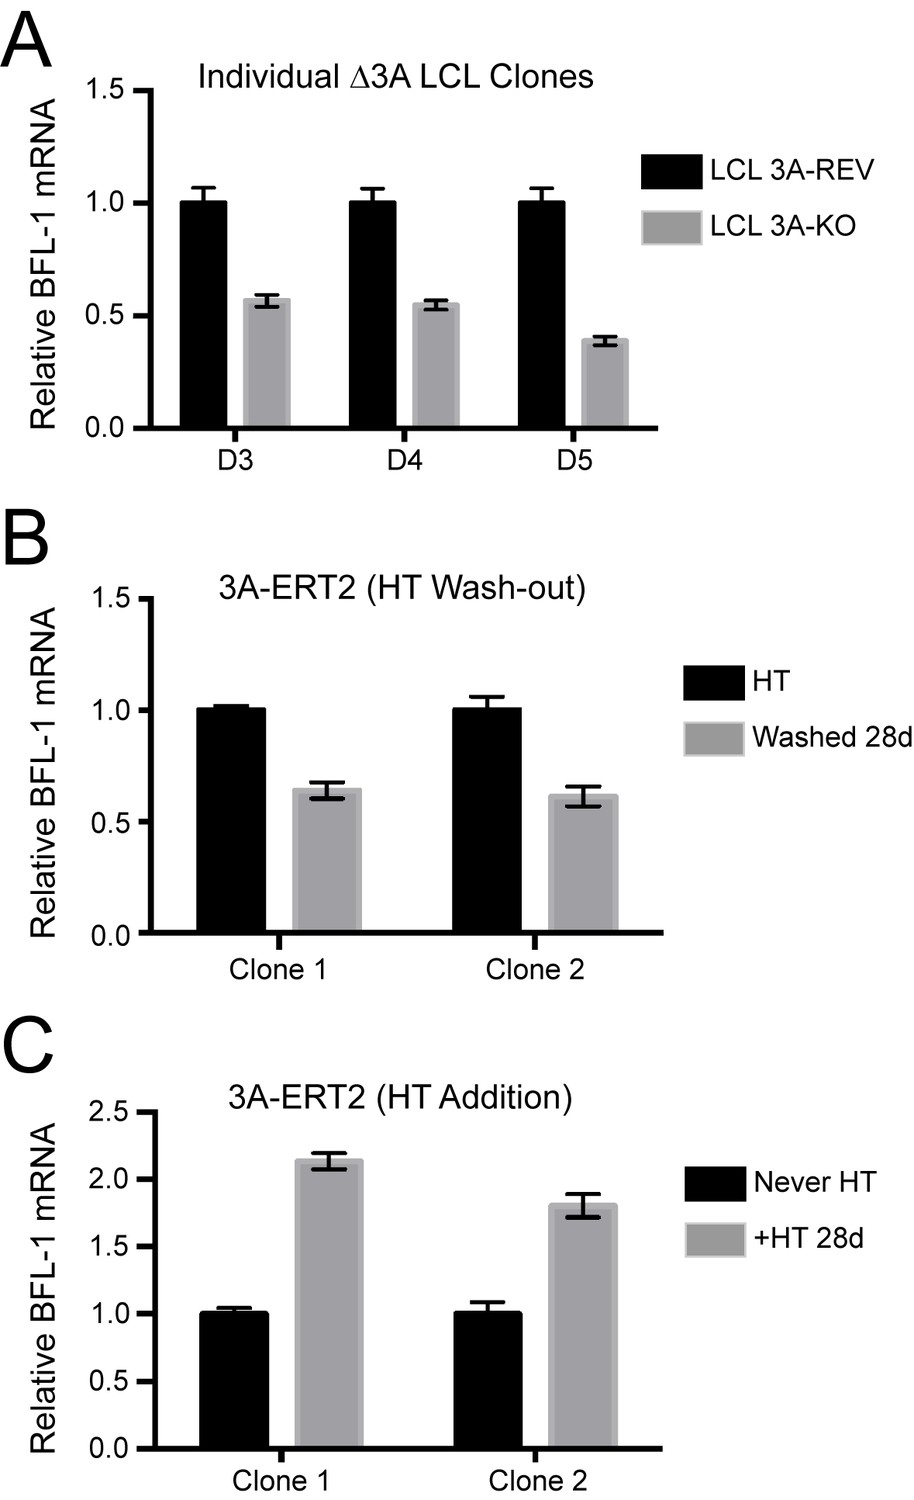
Additional validation of BFL-1 mRNA regulation by EBNA3A.
(A) qPCR of three individual clones △3A LCLs and their matching 3A-revertant counterparts showing BFL-1 mRNA expression. (B) Two clones of an EBNA3A-regulatable cell line with EBNA3A under control of 4-hydroxy-tamoxifen (HT) (Bazot et al., 2015). qPCR of BFL-1 mRNA is shown when EBNA3A is removed by withdrawal from HT. (C) Same as in (B), but EBNA3A is now being induced and BFL-1 mRNA levels assayed as compared to cells that have never expressed EBNA3A (Never HT).
Additional files
-
Supplementary file 1
Antibodies used for western blot and chromatin immunoprecipitation are included below.
- https://doi.org/10.7554/eLife.22509.022
Download links
A two-part list of links to download the article, or parts of the article, in various formats.
Downloads (link to download the article as PDF)
Open citations (links to open the citations from this article in various online reference manager services)
Cite this article (links to download the citations from this article in formats compatible with various reference manager tools)
Epstein-Barr virus ensures B cell survival by uniquely modulating apoptosis at early and late times after infection
eLife 6:e22509.
https://doi.org/10.7554/eLife.22509


