Structure of protein O-mannose kinase reveals a unique active site architecture
- School of Life Sciences, Peking University, China
- Peking University, China
- Howard Hughes Medical Institute, University of Iowa Roy J and Lucille A Carver College of Medicine, United States
- University of Iowa Roy J and Lucille A Carver College of Medicine, United States
- National Institute of Biological Sciences, China
- University of Texas Southwestern Medical Center, United States
- University of California, San Diego, United States
Figures
Figure 1 with 3 supplements
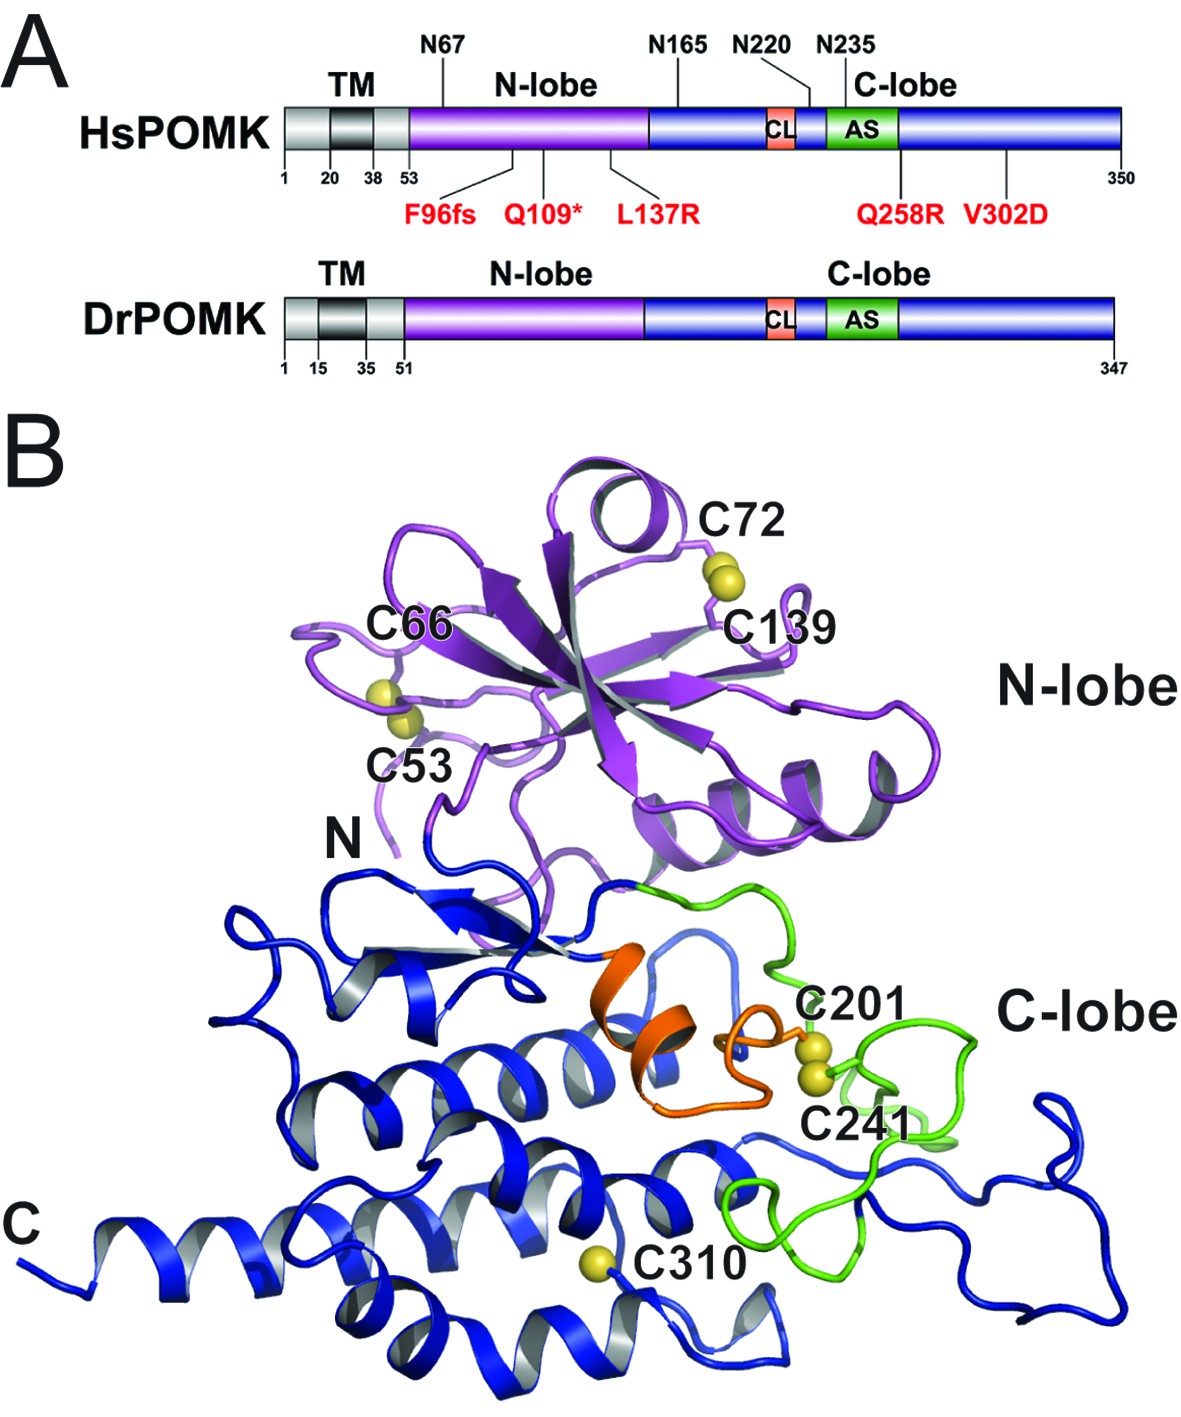
Crystal structure of DrPOMK.
(A) Schematic representation of HsPOMK and DrPOMK depicting the type II TM domain (black), the kinase domain (N-lobe: magenta; C-lobe: blue), the catalytic loop (CL, orange), and the activation segment (AS, green). Predicted N-linked glycosylation sites and mutations found in patients are shown at the top and bottom of HsPOMK, respectively. F96fs is a frame-shift mutation and Q109* is a nonsense mutation. (B) Ribbon representation of DrPOMK structure, shown in the same color scheme as Figure 1A. The sulfur atoms in the Cys residues are depicted in yellow spheres. The N- and C-termini of the protein are indicated.
Figure 1—figure supplement 1

A schematic model of the functional α-DG structure and enzymes involved in the glycan biosynthesis.
Functional glycosylation of α-DG starts with a GalNAc-β3-GlcNAc-β4-Mannose trisaccharide, established by the sequential activities of POMT1/2, POMGNT2, and B3GALNT2. The mannose is then phosphorylated by POMK at the C6 hydroxyl position, to allow further glycan elongation by enzymes including Fukutin, FKRP, TMEM5, B4GAT1, and LARGE.
Figure 1—figure supplement 2
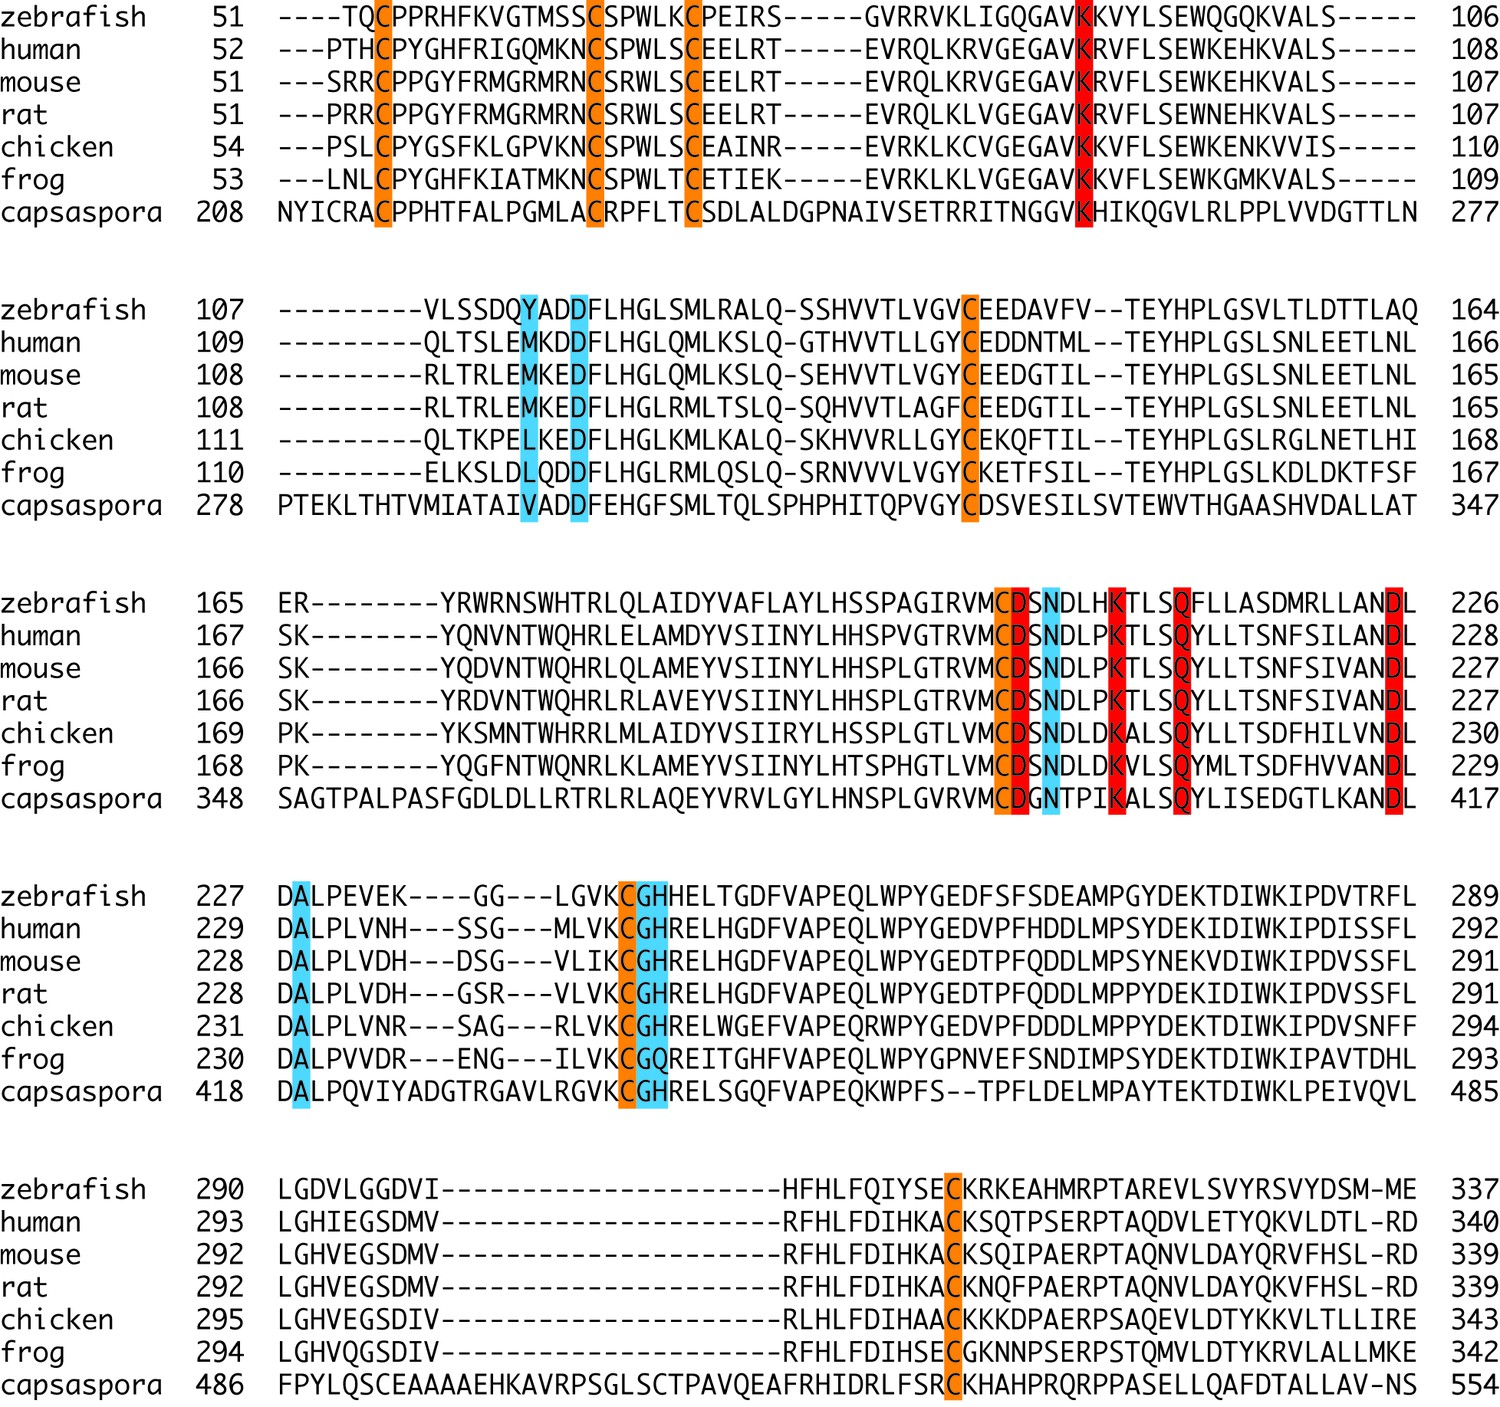
Sequence alignment of POMK kinase domain.
The conserved Cys residues are shaded in orange. Residues involved in nucleotide-binding and catalysis are shaded in red. Residues involved in binding to the trisaccharide are shaded in cyan.
Figure 1—figure supplement 3

POMK homologues phosphorylates GGM-MU.
Kinase assay was performed as described in Materials and methods. Hs: Homo sapiens; Dr: Danio rerio; Co: Capsaspora owczarzaki. The substrate GalNAc-β3-GlcNAc-β4-Man-α-MU (GGM-MU) was used in the assay.
Figure 2 with 1 supplement
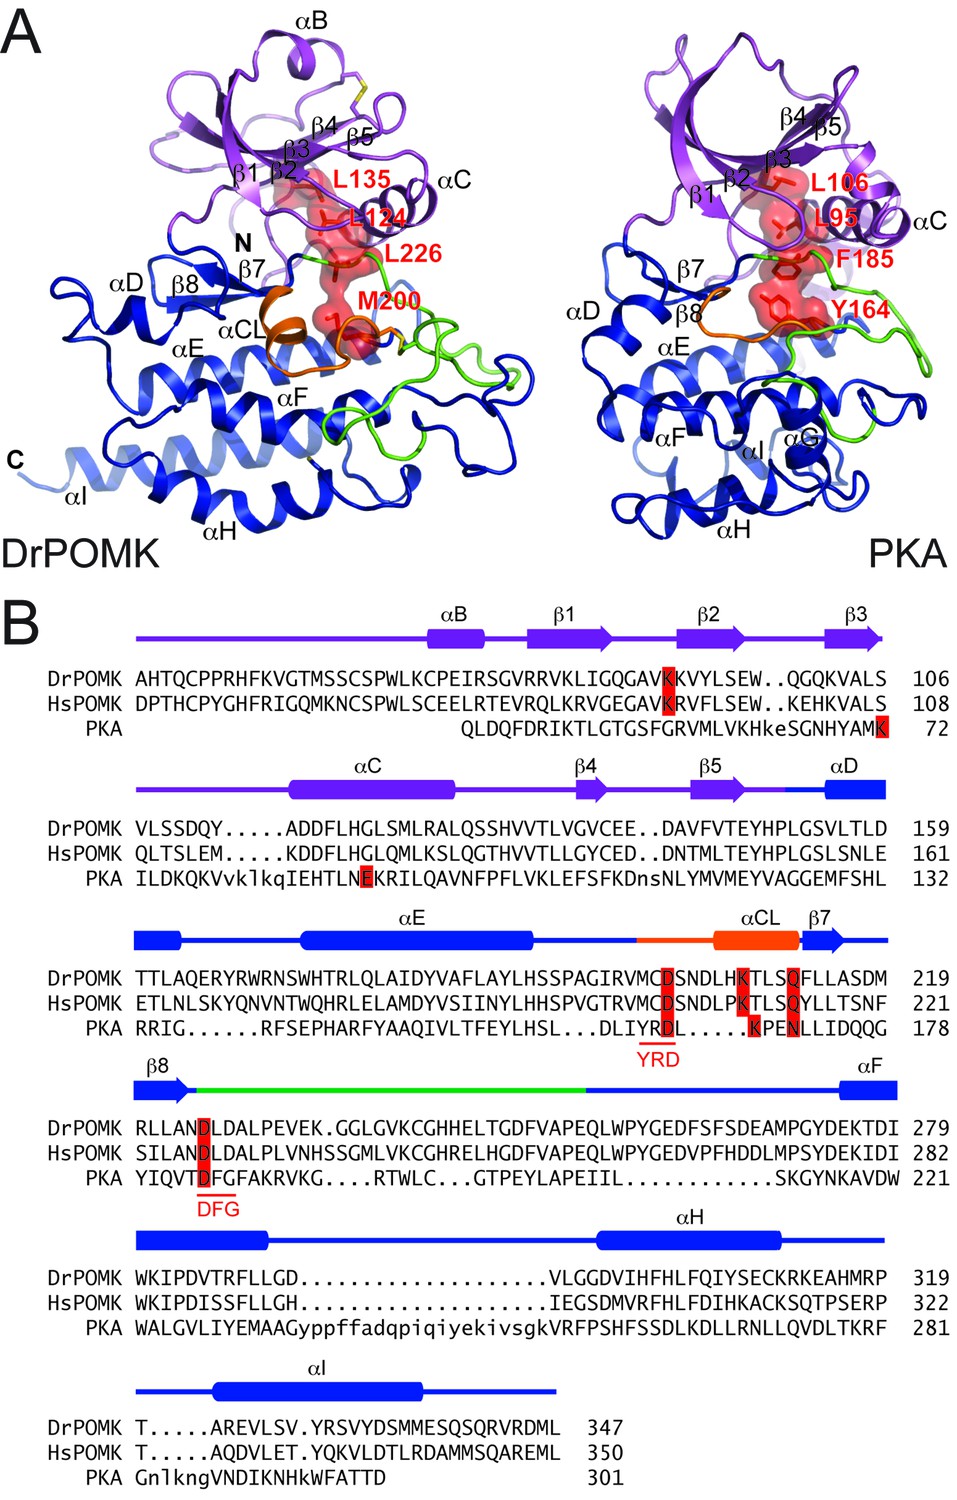
Structure comparison between DrPOMK and PKA.
(A) DrPOMK and PKA structures are shown in the same color scheme as Figure 1. Secondary structures of DrPOMK are labeled following PKA convention. The regulatory spines in the two proteins are depicted in red. (B) Structure-based sequence alignment of DrPOMK, HsPOMK, and PKA. Residues essential for kinase activity are highlighted in red. The YRD and DFG motifs in PKA are underlined.
Figure 2—figure supplement 1
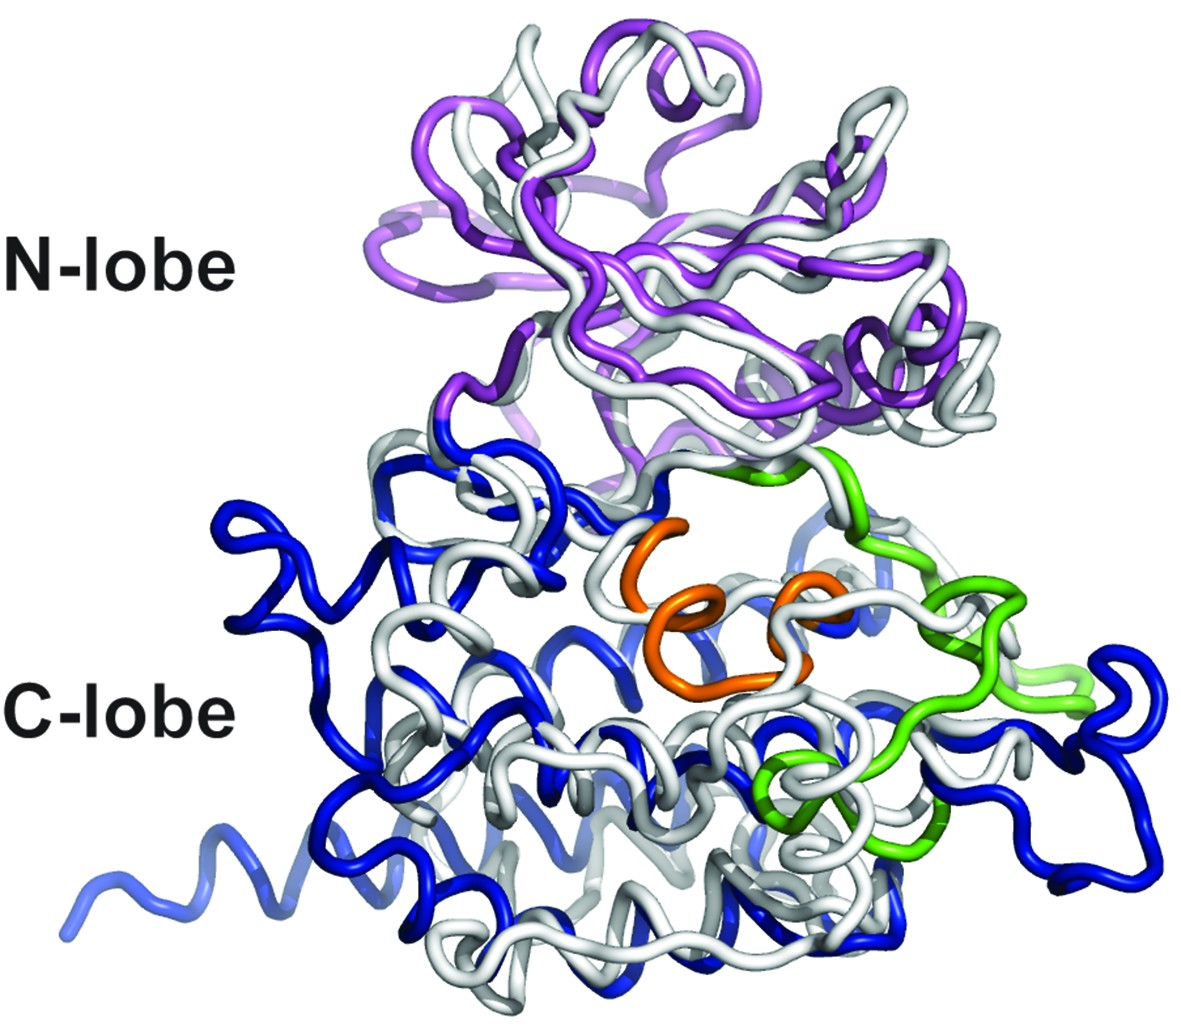
Superposition of DrPOMK and PKA.
DrPOMK and PKA are superposed and shown as ribbon diagrams. DrPOMK is colored in the same color scheme as Figure 1, and PKA is shown in white.
Figure 3
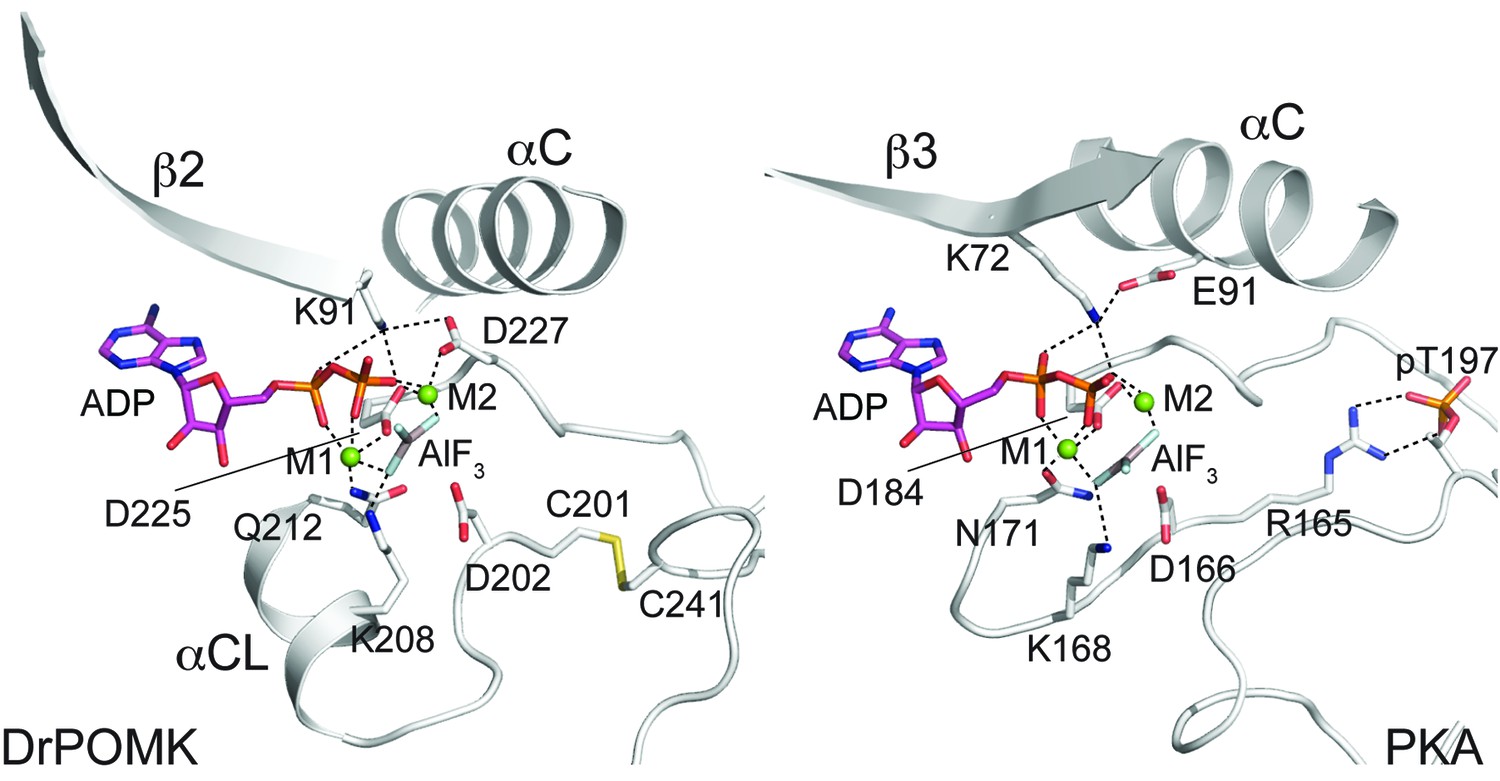
Structure of a transition state mimic of DrPOMK reveals residues required for catalysis.
Left: an enlarged image of the nucleotide-binding pocket of DrPOMK showing the molecular interactions important for kinase activity. The carbon, nitrogen, oxygen, and sulfur atoms of DrPOMK protein are shown in white, blue, red, and orange respectively. The carbons of ADP are colored in magenta. AlF3 is shown in sticks. The two Mg2+ ions (M1 and M2) are shown as green spheres. Salt bridge and hydrogen bond interactions are shown as dashed lines. Right: the active site of PKA is shown in the same orientation and coloring scheme for comparison (PDB ID: 1L3R).
Figure 4 with 2 supplements
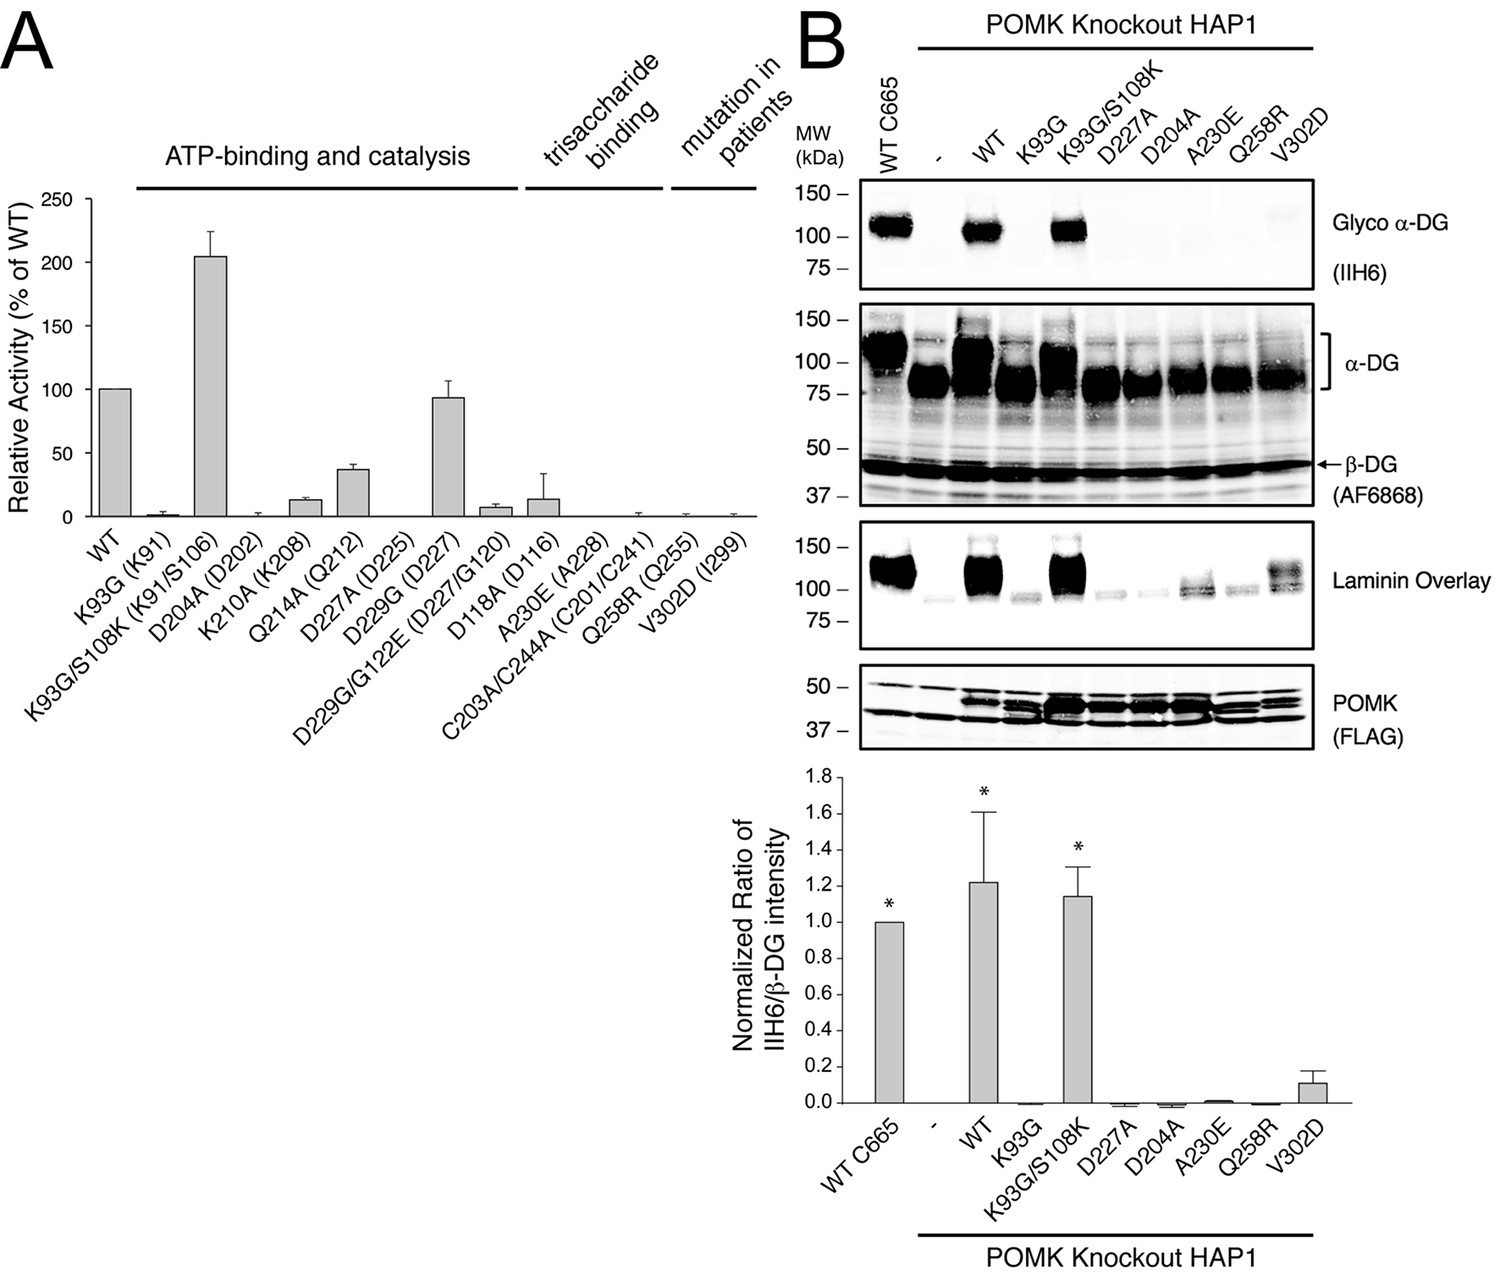
POMK mutants have reduced or abolished activity.
(A) POMK mutants display reduced or abolished kinase activity in vitro. HsPOMK proteins were assayed as described in Materials and methods. Activity of each mutant relative to that of the wild-type enzyme are depicted graphically. Error bars represent standard deviation of three independent experiments. The amino acids in brackets indicate the corresponding residues in DrPOMK. (B) POMK mutants are functionally defective in vivo. DG from wild-type C665 (a diploid cell line containing duplicated chromosomes of HAP1) and POMK KO HAP1 cells infected with indicated adenoviruses were analyzed by immunoblotting using anti-α-DG-glycan antibody (IIH6) and anti-DG-core antibody (AF6868). The laminin-binding ability of α-DG from these cells was examined using a laminin overlay assay. Expression of POMK was monitored using an anti-Flag antibody. The relative glycosylation level of α-DG was represented by the ratio of IIH6 immunoblot intensity to that of β-DG, normalized to the ratio from wild-type C665 cells (three replicates, error bars representing standard errors of the mean). Asterisks indicate p<0.001 compared to POMK KO alone.
Figure 4—figure supplement 1

Purification of HsPOMK mutants.
Wild-type and mutant HsPOMKs (as MBP-fusion proteins) were purified from the conditioned medium of baculovirus-infected Hi5 cells, and were used in the kinase assay as shown in Figure 4A.
Figure 4—figure supplement 2
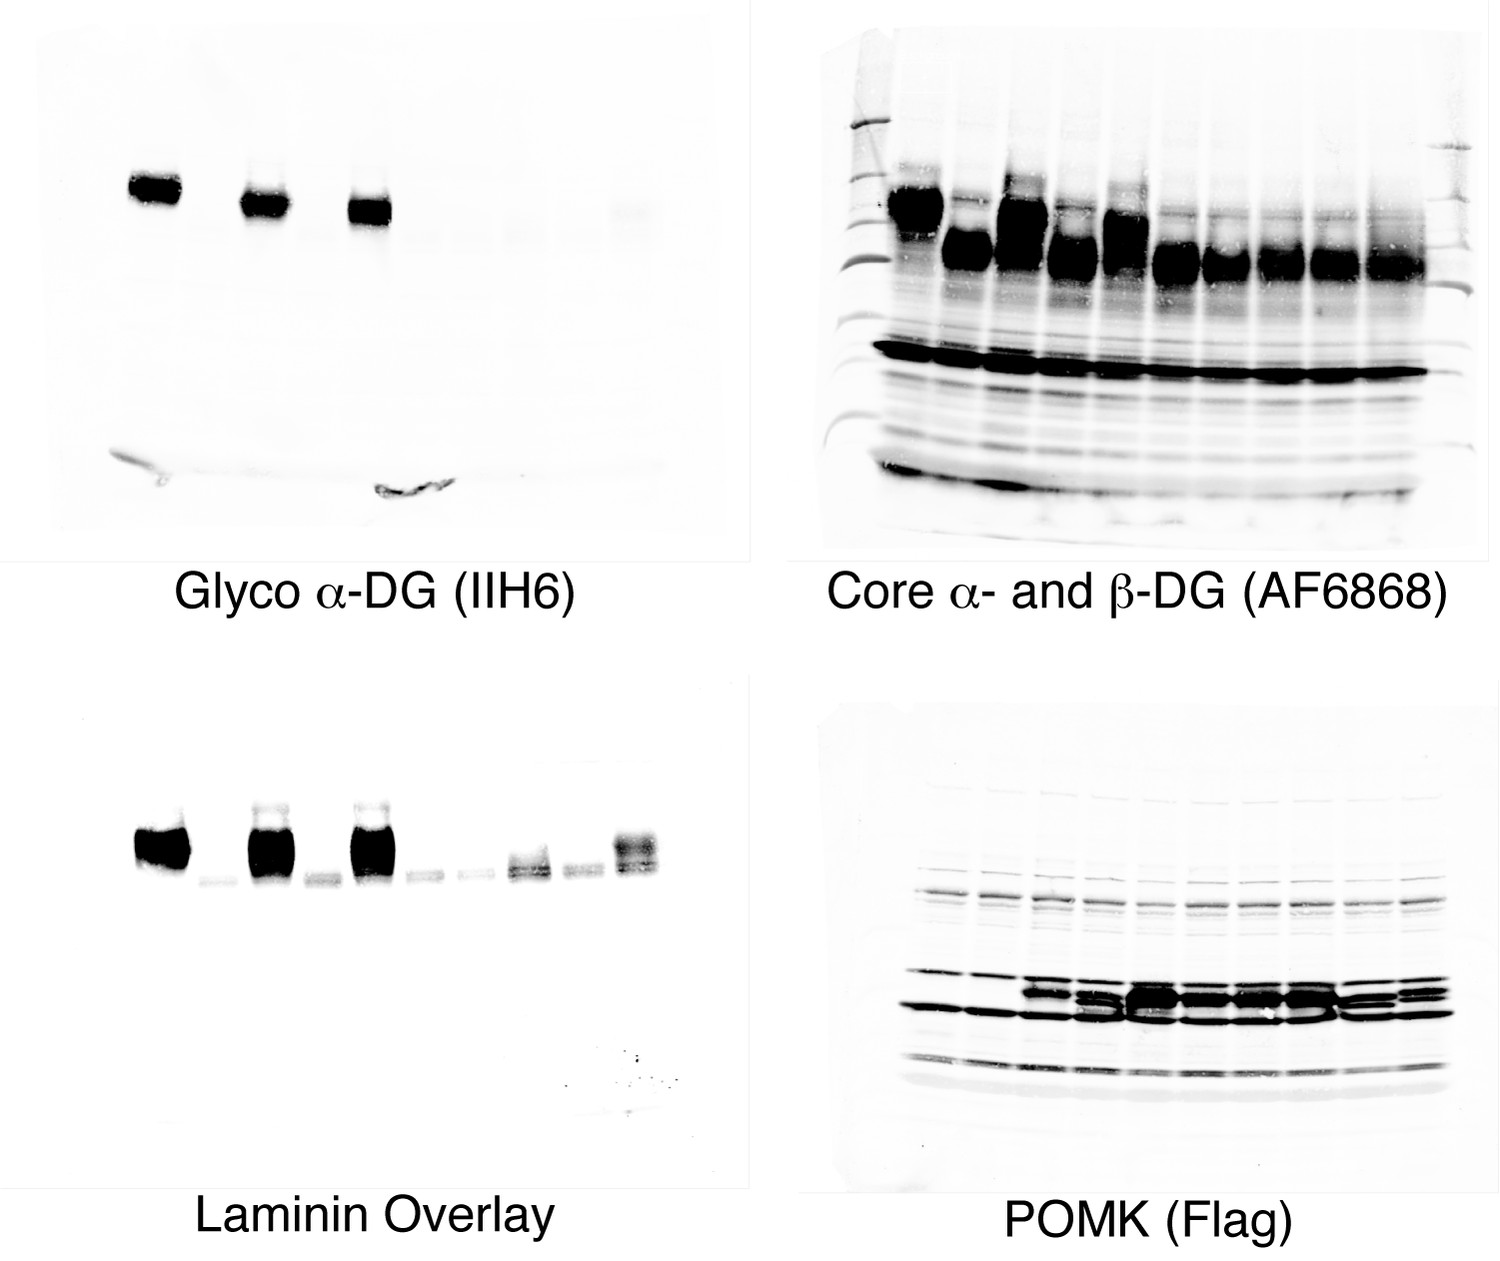
Un-cropped images of western blotting results shown in Figure 4B.
https://doi.org/10.7554/eLife.22238.012
Figure 5 with 1 supplement
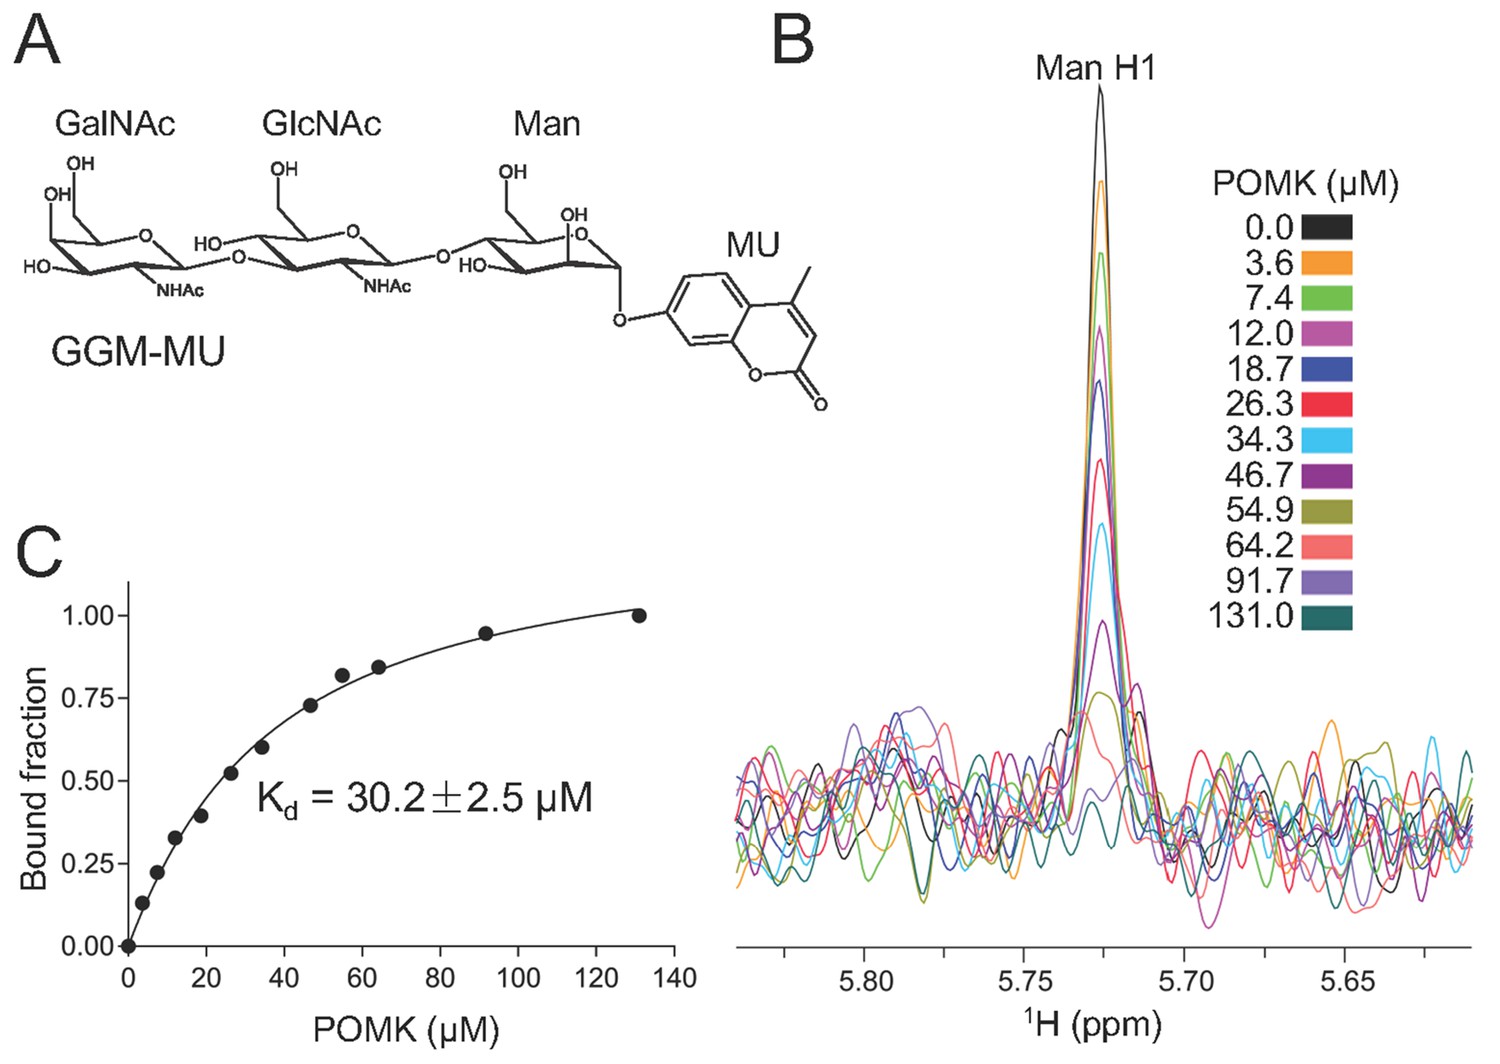
NMR analysis of trisaccharide GGM-MU binding to DrPOMK.
(A) The chemical structure of GGM-MU. (B) 1D 1H NMR spectra of the anomeric region of 10 µM GGM-MU acquired in a Tris buffer containing indicated concentrations of DrPOMK. The anomeric peak derived from mannose (Man H1) is labeled. (C) Determination of dissociation constant from the intensity changes of the anomeric peak of Man H1. The standard deviation from data fitting is shown.
Figure 5—figure supplement 1
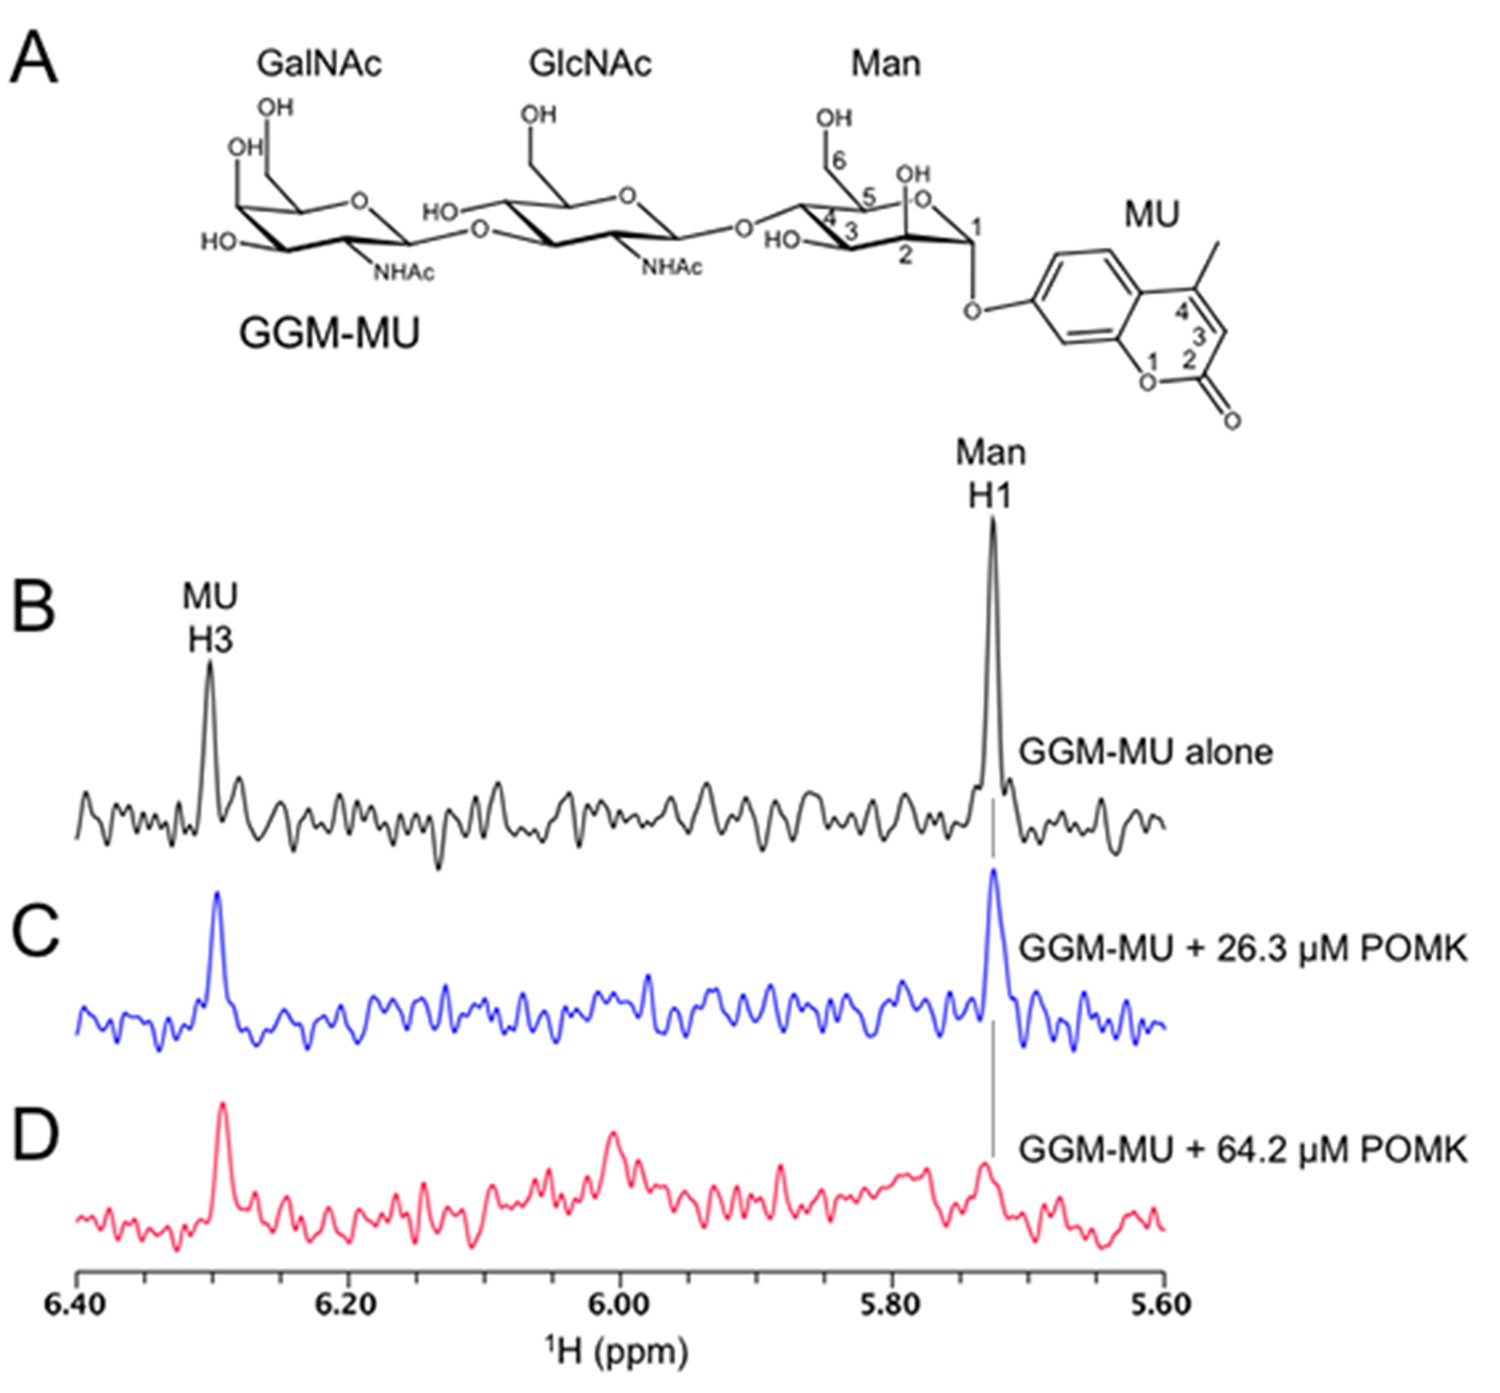
1D 1H NMR spectra of trisaccharide GGM-MU.
(A) The chemical structure of GGM-MU. (B–D) 1D 1H NMR spectra of 10 µM GGM-MU acquired in a Tris buffer containing indicated concentrations of DrPOMK. When the Man H1 peak is nearly saturated (fully bound) by adding 64.2 µM DrPOMK (panel D), the peak derived from MU group (MU H3) decreased only slightly, indicating that the MU group is mobile or not interacting with the protein even in the bound state. Therefore, the MU group contribution to the glycan binding affinity is likely small or negligible.
Figure 6 with 1 supplement
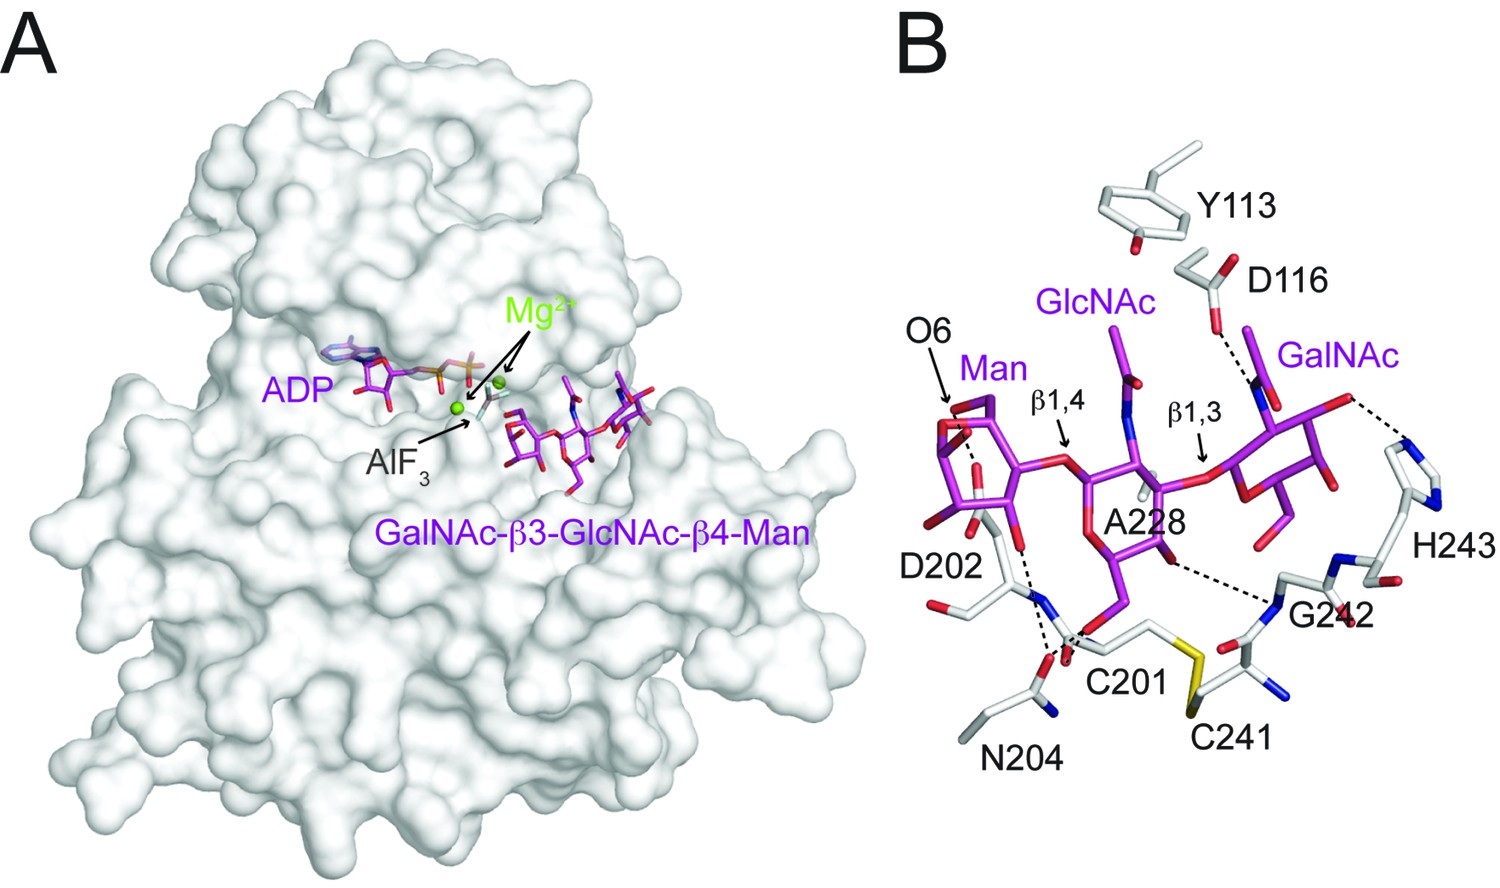
Interactions between DrPOMK and GalNAc-β3-GlcNAc-β4-Man.
(A) Surface representation of DrPOMK in complex with Mg2+ ions, ADP, AlF3, and GalNAc-β3-GlcNAc-β4-Man. The same coloring scheme as in Figure 3 is used. (B) An enlarged image of the GalNAc-β3-GlcNAc-β4-Man binding region showing the detailed molecular interactions important for the trisaccharide recognition. DrPOMK residues C201, D202, C241, G242, and H243 have both main chains and side chains shown as sticks, while the rest residues only have side chains depicted. Hydrogen bond interactions are shown as dashed lines. The linkages in the trisaccharide and the Man-O6 group are indicated.
Figure 6—figure supplement 1
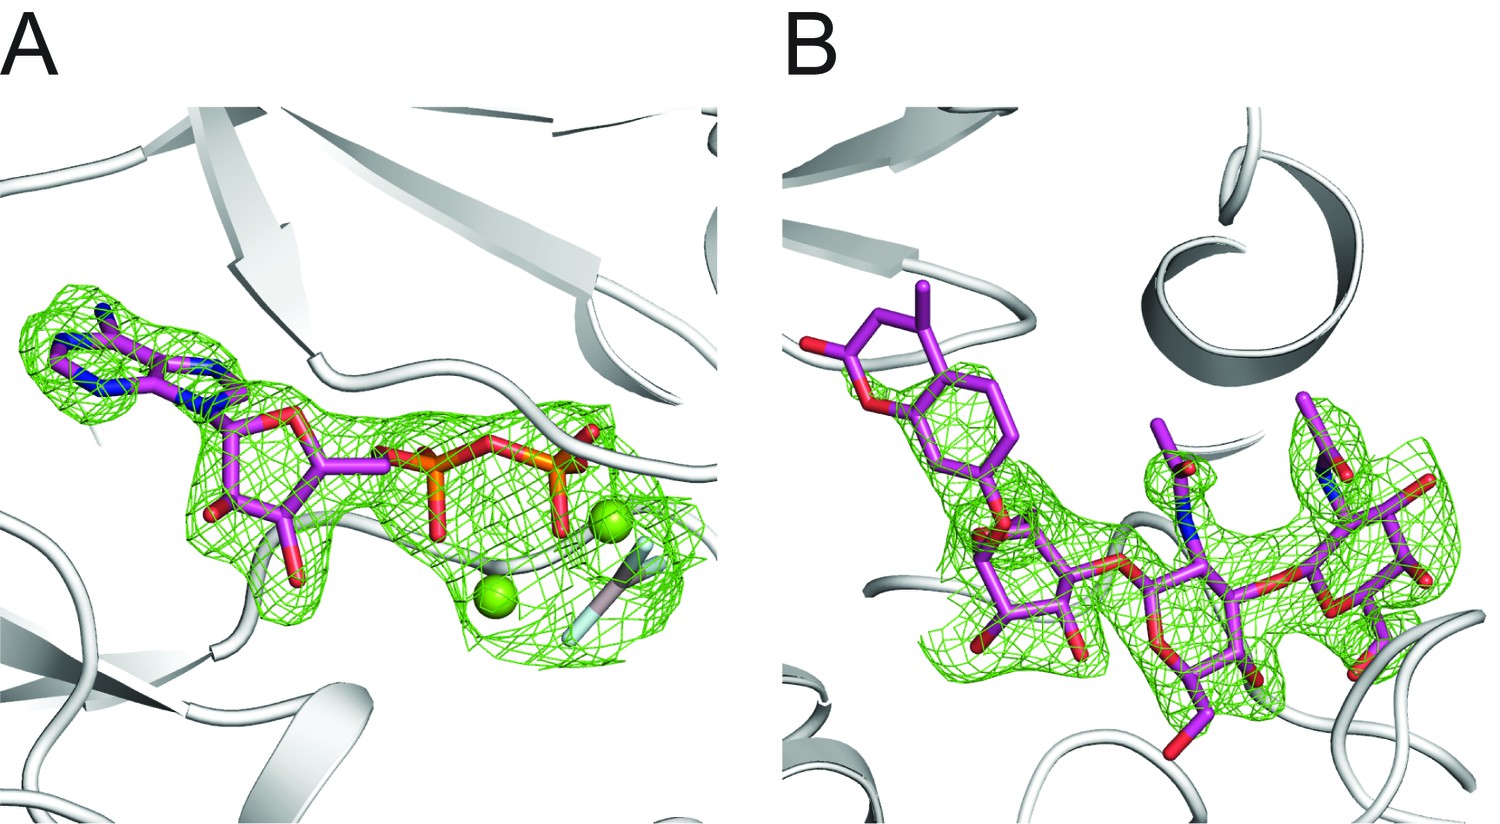
Electron density of Mg/ADP/AlF3 and GGM-MU.
(A) Fo-Fc difference electron density map at 2.5 σ shown as green wires before Mg/ADP/AlF3 are modeled in the structure. DrPOMK is shown as white ribbons. (B) Fo-Fc difference electron density map at 2.5 σ shown as green wires before the GGM-MU molecule is modeled. The electron density corresponding to the MU moiety is significantly weaker compared to that of the GGM trisaccharide, consistent with our NMR results showing that the MU group is flexible and does not contribute to binding to POMK (Figure 5—figure supplement 1).
Figure 7
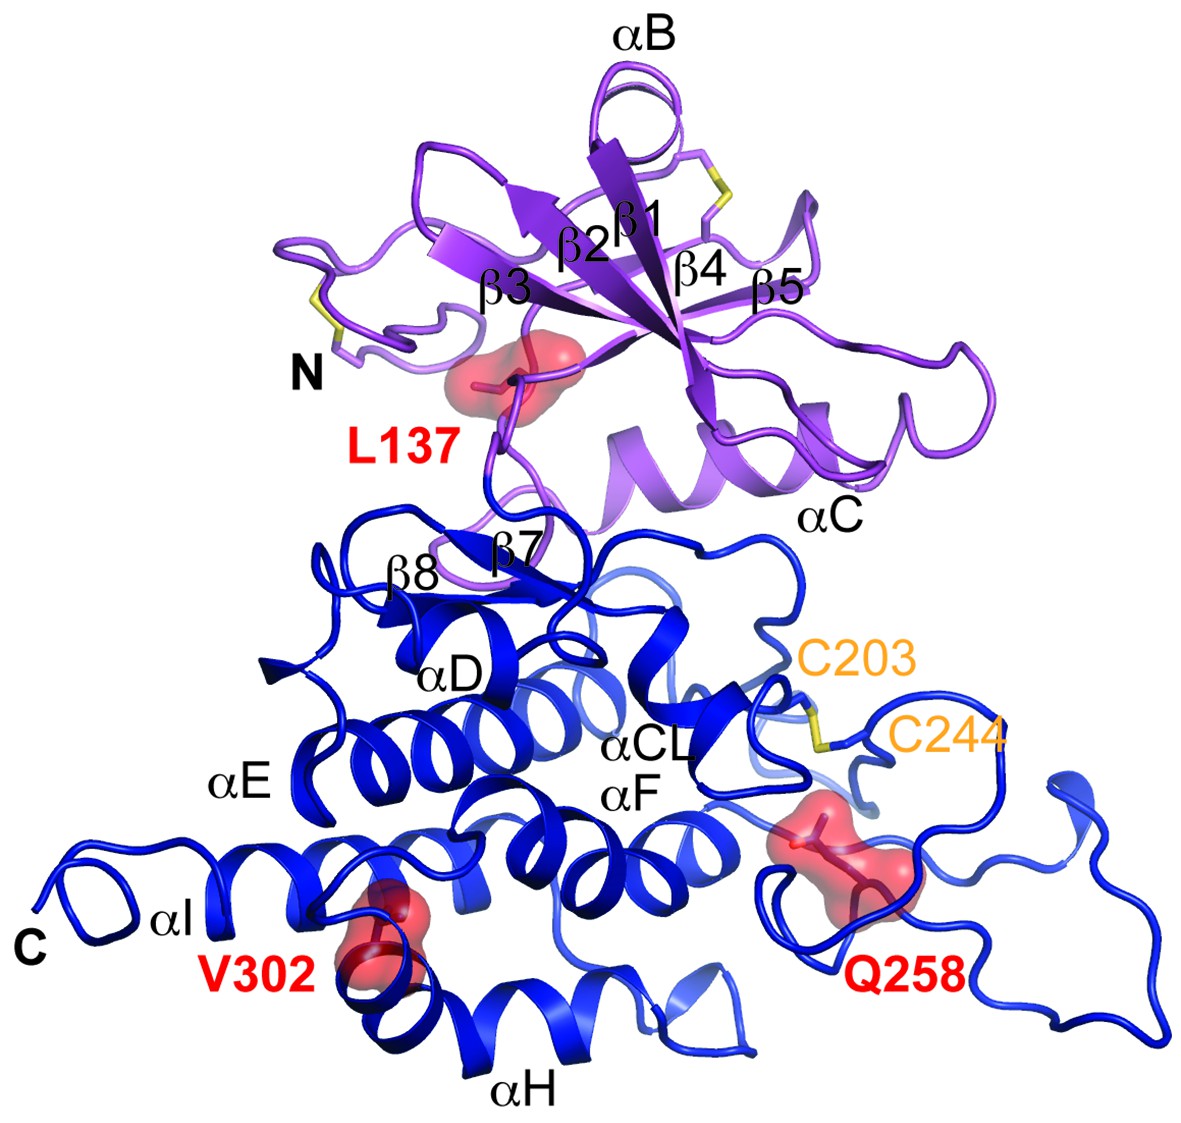
Structure modeling provides insights into POMK mutation related disease.
Homology model of human POMK based on DrPOMK structure is shown as ribbon diagrams. The disease mutations are shown in surface representation and highlighted in red.
Tables
Table 1
Data collection and refinement statistics.
| Se-Met DrPOMK | DrPOMK in complex with Mg/ADP, AlF3, and GGM-MU (PDB ID: 5GZA) | |
|---|---|---|
| Data collection | ||
| Space group | C2 | P32 |
| Cell dimensions | a = 217.95 Å, b = 107.03 Å, c = 151.99 Å, β = 134.2° | a = 70.55 Å, b = 70.55 Å, c = 66.94 Å, |
| Wavelength (Å) | 0.979 | 0.979 |
| Resolution (Å) | 2.85 | 2.0 |
| Rmerge | 7.8 (56.8) | 11.7 (51.4) |
| I / σI | 17.9 (2.0) | 24.4 (3.2) |
| Completeness (%) | 100 (100) | 100 (100) |
| Multiplicity | 3.8 (3.8) | 7.9 (7.9) |
| Wilson B-factor | 61.4 | 43.1 |
| Refinement | ||
| Unique reflections | 25147 | |
| Rwork / Rfree | 19.7 / 21.8 | |
| No. of atoms | ||
| Protein | 2308 | |
| Ligand/ion | 85 | |
| Protein residues | 298 | |
| B-factors | ||
| Protein | 52.3 | |
| Ligand/ion | 50.3 | |
| R.m.s deviations | ||
| Bond lengths (Å) | 0.009 | |
| Bond angles (°) | 1.137 | |
| Ramachandran | ||
| Favored (%) | 92.4 | |
| Allowed (%) | 7.6 | |
| Outliers (%) | 0 |
-
Each dataset was collected from a single crystal. Values in parentheses are for highest-resolution shell.
Download links
A two-part list of links to download the article, or parts of the article, in various formats.
Downloads (link to download the article as PDF)
Open citations (links to open the citations from this article in various online reference manager services)
Cite this article (links to download the citations from this article in formats compatible with various reference manager tools)
Structure of protein O-mannose kinase reveals a unique active site architecture
eLife 5:e22238.
https://doi.org/10.7554/eLife.22238


