Pausing guides RNA folding to populate transiently stable RNA structures for riboswitch-based transcription regulation
- Johann Wolfgang Goethe-University Frankfurt am Main, Germany
- Technical University Darmstadt, Germany
- University of Wisconsin–Madison, United States
Figures
Figure 1 with 2 supplements

Conformational states of the guanine-sensing riboswitch depending on transcript length.
(a) Secondary structure of the full-length guanine-sensing riboswitch (GSWPATH). In absence (left) and in presence of ligand (right) the aptamer closing helix (PA) and the terminator helix (TH) are formed, the anti-terminator helix (AT) is not present in either state. The only structural difference between the apo- and holo-states is the formation of a stable ligand binding pocket in the holo-state The strands involved in the switching mechanism are colour-coded: aptamer strand (P, black), aptamer stabilizing strand (A, blue), switching strand (T, red), and terminator strand (H, green). Putative pause sites (PS1-PS3) are indicated, the sequence highlighted in grey is occupied by the polymerase (Monforte et al., 1990); additionally, stable structured fragments are marked by arrows; (b) Secondary structure of a truncated stably structured guanine-sensing riboswitch (GSWPAT). In the absence of ligand two conformational states are populated in a 1:1 ratio each representing a functional (on/off) state of the riboswitch, (c) G·U region of NOESY spectra of the full-length GSWPATH (upper panel) and the truncated riboswitch GSWPAT (bottom). G·U cross peaks are reporters for formation of PA (black/blue), P3 (grey), AT (blue/red) and TH (red/green), respectively; (d) signal intensities of GSWfl and GSW10-134 NOESY cross peaks in absence and presence of ligand. Errors were estimated from the noise of the respective spectra. The full-length riboswitch GSWPATH adopts the terminator conformation irrespective of the ligand. The truncated GSWPAT shows a heterogeneous fold in the absence and in the presence of the ligand, (e) 10% PAGE of the overnight transcription of the full length riboswitch in the absence (-lig) and presence (+lig) of ligand. The transcribed RNA fragments correspond to the full length (FL: 228 nt), the Terminator (T: 172 nt), the second pause site (PS2: 152 nt), the first pause site (PS1: 124 nt) and the aptamer (APT: 96 nt).
Figure 1—figure supplement 1

Assignment of GSW constructs.
All 1H,1H-NOESY spectra were recorded at 283 K in 2 mM magnesium chloride, 50 mM potassium chloride, 25 mM potassium phosphate (pH 6.2). (a) Module design for chemical shift assignment of the full-length GSW with in the divide and conquer approach. The full-length GSW and the modules were measured by NMR spectroscopy seperately. Left: GSWfl (GSWPATH, grey) in the terminator conformation, the aptamer domain GSW10-89 (GSWPA, blue) and the terminator hairpin GSW121-155 (TH, green) are indicated. Right: GSWfl (GSWPATH, grey) in the antiterminator conformation and the P4 module (AT, red). (b) Overlay of the full-length GSWfl (GSWPATH, black), the aptamer domain GSW10-89 (GSWPA, blue) and the terminator hairpin GSW121-155 (TH, green) shows that GSWfl (GSWPATH) adopts the terminator conformation with formed aptamer and terminator hairpin. Assignment of the fragments can be transferred to GSWfl (GSWPATH). (c) Left: Overlay of the truncated GSW10-134 (GSWPAT, black), the aptamer domain GSW10-89 (GSWPA, blue) and the P4 module (AT, red) reveals conformational heterogeneity of GSW10-134 (GSWPAT)with either helix P1(PA) (GSW10-134A, GSW[PA]T) or helix P4(AT) (GSW10-134B, GSWP[AT]) formed. Right: Conformations GSW10-134A (=GSW[PA]T) and GSW10-134B (=GSWP[AT]) of the truncated GSW10-134 (=GSWPAT). (d) Spectra of the aptamer domain GSW10-89 (GSWPA, blue), the terminator hairpin GSW121-155 (TH, green) and the P4 module (AT, red). Assignments are annotated in the spectra; the sequence of the P4 (AT) module is given.
Figure 1—figure supplement 2
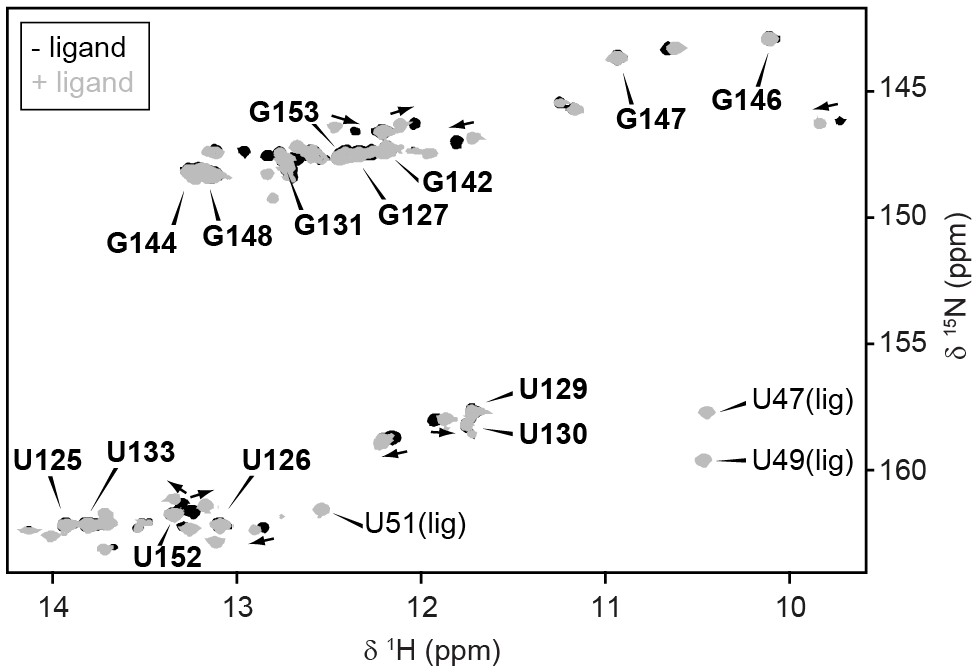
Conformation of full-length GSW.
GSWfl without (black) and with ligand (grey) adopts the terminator conformation. Experimental conditions are 2 mM magnesium chloride, 50 mM potassium chloride, 25 mM potassium phosphate (pH 6.2). The resonance assignment of the terminator hairpin P6 is depicted in bold letters. In presence of ligand, reporter signals (U47, U49 and U51) from the binding pocket are detected. However, ligand binding induces slight chemical shift changes (arrows) but no conformational changes are observed in particular not for TH.
Figure 2 with 1 supplement
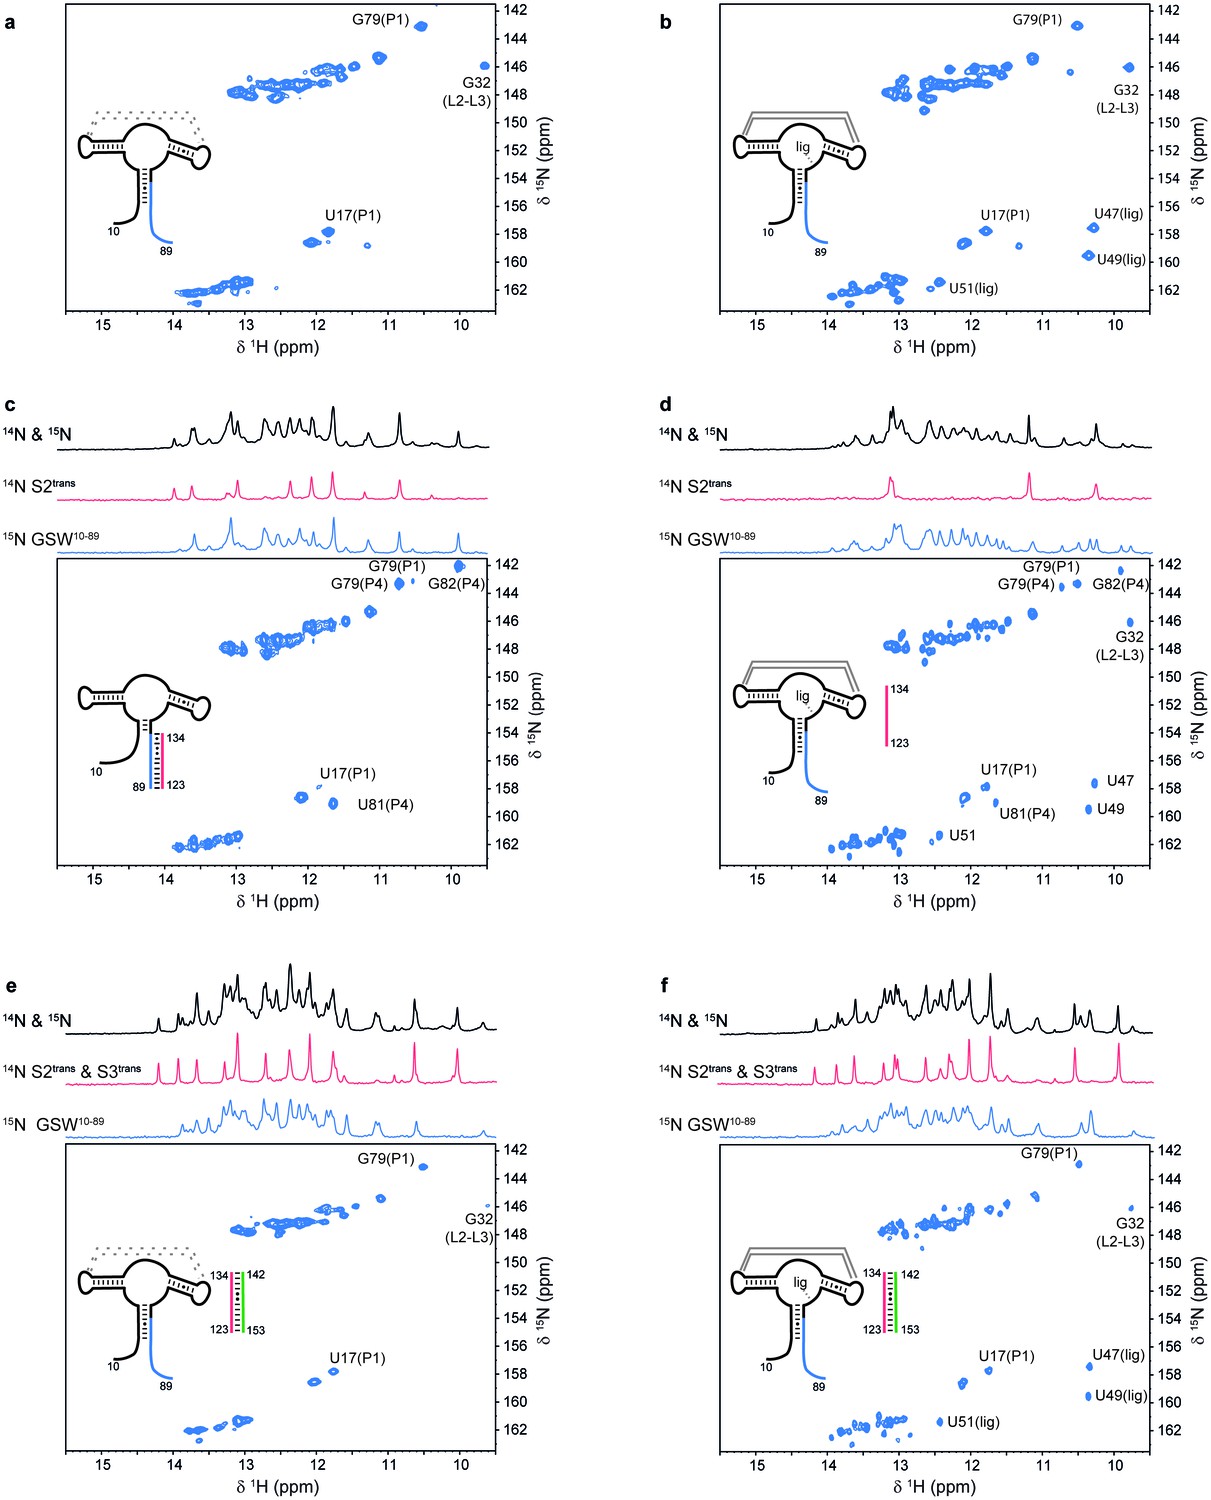
Models for intermediates during transcription.
All NMR spectra were recorded at 283 K in 2 mM MgCl2, 50 mM KCl, 25 mM potassium phosphate (pH 6.2). 1 equivalent of each RNA (GSW10-89 (=GSWPA), S2trans (=Ttrans) and S3trans(=Htrans), respectively) was used, 4 equivalents of ligand were added. The following selective labelling scheme was explored: 15N-G,U GSW10-89, 14N-G,U S2trans and 14N-G,U S3trans. Signals originating from GSW10-89 and S2trans or S3trans were separated using in x-filter 1D experiments (Weixlbaumer et al., 2013) (top). The 1H,15N-HSQC spectra (bottom) report on the interactions in the aptamer domain. (a) In the elongated aptamer domain GSW10-89, the helix PA was formed (U17–G79) and the loop-loop interaction reporter G32 was detected. (b) GSW10-89 and ligand (1:4) ligand binding was monitored by appearance of signals U47, U49 and U51. (c) GSW10-89 and S2trans (1:1): Sequence S2trans caused the PA reporter signals U17(P1) and G79(P1) to decrease, AT formation was followed by appearance of signals of G79(P4), U81(P4) and G82(P4). (d) GSW10-89, S2trans and ligand (1:1:4): Addition of ligand to GSW10-89-S2trans resulted in dissociation of the complex (decreasing signals for G79(P4), U81(P4) and G82(P4) signals) and reformation of the PA helix (U17(P1) and G79(P1) signals). Ligand binding reporters U47, U49 and U51 were detected. However, in presence of 4 equivalents of ligand, AT helix reporter signals were significant. (e) GSW10-89, S2trans and S3trans (1:1:1) Addition of S3trans to GSW10-89-S2trans resulted in complete dissociation of the complex (G79(P4), U81(P4) and G82(P4) signals) and reformation of the PA helix (U17(P1) and G79(P1) signals). In contrast to ligand addition, 1 equivalent of S3trans was sufficient to disrupt the antiterminator mimic. (f) GSW10-89, S2trans, S3trans and ligand (1:1:1:4): Ligand binding to GSW10-89 in presence of the terminator helix P6 (=TH) equals ligand binding to GSW10-89 (GSWPA) alone (b).
Figure 2—figure supplement 1

ITC measurements and Kd values of GSWPA (a), GSWPAT (b) and GSWPATH (c).
ITC measurements were performed with a Microcal VP ITC (Northampton, MA USA) at 10°C. A 217 μM solution of ligand (hypoxanthine) was titrated to a 15 μM solution of RNA using 25–42 injections. Buffer conditions were 2 mM magnesium chloride, 50 mM potassium chloride, 25 mM potassium phosphate, pH 6.2. The data was analyzed with the Origin ITC software (OriginLab, Northampton, MA USA) assuming a single binding site. The Kd values are given in µM.
Figure 3 with 2 supplements

RNA refolding and ligand binding kinetics.
(a) Schematic overview of the performed kinetic experiments (indicated with letters b-h) to characterise different transcription intermediates. The aptamer domain GSWPA is depicted in black, switching sequences A (blue), T (red) and H (green) are colour-coded. Dashed sequences are neglected in the antisense oligonucleotide approach. (b–h) results of the kinetic experiments, lettering according to a). 15N- (left) and 14N-filtered (right) 1D spectra before (top) and after (bottom) the kinetic experiments are depicted. An exemplary time trace reporting on the formation of each structural motif involved in the rearrangement is given, respective signals are marked with red arrows. (i) Rates obtained from signal traces of resolved imino proton resonances. Letters refer to the kinetic experiments as shown in a). For all structure motifs (ligand binding, PA, AT and TH formation, respectively) several signals (number indicated below) were analysed, averaged rates are given in bars, rates of individual base pairs are indicated with diamonds. Colour-coding refers to AT association (green), AT dissociation (red), ligand binding (dark grey), aptamer formation (blue), terminator association (orange) and Htrans-intrinsic unfolding (light grey) which is irrelevant for riboswitch function. Residues with a single rate were fitted mono-exponentially, a bi-exponential fit function was applied for residues with two distinguishable rates. For exact values and errors see Supplementary file 1.
Figure 3—figure supplement 1
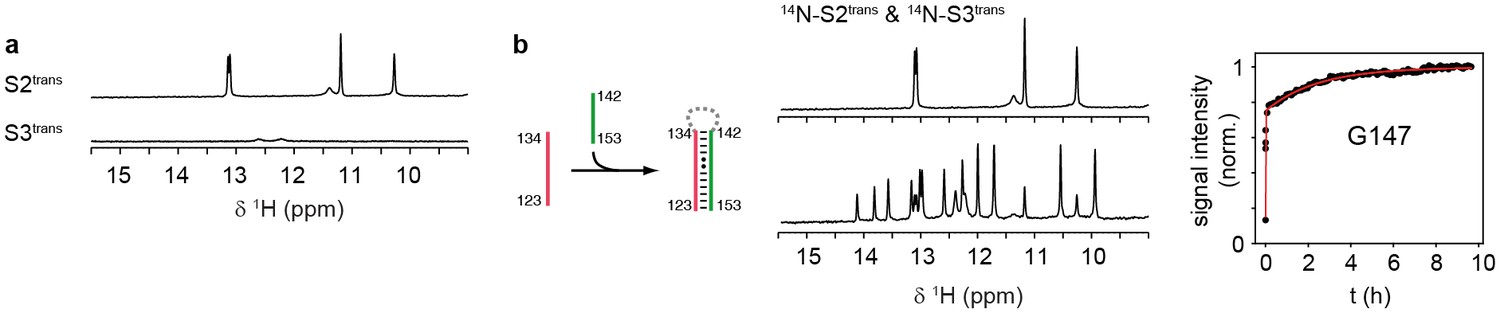
Folding of sequences Ttrans and Htrans.
(a) Imino proton region of the 1H-NMR spectra of the oligonucleotide sequences Ttrans (top) and Htrans (bottom). NMR spectra were recorded at 283 K in 2 mM magnesium chloride, 50 mM potassium chloride, 25 mM potassium phosphate (pH 6.2). The sequence Ttrans shows intrinsic folding, intrinsic interactions of Htrans are minor.
Figure 3—figure supplement 2
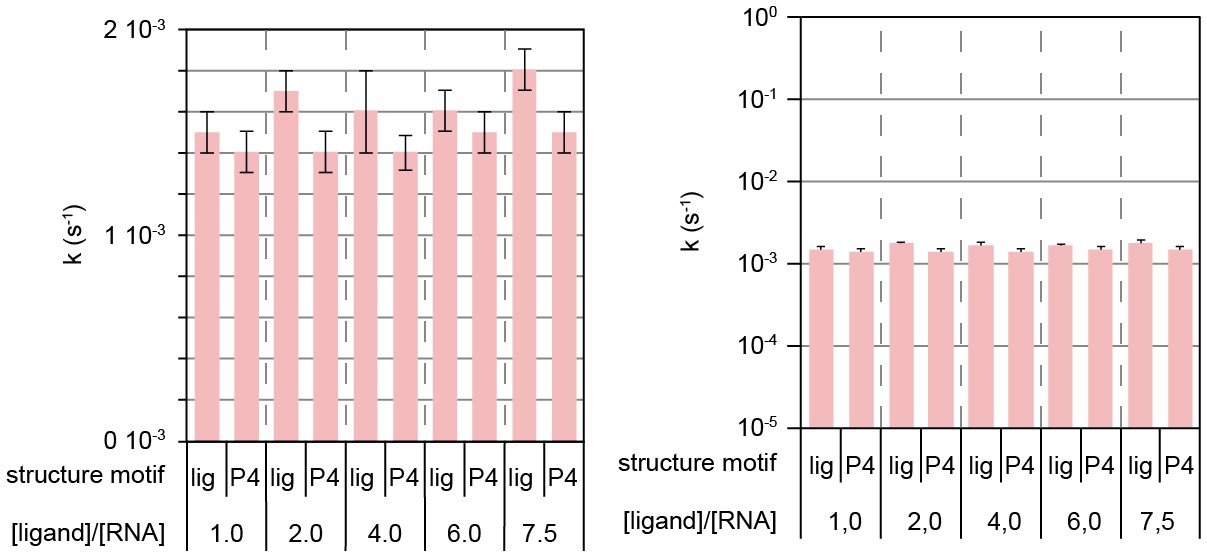
Ligand-independent dissociation of helix AT in kinetic experiment d.
Rates obtained from signal traces of resolved imino proton resonances.
Figure 4 with 3 supplements

Time resolved Transcription: 8% PAGE of time resolved transcriptions using the E.coli (EC holo) and the B. subtilis (BS holo) RNAPs in the absence (-ligand) and presence (+ligand) of ligand.
The time points of transcription stops are indicated in (s). The positions of 32P 5’-labeled markers (pBR322 MspI digested) are indicated on the left hand side. Prominent paused and terminated bands are indicated on the right hand side. seven major RNA-fragments could be identified: The run-off transcript or full-length RNA (FL), the premature termination fragment (GswPATH), the second pause-site (PS2), the first pause-site (PS1) and three pausing fragments (RNA95 and RNA77 for E. coli RNAP transcriptions and RNA90 and RNA77 for B. subtilis RNAP transcriptions). Over time, both RNAPs transcribe the DNA-template, generating RNA-fragments of increasing size. A pausing event is characterized by signal increase and by a fast increase of the signal followed by a slower decrease (e.g. RNA77). FL and GswPATH show a strong accumulation over time and when ligand is added, the signal intensity of FL is decreased whereas the signal intensity of GswPATH is increased.
Figure 4—figure supplement 1
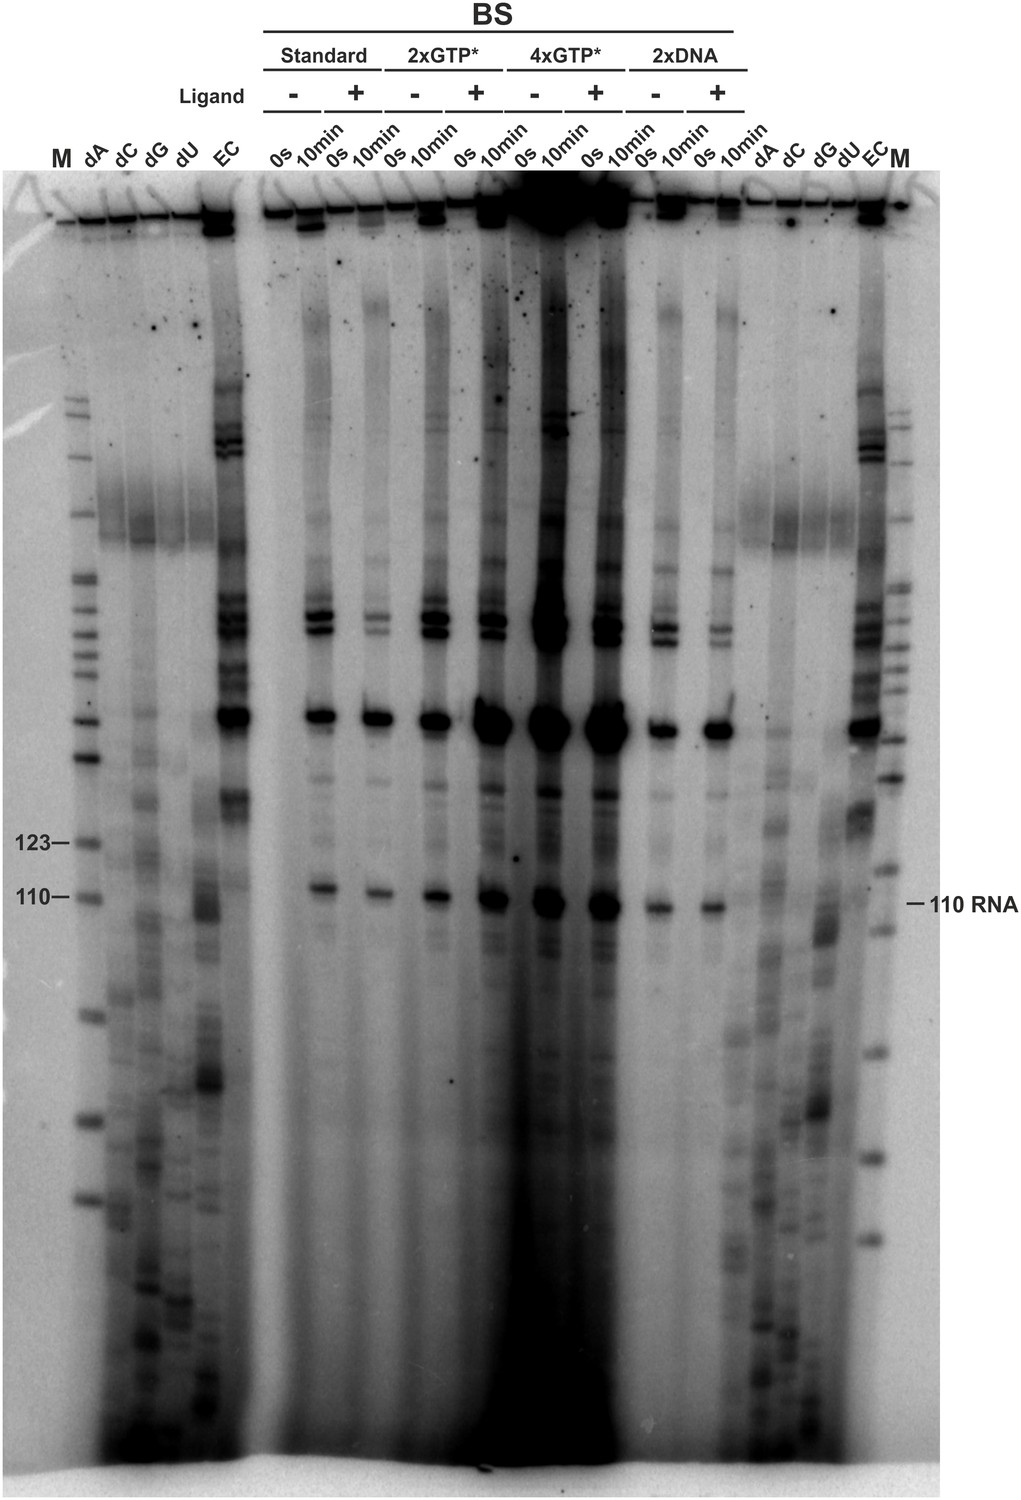
3’-mapping and GTP* increase.
Transcription was performed using the E. coli RNAP in the absence (EC) and presence of 3’-deoxy ATP (dA), CTP (dC), GTP (dG) and UTP (dU), respectively and compared to transcriptions using the B. subtilis RNAP with different amounts of radioactively labeled GTP (GTP*) or DNA template in the absence and presence of ligand. The gel shows several transcription abortion products which end with a 3’-deoxy U and which migrate slightly faster than the 110 RNA fragment. When compared to the sequence, this poly-U stretch corresponds to the bases T107 to T112. However, it can’t be clearly stated on which nucleotide the 110 RNA ends. It was therefore decided to call this fragment 110.
Figure 4—figure supplement 2
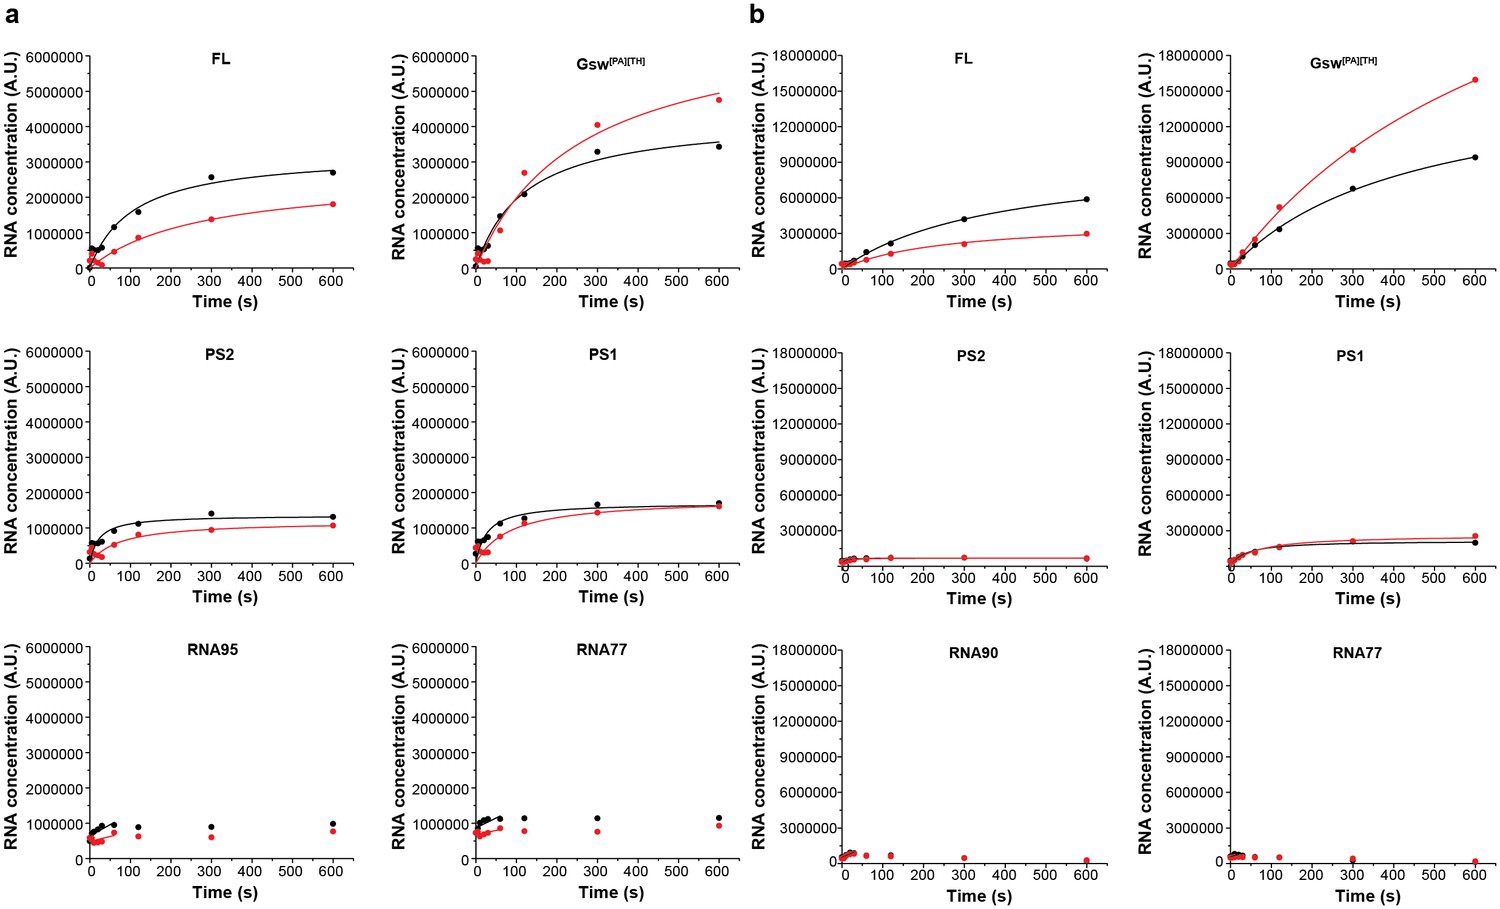
Intensity plots of the normalized pause signals.
(a) The signal intensities of the E. coli RNAP transcripts PS2, PS2, RNA95 and RNA77 were analyzed as shown by Landick et al. (1996) in the absence (black) and presence (red) of ligand and plotted over time. For normalization, the intensity of an RNA signal (RNA) was divided by the sum of all RNAs of the same length and longer (RNAp). (b) Pausing plots of the B. subtilis RNAP transcripts. The steeper the pausing-plot, the shorter the dwell-time (τ) of the pause site. Pause-sites with high τ have a higher impact on transcription kinetics. Addition of ligand seems to have a higher impact on the pausing of the E. coli RNAP. However, the differences of the plots are within the errors.
Figure 4—figure supplement 3
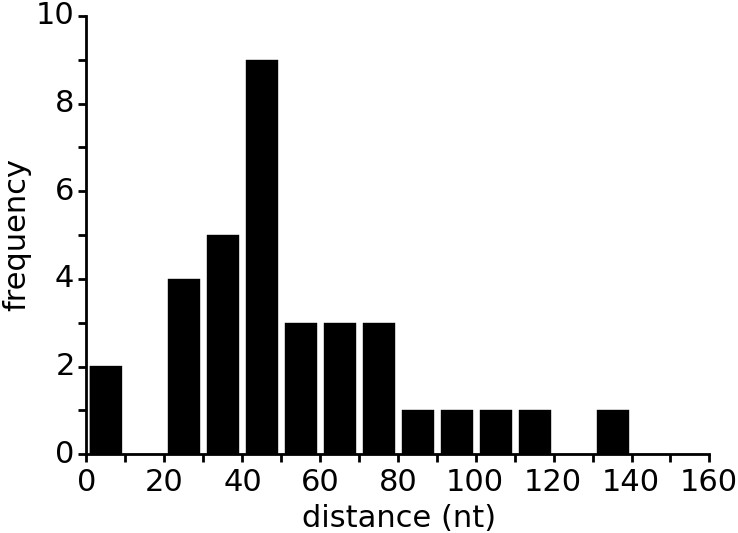
Distance between aptamer and terminator hairpin in purine riboswitches.
The list of 133 riboswitches was taken from the seed dataset of the Rfam database entry for the Purine riboswitch family (RF00167). Riboswitch sequences were retrieved from the EMBL European Nucleotide Archive (ENA). The Rfam database contains only the aptamer regions of the purine riboswitches but lacks the expression platform. Therefore, the database does not annotate the terminator location. The web service ARNold, which uses Erpin (Gautheret and Lambert, 2001) and RNAmotif (Macke et al., 2001) to predict terminators, was run on all riboswitch sequences to determine the terminator position. Sequences upstream of the coding sequence (CDS) as identified by annotations in ENA were used as input for ARNold. ARNold identified terminators between the aptamer and the CDS in 35 of the 133 sequences. The distances between aptamer and terminator were calculated based on the secondary structure annotation from Rfam and the output from ARNold. Predicted terminators inside the aptamer sequence were excluded from the data.
Figure 5
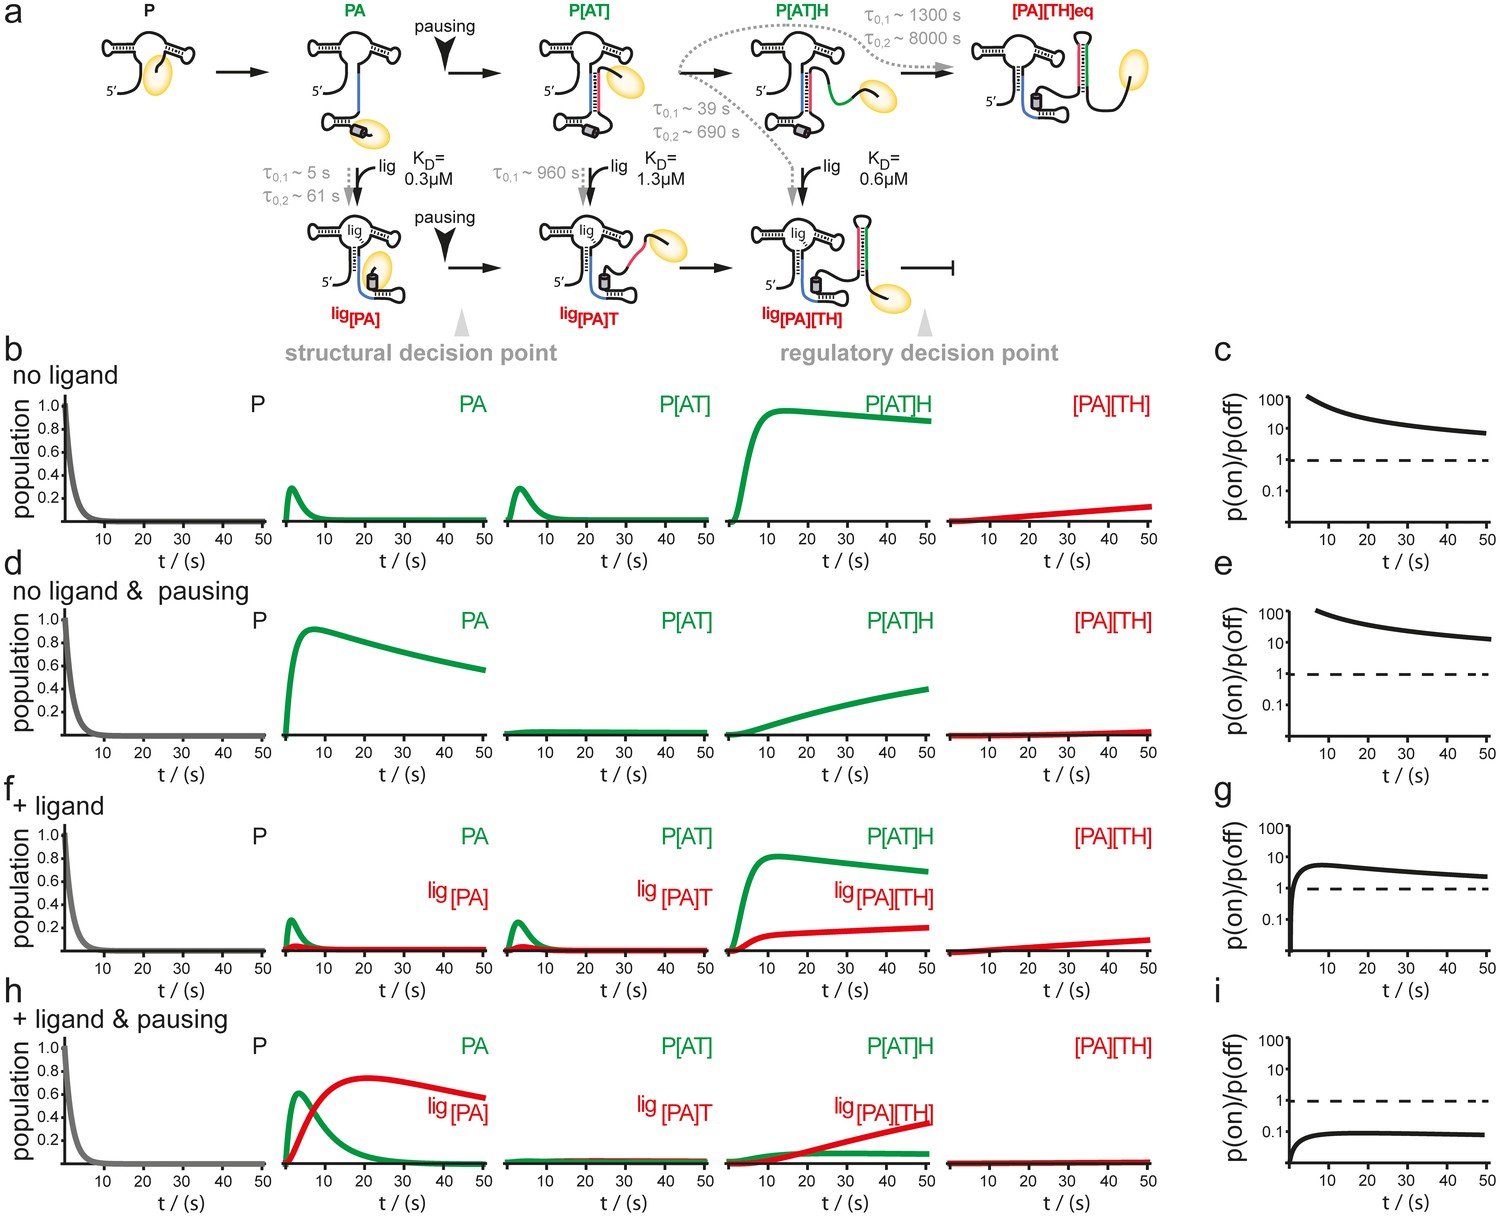
Simulation of co-transcriptional folding pathways.
(a) Conformational states of GSW in context of the transcription progress are shown from left to right. Kd values of the transcript intermediates are indicated. Ligand binding can occur as soon as the aptamer domain is transcribed and consequently locks A (blue) in the PA helix resulting in the population of a single conformation during the transcription process and subsequently in transcription termination. The aptamer domain is synthesized first. As transcription continues, the free mRNA adopts the metastable antiterminator conformation stabilized by AT interaction (blue and red, respectively) which refolds to the terminator conformation after the riboswitch is completed. Pause site PS1 (grey cylinder) increases the available time window for ligand binding. Co-transcriptional refolding processes are indicated with their respective life times by the black arrows. Population of the conformational states under different conditions (the time plotted on the x-axis is the time of transcription with t = 0 at nucleotide position 75) (b) without ligand and without pausing, (d) without ligand and with pausing at PS1 and (f) with ligand and without pausing and (g) in presence of ligand and with pausing at PS1. Ratio of the probabilities to populate the on- versus the off-state as derived by kinetic simulation of the switching mechanism in absence (c, e) and in presence (g, i) of ligand. If the polymerase does not pause between the synthesis of the stretches A and T, GSW adopts the on-state irrespective of ligand (c, g) whereas pausing at PS1 enables GSW to respond to its ligand and dominantly adopts the off-conformation in the presence of ligand (i).
Figure 6

In vivo Pause site characterisation.
(a) Regulation of ß-galactosidase reporter gene expression by wt-GSW and pause site 1 mutants. Nucleotide exchanges or insertion of residues to generate the PS1 mutants M1–M4 are indicated. Enzyme activity for cells grown in absence (black bars) or presence of 0.5 mg mL−1 guanine (grey bars), respectively; the dynamic range corresponds to the ratio of enzyme activity in absence and presence of ligand. (b) Dose-dependent repression of ß-galactosidase expression for wt GSW (black), M3 (green) and M4 (purple). Nucleotide exchanges to generate the PS1 mutants M3 and M4 are indicated. Cultures were grown with increasing concentrations of guanine. Deletion of PS1 reduces riboswitch efficiency, whereas it is increased in case of elongation of PS1. However, both mutations do not significantly alter the half maximal effective concentration EC50.
Additional files
-
Supplementary file 1
This file contains rates obtained by Kinetic NMR experiments, the exact nucleotide sequence of the DNA template used in transcriptional assays, as well transcription rates and pause site characteristics.
- https://doi.org/10.7554/eLife.21297.016
Download links
A two-part list of links to download the article, or parts of the article, in various formats.
Downloads (link to download the article as PDF)
Open citations (links to open the citations from this article in various online reference manager services)
Cite this article (links to download the citations from this article in formats compatible with various reference manager tools)
Pausing guides RNA folding to populate transiently stable RNA structures for riboswitch-based transcription regulation
eLife 6:e21297.
https://doi.org/10.7554/eLife.21297


