Akt1-Inhibitor of DNA binding2 is essential for growth cone formation and axon growth and promotes central nervous system axon regeneration
- Sungkyunkwan University School of Medicine, Republic of Korea
- Samsung Biomedical Research Institute, Sungkyunkwan University School of Medicine, Republic of Korea
- University of California, San Francisco Medical Center, United States
- University of Ulsan, College of Medicine, Republic of Korea
Figures
Figure 1 with 2 supplements
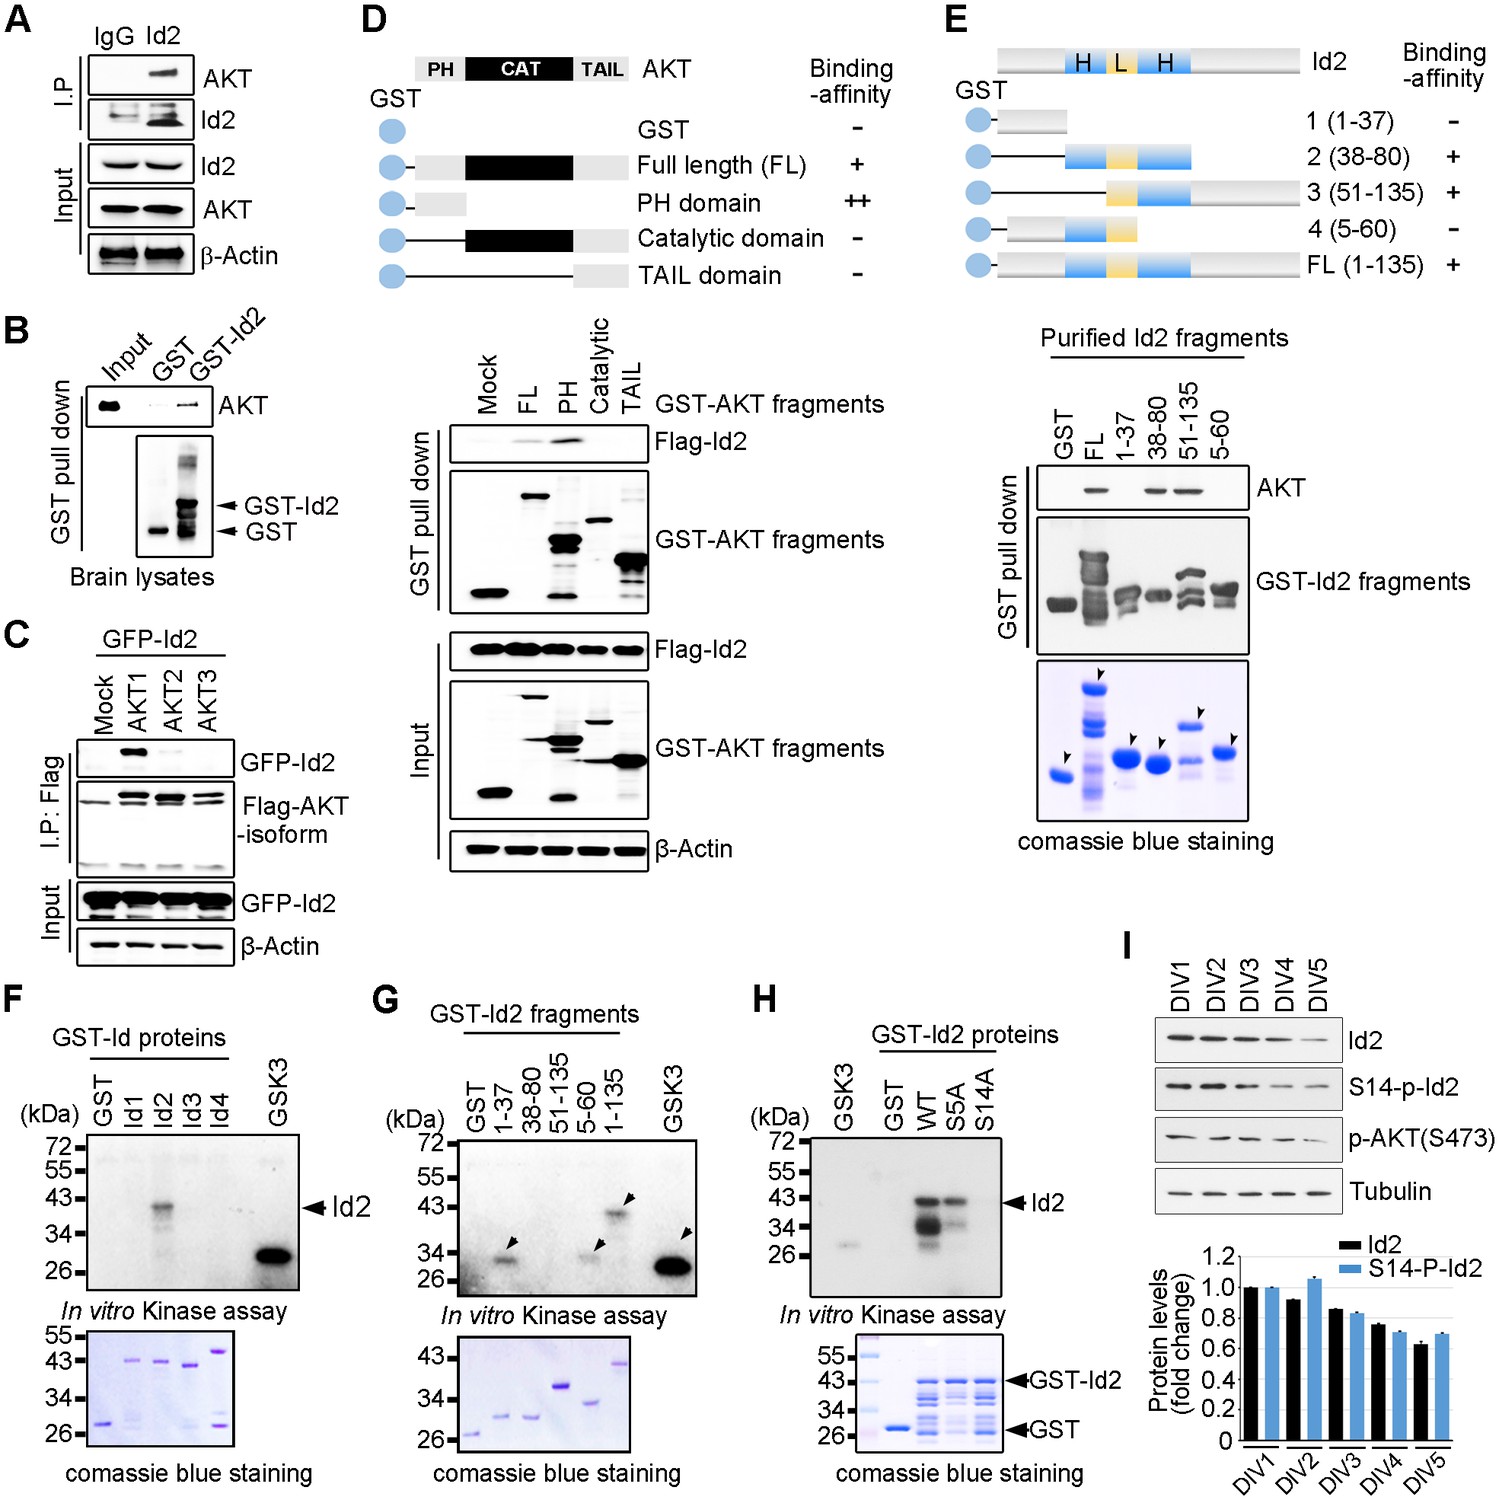
Akt binds to Id2 and phosphorylates Serine 14.
(A) Mouse brain lysates were subjected to immunoprecipitation (IP)/immunoblotting (IB) with the indicated antibodies. (B) GST pull-down assays with purified GST-Id2 protein and P1 mouse brain lysates. (C) Flag-Akt1, 2, or three wee transfected into HEK293T cells together with GFP-Id2, and lysates were subjected to anti-Flag IP followed by IB as indicated. (D) Schematic diagram of the Akt fragments (upper). Flag-Id2 was co-transfected with mammalian GST-Akt fragments into 293T cells and lysates were subjected to GST pull-down assay and IB as indicated (bottom). (E) Schematic diagram of the Id2 fragments (upper). Purified GST-Id2 fragment proteins were pre-bound to GST-resin and reacted with lysate from PC12 cells followed by IB (bottom). Arrows indicate purified Id2 fragments protein. (F–H) In vitro Akt kinase assay was performed with purified GST-proteins and purified active Akt. GSK3β fusion and GST proteins were used as positive and negative controls, respectively. Arrows indicate purified Id2 fragments protein or phosphorylated GST-Id2 fragments proteins (E–G). (I) IB of DIV1-5 cortical neuron lysates probed on the indicated antibodies. Densitometry analysis of IB is shown in the bottom. Data are representative of at least three independent experiments. See also Figure 1—figure supplements 1 and 2.
Figure 1—figure supplement 1
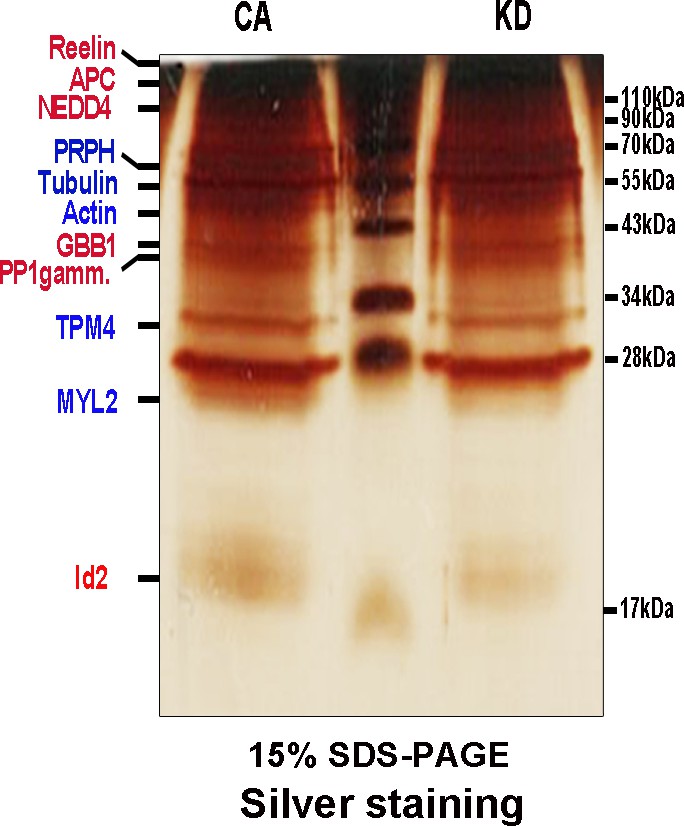
AKT interacts with Id2.
Lysate of PC12 cells stably transfected with myc-tagged a constitutively active (CA) form or a kinase-dead (KD) form of Akt were subject to immunoprecipitation with anti-myc antibody and silver staining. Several visible bands were applied for mass spectrometry analysis. Red color indicates proteins that were found as putative binding partners of CA-AKT. Blue color indicates proteins that were found as putative binding partners of both CA-AKT and KD-AKT.
Figure 1—figure supplement 2
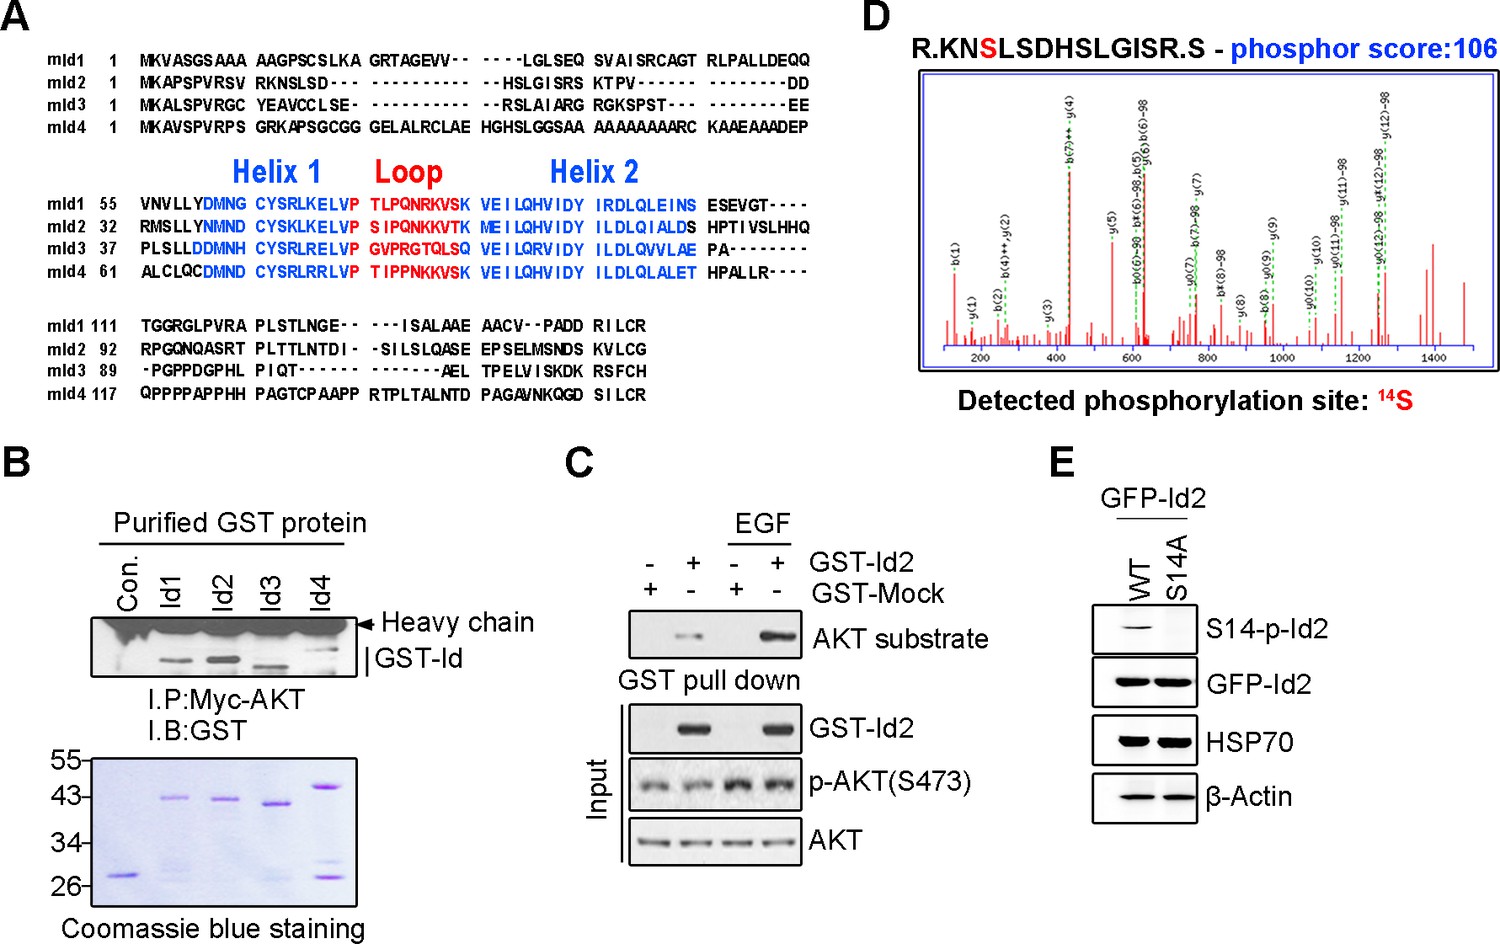
Akt binds to Id2 and phosphorylates Serine 14 on Id2.
(A) Comparison of the mouse Id1, Id2, Id3, and Id4 proteins demonstrate significant homology. Id proteins contain a helix-loop-helix domain but lack the basic DNA-binding region. (B) Id 1–4 proteins interact with Akt. PC12 cells were transfected with myc-Akt. The cell lysates were incubated with purified GST-Id proteins and GST-beads and incubated for 3 hr at 4°C with gentle agitation. (C) Id2 is a novel substrate of Akt. 293T cells were transfected with GST-Id2. 24 hr after transfection, cells were serum starved for 12 hr and treated with or without EGF for 5 min. The cell lysates were subjected to GST pull-down assay. (D) Akt phosphorylates serine 14 of Id2. Recombinant active Akt was incubated with 1 µg purified GST-Id2 protein in kinase buffer. The phosphorylation of the site was determined by MS/MS spectra after analysis of gel slices by nano LC–ESI Q-TOF MS. Detection of phosphorylation site service was provided by AMT (Advanced Mass Technology, Daejeon, Republic of Korea). (E) PC12 cells were transfected with GFP-Id2 WT or GFP-Id2 S14A. The cell lysates were subjected to immunoblotting with antibodies as indicated. b-Actin was used as an internal control. Immunoblotting images shown here is representative from at least three independent experiments.
Figure 2 with 1 supplement
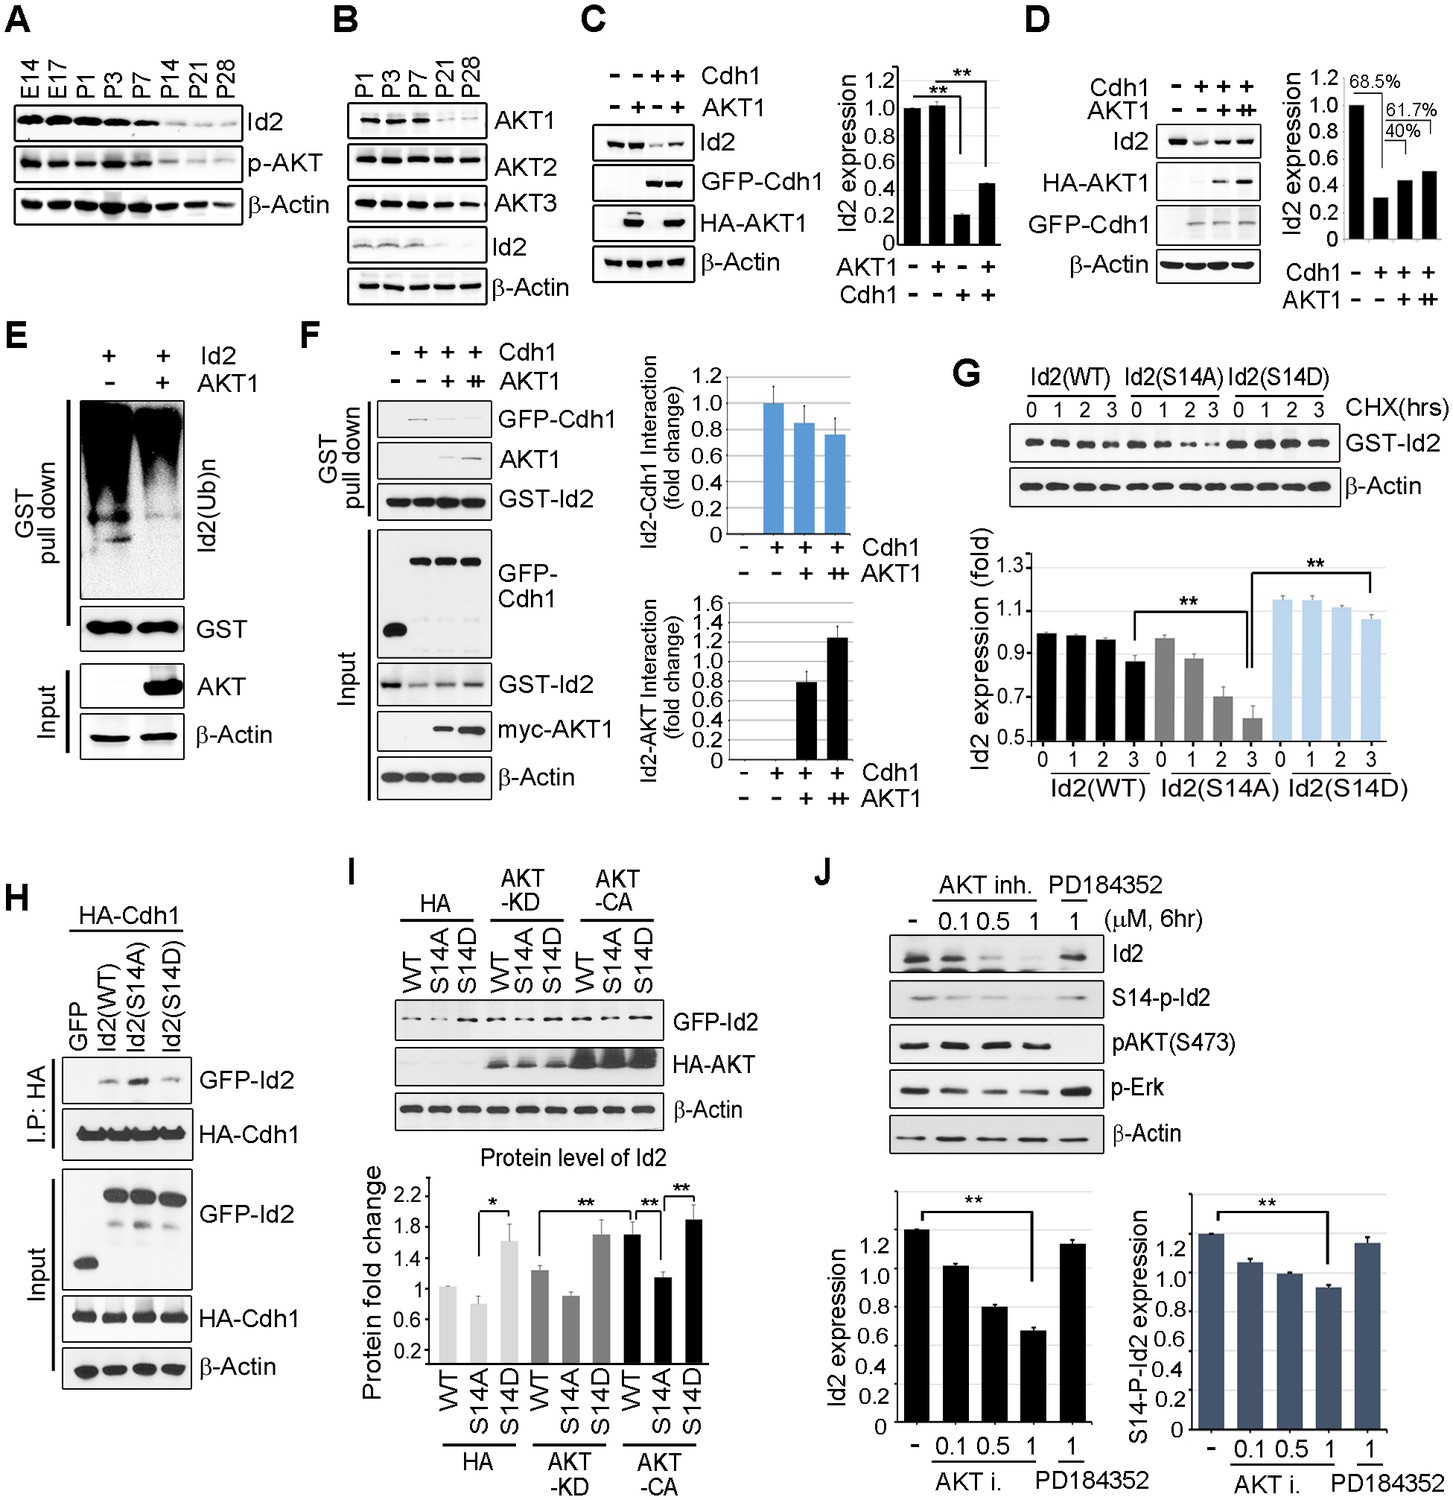
Akt controls Id2 protein stability in the neuron.
(A–B) Lysates from mouse hippocampus of the indicated days were subjected to IB with the indicated antibodies. (C) PC12 cell were transfected with the indicated combination of HA-Akt or GFP-Cdh1 and the protein level was determined by IB (left). Densitometry analysis of IB is shown on the right. (D) PC12 cells were transfected with GFP-Cdh1 together with HA-vector or HA-Akt (+: 2 μg or ++:4 μg) and probed on IB (left). Densitometry analysis of IB is shown on the right. (E) GST-Id2 was co-transfected with HA-Akt into PC12 cells. Twenty-four hours after transfection, the cells were treated with the proteasome inhibitor MG132. GST-pull down assay was performed to determine ubiqutinated Id2. (F) PC12 cells were transfected with GST-Id2, GFP-cdh1 and increasing amounts of myc-Akt (+: 2 μg/++:4 μg) and the cell lysates were subject to GST pull-down. Immunoblot is shown on the left and quantification of the interaction affinity of GFP-cdh1 and GST-Id2 by densitometry analysis is shown on the right. (G) Transfected PC12 cells were treated with cycloheximide (CHX, 10 μM) as indicated time and probed on the IB (upper). Quantification of the Id2 protein levels by densitometry analysis (bottom). (H) HA-cdh1 was co-transfected with GFP-Id2 WT or mutants into 293T cells and protein levels of Id2 was detected by anti-GFP antibody after IP with HA antibody. (I) PC12 cells were transfected with GFP-Id2 WT, S14A, or S14D with HA-Akt KD or HA-Akt CA and probed on IB (left) Quantification of protein levels is shown in the bottom. (J) PC12 cells were treated with Akt inhibitor VIII (0, 0.1, 0.5 or 1 μM) or PD184352 (1 μM). Amounts of total and phosphorylated Id2 were determined by IB. *p<0.05, **p<0.005 versus indicated (G and I). Values in this figure represent mean ± SEM from three independent experiments and image shown here is representative from at least three independent experiments. See also Figure 2—figure supplement 1.
Figure 2—figure supplement 1

Degradation of Id2 proteins by the ubiquitin-proteasome.
Id2 protein is degraded by the proteasome. PC12 cells were treated with the proteasome inhibitor MG132 for 12 hr. Id2 protein level was analyzed by immunoblotting. b-Actin was used as the internal control for protein concentration.
Figure 3 with 1 supplement

Phosphorylation of Id2 by Akt is essential for augmentation of axon growth and branching.
(A) Representative merged image of localization of endogenous Akt and Id2 in the hippocampus neurons (DIV 4). The neurons stained for Id2 (red) and Akt (green). Right panel shows a higher magnification of the region indicated by a box. Scale bar, 10 µm. Image shown here is representative from at least three independent experiments. (B–C) Cultured neurons were transfected with GFP-Id2 WT, S14A, S14D or GFP vector control at day DIV one and fixed at DIV 3. Neurons were stained with anti-Tuj1(red). Representative images with a higher magnification of the region indicated by a box are shown in (B). Quantification of axon length and branching point measurements from three independent experiments is shown in (C). n = 16–24 cells. Error bars, SEM; Scale bar, 50 µm or 10 µm. *p<0.05 versus indicated. Arrows indicate axonal tip and branch points (A–B). See also Figure 3—figure supplement 1.
Figure 3—figure supplement 1
Phosphorylation of Id2 by Akt is essential for augmentation of axon growth and branching.
Rat E18 hippocampal neurons were plated onto pre-coated coverslips. The neurons were fixed with 4% paraformaldehyde at the indicated time points and permeabilized and blocked. Neurons were incubated with anti-Id2 antibody. An Alexa fluor-594 goat anti-rabbit was used as secondary antibody. Akt staining using an anti-Akt antibody is shown in green. Nuclei were counterstained with Hoechst. Scale bar, 50 µm. White arrows indicate axonal tip and branch points.
Figure 4 with 2 supplements
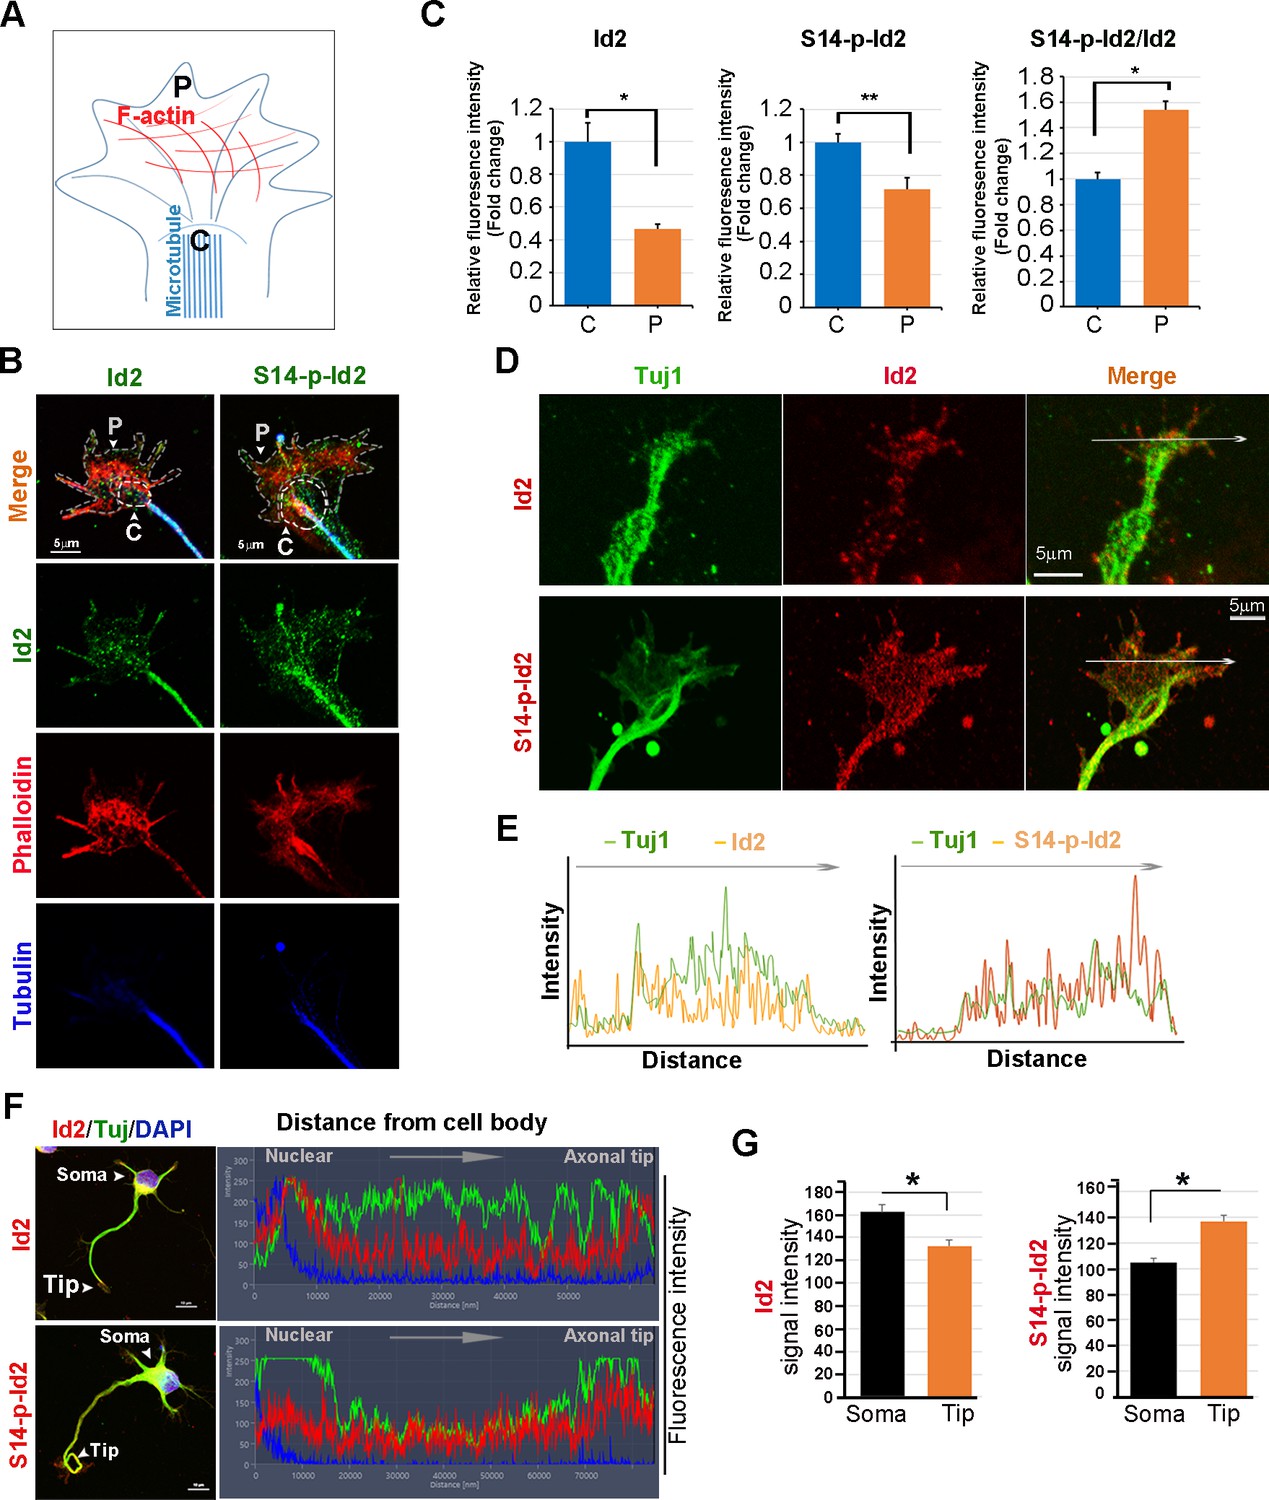
Akt regulates growth cone localization of Id2 in the developing neuron.
(A) Schematic diagram of growth cone, showing microtubule mostly in the central [C] region and F-actin based peripheral [P]region. (B) Representative image of Id2 or S14-phospho-Id2 (green) with phalloidin labeled F-actin (red) and beta-tubulin (Tuj1:blue) in the growth cone of hippocampal neuron (stage3:DIV3). Arrows indicate example of [P]and [C] domain. Scale bar, 5 µm. (C) Quantification of S14-phospho-Id2/ Phalloidin or Id2/ Phalloidin at [P] and S14-phospho-Id2/Tuj1 or Id2/Tuj1 at [C] domain was averaged over multiple growth cones (right and middle). The ration of S14-phospho-Id2/Id2 at [C] and [P] was shown in left. n = 35. *p<0.05. **p<0.005. [P] or [C] domain is outlined by dashed gray or white line based on immunolabeling of phalloidin or Tuj1 in (B). (D) Representative image of beta-tubulin (Tuj1:green) with Id2 or S14-phospho-Id2 (red) in DIV2 neuron. Scale bar, 5 µm. The fluorescent image of DIV 1–3 is shown in Figure 4—figure supplement 1A and the original image of neuron for this representative growth cone is placed in Figure 4—figure supplement 1B. (E) Graphs plot the fluorescence intensity of immunolabeled Id2 (red) and Tuj1 (green) or phosphor Id2 (red) and Tuj1 (green) the arrowed line in Figure 4D is shown in each growth cone image. (F) The hippocampal neuron was fixed and stained with anti-Id2 or S14-phospho-Id2 antibodies (red). The neuron was stained with the Tuj1 (green), and nuclei were counterstained with DAPI. Scale bar, left: 20 µm. Relative immunofluorescence intensity profiles of Id2 and Tuj1 along the axon from cell body to axonal tip (right). (G) Quantification of Id2 and S14-phospho-Id2 signal intensity in the soma or axonal tip respectively. *p<0.05 versus control.Data represent mean ± SEM of three independent experiments. n = 20. See also Figure 4—figure supplements 1 and 2.
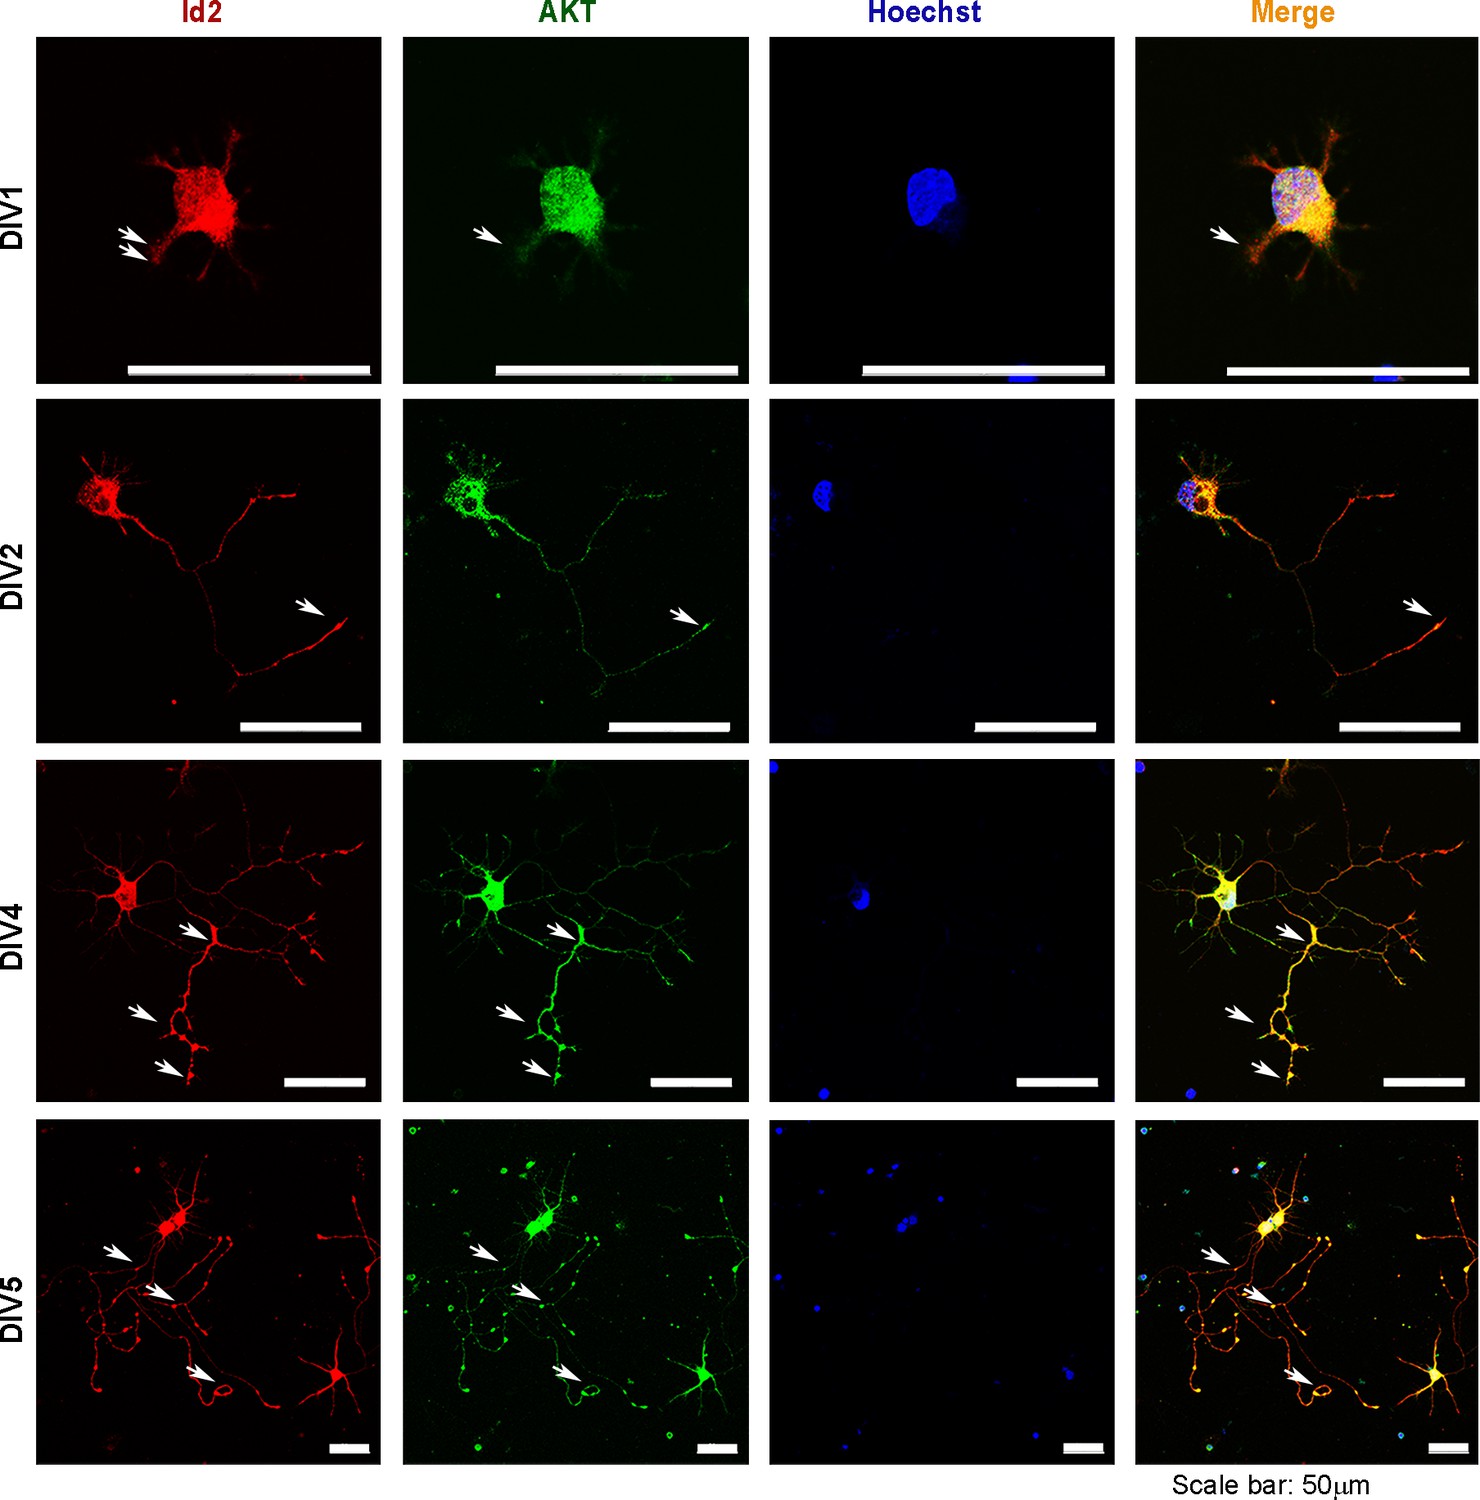
Figure 4—figure supplement 1

Id2 and S14-phospho-Id2 localized in the axonal growth cone of developing neuron.
(A) Fluorescent image of beta-tubulin (Tuj1:green) with Id2 or S14-phospho-Id2 (red) in DIV1-3 neurons. Scale bar, 20 µm. Enlargement of boxed area is in the bottom of each DIV images. Scale bar, 5 µm. (B) Signal intensity of Id2 or S14-phospho-Id2 with Tuj1 in the axonal growth cone of DIV2 neuron (DIV2 from Figure A). Scale bar, 20 µm. Enlargement of growth cone image is shown in Figure 4D. Image shown here is representative from at least three independent experiments. .
Figure 4—figure supplement 2
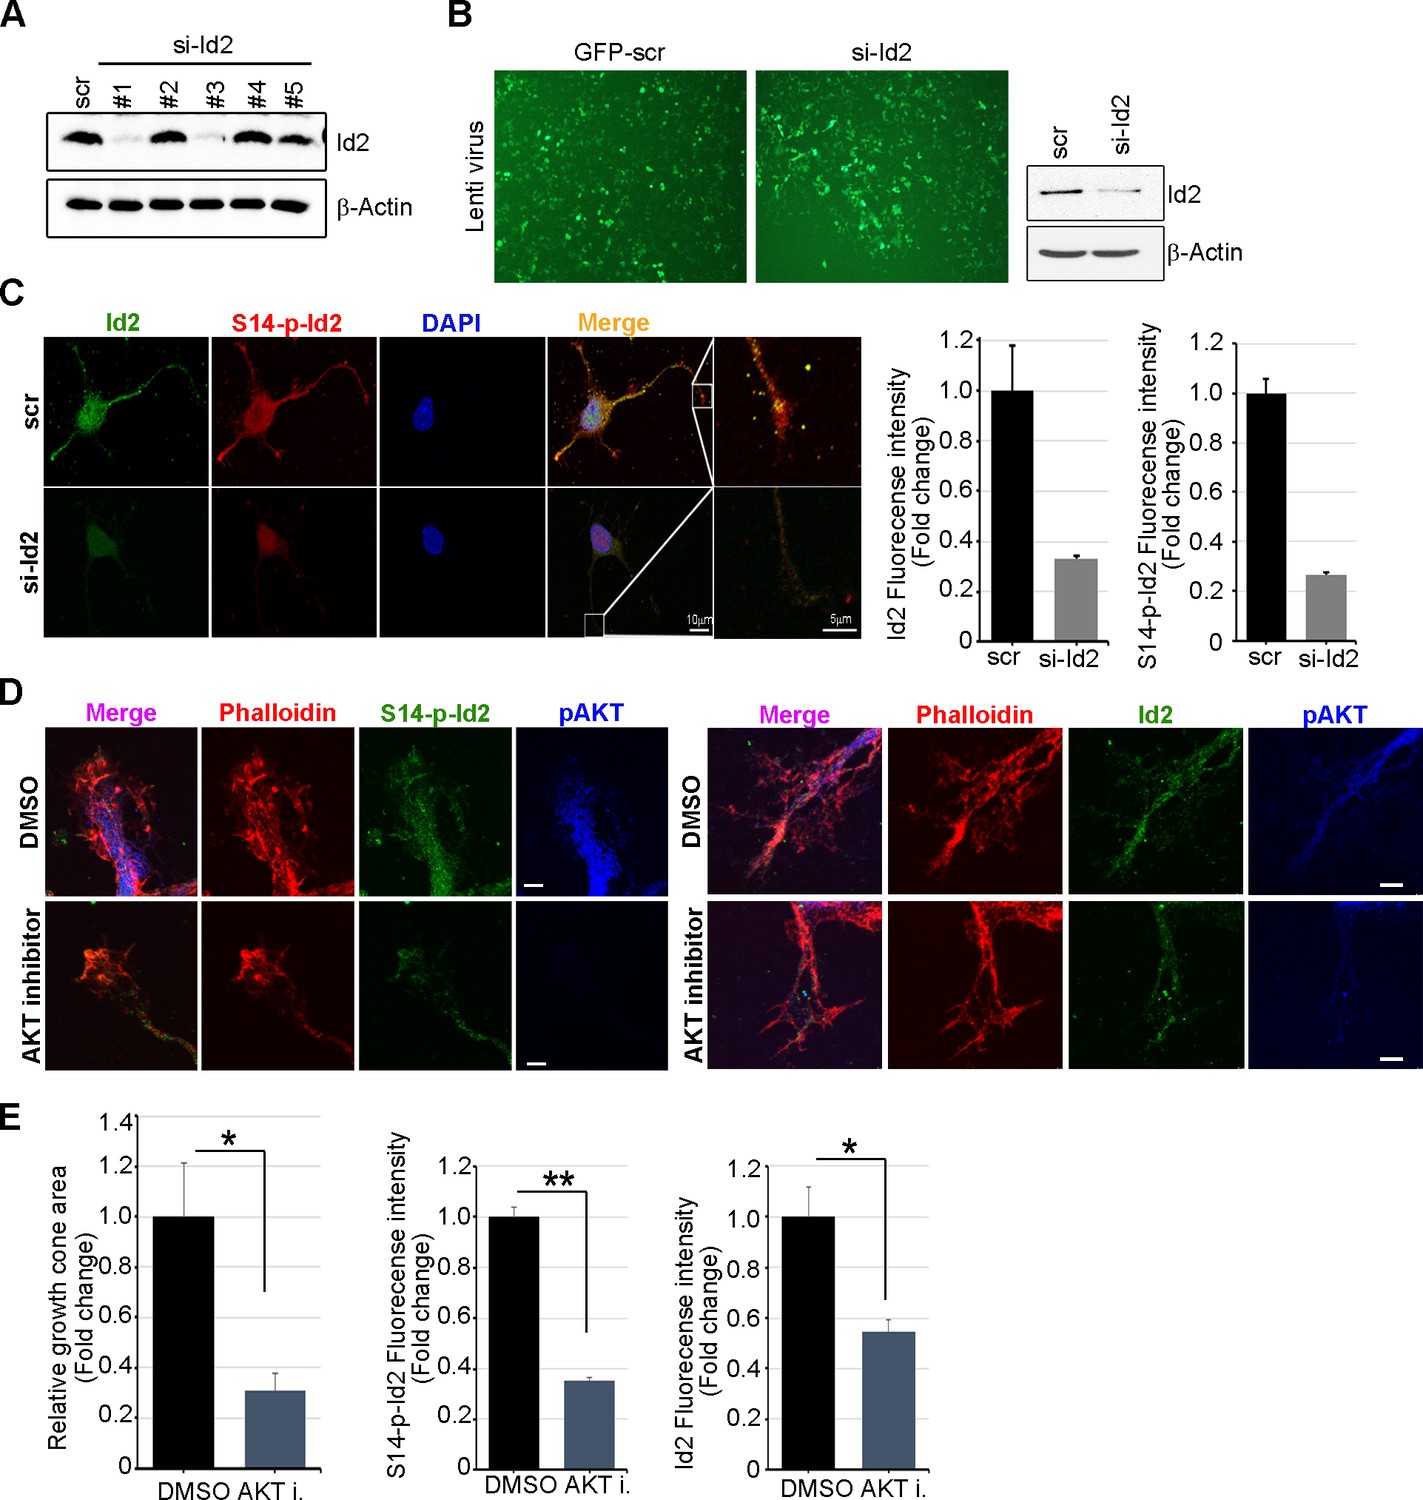
Knockdown of Id2 or inhibition of Akt impairs Id2 phosphorylation and its roles in the growth cone.
(A) PC12 cells were transfected with several si-RNA for Id2. 24 hr after transfection, Id2 protein level was analyzed by immunoblotting. (B) Cells were infected with purified lenti-GFP or si-Id2-GFP viruses (left). Id2 protein level was analyzed by immunoblotting (right). (C) S14-p-Id2 (red) or Id2 (green) signal was determined in hippocampal neurons after depletion of endogenous Id2. Scale bar, 10 µm. Enlargement of boxed area is in fifth panel. Scale bar, 5 µm. Quantification analysis was shown on the right. (D and E) Hippocampal neurons were treated with DMSO or AKT inhibitor for 4 hr. Enlargement of boxed area is in right. Scale bar, 5 µm. (E) Bar graph shows growth cone area in the axon and relative Id2 or S14-phospho-Id2 signal in the growth cone (n = 13–17). Error bars, SEM; *p<0.05 **p<0.005 versus DMSO treated cell. Scale bar, 5 µm.
Figure 5 with 1 supplement
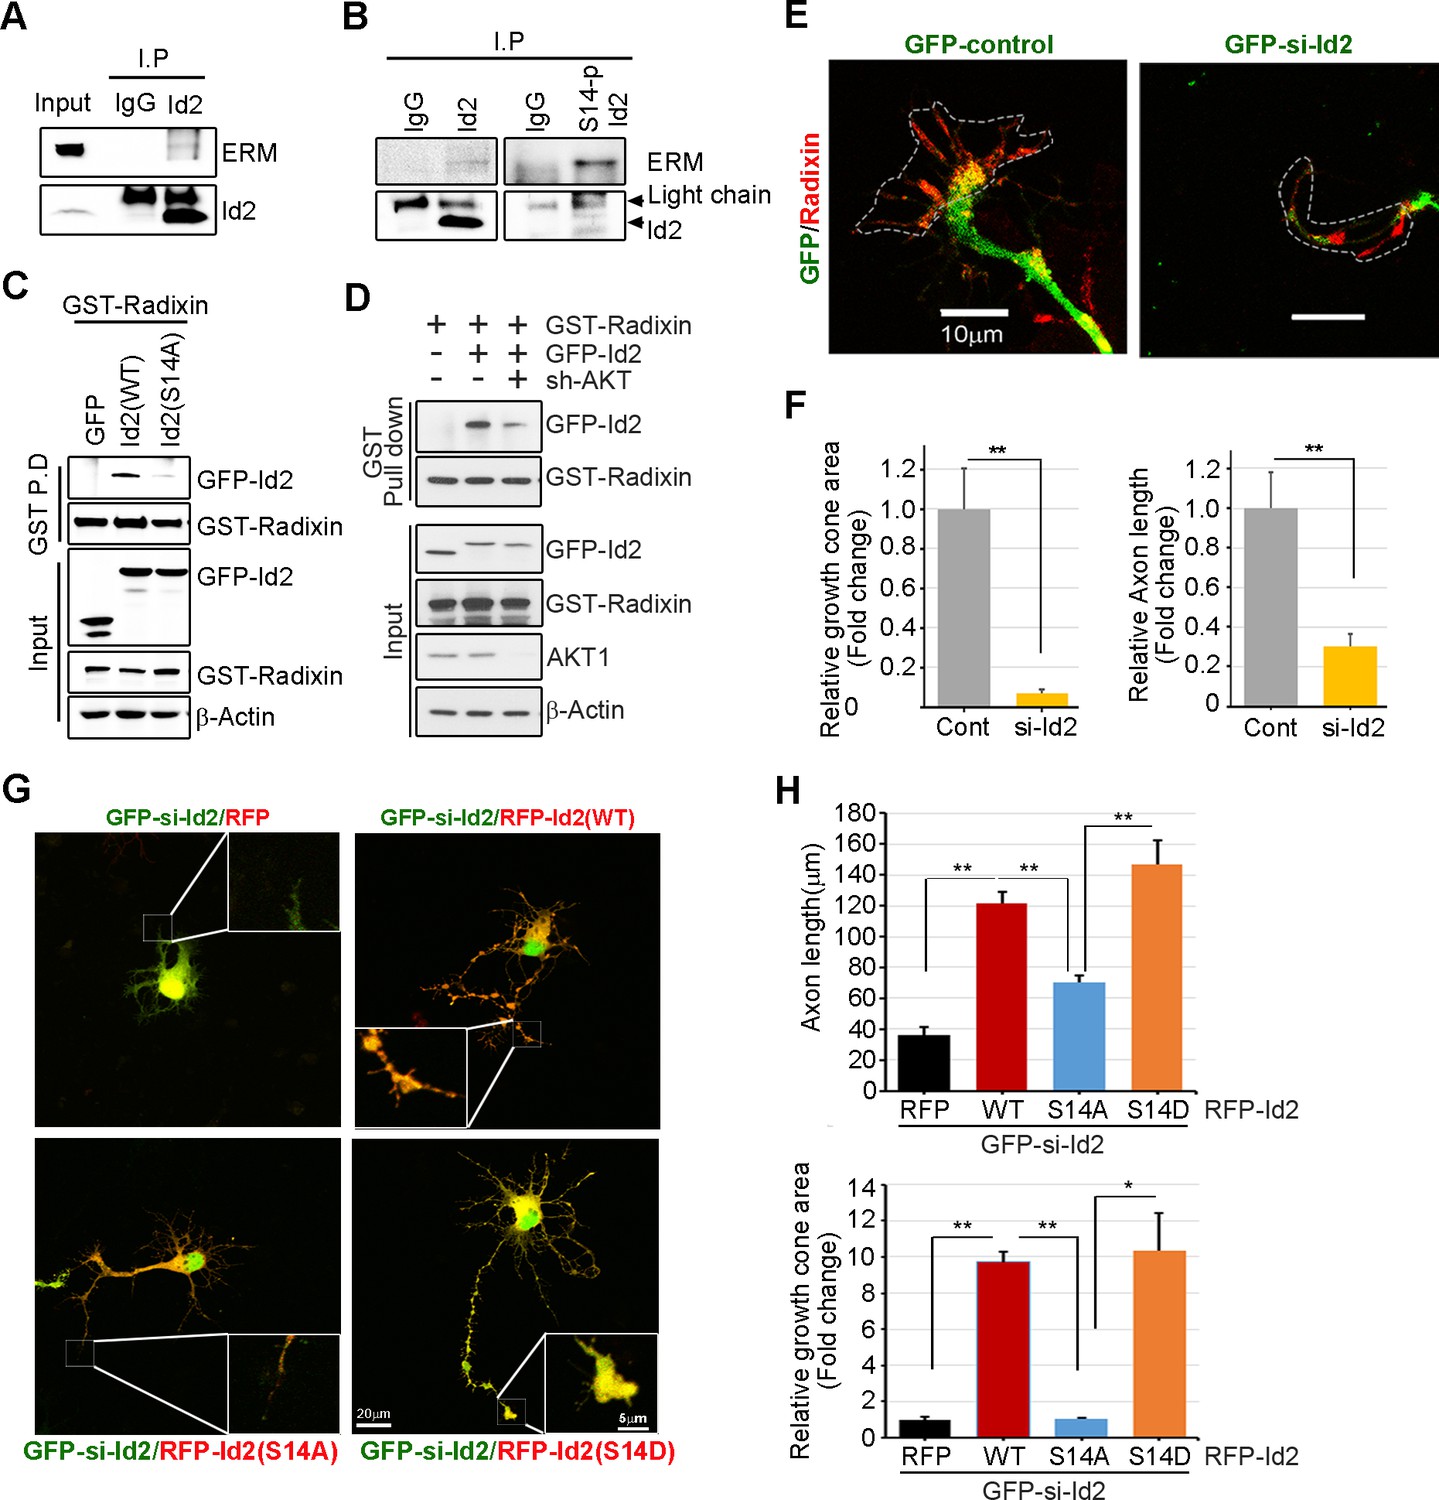
Akt/Id2 signaling promotes axon growth by regulating growth cone development.
(A–B) E18 mouse brain lysates were subject to IP with anti-Id2 or anti-S14-phospho-antibody, followed by IB with anti-ERM antibody. (C–D) GST pull-down assay using cell lysates of PC12 cells transfected with indicated constructs following by IB. (E) Hippocampal neurons were infected with lenti-GFP- si-Id2 or lenti-GFP-scramble control at stage three and fixed after 48 hr. Neurons were stained with anti-radixin antibody (red). Growth cone area is outlined by dashed line based on immunolabeling of radixin. (F) Quantification of growth cone size and number of axonal length was based on radixin fluorescence from three experiments (n = 29–50). Scale bar, 10 µm. Error bars, SEM; **p<0.005 versus control. (G and H) GFP- si-Id2 was introduced to hippocampal neurons at DIV1 along with a series of RFP-Id2-WT, Id2-S14A or Id2-S14D and determined axon length and growth cone size at DIV4. Enlargement of growth cone area was shown in inserted box. (H) Quantification of axonal length and growth cone area (n = 15–21). Scale bar, 20 µm. Error bars, SEM; *p<0.05 **p<0.005. See also Figure 5—figure supplement 1.
Figure 5—figure supplement 1
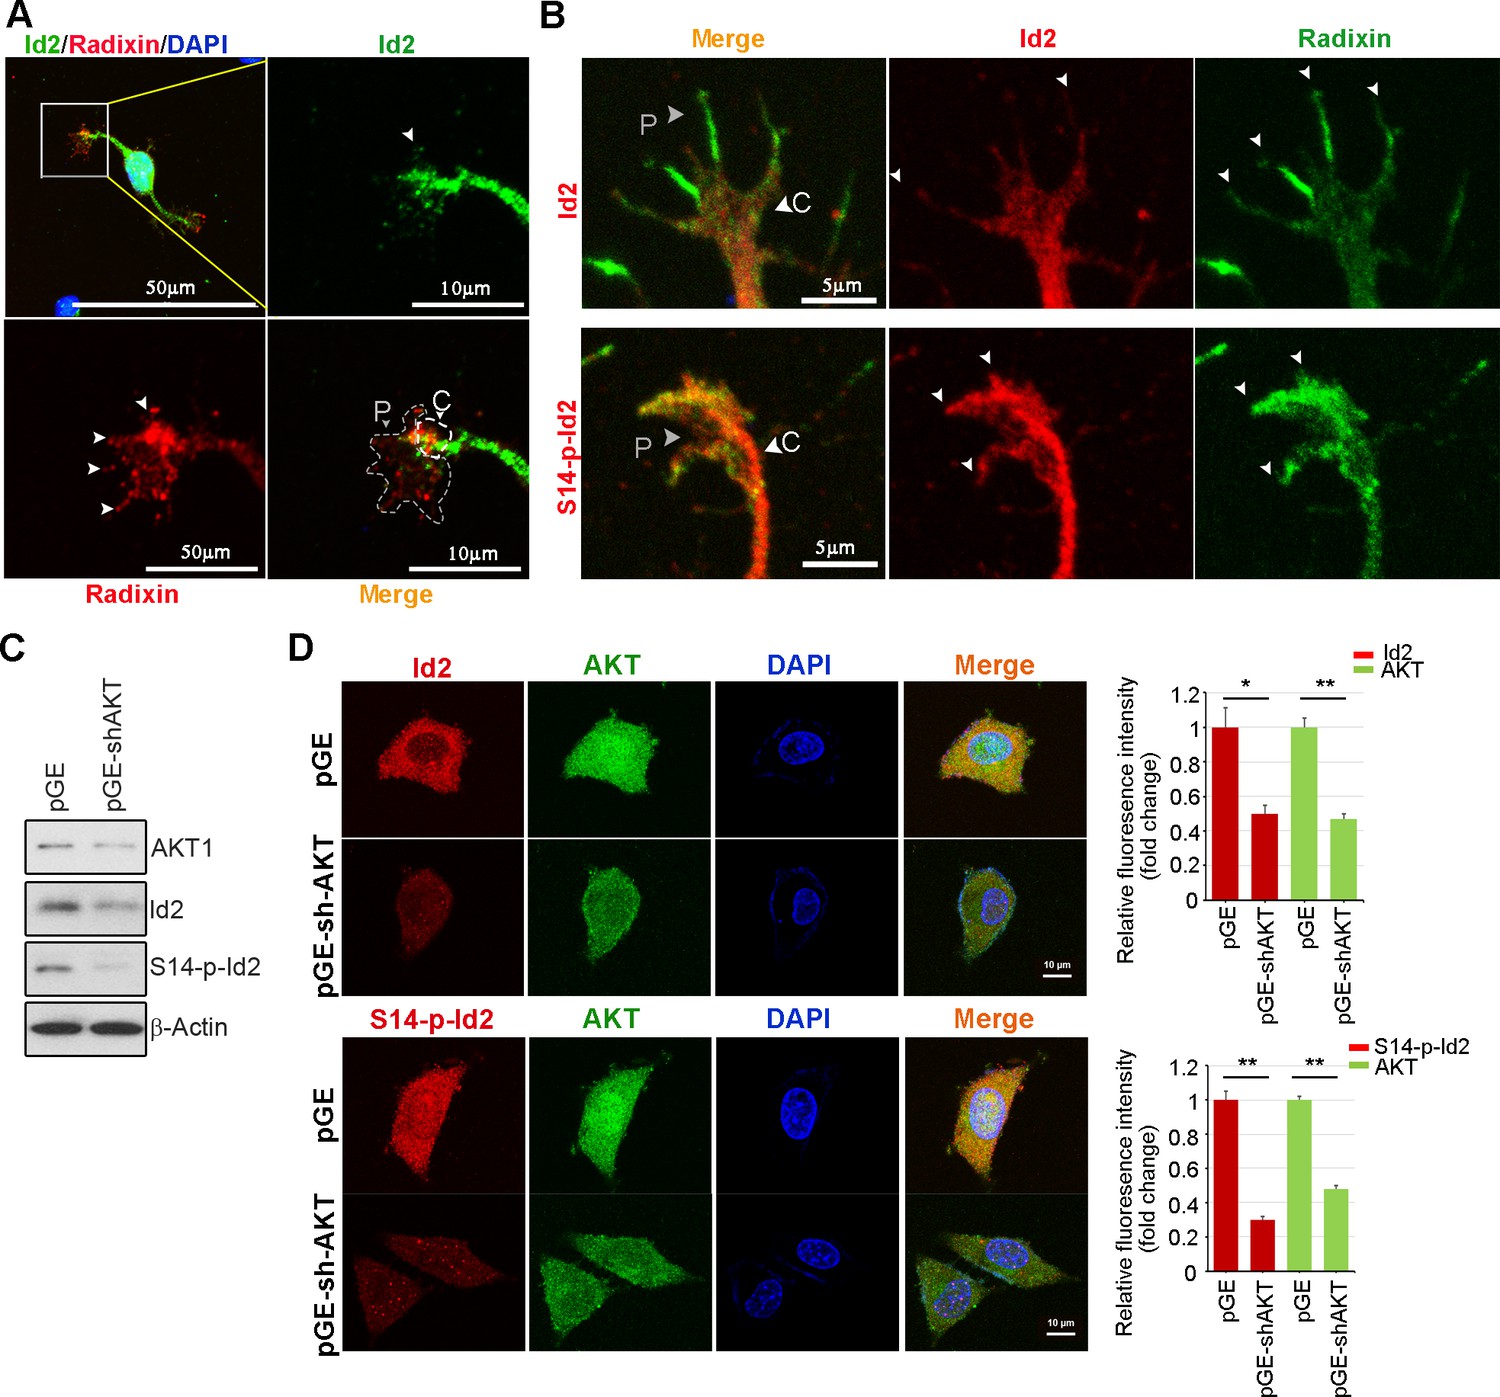
Akt/Id2 signaling promotes axon growth by regulating growth cone development.
(A) Representative merged image of co-localization of Id2 and radixin in the growing hippocampal neuron. Neurons were fixed with 4% paraformaldehyde. Hippocampal neurons were stained with anti-Id2 antibody, shown in green. Radixin was used as a growth cone marker, and nuclei were counterstained with DAPI. Scale bar, 50 µm. Enlargement of boxed area is shown. Scale bar, 10 µm. (B) Phosphorylation of Id2 colocalized with radixin in the growth cone filopodia. The hippocampal neuron was fixed and stained with anti-Id2 and S14-phospho-Id2 antibodies in the stage III (DIV3) neuron (shown in red). Neurons were stained with anti-radixin (green), and nuclei were counterstained with DAPI. Scale bar, 5 µm. Arrows indicate example of peripheral [P]and central [C] domain based on immunolabeling of radixin (A–B). (C–D) Endogenous Akt was depleted by pGE-sh-AKT in PC12 cells and determined Id2 or S14-phospho-Id2 levels. (C) Protein levels were determined by immunoblotting as indicated antibodies. (D) Immunocytochemistry was performed with anti-AKT(green) and anti-Id2 or anti-S14-P-Id2 antibody (red). Scale bar, 10 µm. *p<0.05 versus control. **p<0.005 versus control.
Figure 6 with 3 supplements
Akt/Id2 signaling is critical for the proper function of radixin in the growth cone.
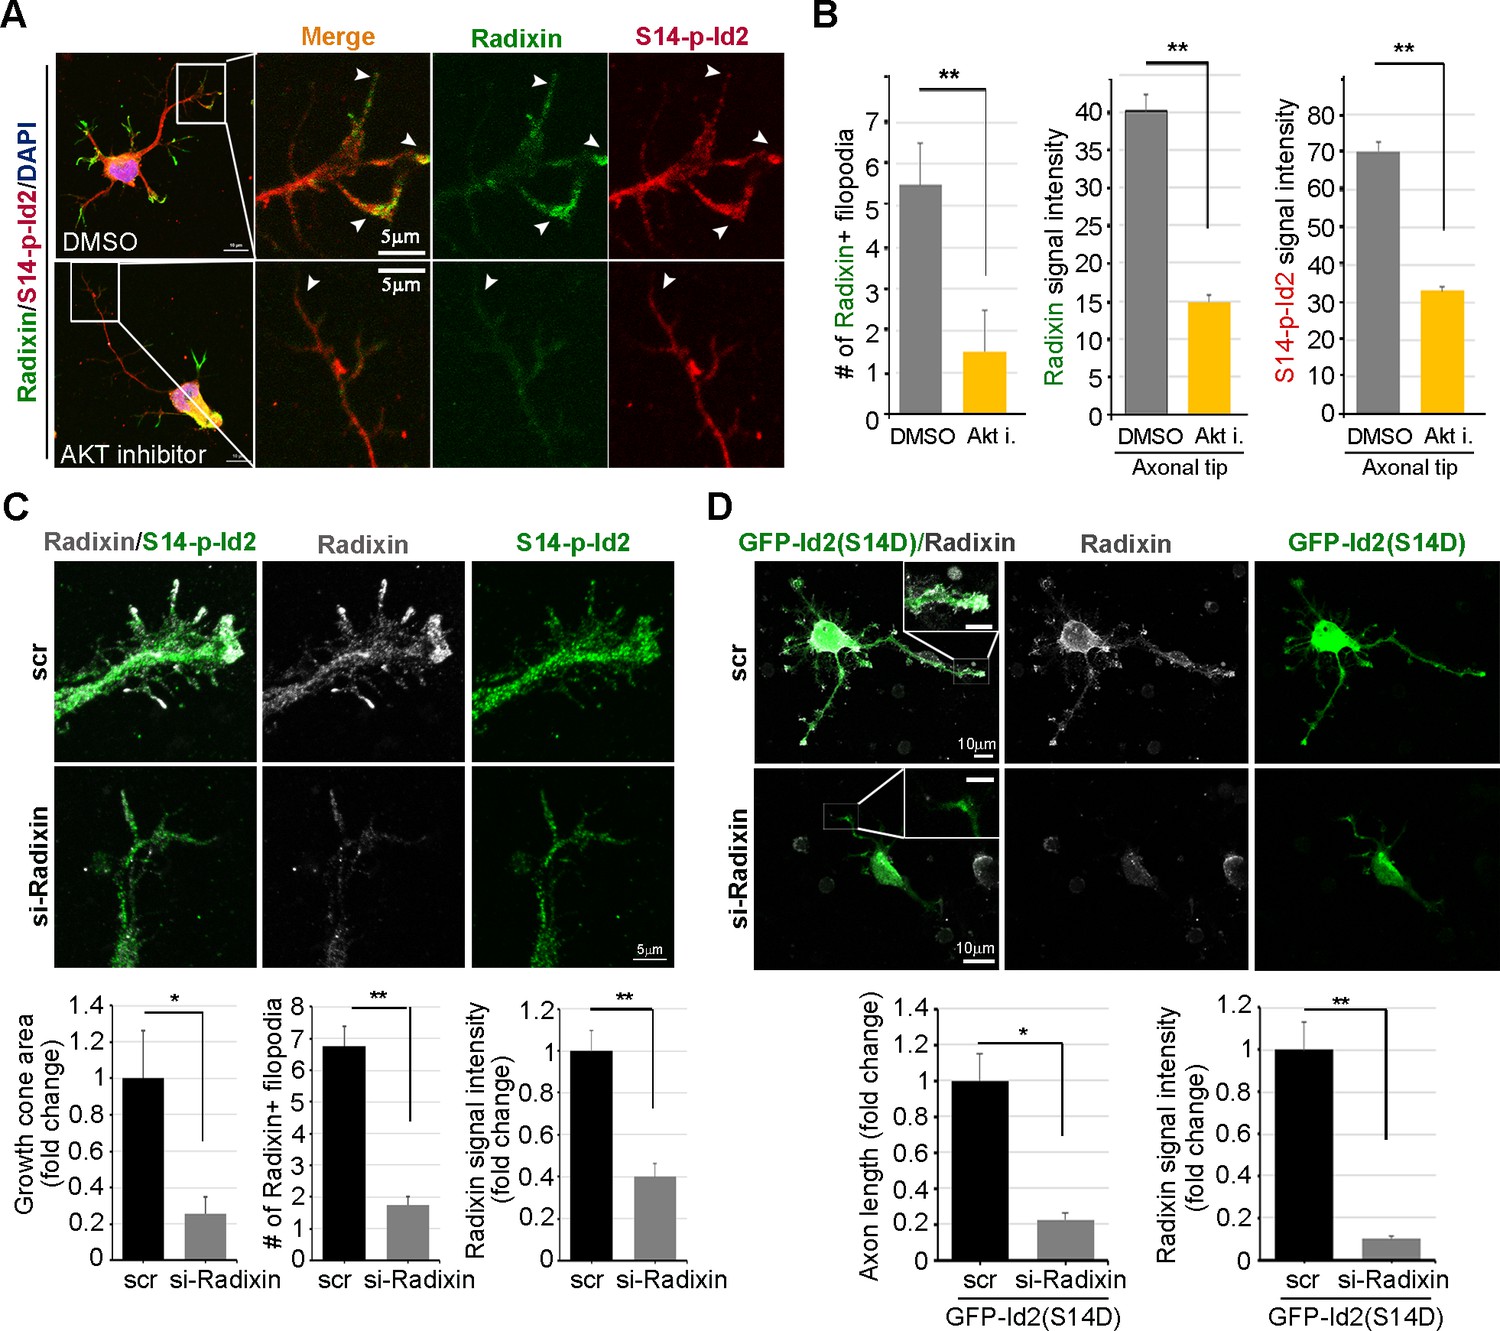
(A and B) Hippocampal neurons were treated with DMSO or AKT inhibitor for 4 hr. Enlargement of boxed area is in right. Scale bar, 50 µm or 5 µm. Arrows indicates radixin positive filopodia at the axonal tip. Bar graph shows radixin positive filopodia numbers in the axon (H, left) and relative radixin or S14-phospho-Id2 signal in the growth cone (n = 18–32) (H, middle and right). Error bars, SEM; **p<0.005 versus DMSO treated cell. (C) Hippocampal neurons were transfected with si-radixin or si-scramble control at stage three and fixed after 48 hr. Representative image (upper) and quantification of growth cone size, number of filopodia, and intensity of radixin were shown as bar graphs. scale bar, 5 µm. *p<0.05, **p<0.005 versus control. (n=15~18) (D) Hippocampal neurons were transfected with si-radixin or si-scramble and GFP-Id2 (S14D) at stage three and fixed after 48 hr. Enlargement of growth cone was shown in inserted box and bar graphs show axon length and radixin signal intensity. Scale bar, 10 µm. *p<0.05, **p<0.005 versus control. (n=17~20) See also Figure 6—figure supplements 1–3.
Figure 6—figure supplement 1
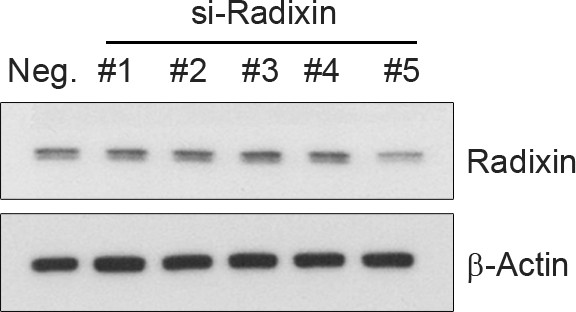
Selection of si-RNA for radixin.
PC12 cells were transfected with several si-RNA for radixin or negative control. 24 hr after transfection, radixin protein level was analyzed by immunoblotting.
Figure 6—figure supplement 2
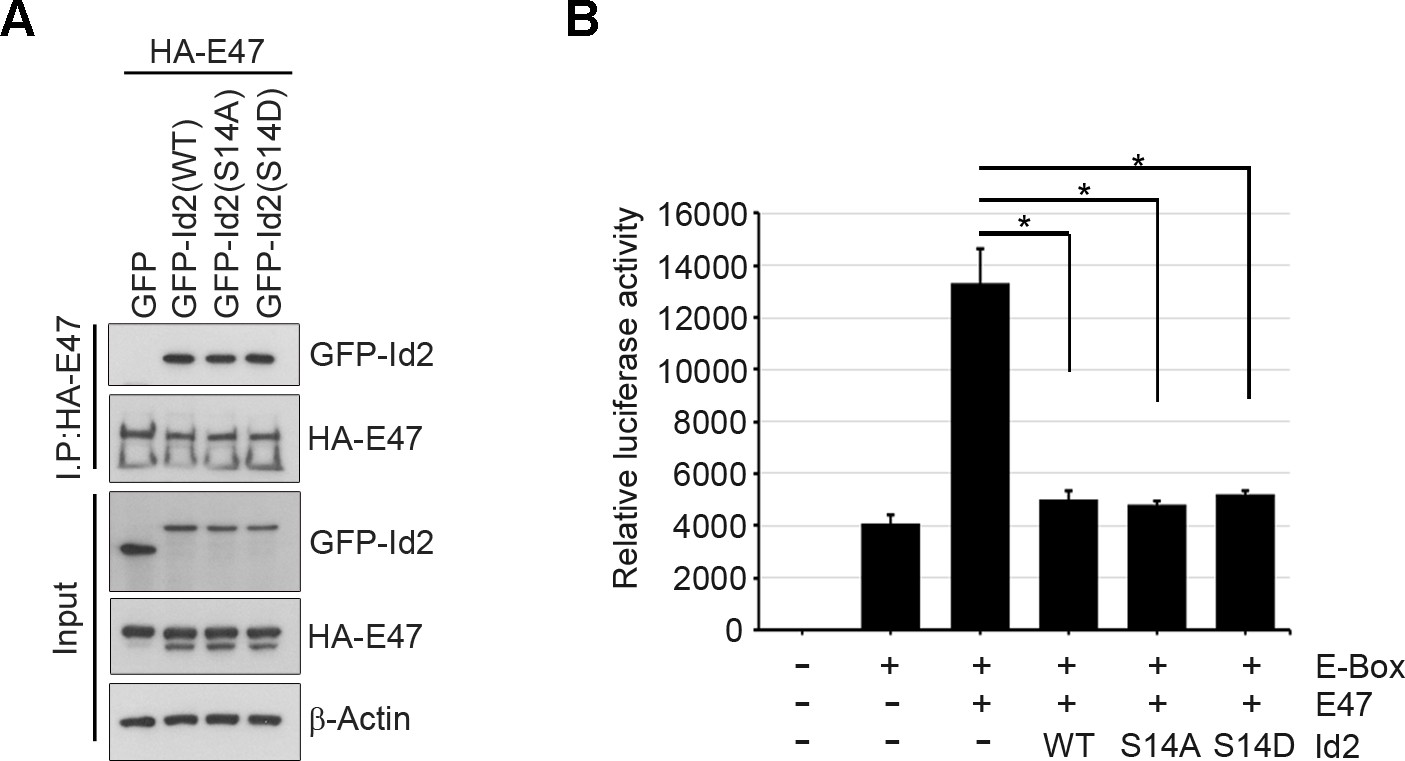
Akt-mediated S14 phosphorylation is dispensable for the transcriptional repression activity of Id2.
(A) HA-E47 was co-transfected with GFP-Id2 WT or mutants(S14D or S14A) into PC12 cells and determined the interaction between E47 and Id2 constructs as indicated after immunoprecipitation with anti-HA-antibody. (B) Luciferase reporter assay with 3xE-box-luc and E47 along with Id2 WT or mutants (S14D and S14A) transfected PC12 cells as indicated. Bar graph shows relative luciferase activity. *p<0.05 versus control.
Figure 6—figure supplement 3
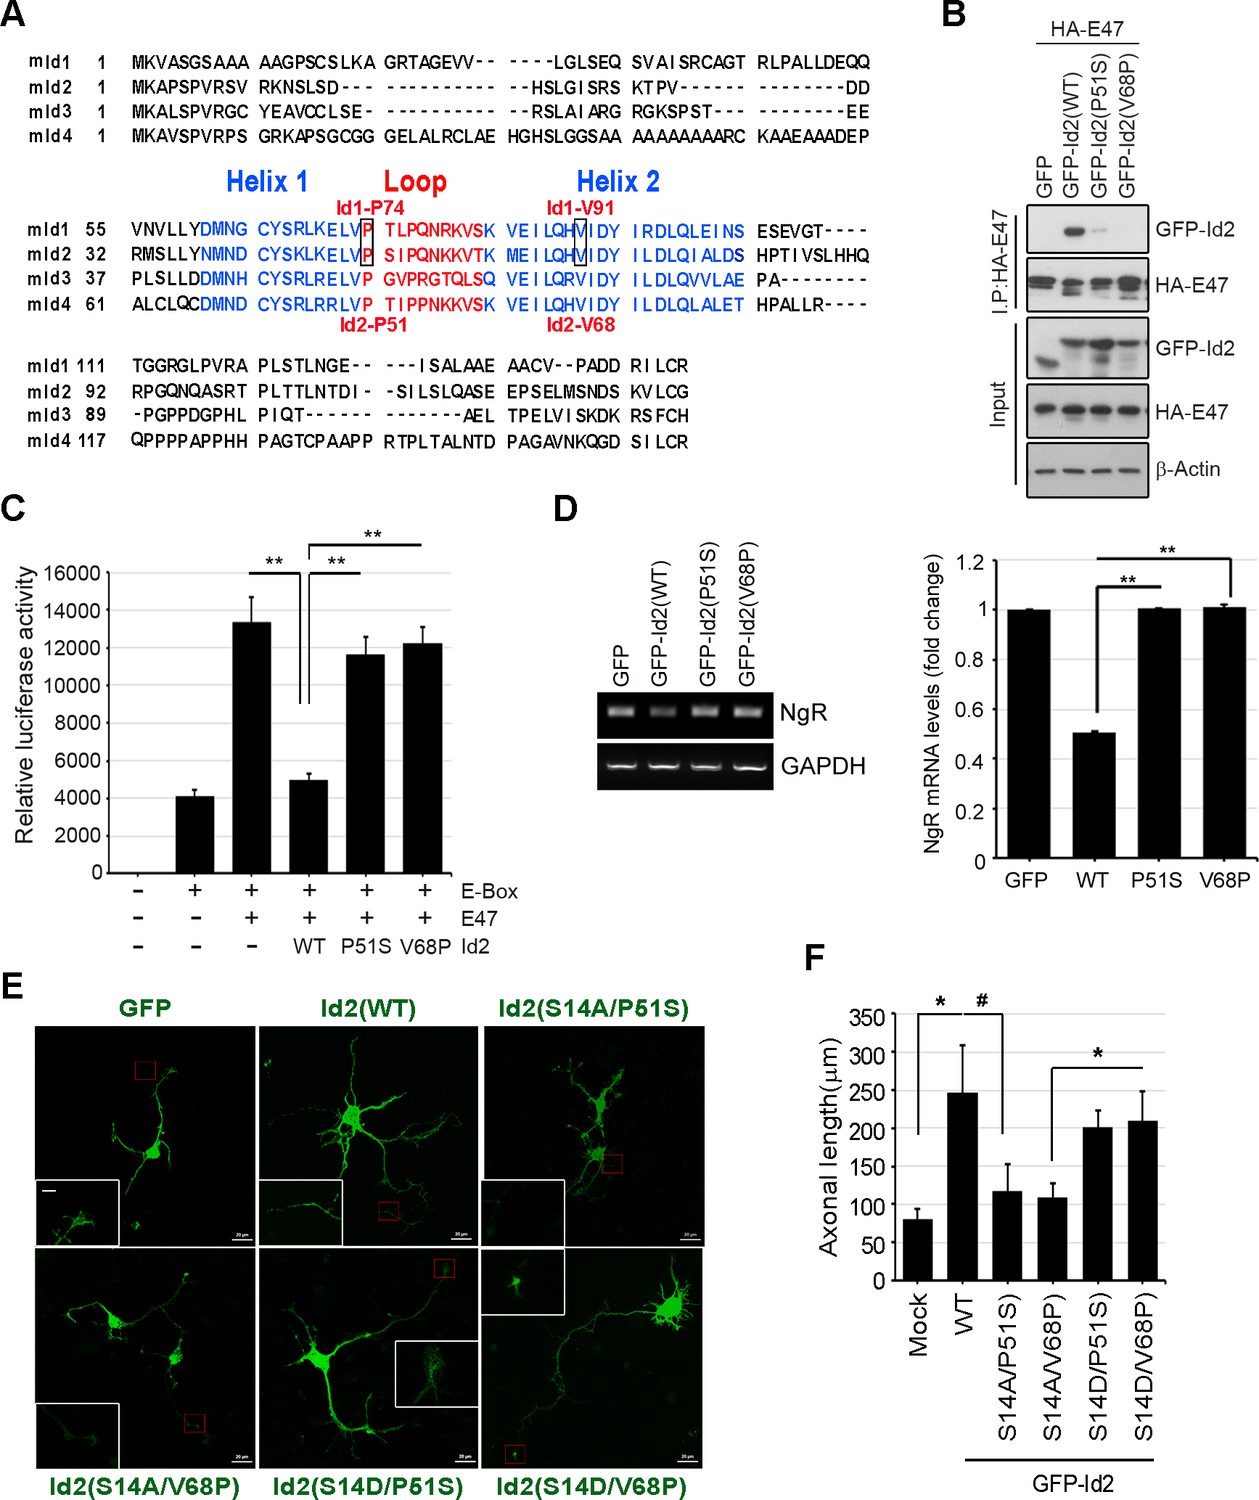
Akt-mediated S14 phosphorylation on Id2 is critical for its role in the growth cone.
(A) Alignment of HLH in the mouse Id1 and Id2 proteins. (B) The binding analysis with PC12 cells that transfected with HA-E47 and Id2 WT or HLH domain mutants (Id2-P51S and Id2-V68P) following by immunoprecipitation with anti-HA antibody. (C) Luciferase reporter assay with 3xE-box-luc and E47 along with Id2 WT or HLH domain mutants (Id2-P51S and Id2-V68P) transfected PC12 cells as indicated. **p<0.005 (D) Expression of E47 target gene, the Nogo receptor (NgR) mRNA was monitored by RT-PCR. Bar graph shows NgR mRNA levels. **p<0.005 versus Id2(WT). (E and F) Hippocampal neurons were transfected with GFP-Id2 WT or a series of mutants at DIV3 and monitored axon growth. Scale bar, 20 µm. Enlargement of red-boxed area is shown in white box. Scale bar, 5 µm. (F) Axonal length measured from hippocampal neurons transfected with Id2WT or a series of mutants of Id2 from (E) was quantified (n = 20–26). Error bars, SEM; *p<0.05, #p<0.1.
Figure 7 with 1 supplement
Akt/Id2 signaling contributes to axon regeneration in injured hippocampus slices.
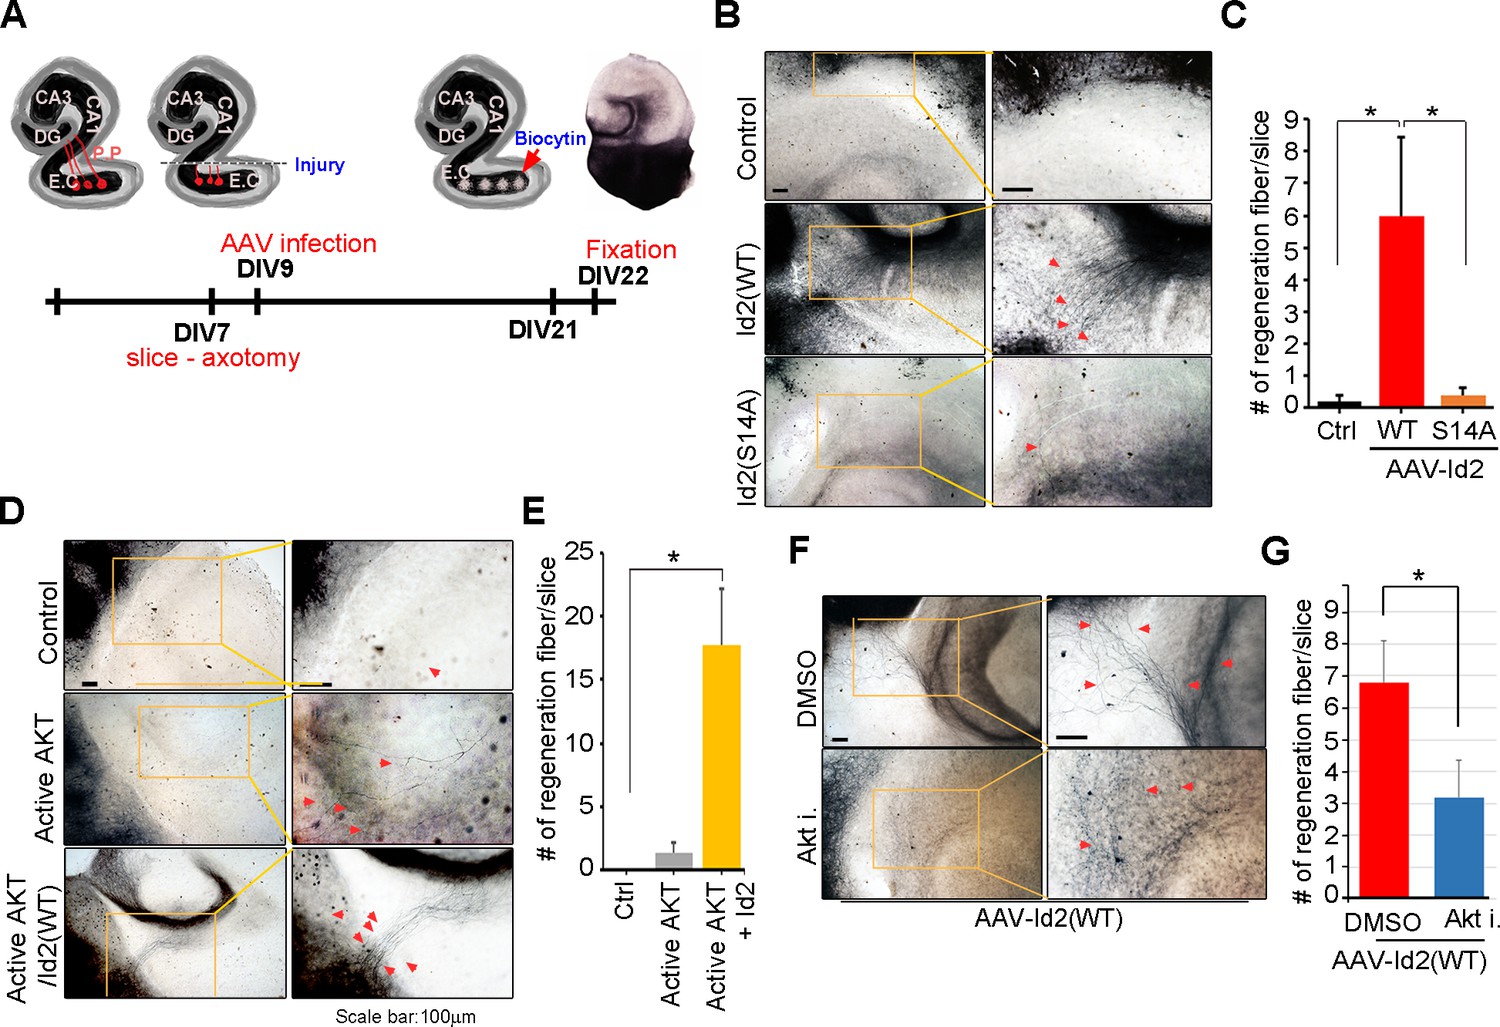
(A) Diagram illustrating experimental time course. The hippocampal slices were axotomized at the perforant path (PP) after DIV 7, and a series of AAV2- Id2 (WT, S14A, or S14D) or control with or without active Akt expressing virus, were infected on DIV 9. Slices were cultured for an additional 14 days. The anterograde axonal tracer biocytin was placed on the entorhinal cortex. Biocytin was visualized using the ABC-DAB method. (B–E) Representative images of biocytin tracing are in (B and D) and quantification for numbers of regenerating axon is in (C and E). *p<0.05. (n=36~45) Red arrows indicate the regenerated fibers. (F and G) Axotomized hippocampal slices were infected with AAV2-Id2 WT and treated with AKT inhibitor on DIV 9. Red arrows indicate the regenerated fibers. Scale bar, 100 µm. Images shown here is representative from at least three independent experiments and each value represents the mean ± SEM of triplicate measurements. *p<0.05 versus control. (n=36~42). See also Figure 7—figure supplement 1.
Figure 7—figure supplement 1
Akt/Id2 signaling contributes to axon regeneration through growth cone formation.
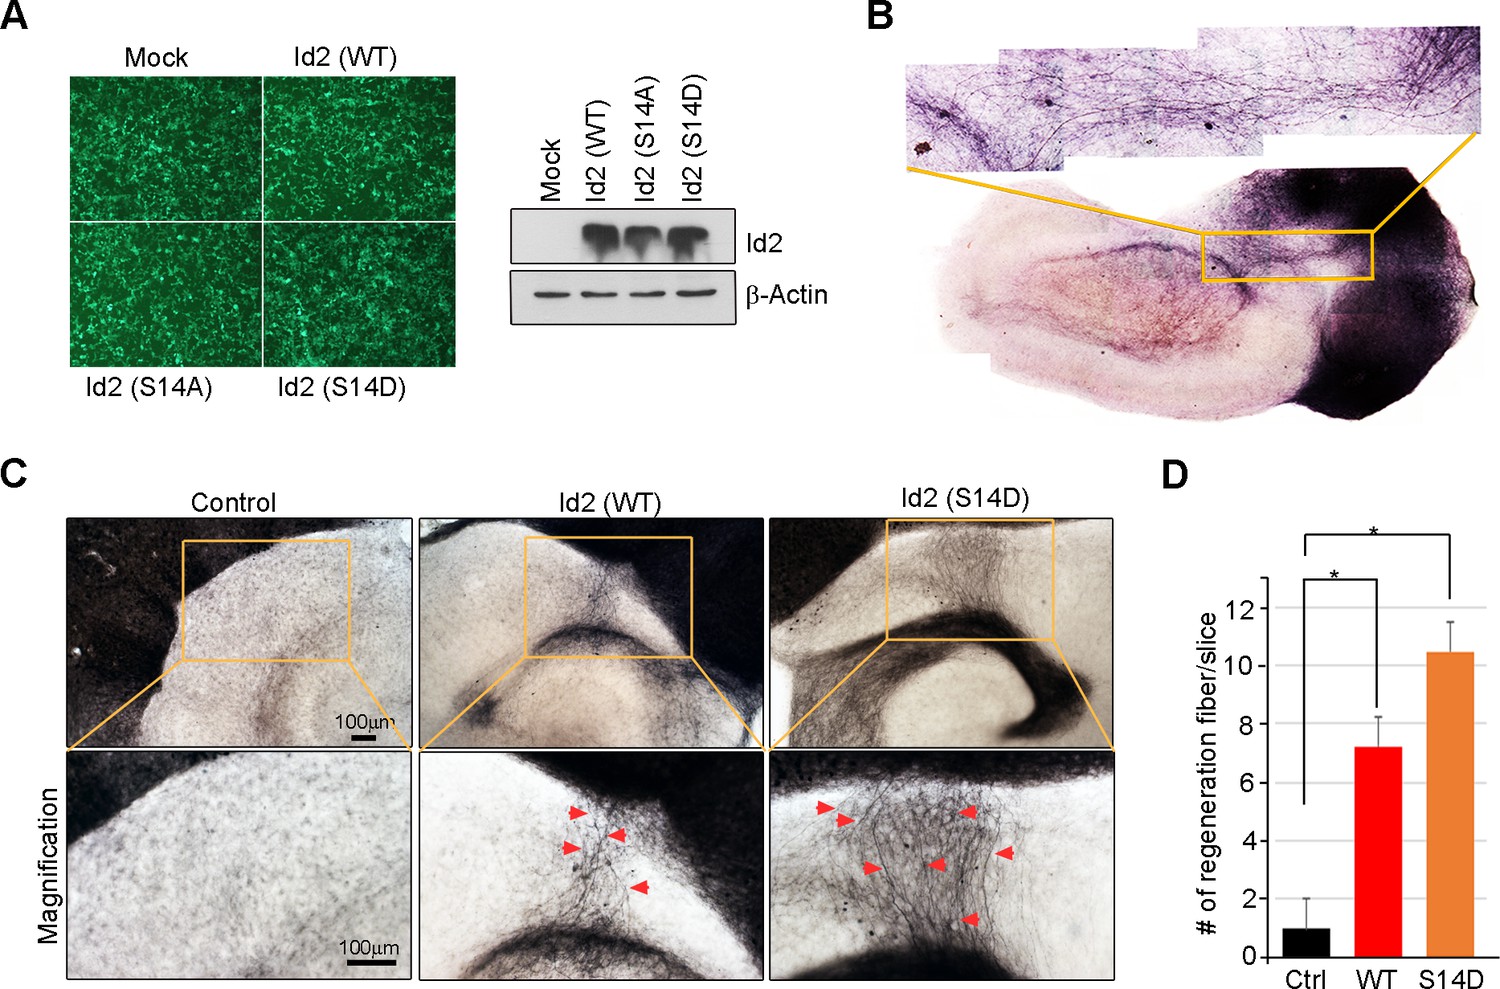
(A) 293T cells were infected with purified AAV2-GFP, Id2 WT, S14A or S14D viruses. Id2 protein level was analyzed by immunoblotting. (B) Hippocampal slice cultures were prepared from a postnatal 7-day-old mouse brain. 300-mm-thick brain slices were obtained by vibratome sectioning. The slices were transferred onto semi-porous membrane inserts. Hippocampal slices were fixed in 4% PFA at DIV 22. Biocytin was visualized using the ABC-DAB method. (C and D) The hippocampal slices were axotomized the perforant path (PP) after DIV7, and various adeno-associated viruses, Id2 WT, S14D, or control, were infected on DIV9. Slices were cultured for an additional 14 days. The anterograde axonal tracer biocytin was placed on the entorhinal cortex. Biocytin was visualized using the ABC-DAB method. Red arrows indicate the regenerated fibers. Scale bar, 100 µm. (E) Bar graph shows number of regenerated fiber measurements. *p<0.05 versus control. Images shown here is representative from at least three independent experiments and each value represents the mean ± S.E.M. of triplicate measurements.
Figure 8
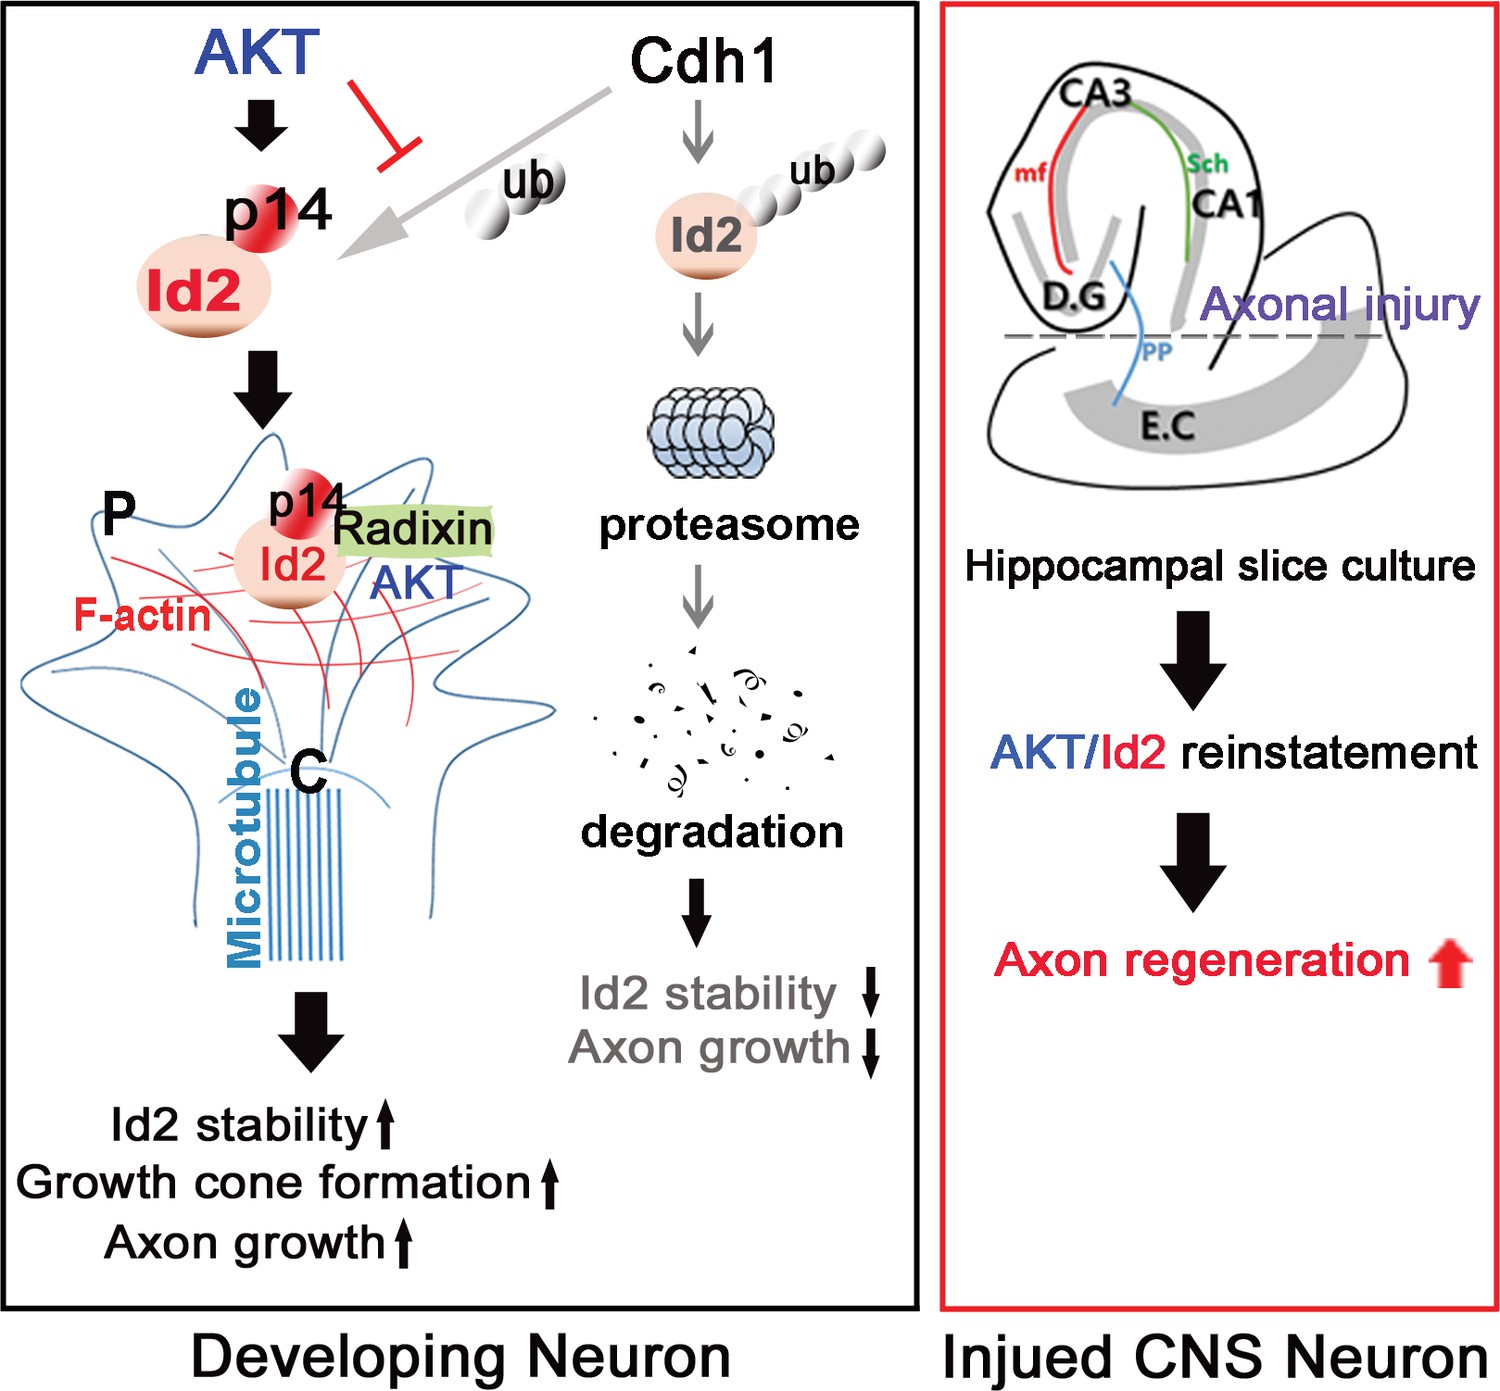
Schematic diagram of Akt/Id2 signaling pathway in the neuron.
Akt-mediated S14 phosphorylation of Id2 augments its protein stability and growth cone localization, thereby promoting growth cone formation and axon growth in the developing neuron and contributing to axon regeneration in the damaged hippocampal slice culture.
Download links
A two-part list of links to download the article, or parts of the article, in various formats.
Downloads (link to download the article as PDF)
Open citations (links to open the citations from this article in various online reference manager services)
Cite this article (links to download the citations from this article in formats compatible with various reference manager tools)
Akt1-Inhibitor of DNA binding2 is essential for growth cone formation and axon growth and promotes central nervous system axon regeneration
eLife 5:e20799.
https://doi.org/10.7554/eLife.20799


