A comprehensive excitatory input map of the striatum reveals novel functional organization
- Oregon Health and Science University, United States
Figures
Figure 1 with 4 supplements
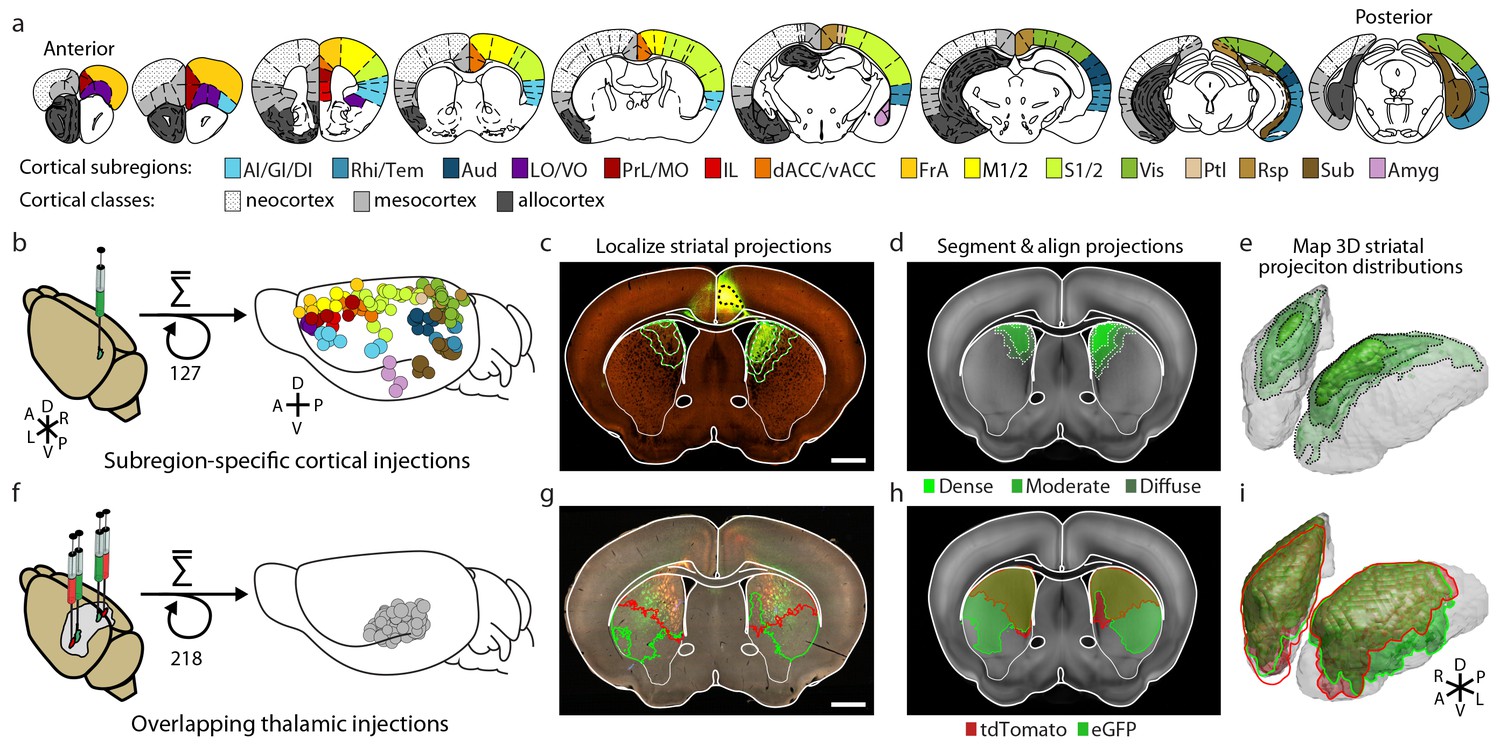
Integration of two large-scale anatomical datasets to investigate whole-brain striatal input convergence.
(a) Coronal atlas sections showing the 15 cortical subregions targeted by cortical injections (right of each section) and the cortical classes they encompass (left of each section, modified from the Paxinos Mouse Brain Atlas (PMBA) (Paxinos and Franklin, 2001). (b–e) Overview of corticostriatal connectivity data generation. (b) Unilateral injection of virus expressing eGFP (green) in the mouse cortex (left). A total of 127 injections were used to sample the entire cortex (15 cortical subregions analyzed, right) from AIBS. (c) Representative coronal section showing a cortical injection (dashed black line) and segmented striatal projections with three projection density thresholds (green lines). (d) Corticostriatal projections localized within the AIBS averaged template brain (gray). (e) An example 3D view of corticostriatal projections. (f–i) Overview of thalamostriatal connectivity data generation. (f) Bilateral injections of virus expressing tdTomato (red) and eGFP (green) in the mouse thalamus (left). A total of 218 injections were localized and aligned within an average model thalamus (Hunnicutt et al., 2014) (right). (g) Representative coronal section showing thalamostriatal projection localization in high-resolution images (red and green outlines). (h) Each striatum is aligned to the AIBS average template brain. (i) Example 3D view of thalamostriatal projections.
Figure 1—figure supplement 1
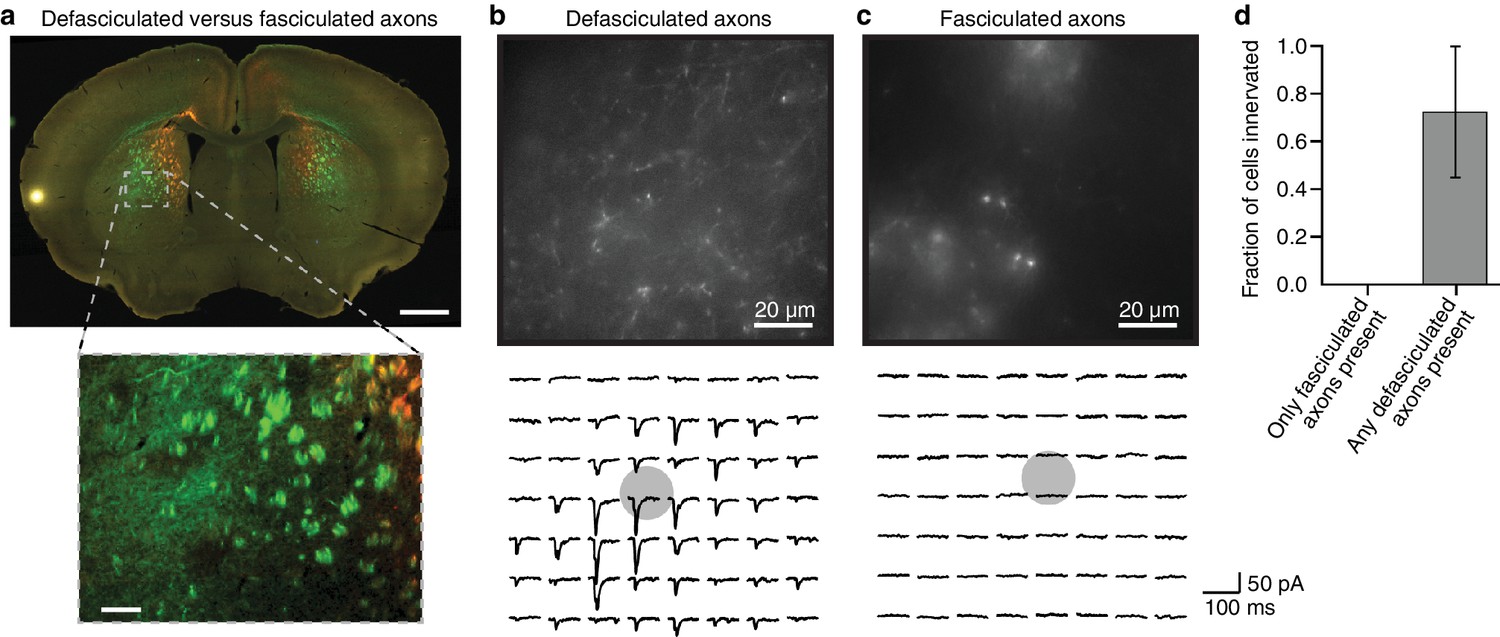
Fasciculated projection axons were excluded from striatal input maps because they do not form functional connections in the striatum.
(a) An example coronal slice (top) depicting the two primary types of fluorescently labeled thalamostriatal axons in the striatum: defasciculated and fasciculated (zoomed image, bottom). (b–c) Top: High-magnification images of striatal areas containing (b) defasciculated and (c) fasciculated thalamostriatal axons expressing fluorescently tagged Channelrhodopsin (ChR2). Bottom: Current recordings of two example neurons recorded in the field of view shown in each image for (b) defasciculated and (c) fasciculated axons, showing synaptic currents elicited by light stimulation of thalamic axons. Gray circles indicate the locations of recorded neuronal cell bodies. Each current trace corresponds to the postsynaptic responses of optogenetic activation of the ChR2-expressing thalamostriatal axons using an 8 × 7 grid, 50 µm spacing blue light (as previously described (Hunnicutt et al., 2014; Mao et al., 2011) and briefly summarized in Materials and methods for details). (d) Summary results of whole cell recordings in portions of the striatum visually determined to possess either fasciculated axons, or defasciculated axons (mean ± SD, n = 4 slices for each condition, 4–5 cells per slice), and ChR2+ thalamic axons were activated with blue light laser stimulation.
Figure 1—figure supplement 2
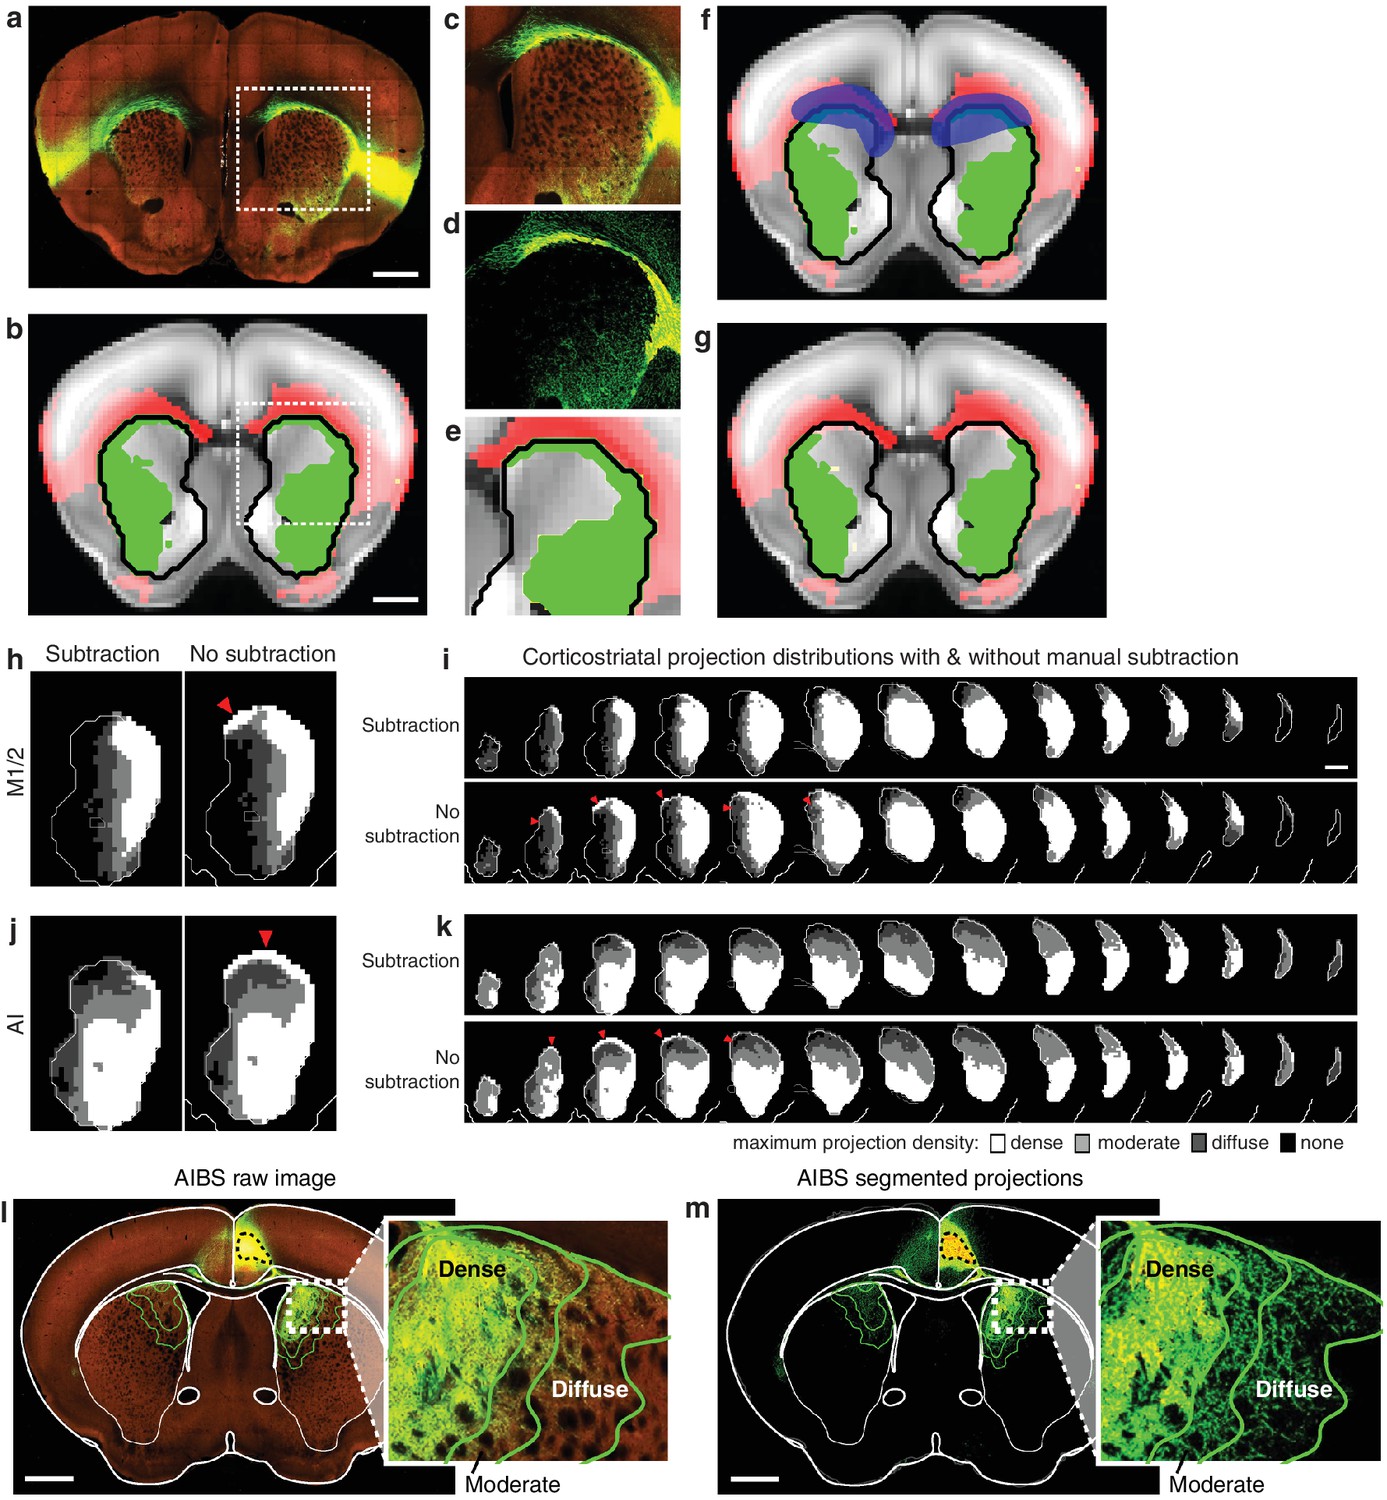
Illustration of method used to subtract traveling corticostriatal axons.
(a–g) Example of manual processing required to remove aberrantly localized projections in the striatum resulting from traveling axons. (a) Fluorescent image of a coronal section showing projections from an injection in AI. (b) The striatal projection localization resulting from the image in panel a (green), overlaid on the AIBS average template brain (gray), showing projections outside the striatum (red), and the striatum outline (black line) (c–e) Axons in the corpus callosum aberrantly localized as striatal projections. The (c) fluorescent image, (d) segmented projection image, and (e) projection mask of voxels with >5% projection density (i.e. the moderate projection threshold) for the area indicated by a dashed box in panels a and b. (f) Manual mask (blue) created to subtract aberrantly localized projections. (g) Resulting striatal projection localization after subtraction (green). (h–k) Comparison of corticostriatal projection localization before and after subtraction. Example sections and full projection distributions in the striatum from (h–i) M1/2 and (j–k) AI with and without subtraction of traveling axons. Striatal section positions are the same as Figure 2b. (l) The same coronal brain section shown in Figure 1c with a more detailed view of the striatal projections for three projection density thresholds (inset). (m) The coronal section corresponding to panel l, showing only the binary segmented projections in the striatum with the approximate outline of the dense, moderate, and diffuse projections (green lines) defined for the voxelized projection data.
Figure 1—figure supplement 3
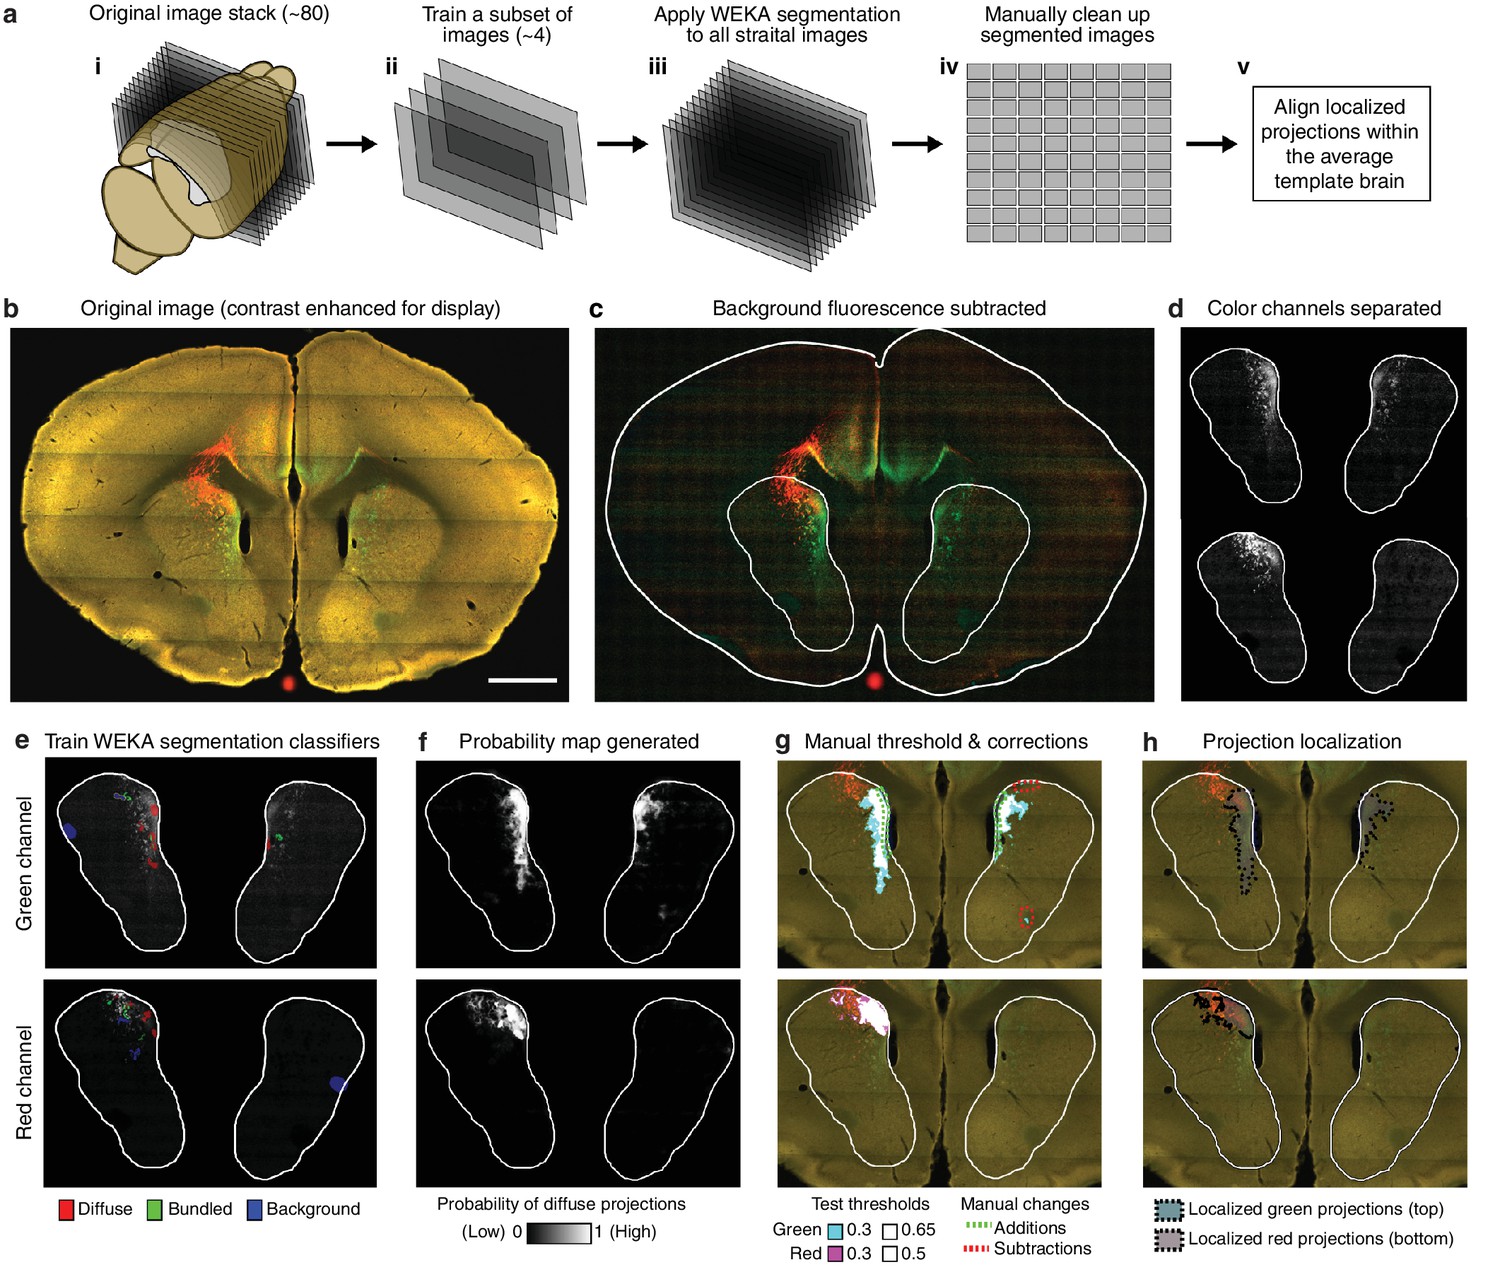
Overview of semi-automated image segmentation method for thalamostriatal projections.
(a) Schematic overview of image segmentation method, wherein: (i) all coronal sections for each experimental brain containing striatum were analyzed (~80 sections per brain), (ii) a subset of four images were selected from the full image sets to train the Advanced WEKA Image Segmentation plugin in ImageJ to identify defasciculated projections, fasciculated projections, and background fluorescence, (iii) the trained Advanced WEKA Image Segmentation plugin was applied to the remaining images, (iv) segmented images were manually corrected, and (v) localized defasciculated projections were aligned within the average template brain (see Materials and methods). (b–h) More detailed example of the method described in ii-iv of panel a. (b) A fluorescent image of a coronal section through a mouse brain with fluorescent thalamic axons in the striatum (scale bar, 1 mm). (c) Image from panel b with background fluorescence subtracted. (d) Red and green color channels of the image are separated. (e) Advanced WEKA Image Segmentation is trained to identify defasciculated projections, fasciculated projections, and background fluorescence for each color channel separately. (f) The result of the segmentation method is a probability image displaying the probability that each pixel contains defasciculated projections; white represents the highest probability of 1 (note that the bright, fasciculated red axons on the left are excluded). (g) A probability threshold is manually chosen to encompass all defasciculated projections, and minor errors in the projection localization method are corrected manually. (h) The threshold was applied to the probability map and the manual changes were incorporated to determine the full distribution of defasciculated thalamic axons in the striatum for each color.
Figure 1—figure supplement 4
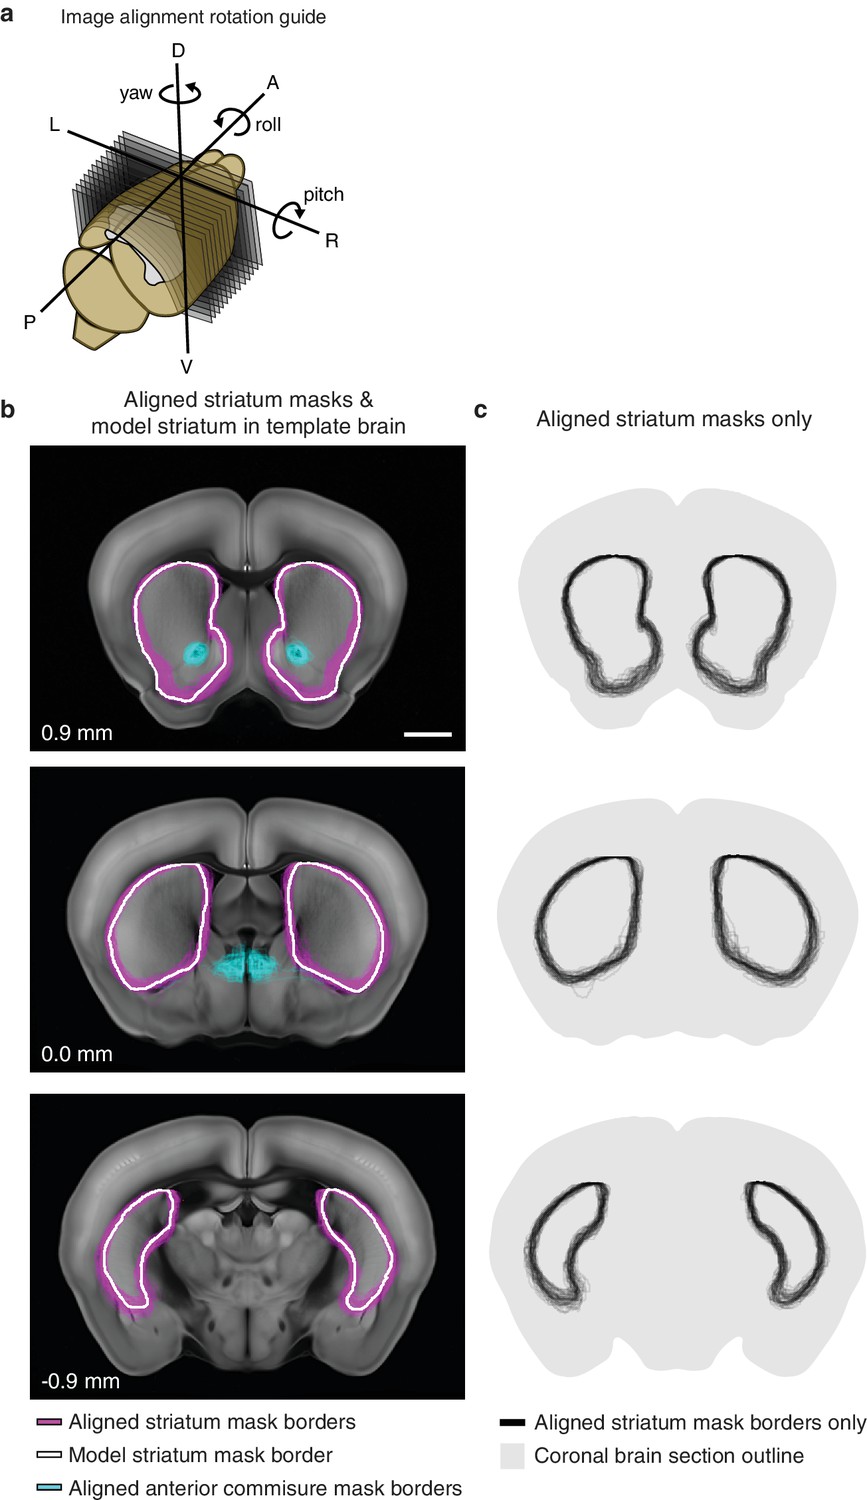
Striatum alignment for thalamic dataset.
(a) Illustration depicting the rotations to be applied to striatum masks to align each experimental striatum in the thalamic dataset to the striatum of the AIBS average template brain. (b) Example coronal sections showing the outline of each experimental striatum after alignment (magenta), the outline of the striatum in the AIBS average template brain (white), and the outline of each experimental anterior commissure (acc) after alignment. Section positions indicated in mm relative to bregma. Scale bar 1 mm. (c) Coronal sections shown in panel B, showing all experimental striatum outlines.
Figure 2 with 2 supplements
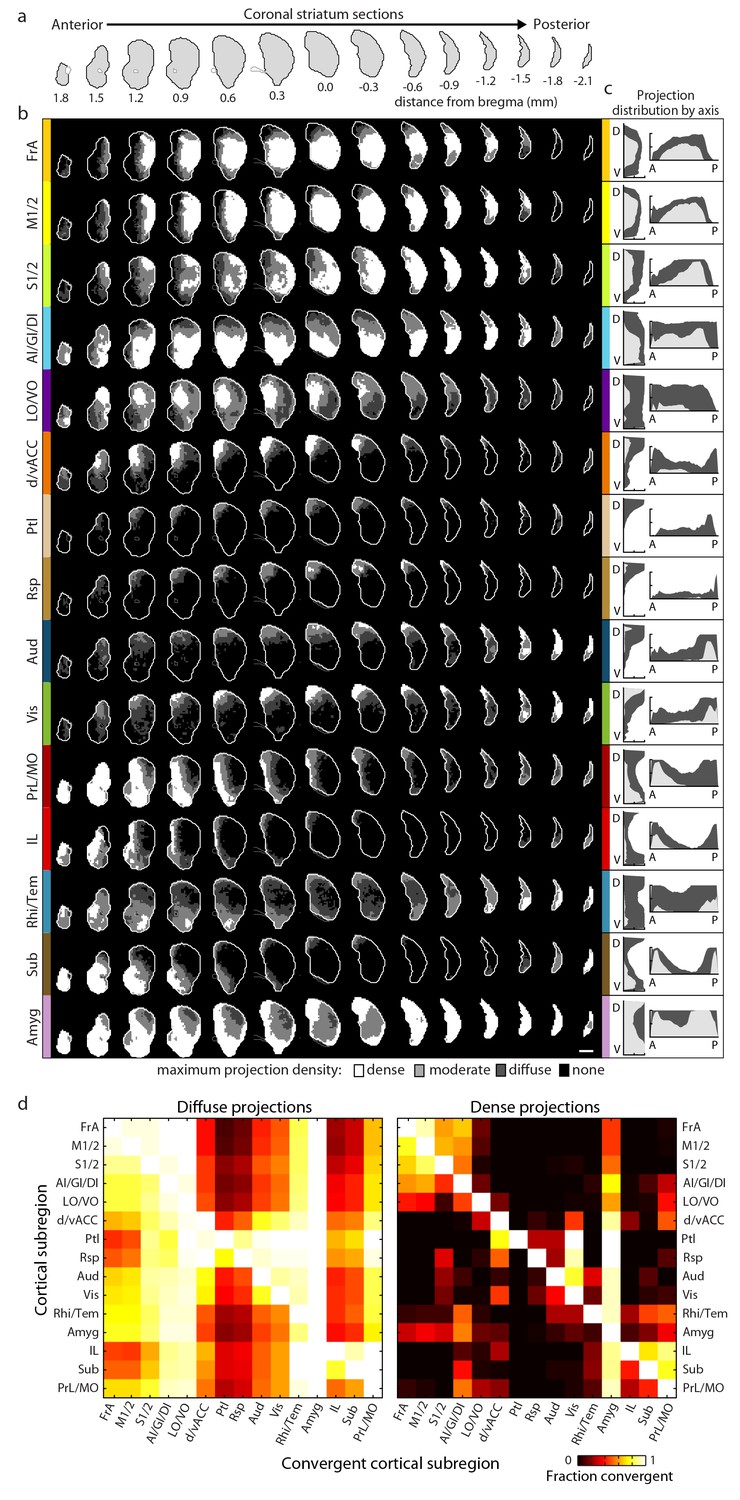
Comprehensive mapping of cortical inputs to the striatum.
(a) Coronal section outlines for one hemisphere of the striatum (starting 1.8 mm anterior to bregma and continuing posterior in 300 µm steps, AIBS atlas). (b) Striatal projection distributions for all cortical subregions (rows). The maximum projection densities (dense (white), moderate (light grey), diffuse (dark grey), or none (black)) are indicated for the sum of all injections within each cortical subregion. (c) Projection distribution plots in the dorsal-ventral (D–V) and anterior-posterior (A–P) axes for each cortical subregion shown in b. Coverage in the striatum by dense (light gray) and diffuse (dark gray) projections were calculated in 100 µm steps as the fraction of the striatum covered in each step by either dense or diffuse projections, respectively. Striatal volumes were normalized in each 100 µm step. (d) Subregion-specific convergence plots for diffuse (left panel) and dense (right panel) corticostriatal projections. The color scale indicates the fraction of the projection field from a given cortical subregion (rows) covered by the projection field from another cortical subregion (columns).
Figure 2—figure supplement 1

Cumulative corticostriatal projection distributions.
(a–b) Projection distributions in the striatum from viral injections in two example cortical subregions: (a) dv/ACC and (b) LO/VO, respectively. (c–d) The final cumulative projection distributions for (c) d/vACC and (d) LO/VO, created by maximum projection of the density at each striatal voxel from all individual injections in each cortical subregion.
Figure 2—figure supplement 2
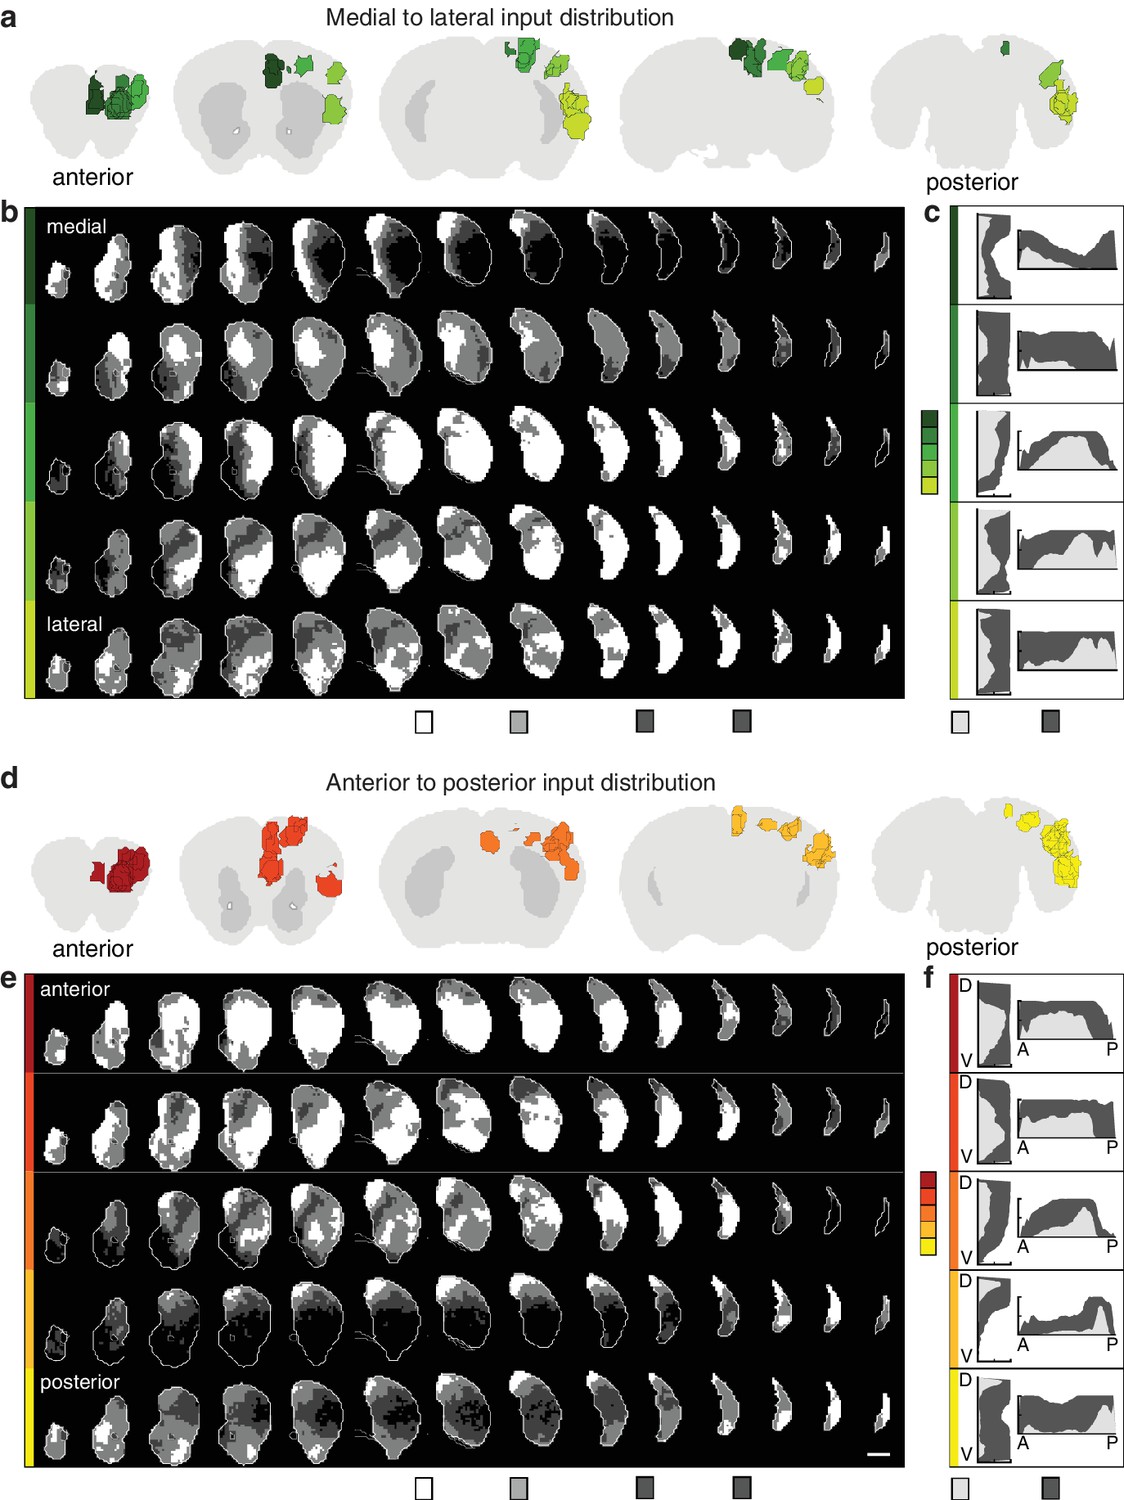
Topographic organization of corticostriatal inputs.
(a) Coronal sections (2.7, 0.9, –0.9, −3.3, and −4.5 mm relative to bregma) through the AIBS averaged template brain showing the relative locations of injections in each of five medial to lateral (M–L) groups (dark to light green). (b) Coronal sections (starting 1.8 mm anterior to bregma and continuing posterior in 300 µm steps) through the ipsilateral striatum showing the striatal projection distributions for the M-L injection groups shown in panel a (rows). The maximum projection densities (dense (white), moderate (light grey), diffuse (dark grey), or none (black)) are indicated for the sum of all injections within each group. (c) Distribution plots for the dense (light gray) and diffuse (dark gray) projections of each M-L cortical group shown in panel b (calculated as described in Figure 2). (d) Coronal sections (starting at 2.7, 1.5,–0.3, −2.1, and −4.5 mm relative to bregma) of the AIBS averaged template brain showing the relative locations of injections in each of five anterior to posterior (A–P) groups (red to yellow). (e) Coronal sections (as described in panel b) of the ipsilateral (to the injection side) striatum showing the striatal projection distributions for the A-P injection groups (rows, marked in colors corresponding to panel d). The maximum projection densities (dense (white), moderate (light grey), diffuse (dark grey), or none (black)) are indicated for the sum of all injections within each group. (f) Distribution plots for the dense (light gray) and diffuse (dark gray) projections of each cortical group shown in panel e (calculated as described in Figure 2, shown in D-V and A-P axes).
Figure 3 with 1 supplement
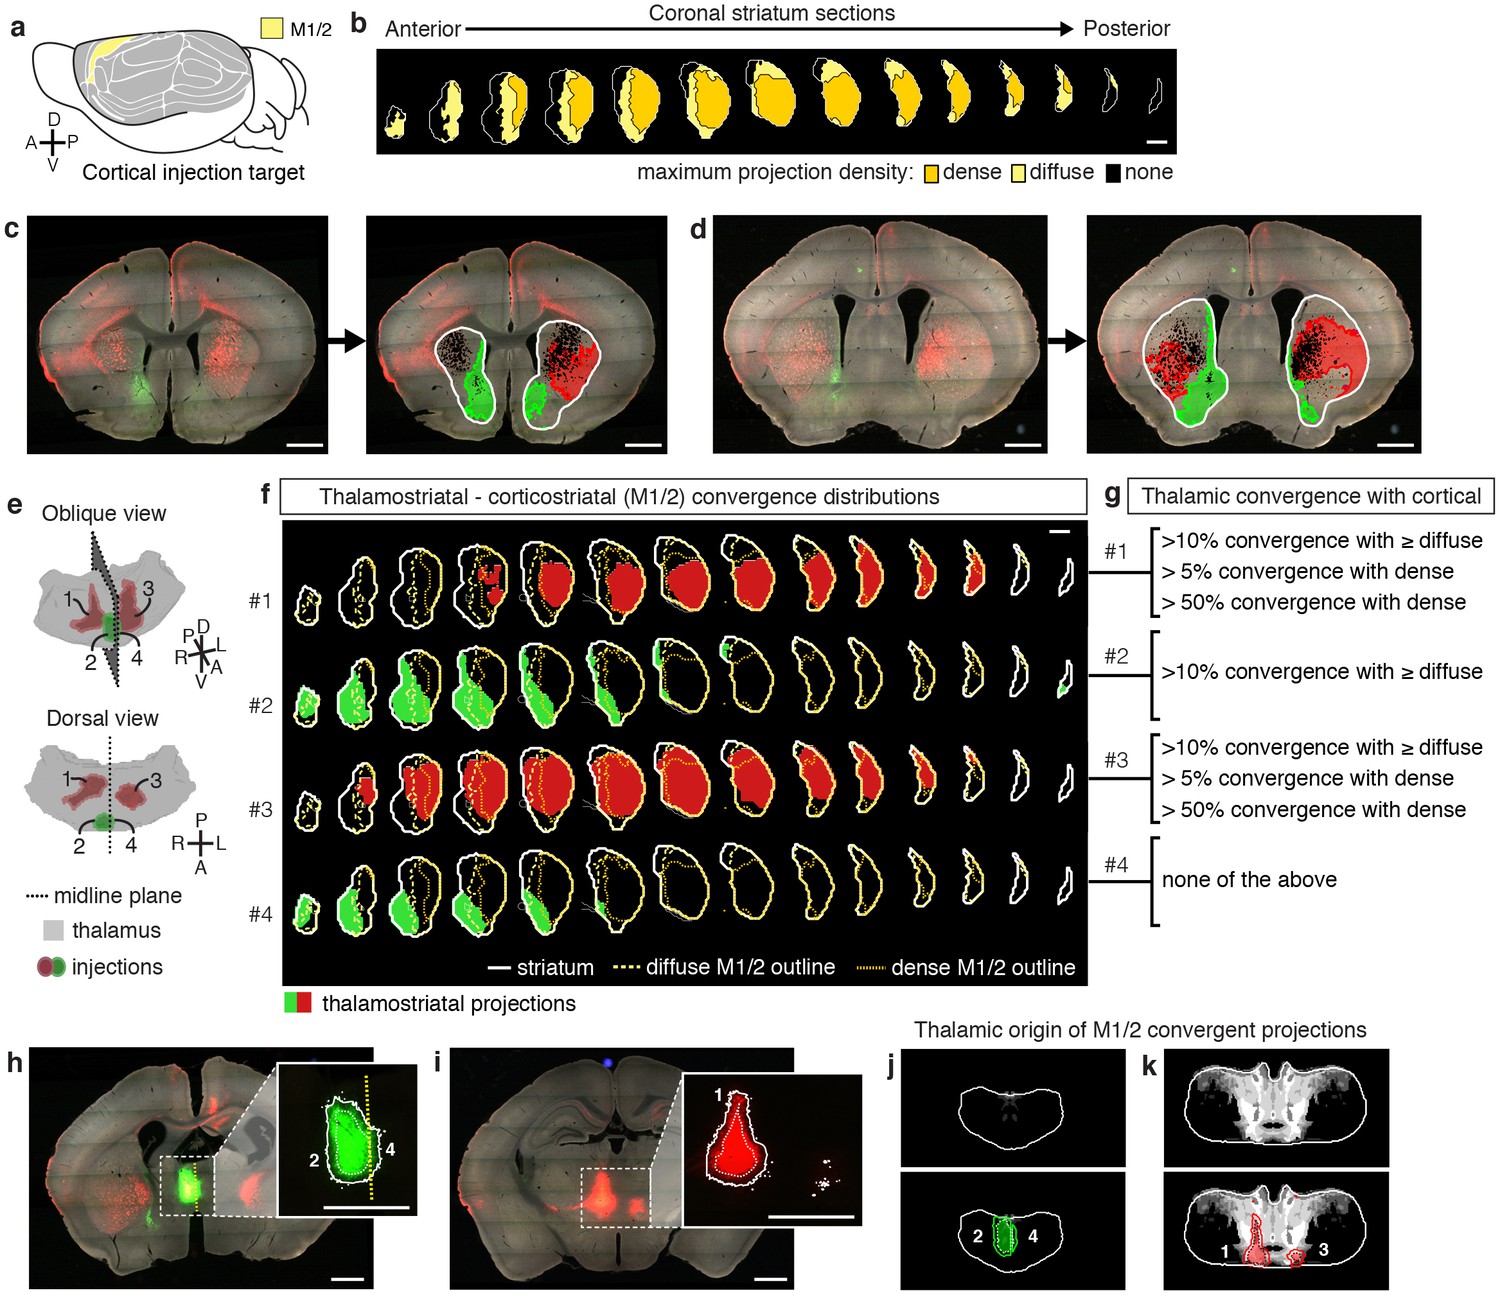
Localization of the origins of thalamostriatal projections that converge with a corticostriatal projection in the striatum.
(a) Schematic sagittal view of the mouse brain, adapted from (Watson et al., 2012), indicating the location of M1/2. (b) Distribution of dense (dark yellow) and diffuse (light yellow) corticostriatal projections from M1/2. (c–d) Representative images of two coronal sections through the striatum of one example brain (left panels in c and d) showing the fluorescent thalamic axons in the striatum from injections described in panel e. Original images are on the left and segmented striatum and axon projection fields are on the right, with traveling axon bundles subtracted (black in right images). (e) Two views of a model thalamus (gray) showing the four thalamic viral injections that produced projections shown in panels c and d. Note that since thalamic projections do not cross the midline in mouse, a single injection spanning the midline was treated as two independent injections (injections 2 and 4). A darker center of each injection site represents the eroded ‘core’ of each injection defined previously for the thalamic injection dataset (Hunnicutt et al., 2014). (f) Projection distributions in the striatum for each of the injections shown in panel e (red and green) aligned and overlaid with the outlines of M1/2 projections in the striatum (yellow) delineated in panel b. (g) Injections were assigned to one or more of four categories based on quantification of the convergent volumes of thalamostriatal and corticostriatal projection fields (see Materials and methods). Inclusion in each category is used, as described in Figure 3—figure supplement 1, to localize the thalamic origins of convergence. (h–i) Fluorescent images of coronal sections through the thalamus, showing injection sites 1, 2, and 4. Insets show the segmented injection sites (solid white line) and the injection site core (dashed white line) (Hunnicutt et al., 2014). The dashed yellow line in panel h insert shows the brain midline. (j–k) Two example coronal sections, approximately corresponding to the position of panels h and i, respectively, of the thalamostriatal confidence maps for M1/2 convergence in panels h and i, respectively (top panels in j and k). The segmented injection sites are overlaid on their corresponding confidence maps (bottom panels in j and k). All scale bars, 1 mm.
Figure 3—figure supplement 1

Illustration of the method used to generate thalamic confidence maps.
(a) Illustration of eight hypothetical injection volumes labeled to indicate whether or not they individually satisfy each of three criteria for their projections in the striatum (right). Each injection indicates the borders of the full injection (1, 2, 3, and X) and the injection core (1c, 2c, 3c, and Xc), which is generated by eroding the full injection volume by 100 µm. (b) Injections shown in panel a, indicating the injections that fulfill each of the three criteria (green). (c) Binary injection masks representing the area covered by either the full injection (top) or injection cores (bottom) that satisfy each of the three criteria. (d) Binary injection masks representing the area covered by either the full injection (top) or injection cores (bottom) that do not satisfy each of the three criteria. Binary mask for the full injections that do not meet the hardest to satisfy criteria are not included. (e) Sum of binary masks generated in panel c. (f) Subtraction of the binary masks generated in panel d. (g) Example confidence map, generated by combining the summed binary masks from panel E and the subtracted binary masks from panel f. Values below zero set to zero.
Figure 4

Thalamostriatal projections that converge with subregion-specific corticostriatal projections.
(a) Example coronal sections through our model thalamus from anterior to posterior (starting at −0.155 mm relative to bregma and continuing in 250 µm steps posterior). Confidence maps identifying the complete thalamic origins of thalamostriatal projections that converge with subregion-specific corticostriatal projections (columns). Projection origins indicated for six confidence levels (see Materials and methods, and also see [Hunnicutt et al., 2014]). (b) An example coronal section of the thalamostriatal confidence map converging with corticostriatal inputs of Sub (gray scale), overlaid with thalamic nuclear demarcations from the AMBA. The atlas is colored on the left to indicate the fraction of each thalamic nucleus covered by the average of confidence levels 1, 3, and 5. Coverage values were calculated for the PMBA and AMBA, and their average is shown. The color scale minimum is 0% (blue), inflection point is 25% (white), and the peak coverage is 75% (red). (c) The fraction of each thalamic nucleus covered by confidence levels 1, 3, and 5 (dark, medium and light gray bars, respectively), with their average (black line). (d) Aggregate nucleus coverage map indicating the nuclear origins of the thalamostriatal projections that converge with subregion-specific corticostriatal projections. Nuclei (rows) and cortical subregions (columns) are hierarchically clustered on the basis of output and input similarity, respectively. Color scale is the same as in panel b.
Figure 5 with 4 supplements
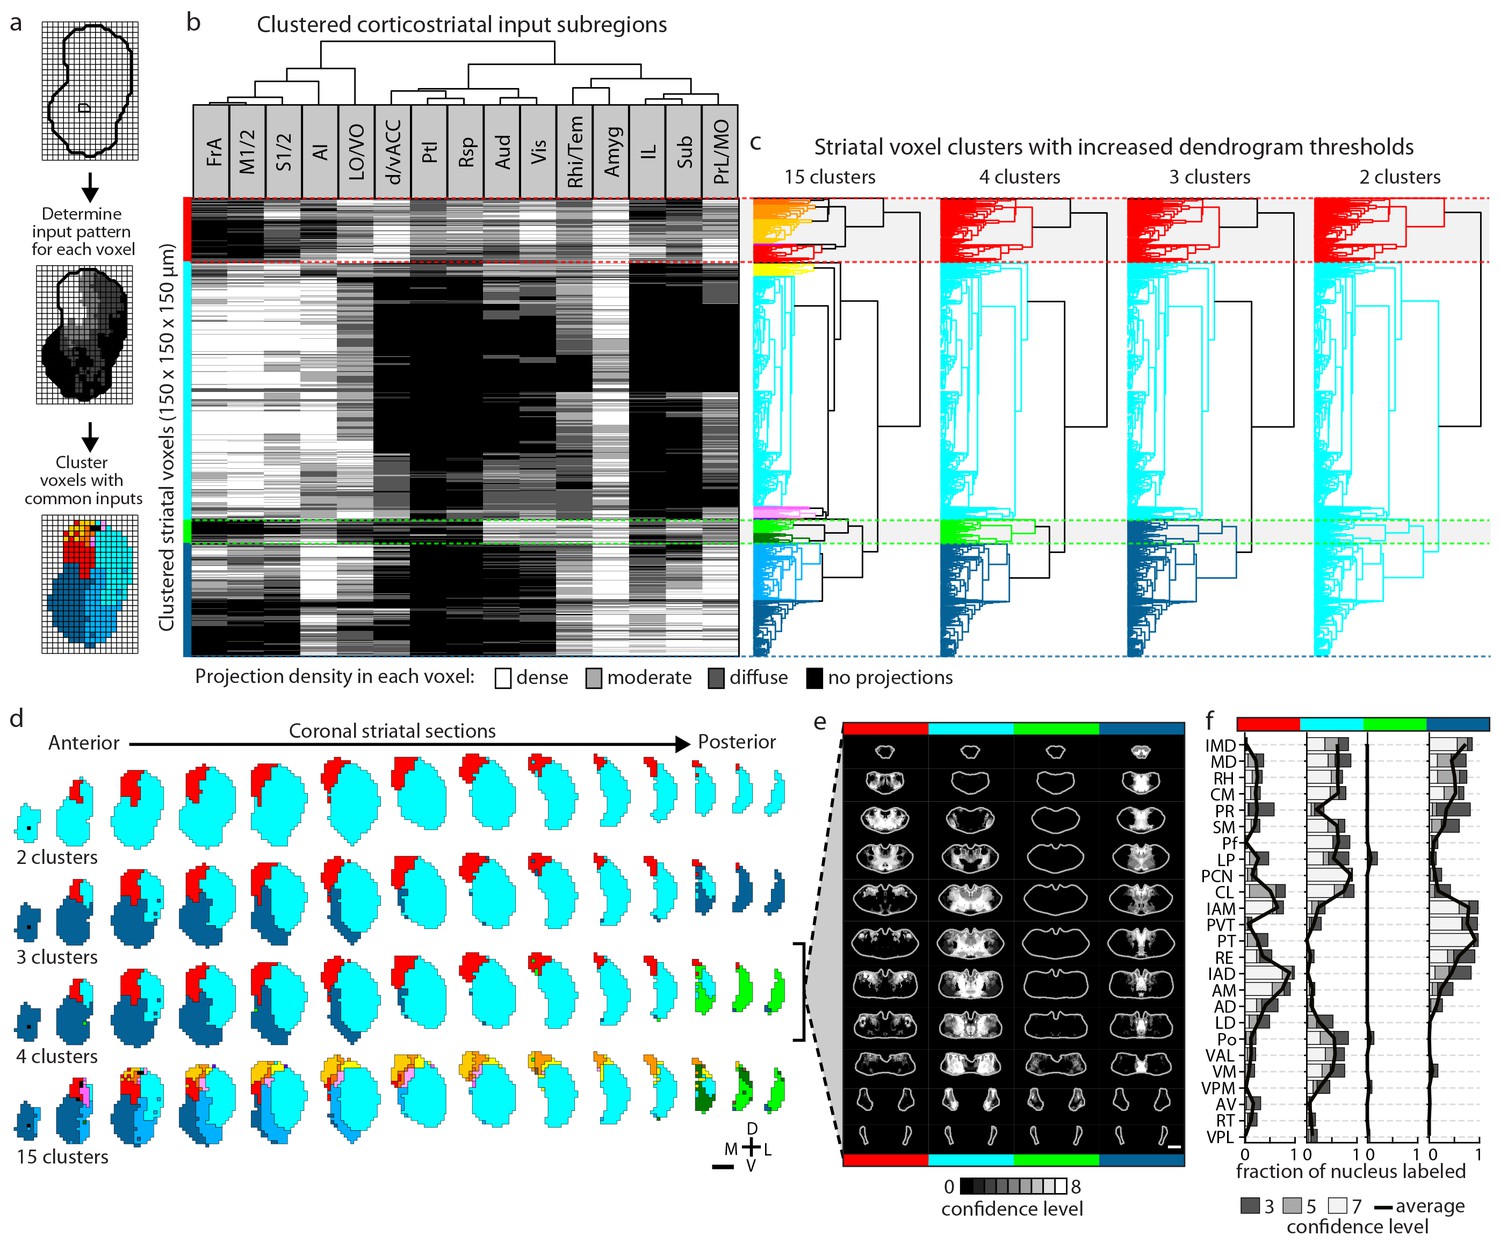
Striatal subdivisions based on cortical input convergence.
(a) Schematic of voxel clustering method. The striatum was downsampled into 150 µm × 150 µm × 150 µm voxels (top panel), the projection density (dense, moderate, or diffuse) to each voxel was determined for inputs from each cortical subregion (middle panel), and the sum of this information was used to cluster voxels with common inputs (bottom panel). (b) All striatal voxels (rows) were hierarchically clustered based on their cortical input patterns, and cortical subregions (columns) were clustered based on common innervation patterns to the striatum. The projection densities in each voxel are indicated in gray scale, as determined in Figure 2b. (c) Four separate thresholds were applied to the voxel dendrogram to produce 2, 3, 4, and 15 clusters. The cluster boundaries (dotted color lines) for the threshold producing four clusters are carried across the clustered voxels in panel b. Clusters containing only one voxel were ignored in our analyses. (d) Coronal sections outline the ipsilateral (according to the injection hemisphere) striatum, starting 1.8 mm anterior to bregma and continuing posterior in 300 µm steps, showing the spatial location of the clusters determined in panel c. (e) Thalamic confidence maps indicating the thalamic origins of thalamostriatal projections to the four striatal subdivisions defined by cluster analysis in panel d (thalamic section positions are the same as in Figure 4a). The method used to localize the origin of thalamic projections was similar to that described for Figures 3 and 4, except that differences in the data resulted in an eight level confidence maps based on the inclusion of each injection in each of four groups (see Materials and methods). (f) The fraction of each thalamic nucleus covered by confidence levels 3, 5, and 7 (dark, medium and light gray bars, respectively), with their average (black line) shown for the confidence maps in panel e (see Figure 5—figure supplement 3 for full dataset, and Materials and methods for details).
Figure 5—figure supplement 1
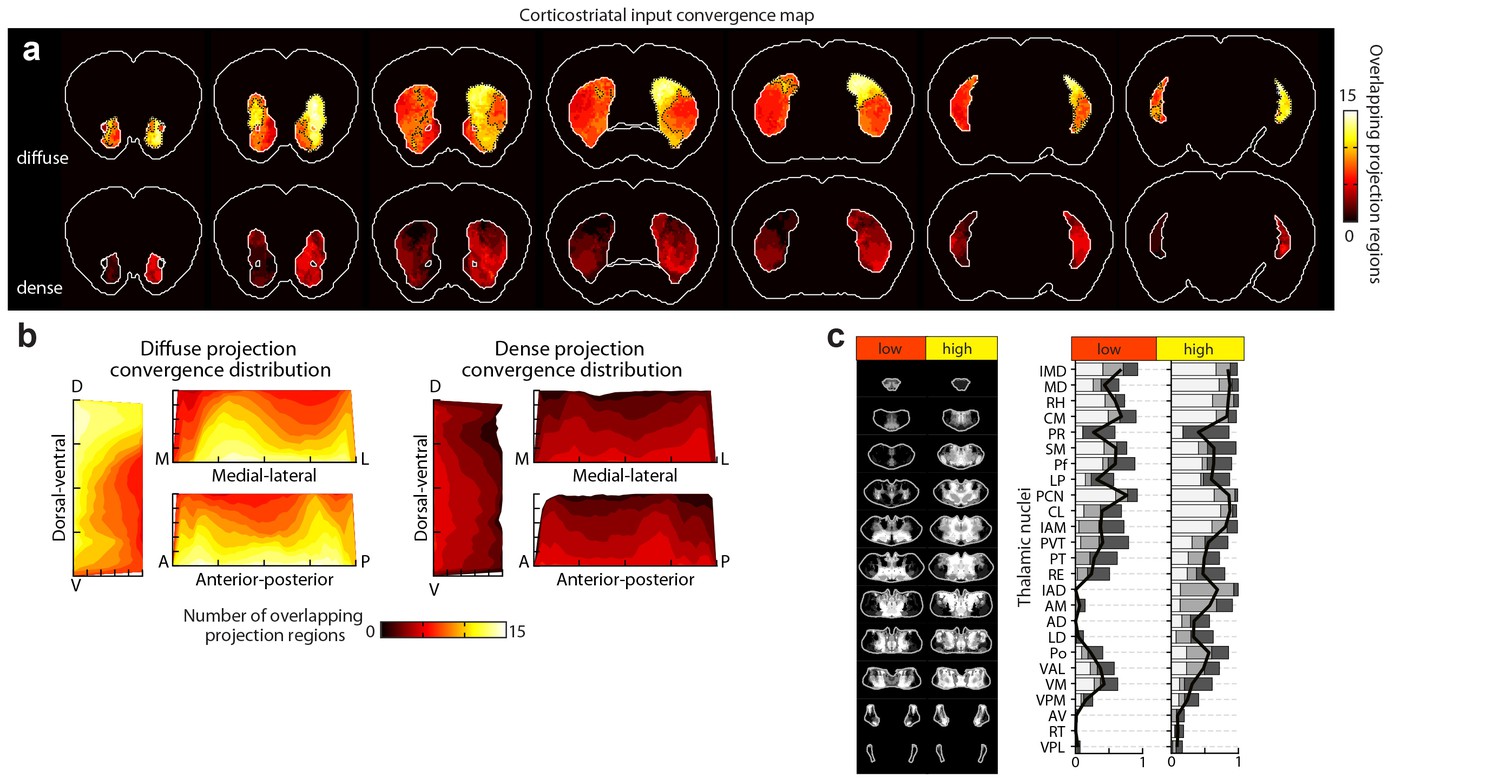
Distribution of cortical input convergence in the striatum.
(a) Coronal sections of the average template brain showing the cumulative bilateral convergence of diffuse (top) and dense (bottom) projections from all cortical subregions (heat map). The striatal areas with convergent inputs from nine or more cortical subregions are indicated (black dashed line). Sections start 1.8 mm anterior to bregma, the second slice is 300 µm posterior, and the rest continue in 600 µm steps. (b) Projection distribution plots in the dorsal-ventral (D–V), medial-lateral (M–L) and anterior-posterior (A–P) axes for diffuse (left panel) and dense (right panel) input convergence. Coverage of cortical inputs in the striatum by the indicated number of cortical subregions was calculated in 100 µm steps along each axis. The fraction of the striatum covered in each step by each number of converging projections is shown as a heat map, where each plot is collapsed to show only the dimension indicated (i.e. the D-V plot does not contain any M-L or A-P information). Striatal volumes were normalized in each 100 µm step. (c) Left panel: summary of thalamic confidence maps for the origins of thalamostriatal projections that target striatal volumes with high- and low-diffuse cortical projection convergence, as determined in panel a (thalamic section positions are the same as in Figure 4a). Right panel: the fraction of each thalamic nucleus covered by confidence levels 3, 5, and 7 (dark, medium and light gray bars, respectively), with their average (black line) (see Materials and methods and Figure 5—figure supplement 1).
Figure 5—figure supplement 2

Projection distribution and thalamic input convergence for cortical subtypes.
(a) Coronal sections of the model brain showing the bilateral distributions of dense, moderate and diffuse projections from all allocortical (top), mesocortical (middle), and neocortical (bottom) subregions. The second slice is 300 µm posterior to the first slice, continuing in 600 µm steps. (b) Thalamic confidence maps for the origins of thalamostriatal projections that converge in the striatum with projections from each cortical subtype, as determined in panel a (section positions are the same as in Figure 4a). (c) The fraction of each thalamic nucleus covered by confidence levels 3, 5 and 7 (dark, mid and light gray bars, respectively), and their average (black line).
Figure 5—figure supplement 3

Thalamic origins of inputs to striatal clusters.
(a) Coronal sections through the thalamus from anterior to posterior. Thalamic confidence maps indicating the origins of thalamostriatal projections to the striatal voxel clusters shown in Figure 5. Confidence maps are shown for the origins of all projections to each of the two clusters (left), three clusters (middle), and the 5 largest of the 15 clusters (right) thresholds (grayscale, section positions are the same as in Figure 4a). (b) The fraction of each thalamic nucleus covered by confidence levels 3, 5, and 7 (dark, mid, and light gray bars, respectively), with their average (black line) is shown for the confidence maps in panel a (see Materials and methods for details). (c) Coronal sections of the thalamus showing the boundaries of the canonical thalamic nuclear groups (anterior, midline, medial, intralaminar, ventral, lateral, and posterior). In each section, the nuclear boundaries are shown for both the PMBA (left) and the AMBA (right), which were previously aligned to the thalamic dataset used there (Hunnicutt et al., 2014).
Figure 5—figure supplement 4
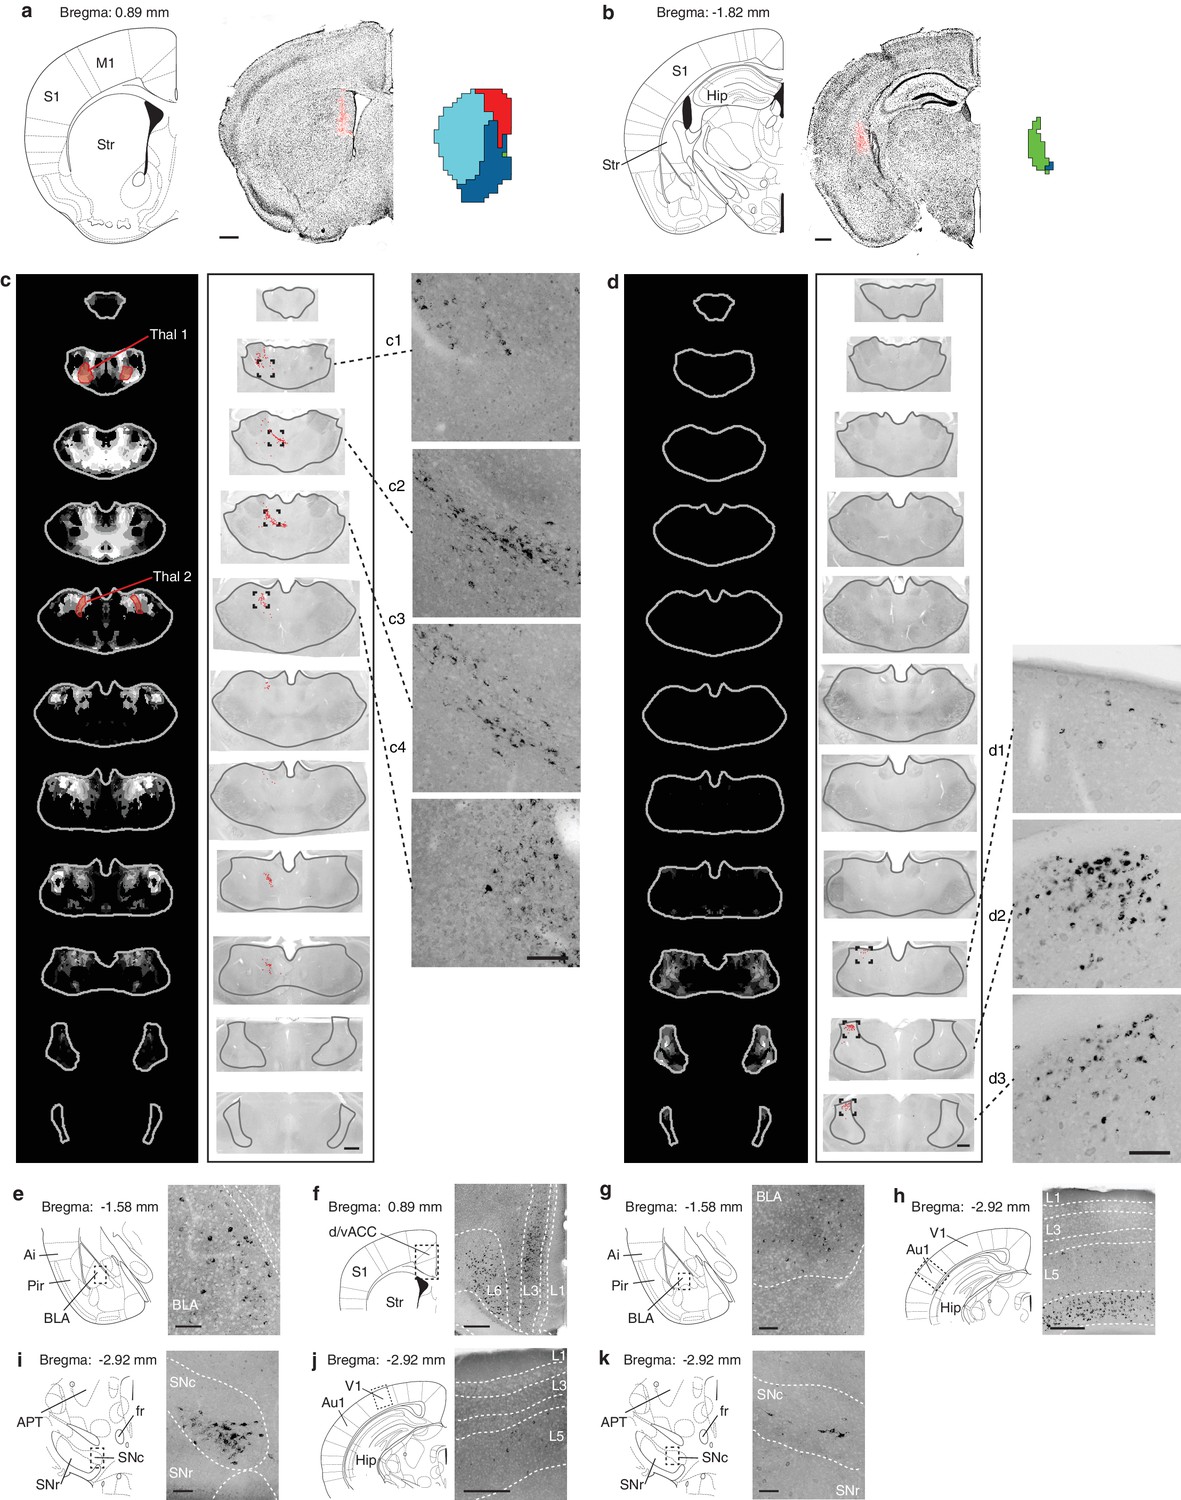
Retrograde verification of anterograde projection maps.
(a–b) Representative injection sites of Lumafluor retrograde beads in the dorsomedial (DMS, a) and posterior striatum (PS, b). Left, reference coronal section from PMBA; center, immunostained sections (gray, inverted lookup table) with Lumafluor beads (red); and right, the striatal subdivisions (DMS, red; PS, green) based on Figure 5. (c–k) Retrograde-labeled cells in the thalamus, midbrain, and several other subcortical regions, as indicated after injection of DMS (c, e, f, i, j) and PS (d, g, h, k). (c–d) Left, thalamic confidence maps indicating the thalamic origins of the thalamostriatal projections to DMS and PS, as shown in Figure 5. Thal1 and Thal2, red, were used for optogenetic stimulation of thalamostriatal projections to the DMS (Figure 8); center, corresponding coronal sections (gray, inverted lookup table) of the thalamus with retrograde-labeled cells (red dots) and thalamus outline (grey line); right, enlarged raw images corresponding to the boxed areas in center. (e–k) Retrograde labeled observed in the basolateral amygdala (BLA, e, g), dorsal/ventral anterior cingulate cortex (d/vACC, f), primary auditory cortex (Au1, h), substantia nigra pars compacta (SNc, i, k), and primary visual cortex (V1, j). Left, reference sections from PMBA, right, immunostaining of retrograde-labeled cells (gray, inverted lookup table). Ai, agranular insular cortex; APT, anterior pretectal nucleus; fr, fasciculus retroflexus; Hip, hippocampus; L1-6, cortical layer 1–6; Pir, piriform cortex; S1, primary somatosensory cortex; SNr, substanta nigra reticulare; Str, striatum. Scale bars: a–d, 500 µm; c1–c4 and d1–d3, 100 µm; e, g, i, k, 100 µm; f, h, j, 250 µm.
Figure 6 with 3 supplements
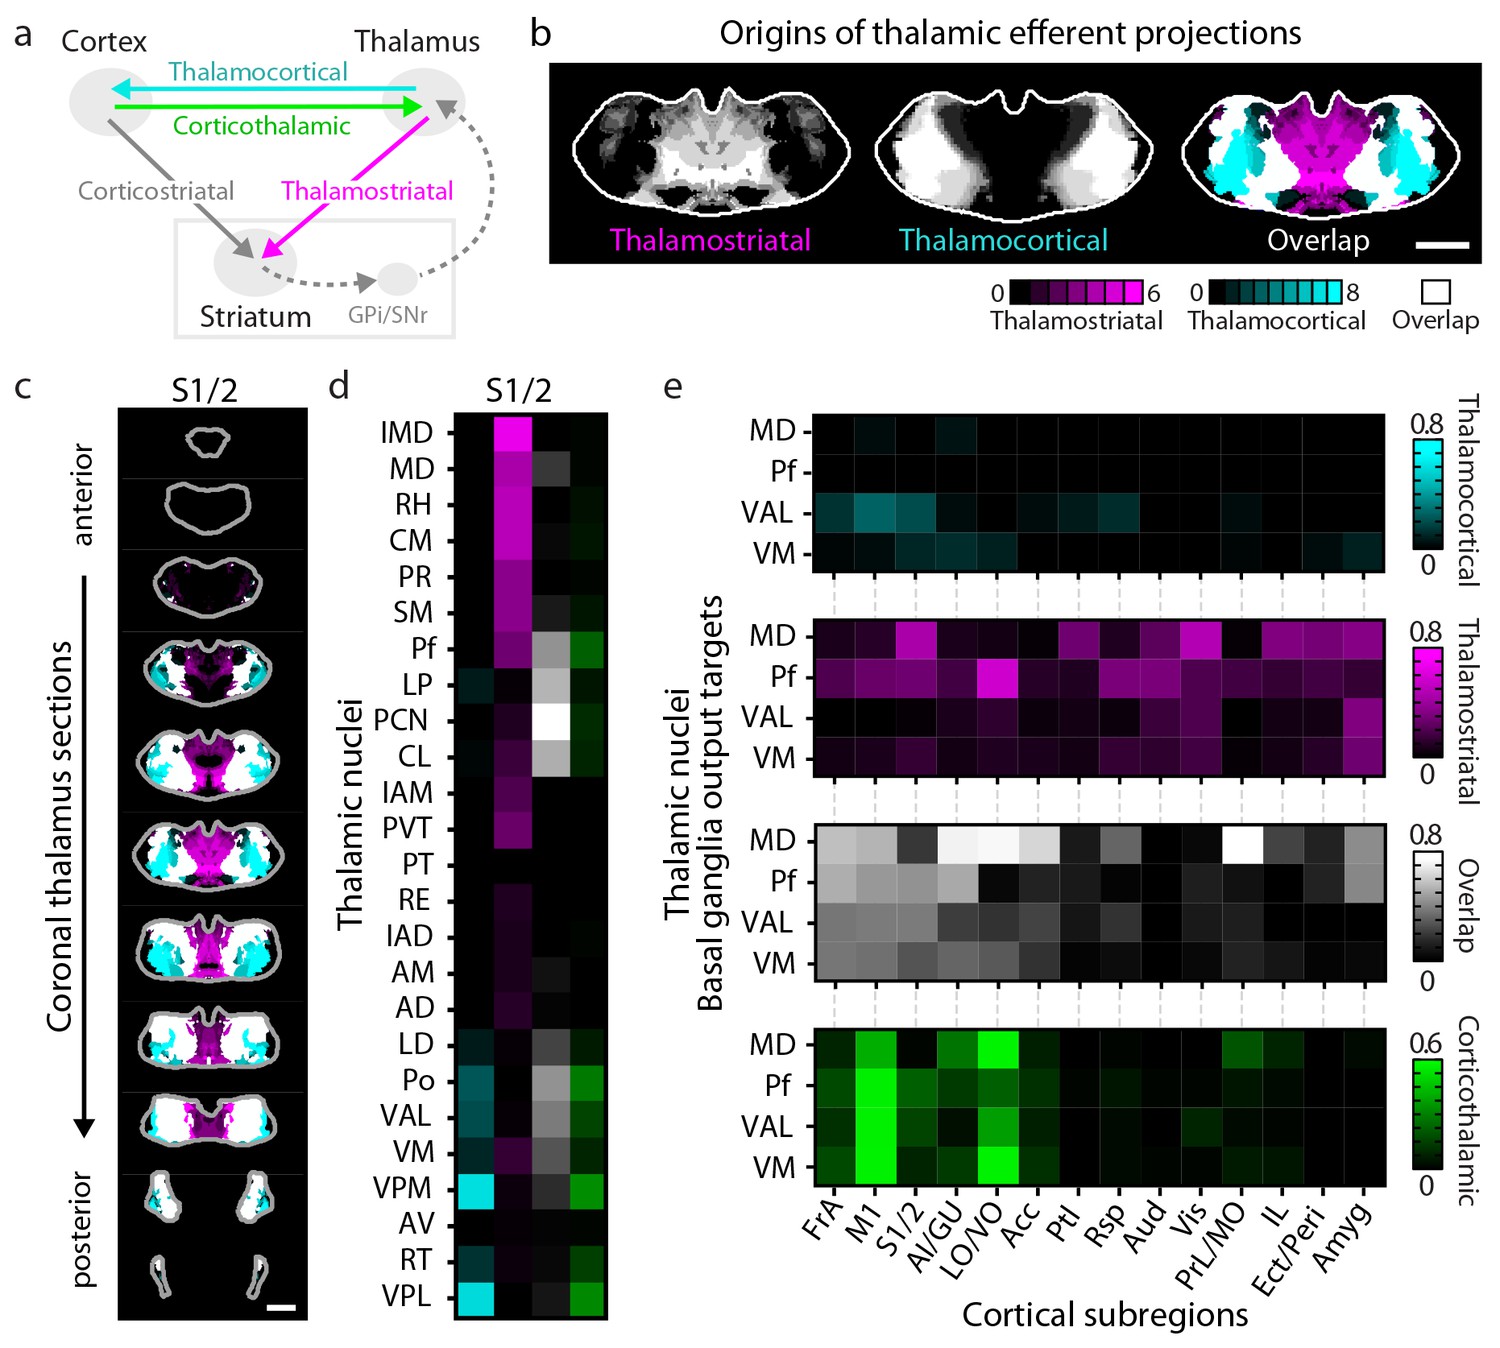
Connectivity of excitatory projections in the cortico-thalamo-basal ganglia circuit.
(a) Schematic of the excitatory connections between the cortex, thalamus, striatum, and the output nuclei of the basal ganglia, globus pallidus internal segment (GPi) and substantia nigra pars reticulata (SNr), which collectively make up the cortico-thalamo-basal ganglia circuit (gray box indicates the basal ganglia). (b–d) Example connectivity matrix for one part of the cortico-thalamo-basal ganglia circuit. (b) Confidence map showing the origins of thalamostriatal projections that converge with projections from somatosensory cortex (S1/2) (left), and confidence maps for the origins of thalamocortical projections that terminate in S1/2 (center, previously published data, [Hunnicutt et al., 2014]), with their overlay shown on the right (thalamostriatal: magenta; thalamocortical: cyan; overlap: white). (c) Overlaid thalamocortical and thalamostriatal confidence maps, as described in panel b (thalamic section positions are the same as in Figure 4a). (d) Thalamic nuclear localization for the confidence maps shown in panel c. Values are represented as the fraction of each thalamic nucleus covered by the average of confidence levels 1, 3, and 5 for thalamostriatal projections (magenta), the average of confidence levels 1, 4, and 7 for thalamocortical projections (cyan) and the average of confidence levels 1, 3, and 5 for thalamostriatal projections that lie within the white overlapping volume shown in panel c. The density of subregion-specific corticothalamic projections within each nucleus is shown in green. (e) The nuclear localization data, as described in panel d, are grouped by projection type (thalamocortical, thalamostriatal, overlap, and corticothalamic). As examples, only the thalamic targets of basal ganglia output (MD, Pf, VAL, and VM) are shown (see Figure 6—figure supplement 1 for full dataset).
Figure 6—figure supplement 1
Organization of the thalamus in cortico-thalamo-basal ganglia loops.
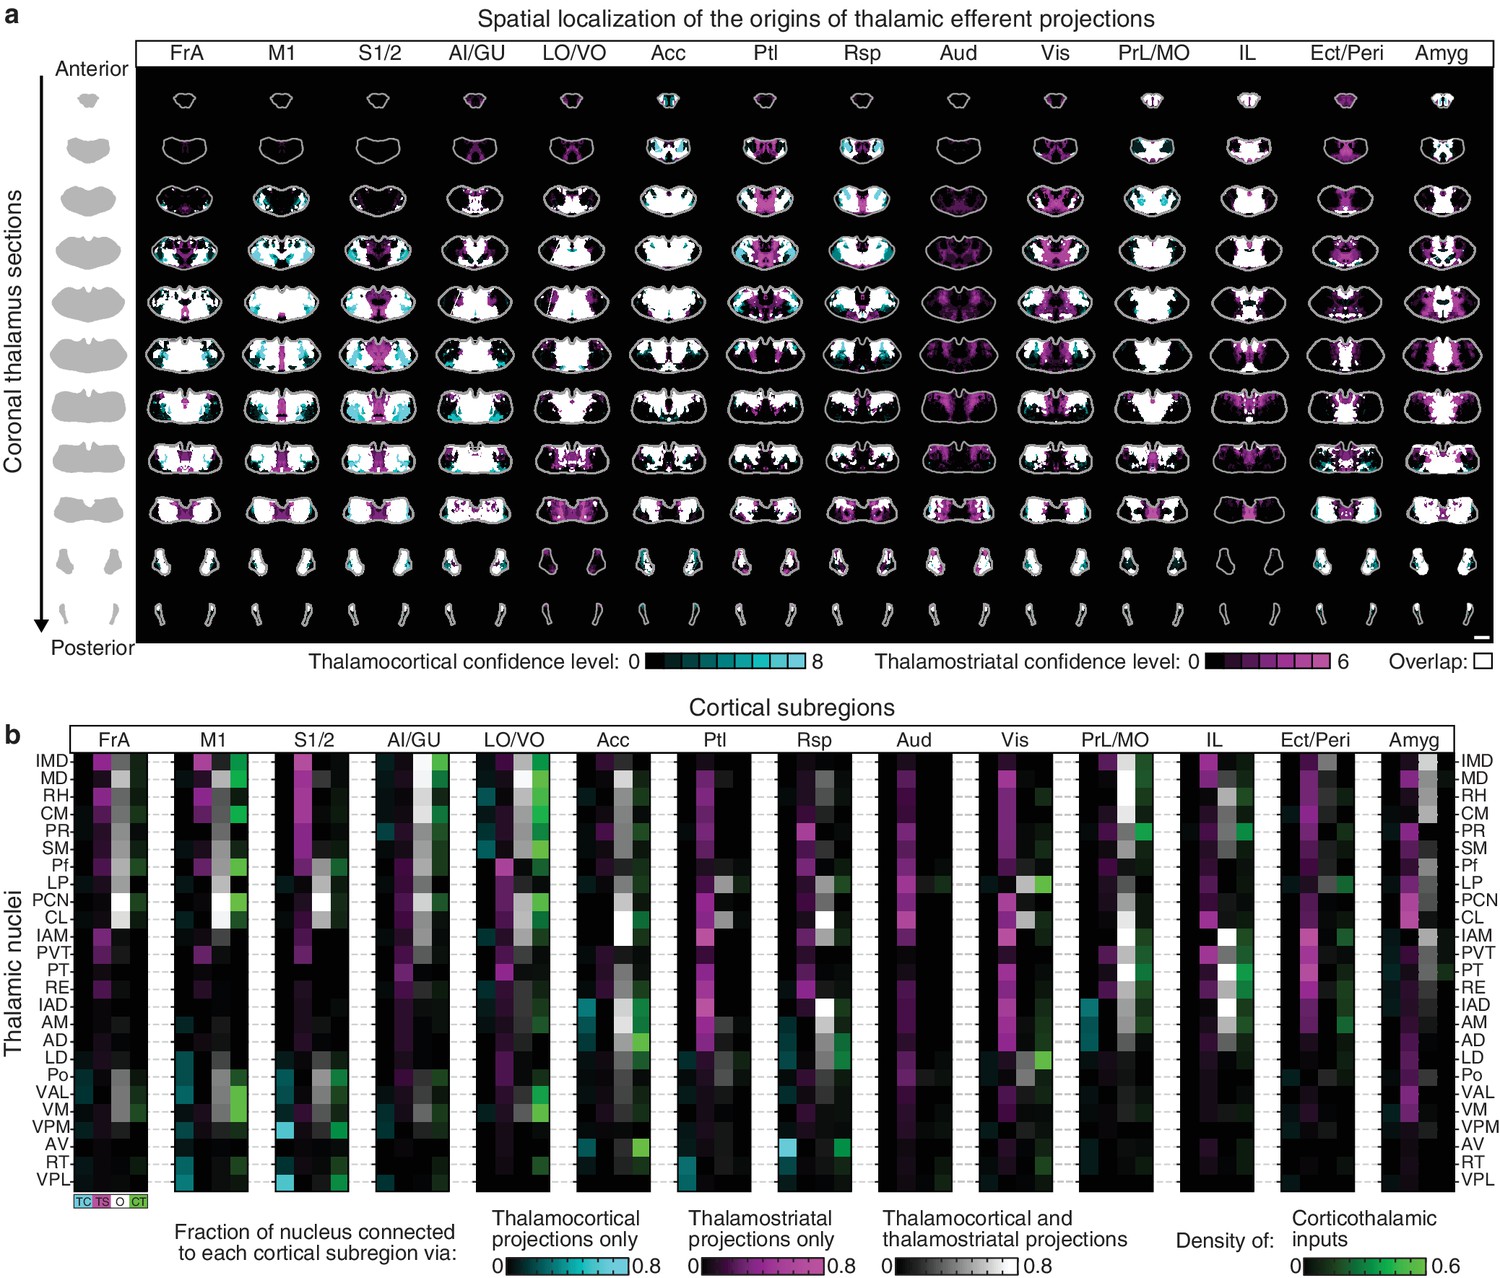
(a) Example coronal sections through the thalamus from anterior to posterior. Overlaid thalamocortical and thalamostriatal confidence maps as described in Figure 6b. Each column shows the origin of thalamic efferent projections associated with the 14 analyzed cortical subregions (section positions are the same as in Figure 4a). (b) Nuclear localization for the confidence maps shown in panel a. Values are represented as the fraction of each thalamic nucleus covered by the average of confidence levels 1, 3, and 5 for thalamostriatal projections (magenta), the average of confidence levels 1, 4, and 7 for thalamocortical projections (cyan) and the average of confidence levels 1, 3, and 5 for thalamostriatal projections that lie within the white overlapping volume shown in panel a. The density of subregion-specific corticostriatal projections within each nucleus is shown in green (See Materials and methods for details).
Figure 6—figure supplement 2

Overview of network interactions throughout the cortico-thalamo-basal ganglia circuit by subregion.
(a) Network diagram of all corticocortical, corticostriatal, thalamostriatal, thalamocortical, and corticothalamic connections (top to bottom) associated with each cortical subregion. Corticocortical connections indicate a projection density >15% in the target area with the line color indicating the projection source. Corticostriatal projections are shown for primary convergent subregions, i.e. subregions whose projection fields converge with >50% the target projection field of each other cortical subregion (see panels b–p for details). Thalamostriatal projections (i.e. those that converge in the striatum with the projection field of each cortical subregion) are indicated for each thalamic nucleus with >20% of its volume contributing to the convergent projections (see Figure 4c–d). Thalamocortical projections are also shown for each thalamic nucleus with >20% of its volume contributing projections to the indicated cortical subregion (See Figure 6—figure supplement 1b, and [Hunnicutt et al., 2014]). Corticothalamic projections are indicated for projections where > 20% of the thalamic nucleus received projections from the corresponding cortical subregion (Figure 6—figure supplement 1b). Arrows indicate the thalamic targets of basal ganglia output. All line widths indicate either the relative density in target area (corticocortical and corticothalamic projections), fraction of nucleus covered (thalamocortical and thalamostriatal projections), or fraction convergent (corticostriatal) for all source-target characterizations, as described in Figure 6. (b–p) Chord diagrams highlighting the relationships between the cortical subregions that form the primary convergent inputs to the striatal projection fields of each other cortical subregion, as described for corticostriatal projections in panel a. Individual intra-cortical relationship maps shown for (b) FrA, (c) M1/2, (d) S1/2, (e) AI/GI/DI, (f) LO/VO, (g) d/vACC, (h) Ptl, (i) Rsp, (j) Aud, (k) Vis, (l) PrL/MO, (m) IL, (n) Rhi/Tem, (o) Sub, and (p) Amyg. The relative projection density at the target is indicated by the width of the arc at the target. Corticocortical connections are shown between two primary inputs (darker colored arcs) and for a primary input to or from a secondary cortical subregion that is not a primary input (lighter colored arcs). Corticocortical connections are indicated for projections with a density >15% in the target area.
Figure 6—figure supplement 3
Network interactions throughout the cortico-thalamo-basal ganglia circuit by subregion, organized according to the cortical subregions.
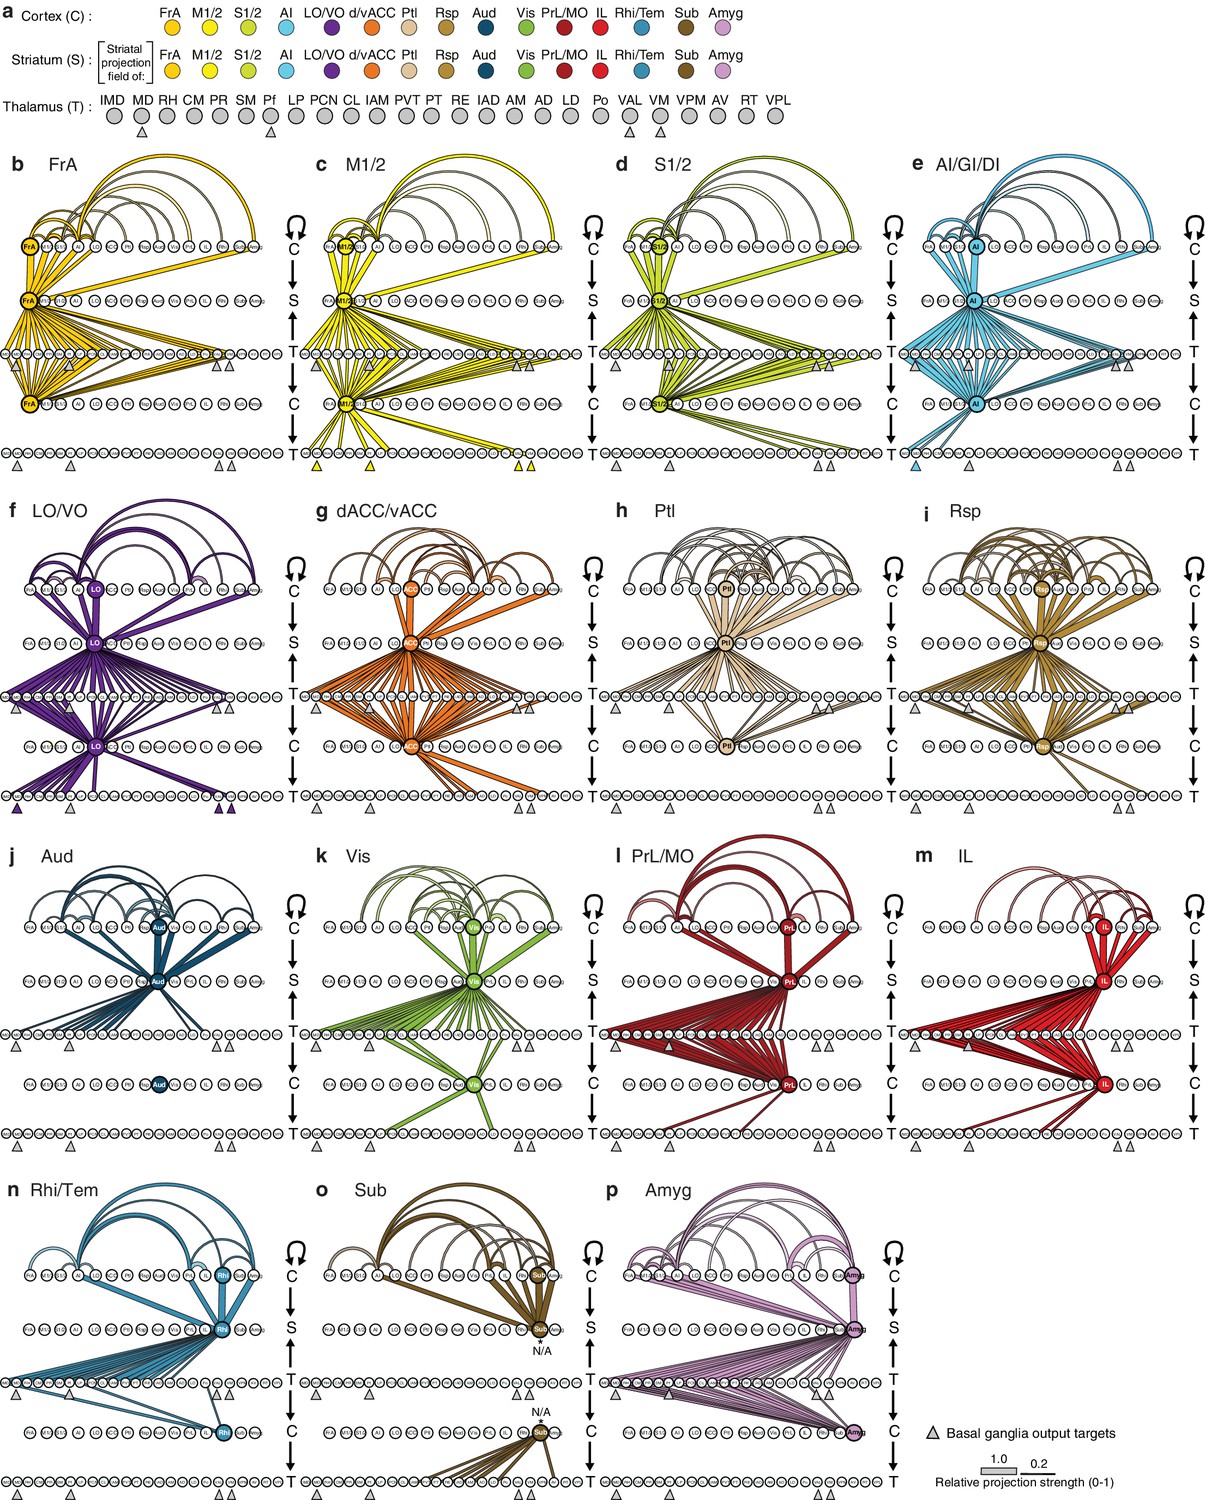
(a) Order of cortical (C), striatal (S), and thalamic (T) subregions depicted in panels b–p, with arrows below MD, Pf, VAL, and VM indicating the thalamic targets of basal ganglia output. (b–o) Network diagrams, as described in Figure 6—figure supplement 2, for individual subregions, indicating all corticocortical, corticostriatal, thalamostriatal, thalamocortical, and corticothalamic connections associated with each cortical subregion. Individual network interaction maps are shown for (b) FrA, (c) M1/2, (d) S1/2, (e) AI/GI/DI, (f) LO/VO, (g) d/vACC, (h) Ptl, (i) Rsp, (j) Aud, (k) Vis, (l) Rhi/Tem, (m) Amyg, (n) IL, (o) Sub, and (p) PrL/MO. Letters to the right of each panel indicate whether each row is corresponds to C, S, or T, and arrows indicate the direction of each projection. Corticocortical connections (projection density >15%) are shown for projections from all cortical subregions forming primary convergent inputs with the indicated cortical subregion. Corticostriatal projections are shown for the cortical subregions that form primary convergent projections with the projection field of the indicated cortical subregion. Thalamostriatal projections that converge in the striatum with the projection field of the indicated cortical subregion are shown for each thalamic nucleus having >20% of its volume contributing to the convergent projections (see Figure 4c–d). Thalamocortical projections are shown for each thalamic nucleus with >20% of its volume contributing to projections to the indicated cortical subregion (See Figure 6—figure supplement 1b, and [Hunnicutt et al., 2014]). Corticothalamic projections are shown if >20% of the thalamic nucleus received projections from the corresponding cortical subregion. Since Amyg constituted a primary convergent input to all corticostriatal projection fields, projections from Amyg were not included in corticocortical maps individually. However, the primary input to the striatal projection field is still indicated.
Figure 7 with 1 supplement
Cortico-thalamo-basal ganglia circuit organization for striatal subdivisions.
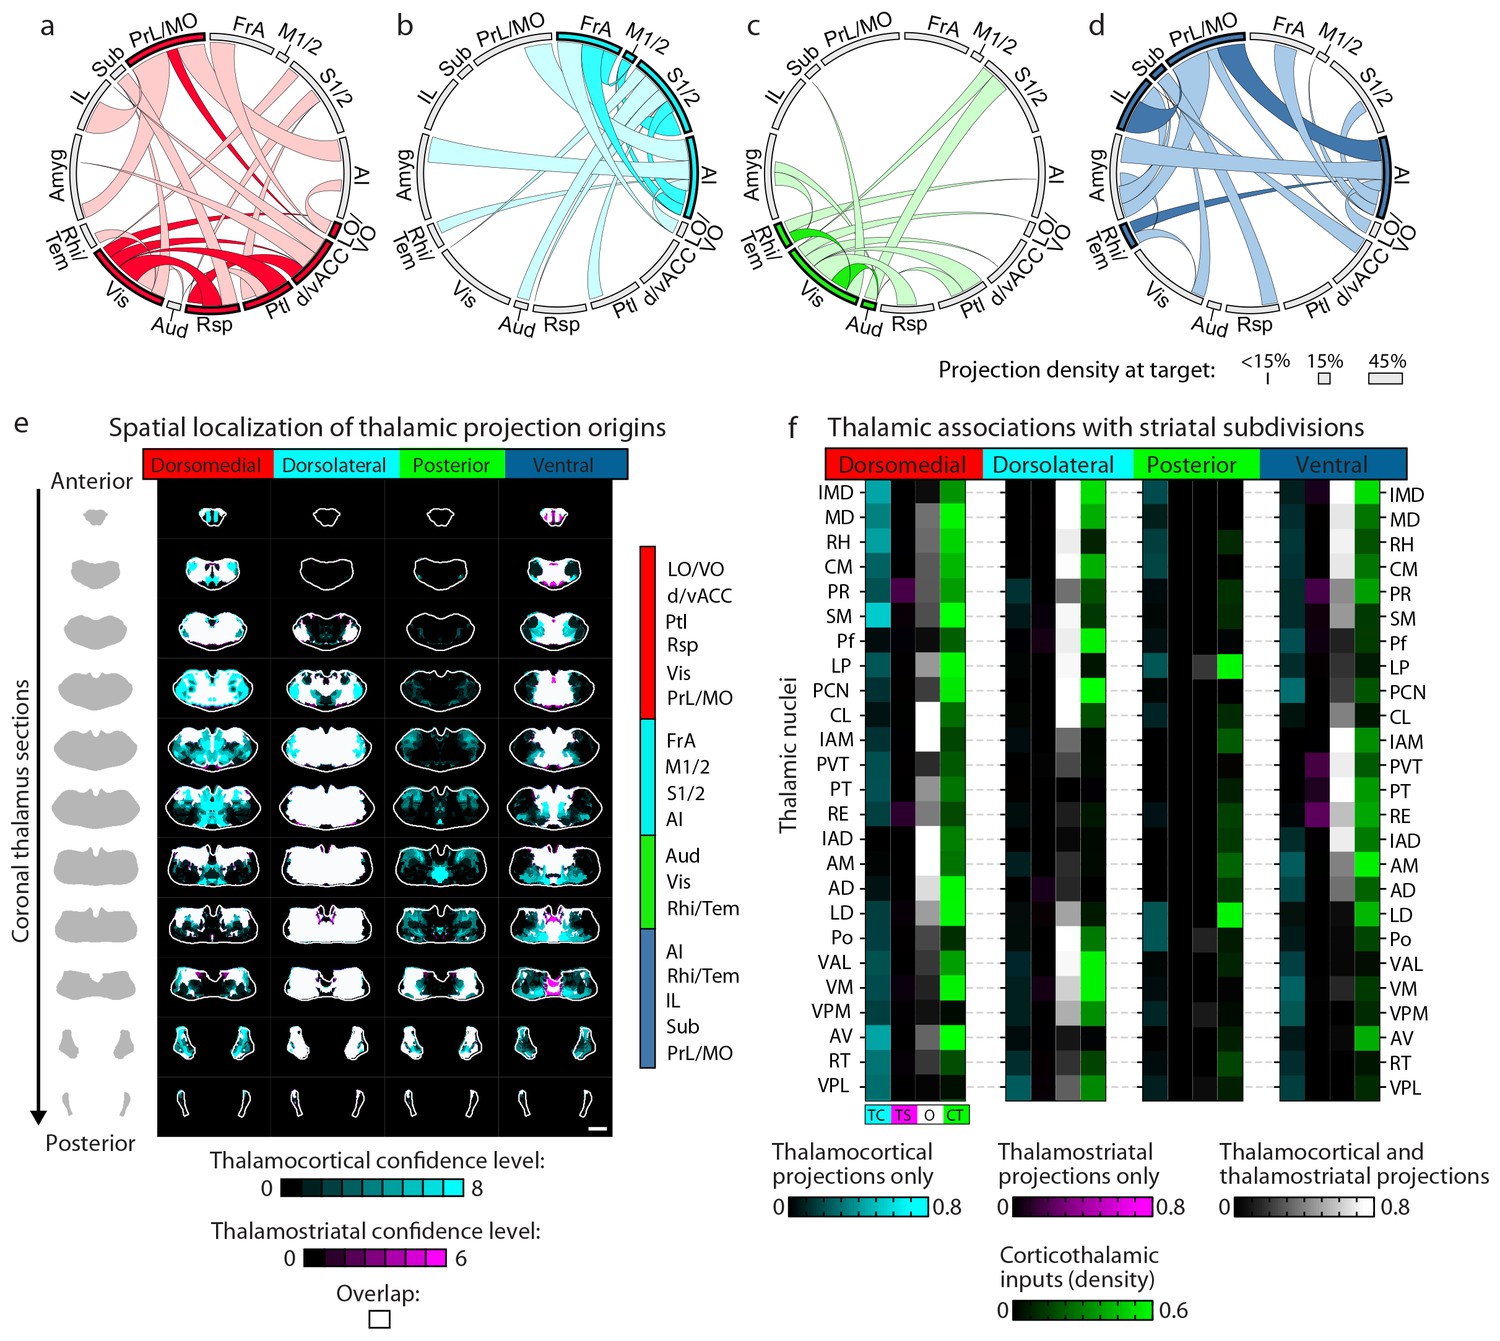
(a–d) Chord diagrams highlighting the relationships between the cortical subregions forming the primary inputs to the (a) dorsomedial, (b) dorsolateral, (c) posterior, and (d) ventral striatal subdivisions respectively. The projection density at the target subregion is indicated by the width of the arc at the target. Corticocortical connections are shown for the afferent and efferent projections of subregions that form the primary input to each striatal subdivision. Primary input regions are shown in darker colors. Darker colored ribbons indicate connections between two primary input subregions, and lighter colored ribbons indicate the connections of a primary input subregion with secondary cortical subregions that do not project to the corresponding striatal subdivision. Connections are shown for projections with a density >15% in the target area. (e) Example coronal sections through the thalamus from anterior to posterior with overlaid thalamocortical and thalamostriatal confidence maps, as described in Figure 5. Each column shows the origin of thalamic projections associated with the four striatal subdivisions shown in Figure 5. Thalamocortical and corticothalamic projections are grouped across the cortical subregions that form the primary inputs of each striatal subdivision, as determined in Figure 7—figure supplement 1 (section positions are the same as in Figure 4a). (f) Nuclear localization for the convergence confidence maps shown in panel e. Values are represented as the fraction of each thalamic nucleus covered by the average of confidence levels 1, 3, and 5 for thalamostriatal projections (magenta), the average of confidence levels 1, 4, and 7 for thalamocortical projections (cyan) and the average of confidence levels 1, 3, and 5 for thalamostriatal projections that lie within the white overlapping volume shown in panel e. The density of subregion-specific corticostriatal projections within each nucleus is shown in green (See Materials and methods for details). TC: thalamocortical confidence maps; TS: thalamostriatal confidence maps; O: overlay of thalamocortical and thalamostriatal confidence maps; CT: corticothalamic projections.
Figure 7—figure supplement 1
Intracortical interactions across cortical subregions that innervate the four striatal subdivisions.
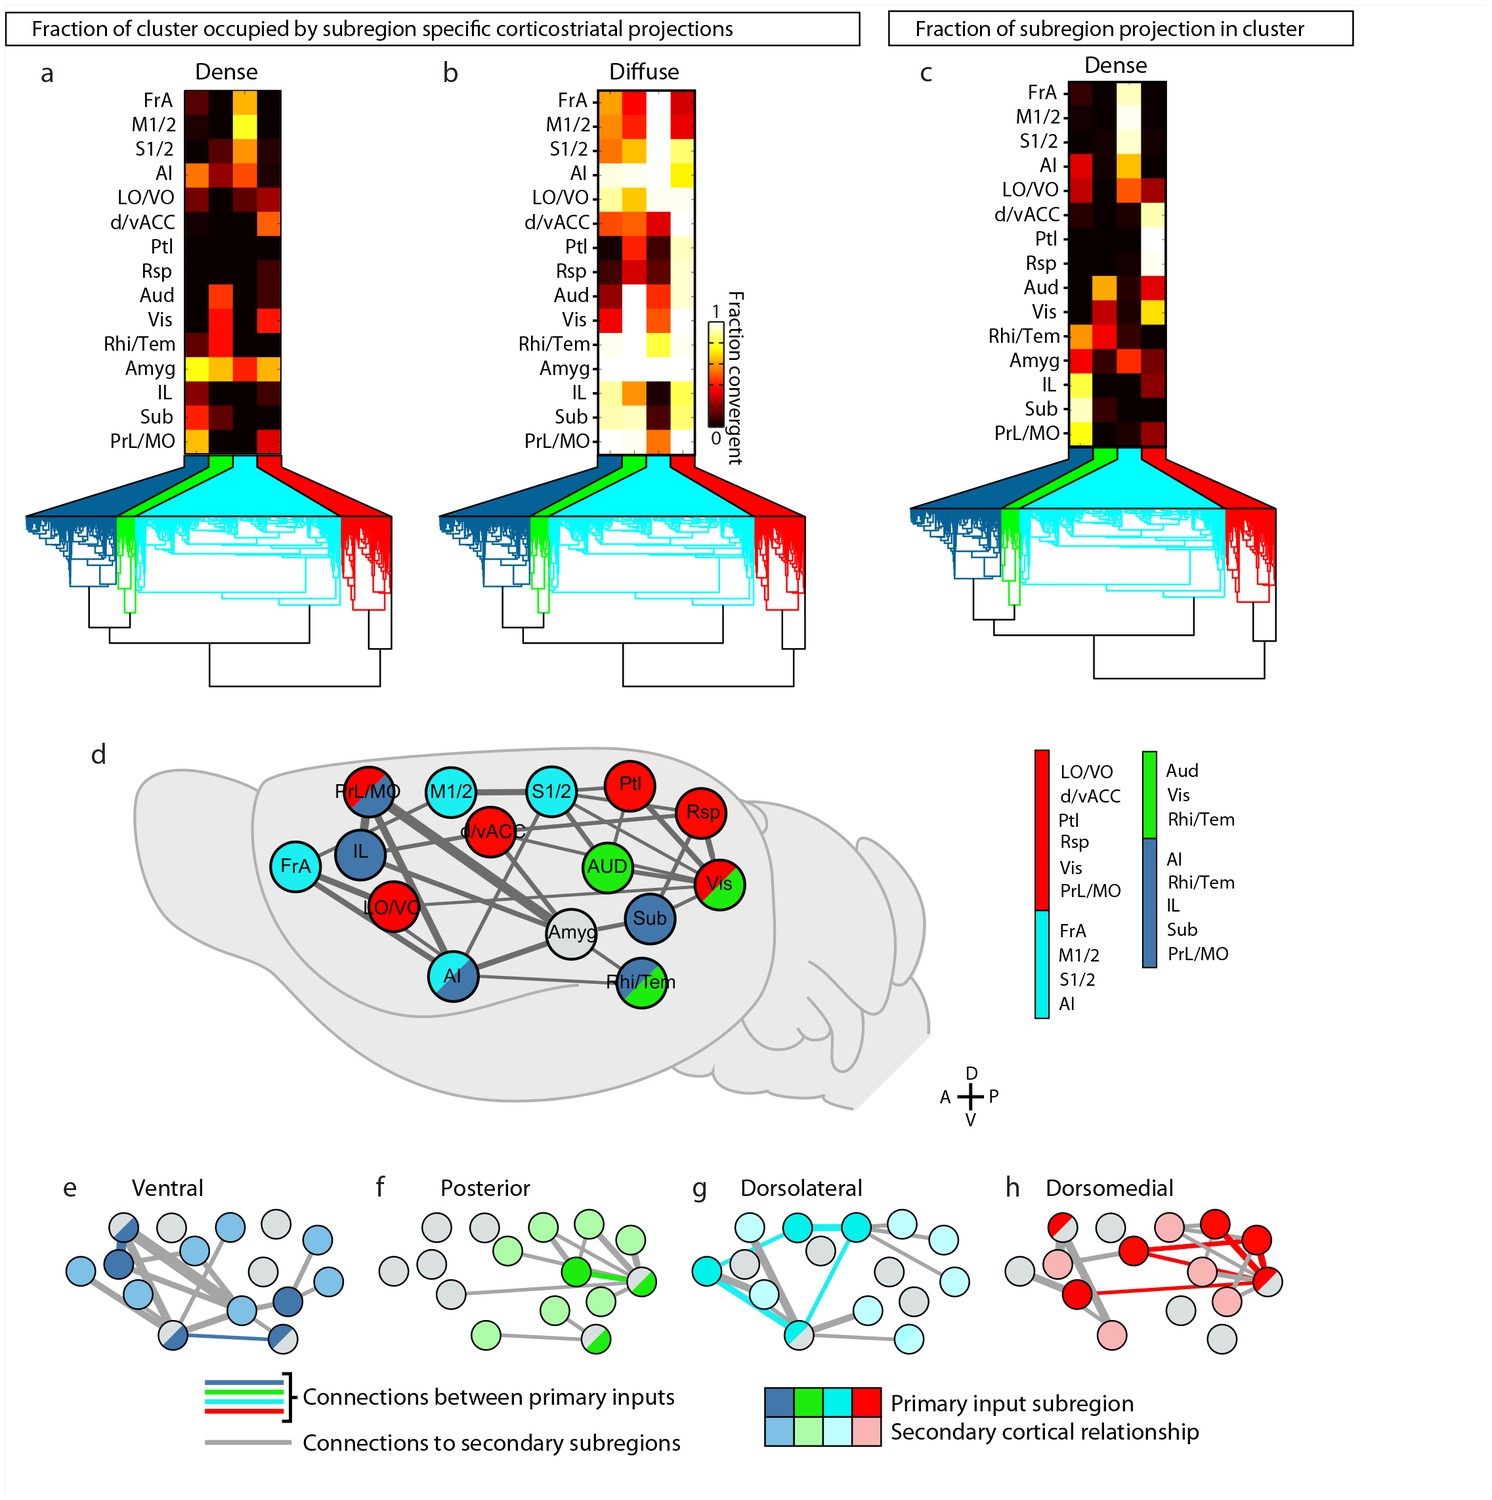
(a–b) Coverage plots indicating the fraction of each striatal cluster (columns) occupied by either diffuse or dense corticostriatal projections from each cortical subregion (rows), shown here with the striatal voxel dendrogram (bottom) for the four cluster threshold, as determined in Figure 5. (c) Coverage plot indicating the fraction of each subregion specific corticostriatal projection (rows) in each of the striatal clusters for the four cluster threshold (columns), with the striatal voxel dendrogram (bottom). (d–h) Schematic network diagrams indicating the intra-cortical relationships for the cortical subregions that make up the primary inputs to each striatal subdivisions defined by the four cluster threshold. (d) Overview schematic showing the relative locations of cortical subregions on a collapsed sagittal view of the mouse brain (gray). Primary inputs were as follows: ventral subdivision (dark blue): PrL, Sub, IL, Rhi/Tem, and AI; posterior subdivision (green): Aud, Vis, and Rhi/Tem; dorsolateral subdivision (cyan): FrA, M1/2, S1/2, and AI; dorsomedial subdivision (red): d/vACC, Ptl, Rsp, Vis, PrL/MO, and LO/VO. Cortical subregions with that target multiple striatal targets are indicated with multiple colors. Amyg projections met the criteria for primary inputs to all striatal subdivisions and is thus shown in gray. Lines connecting subregions indicate projections having a density >15% in the target area. (e–h) Schematic corticocortical network diagrams highlighting the spatial relationships between the cortical subregions forming the primary inputs to the (g) ventral, (h) posterior, (i) dorsolateral, and (j) dorsomedial subdivision, respectively. Intra-cortical connections are shown for the afferent and efferent projections of subregions that form the primary input to each in striatal subdivision. Connections between two primary inputs are indicated with a colored line, and connections between a primary input subregions and other cortical subregion are indicated with gray lines.
Figure 8 with 1 supplement
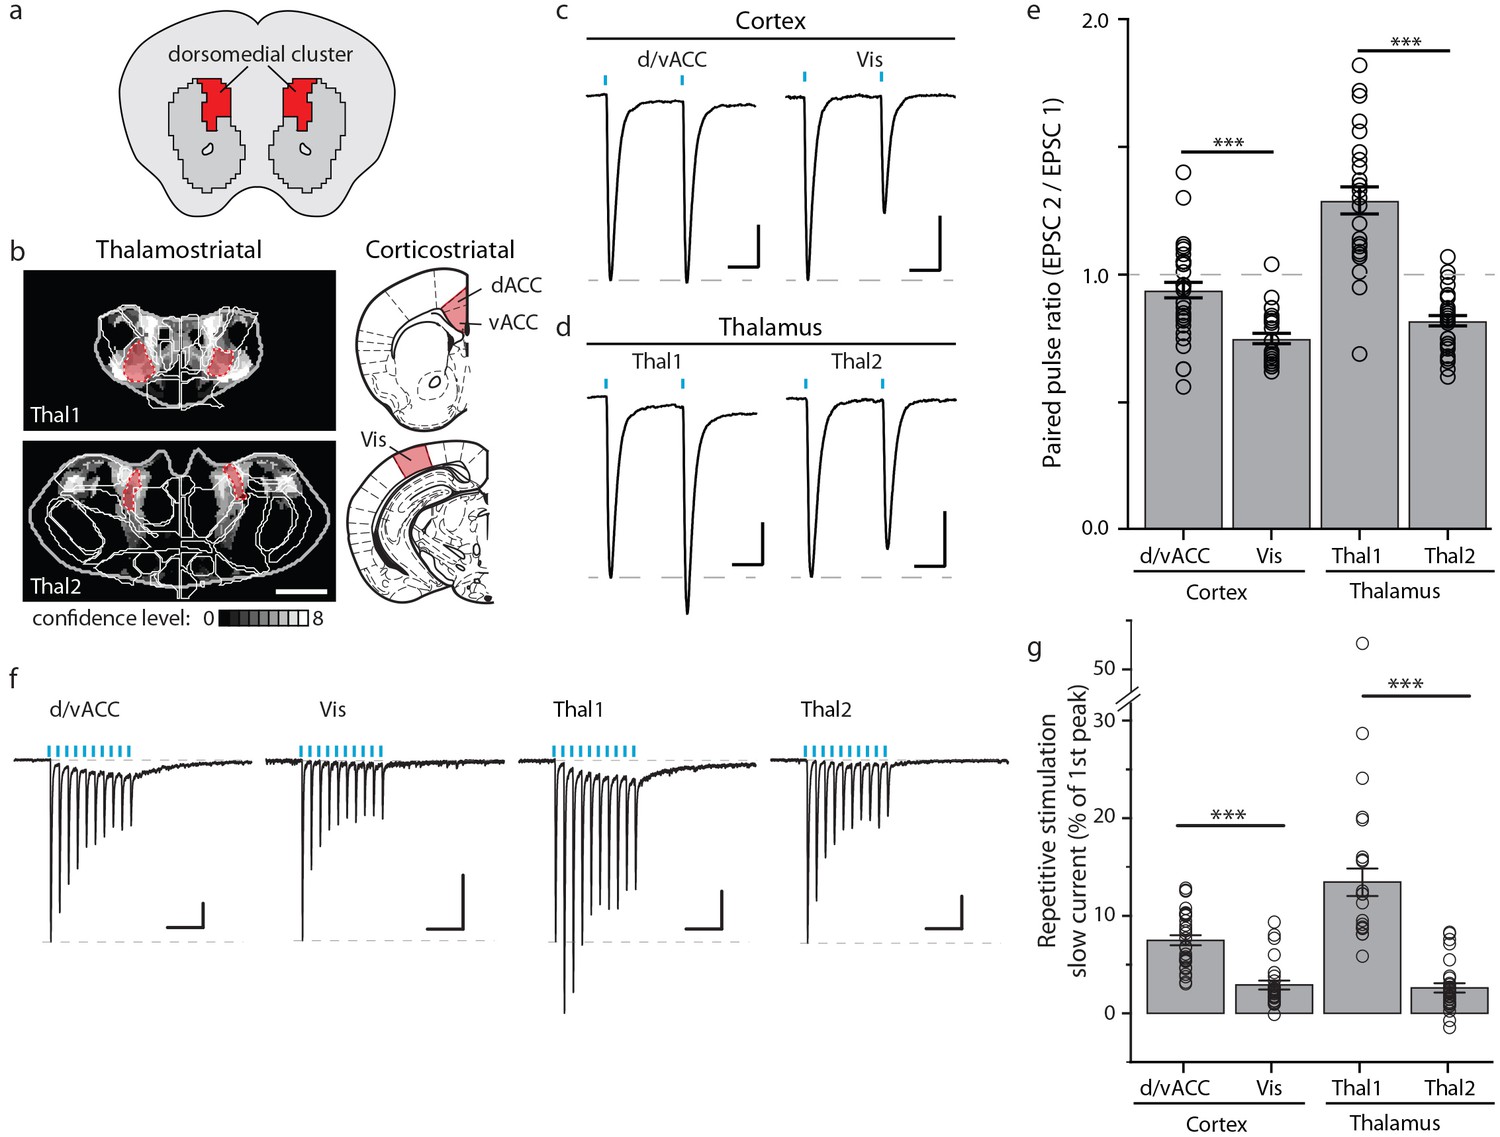
Optogenetic stimulation of cortico- and thalamo-striatal inputs converging on the DM striatal subdivision reveals functional heterogeneity.
(a) Schematic representation of the DM striatal subdivision shown in red, as presented in Figure 5d. (b) The DM subdivision was identified by the convergence of thalamostriatal inputs originating from thalamic centers 1 (Thal1) and 2 (Thal2) (two left panels, respectively), based on the thalamostriatal confidence maps with the thalamic nucleus (white lines) fully encompassed by each center, shaded red (gray scale shows the confidence level as determined in Figure 4), and corticostriatal inputs originating from the d/vACC and Vis (shaded red, two right panels, PMBA). The red areas indicate the targets for viral injections. (c) Example traces of paired-pulse EPSCs recorded in MSNs within the DM striatal subdivision, elicited by photostimulation of specific corticostriatal inputs. (d) Example traces of paired-pulse EPSCs recorded in MSNs within the DM striatal subdivision, elicited by photostimulation of specific thalamostriatal inputs. (e) Quantification of paired-pulse ratio (PPR) evoked by photostimulation of specific cortico- and thalamo-striatal inputs reveals strong differences in PPR (n(d/vACC) = 34, n(Vis) = 26, n(Thal1) = 25, n(Thal2) = 32 cells, Kruskal-Wallis test, H = 60.8699, df = 3, p<0.0001; post-hoc Dunn’s test, Bonferonni-corrected p=0.0002) between distinct thalamic nuclei and distinct cortical subregions (post-hoc Dunn’s test, Bonferroni-corrected, ***p<0.001). (f) Example traces of repetitive photostimulation (20 Hz, 10 stimuli represented by blue lines) of the four cortico- and thalamo-striatal afferents. (h) Quantification of the slow current during repetitive photostimulation, relative to EPSC peak evoked by the first stimulus (***p<0.0001). Thal1, thalamic center 1; Thal2, thalamic center 2. Group data are presented as mean ± SEM.
Figure 8—figure supplement 1
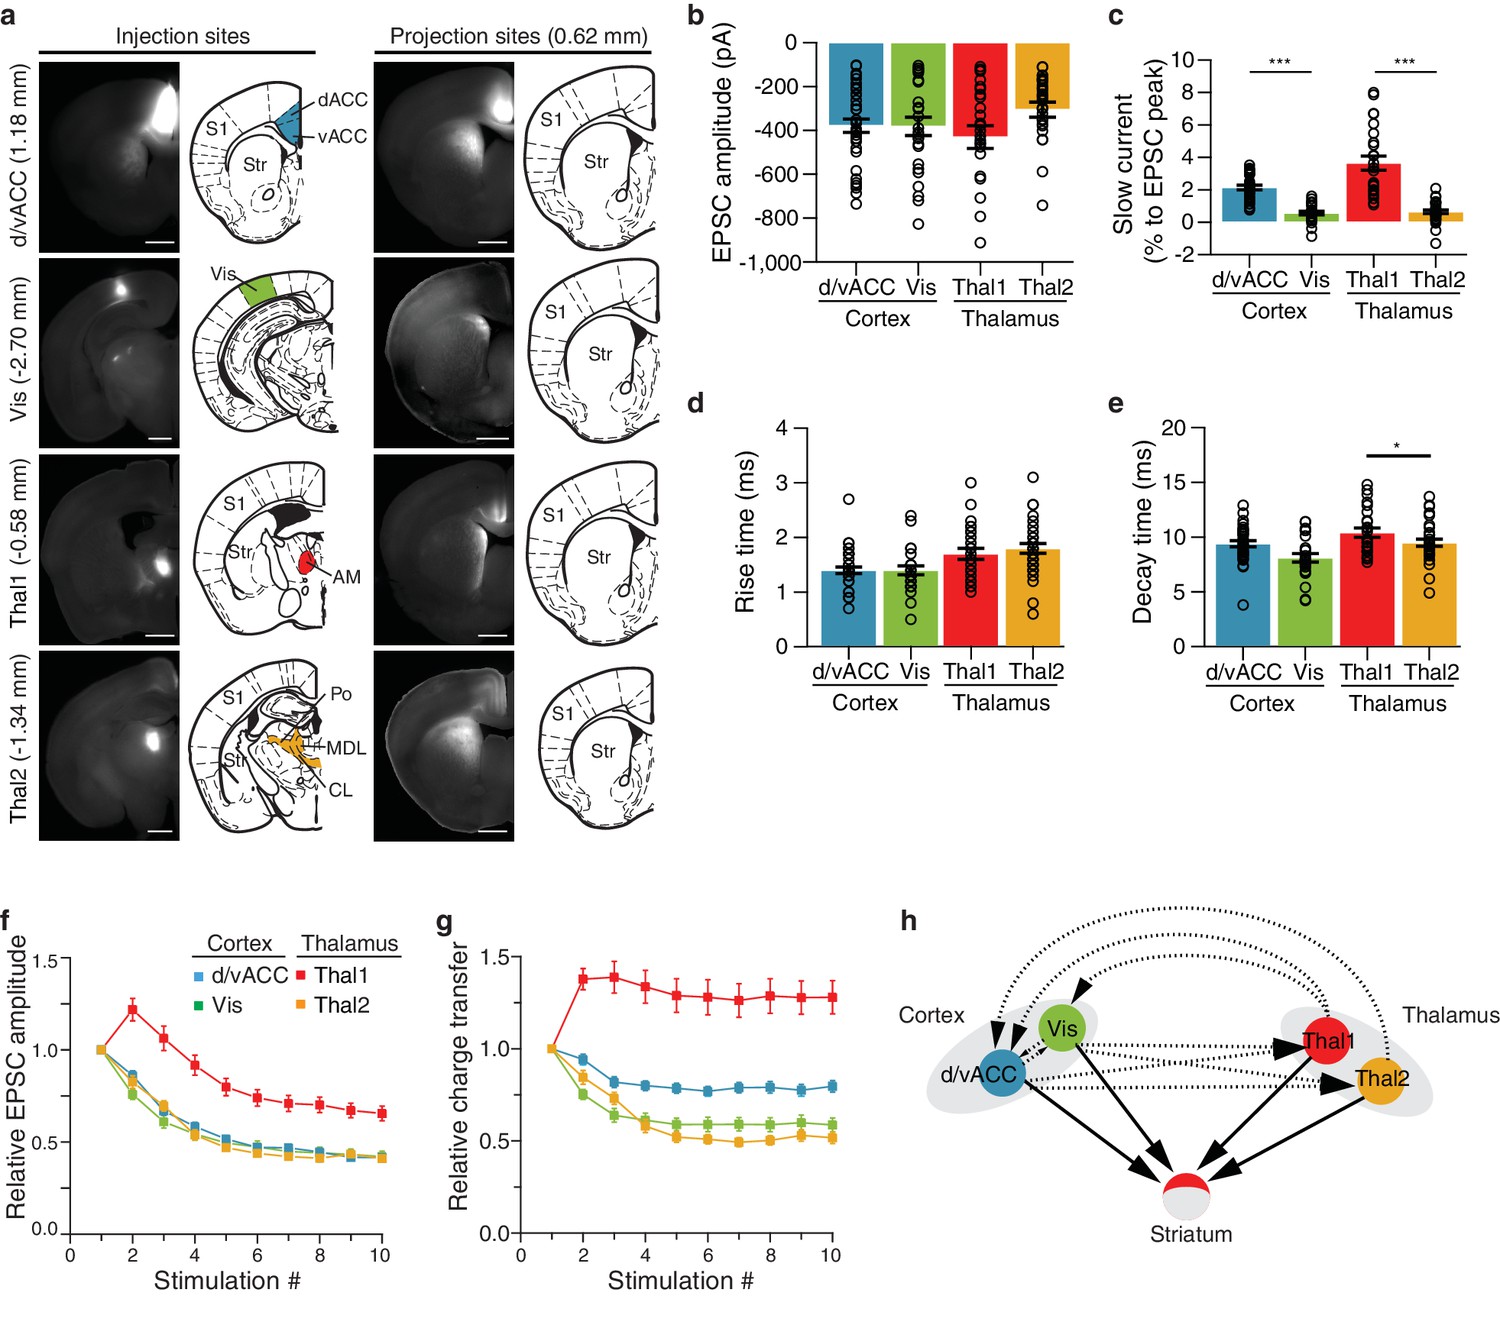
Characterization of functional differences between and within individual cortico- and thalamostriatal inputs to the dorsomedial (DM) striatum.
(a) Example injection sites (left column) in dorsal and ventral anterior cingulate cortex (d/vACC), visual cortex (Vis), thalamic center 1 (Thal1), and thalamic center 2 (Thal2); example projection sites (right column) within the DM striatum, shown with corresponding sections from Paxinos Mouse Brain Atlas (PMBA, [Paxinos and Franklin, 2001]). Injection of channelrhodopsin CsChR2-GFP of Thal1 infected the anteromedial thalamic nucleus (AM), whereas injection of Thal2 mainly infected centrolateral thalamic nucleus (CL) together with a portion of the posterior thalamic nucleus (Po), and the lateral part of the mediodorsal thalamic nucleus (MDL). The value in parentheses represents the distance from bregma, with positive value anterior to bregma. S1, primary somatosensory cortex; Str, striatum. Scale bars represent 1 mm. (b–e) Quantification of excitatory postsynaptic current (EPSC) amplitude (b, p>0.05), slow current relative to EPSC peak (c, p<0.0001), rise time (d, p<0.05), and decay time (e, p<0.0001). (f) Quantification of relative EPSC amplitude over 10 consecutive stimuli, normalized to EPSC amplitude evoked by the first stimulus (p<0.0001, main effect of injection site: Thal1 vs. Thal2, p<0.0001; d/vACC vs. Vis, p>0.05). (g) Quantification of the EPSC charge transfer evoked by each stimulus, normalized to the charge transfer evoked by the first stimulus (p<0.0001, main effect of injection site: Thal1 vs. Thal2, p<0.001; vACC vs. Vis, p<0.01). (h) Schematic representation of the two cortical subregions and two thalamic centers converging to the DM (arrows with solid lines) with suggested region specific connectivity based on previous work (arrows with dotted lines). Statistical comparisons between cortical or thalamic afferents are marked *p<0.05, ***p<0.001.
Author response image 1
Tables
Table 1
Abbreviations.
Cortical plate derived subregions | |||
| Abbreviation | Expanded name | AMBA Location | PMBA Location |
| AI/GI/DI | agranular, granular, dysgranularinsular cortex | AI (all subregions) + GU + VISC | AI + DI + GI |
| Aud | auditory cortex | AUD (all subregions) | Au1 + AuD + AuV |
| Amyg | amygdala | BLA+ BMA | BLA + BMP |
| dACC | dorsal anterior cingulate cortex | ACAd | Cg1 |
| FrA | frontal association cortex | FRP + MOs (bregma 2.4 to 3.1 mm) | FrA |
| IL | infralimbic cortex | ILA | IL |
| LO | lateral orbital cortex | ORBl | LO + DLO |
| M1/2 | motor cortex | MO (all subregions, excluding FrA) | M1 +M2 |
| MO | medial orbital cortex | ORBm | MO |
| Piri | piriform cortex | PIR | Pir |
| PrL | prelimbic cortex | PL | PrL |
| Ptl | parietal association cortex | PTL (all subregions) | MPtA + LPtA + PtPR + PtPD |
| Rhi | ecto-/peri-/ento-rhinal cortex | ECT + ENT + PERI | Ect + Ent + PRh + Lent |
| Rsp | retrosplenial cortex | RSP (all subregions) | RSA + RSG |
| S1/2 | somatosensory cortex | SS (all subregions) | S1 (all subregions) + S2 |
| Sub | hippocampal subiculum | SUB (all subregions) + CA1 | S (all subregions) |
| Tem | temporal association cortex | TEa | TeA |
| vACC | ventral anterior cingulate cortex | ACAv | Cg2 |
| Vis | visual cortex | VIS (all subregions) | V1 + All visual subregions |
| VO | ventral orbital cortex | ORBvl | VO |
Thalamic nuclei | |||
| Abbreviation | Expanded name | AMBA Location | PMBA Location |
| AD | anterodorsal nucleus | AD | AD |
| AM | anteromedial nucleus | AMd + AMv | AM + AMV |
| AV | anteroventral nucleus | AV | AV + AVDM + AVVL |
| CL | centrolateral nucleus | CL | CL |
| CM | centromedial nucleus | CM | CM |
| IAD | interanterodorsal nucleus | IAD | IAD |
| IAM | interanteromedial nucleus | IAM | IAM |
| IMD | intermediodorsal nucleus | IMD | IMD |
| LD | laterodorsal nucleus | LD | LD + LDVL + LDDM |
| LG | lateral geniculate nucleus | LG (LGd + LGv + IGL) | VLG + DLG + VLG + IGL |
| LP | lateral posterior nucleus | LP | LP + LPLR + LPMP + LPMC |
| MD | mediodorsal nucleus | MD (MDl + MDm + MDc) | MDC + MDL + MDM |
| MG | medial geniculate nucleus | MG (MGm + MGv + MGd) | MGD + MGV + MGM |
| PCN | paracentral nucleus | PCN | PC + OPC |
| Pf | parafascicular nucleus | PF | Pf |
| Po | posterior nucleus | PO | Po |
| PR | perireuniens nucleus | PR | vRe |
| PT | parataenial nucleus | PT | PT |
| PVT | paraventricular nucleus | PVT | PVA + PV |
| Re | reuniens nucleus | RE | Re |
| RH | rhomboid nucleus | RH | Rh |
| RT | reticular nucleus | RT | Rt |
| SM | submedius nucleus | SMT | Sub |
| VAL | ventral anterior-lateral complex | VAL | VA + VL |
| VM | ventromedial nucleus | VM | VM |
| VPL | ventral posterolateral nucleus | VPL + VPLpc | VPL + VPLpc |
| VPM | ventral posteromedial nucleus | VPM + VPMpc | VPM + VPMpc |
Other | |||
| Abbreviation | Expanded name | ||
| AIBS | Allen Institute for Brain Science | ||
| PMBA | Paxinos Mouse Brain Atlas | ||
| AMBA | AIBS Mouse Brain Atlas | ||
| DM | dorsomedial | ||
| D-V | dorsal to ventral | ||
| A-P | anterior to posterior | ||
| M-L | medial to lateral | ||
| NAc | nucleus accumbens | ||
| VL | lateral ventricle | ||
| Gpi | globus pallidus internal segment | ||
| SNr | substantia nigra pars reticulata | ||
| Gpe | globus pallidus external segment | ||
| cc | corpus callosum | ||
| MSN | medium spiny neurons | ||
Additional files
-
Supplementary file 1
AIBS viral injections included.
The file includes the list of the cortical injections from AIBS that have passed our manual inspection using the criteria described in Materials and methods.
- https://doi.org/10.7554/eLife.19103.028
Download links
A two-part list of links to download the article, or parts of the article, in various formats.
Downloads (link to download the article as PDF)
Open citations (links to open the citations from this article in various online reference manager services)
Cite this article (links to download the citations from this article in formats compatible with various reference manager tools)
A comprehensive excitatory input map of the striatum reveals novel functional organization
eLife 5:e19103.
https://doi.org/10.7554/eLife.19103


