Establishment and stability of the latent HIV-1 DNA reservoir
- Karolinska Institute, Sweden
- Max Planck Institute for Developmental Biology, Germany
- Stockholm South General Hospital, Sweden
- Karolinska University Hospital, Sweden
Figures
Figure 1

Sampling times before and after start of suppressive antiretroviral therapy.
For each study participant, the thick grey bar indicates the period of untreated HIV-1 replication. Circles indicate the collection times of the plasma samples used for whole genome deep sequencing of the HIV-1 RNA populations (Zanini et al., 2015). Triangles and squares indicate the collection times of the PBMC samples used for p17gag deep sequencing of the HIV-1 DNA populations. All times are relative to start of therapy.
Figure 2 with 3 supplements

Reconstructed phylogenetic trees of plasma HIV-1 RNA sequences (circles) and PBMC HIV-1 DNA (triangles and squares) from two patients.
The RNA sequences were obtained from plasma samples collected before the start of suppressive antiretroviral therapy (ART). DNA sequences 1, 2, and 3 were obtained from PBMCs collected after many years of suppressive ART (see Figure 1). The symbol colors indicate the sample date relative to the start of therapy and use the same color scale as in Figure 1. The symbol size indicates the fraction of reads represented by the node. The trees were built using the FastTree software (see Materials and methods section) (Price et al., 2010). Analogous phylogenetic trees for the remaining eight study patients are presented in Figure 2—figure supplement 1.
Figure 2—figure supplement 1
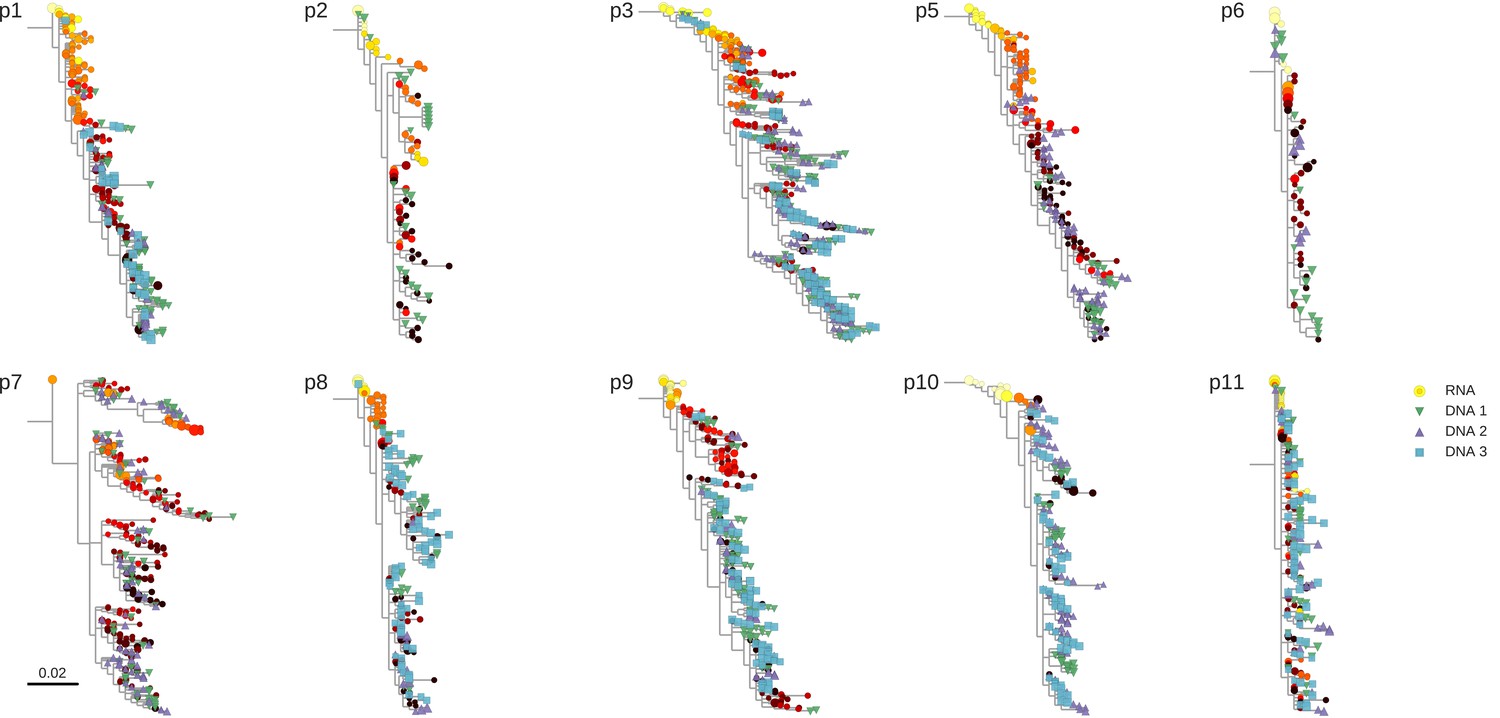
Phylogenetic trees of plasma HIV-1 RNA and PBMC HIV-1 DNA sequences from all patients included in the study.
https://doi.org/10.7554/eLife.18889.005
Figure 2—figure supplement 2
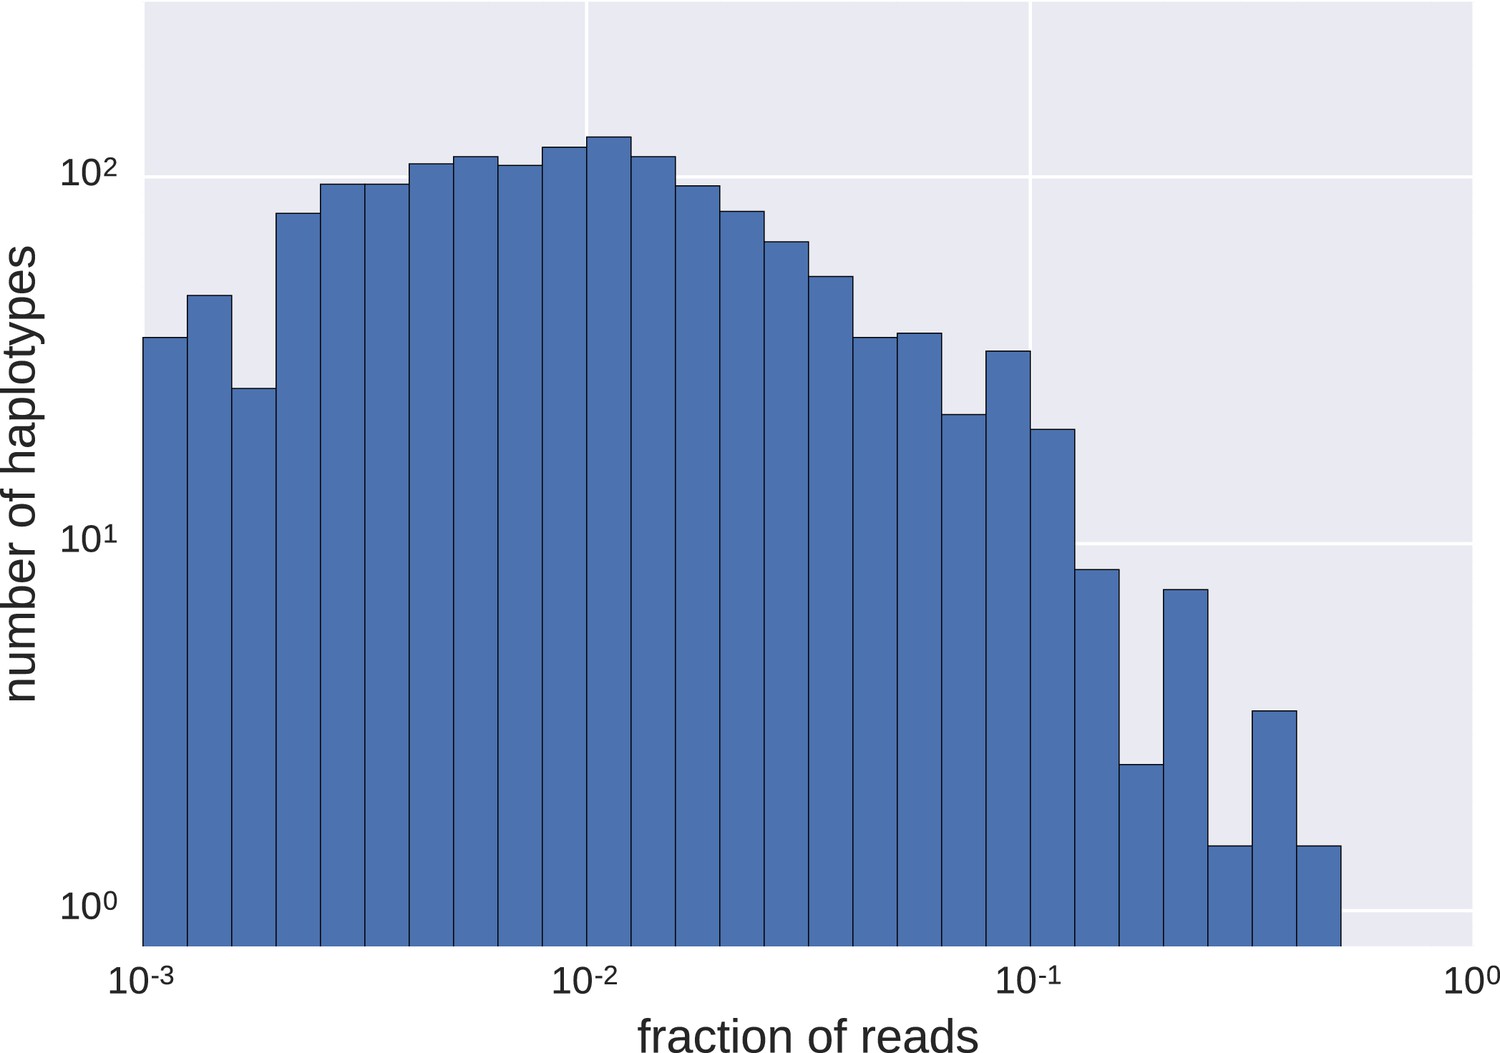
Distributions of frequencies of haplotypes.
We found a wide variation in haplotype frequencies (measured by fraction of reads), from <0.001 to >0.5. Most of the haplotypes were present at frequencies of approximately 0.01 (note the logarithmic scales).
Figure 2—figure supplement 3

Distributions of mutations in reads classified as hypermutanted or as non-hypermutated.
https://doi.org/10.7554/eLife.18889.007
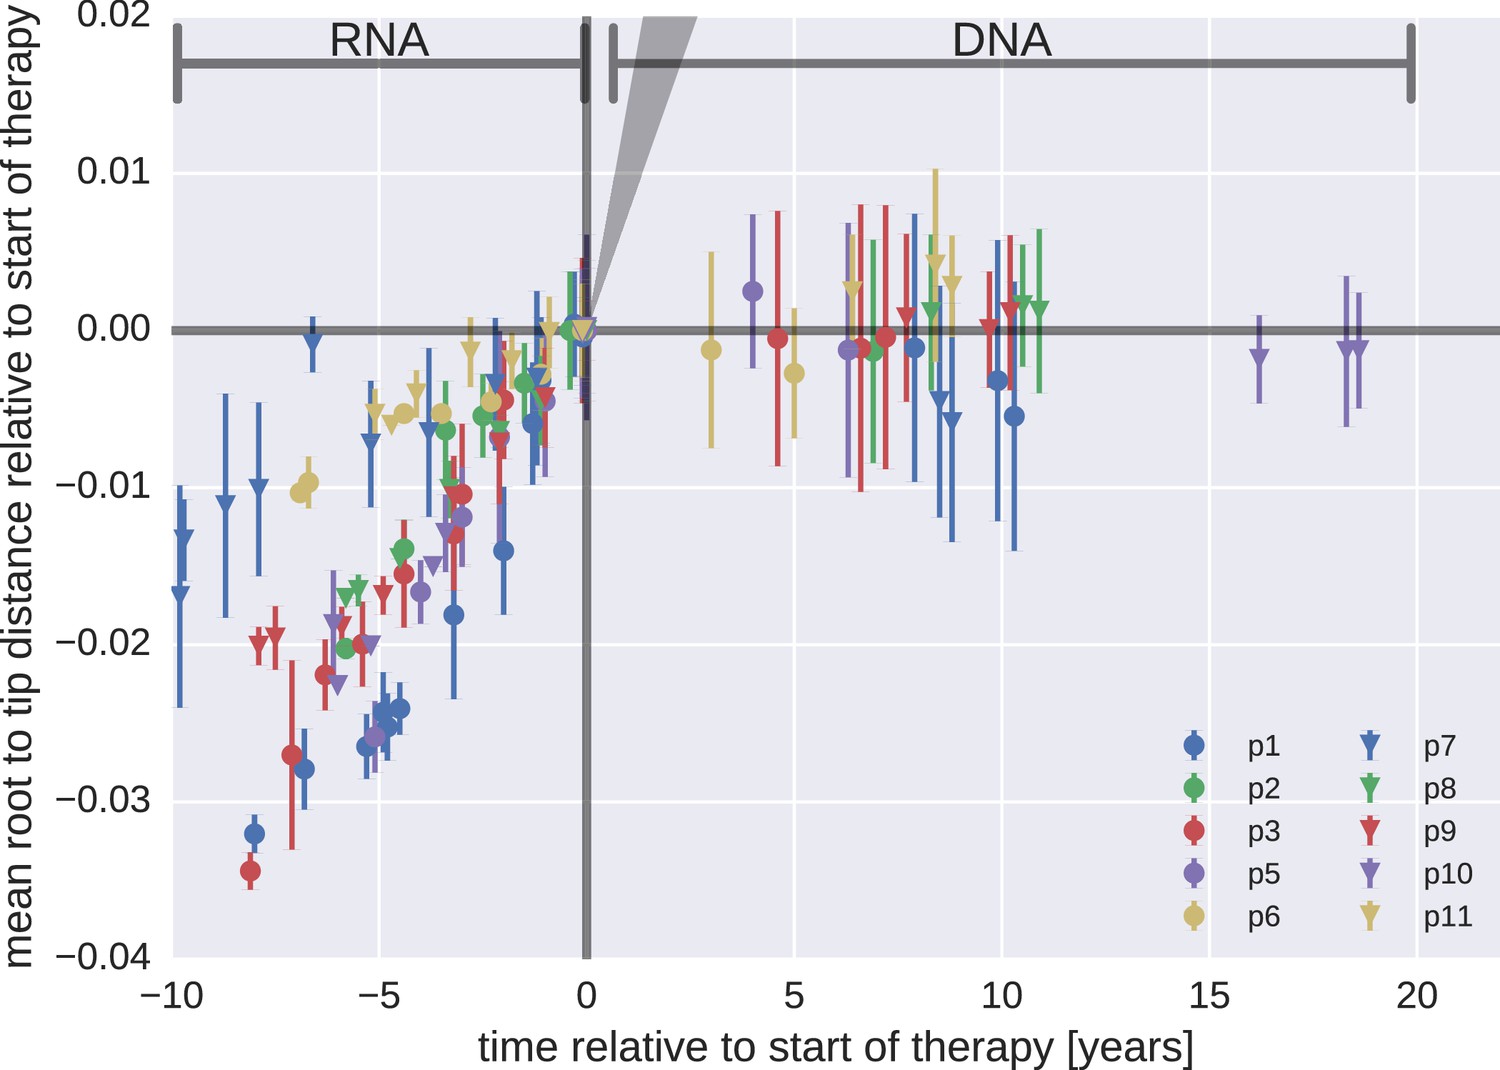
Figure 3 with 3 supplements
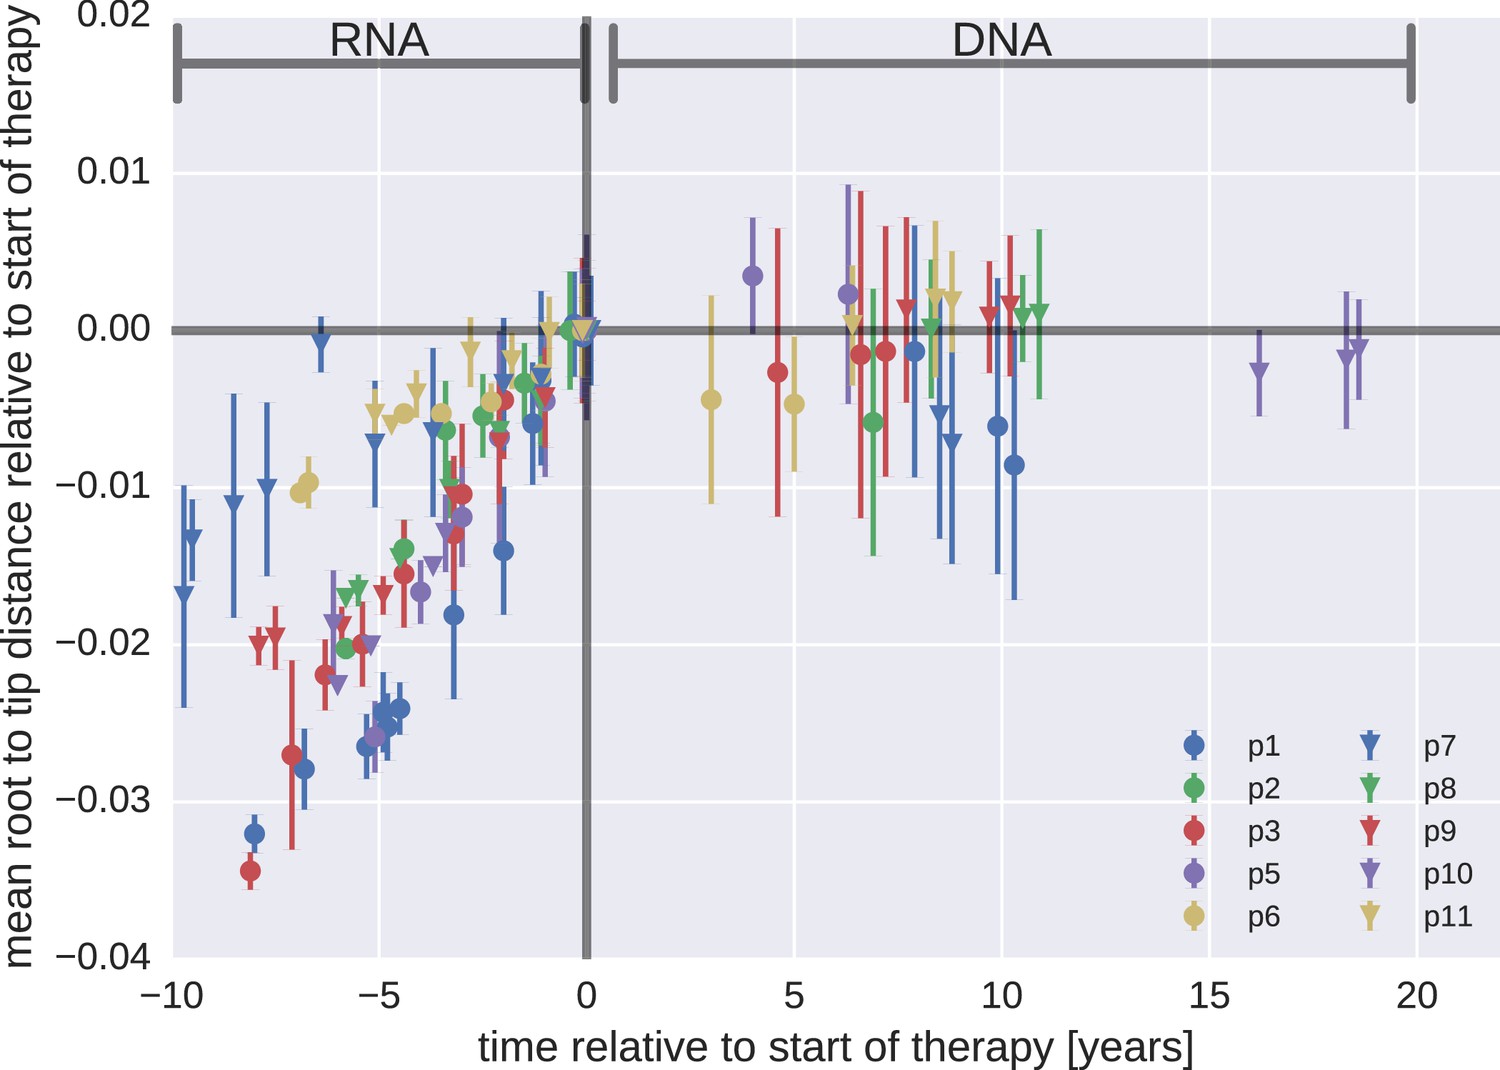
Root-to-tip distances.
The plasma HIV-1 RNA sequences evolved steadily before the start of antiretroviral therapy (ART), while no evidence of evolution was found in the PBMC HIV-1 DNA sequences obtained after the start of ART. For each patient, we have samples obtained before or at the start of therapy (HIV-1 RNA from plasma), and samples obtained after the start of therapy (HIV-1 DNA from PBMCs). The error bars indicate ± one standard deviation of the root-to-tip distances. The figure contains data on DNA sequences not classified as hypermutants. The analogous figures for the hypermutants and haplotypes are presented in Figure 3—figure supplements 1 and 2, respectively.
Figure 3—figure supplement 1
Mean root-to-tip distances for plasma HIV-1 RNA sequences obtained before the start of ART and PBMC HIV-1 DNA sequences obtained after the start of ART.
This figure is analogous to Figure 3 in the main text, but presents root-to-tip distance values for DNA sequences classified as hypermutants. The root-to-tip distances of the hypermutant HIV-1 DNA sequences were approximately 2 and 4% greater than the non-hypermutant sequences from the same samples, but the root-to-tip distances did not change over time.
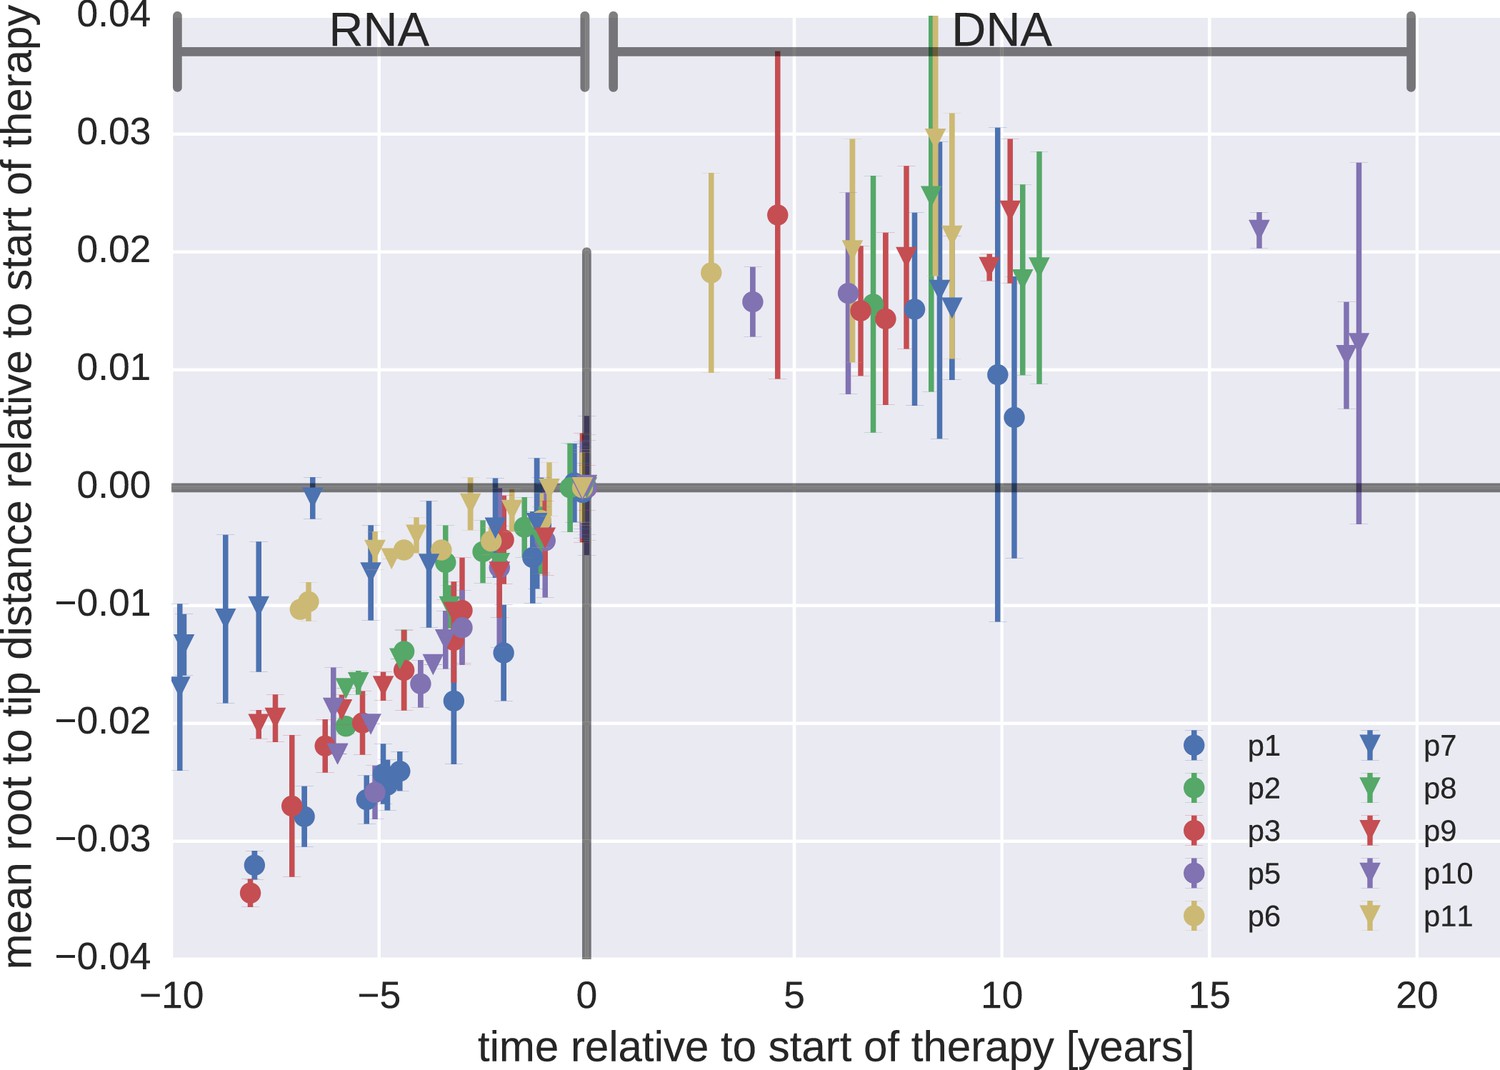
Figure 3—figure supplement 2
Mean root-to-tip distances for plasma HIV-1 RNA sequences obtained before the start of antiretroviral therapy (ART) and PBMC HIV-1 DNA sequences obtained after the start of ART.
This figure is analogous to Figure 3 in the main text. Instead of weighing each sequence by its number of reads, each sequence was counted only once. The two approaches yielded similar results. The grey cone in the upper right quadrant indicates the rate of evolution during suppressive therapy estimated by Lorenzo-Redondo et al. (2016).
Figure 3—figure supplement 3
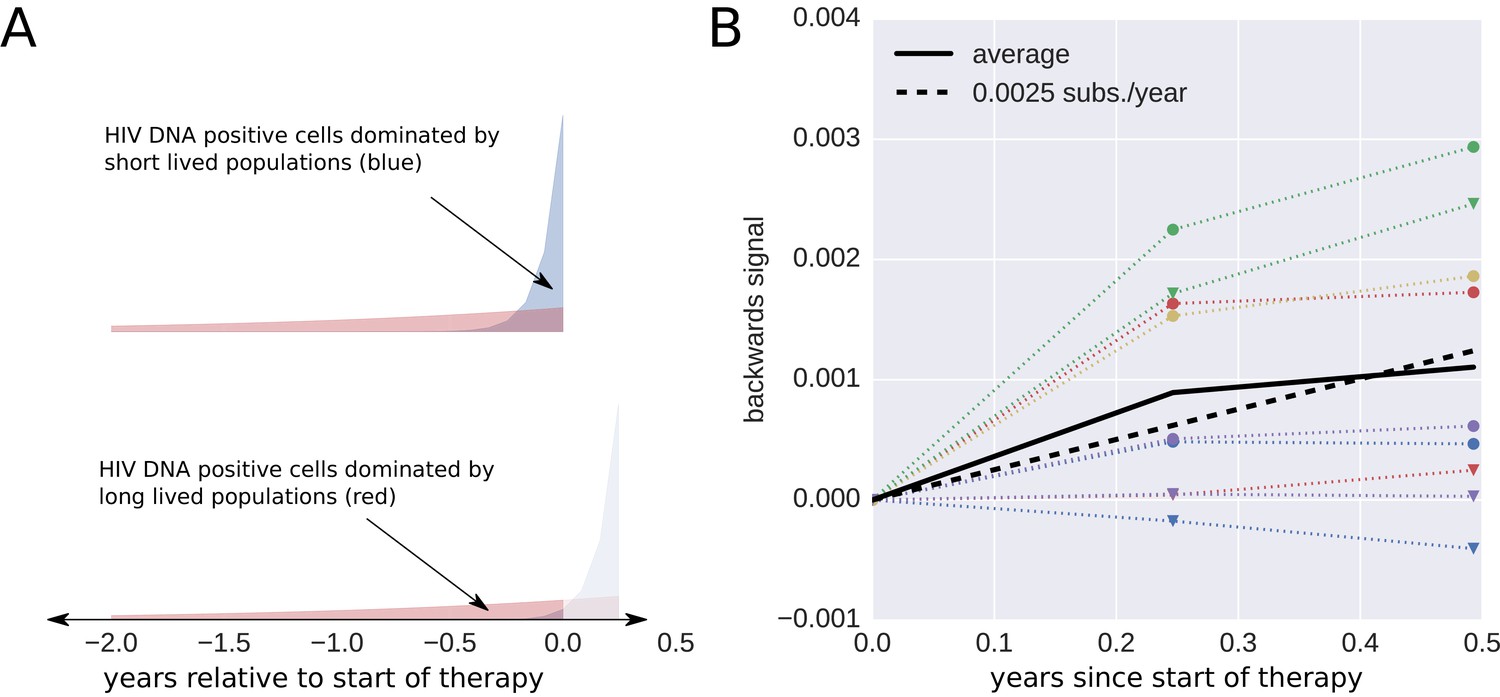
Short lived cells can generate a false signal of evolution.
HIV-1 DNA from cell samples taken at the initiation of antiretroviral therapy (ART) will be dominated by virus variants that have very recently infected short-lived cells (blue). The short-lived cells will die within a few months of therapy, and the HIV-1 DNA will be dominated by infected cells with longer life spans (red). The HIV-1 DNA in these cells will contain a larger fraction of sequences corresponding to virus that replicated earlier during the course of the infection. This shift in the cell populations can result in a false signal of evolution (Panel B). This illustration assumes that 90% of the infected cells were short-lived (half-life of 21 days). The remaining 10% of the cells were assigned a half-life of 350 days. To mimic the HIV-1 DNA samples obtained from the cells sampled at 0, 3, and 6 months after initiation of ART (the sampling times used by Lorenzo-Redondo et al. (2016), we randomly sampled sequences obtained from the HIV-1 RNA present before treatment (distribution illustrated in panel A). From these sequences, we calculated the apparent divergence of the pseudo-samples at 3 and 6 months from the pseudo-sample taken when the ART was started. There was large variation in this backward evolution signal among patients. Averaged over patients, the observed shift corresponded to a rate of evolution of 0.0025 substitutions per year.
Figure 4 with 2 supplements
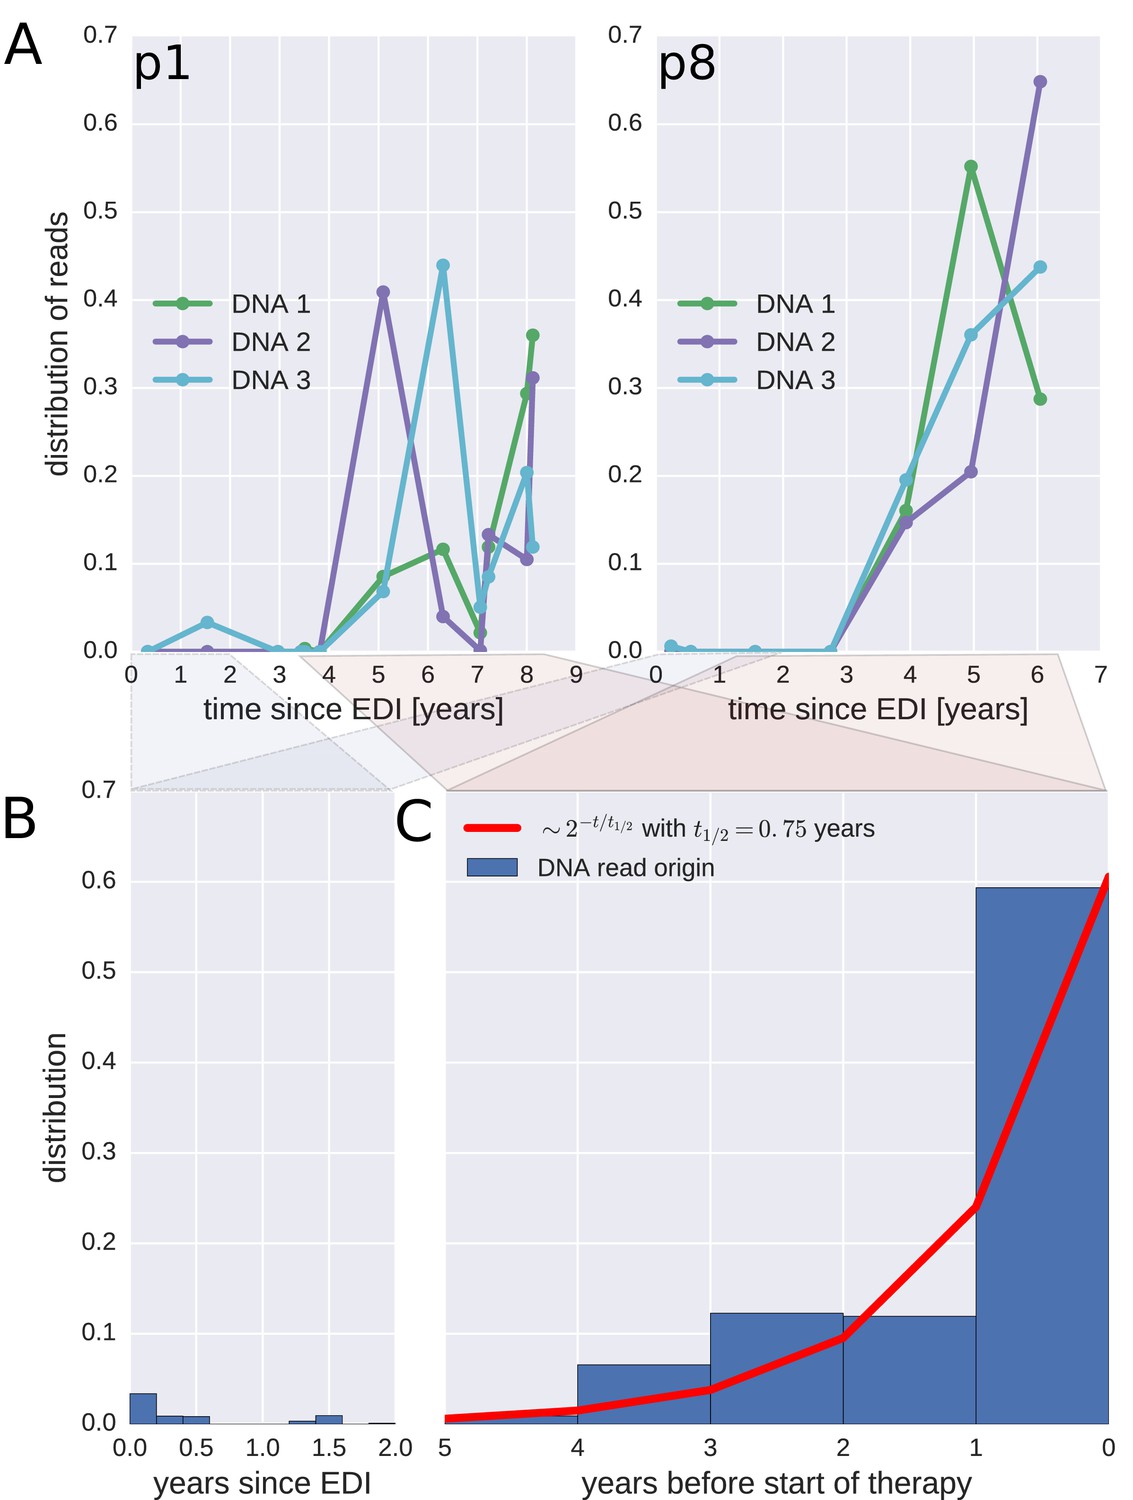
Probable origin of sequences in the DNA reservoir.
For each HIV-1 DNA read obtained from the PBMCs, we determined the pre-treatment plasma sample and HIV-1 RNA variant that was the most likely origin of the read. Panel A presents the results for the distribution of these pre-treatment assignments for HIV-1 DNA reads from the three PBMC samples (DNA 1, 2, and 3) of patients p1 and p8 (compare trees in Figure 2). The analogous graphs for all patients are presented in Figure 4—figure supplement 1. A large fraction of the reservoir DNA sequences was most closely related to the RNA sequences present in the plasma samples obtained during the last year before the start of therapy. Panels B and C present summaries of the results for the distributions of the likely origins of the reservoir reads for all samples as a function of time since estimated date of infection (EDI) and time before treatment start, respectively. The distribution of reads decays with the time from treatment start (half-life of approximately 0.75 years) (Panel C). A small fraction of reads was estimated to originate from plasma samples obtained shortly post-infection (Panel B). We found these early reservoir sequences in 50% of the patients.
Figure 4—figure supplement 1
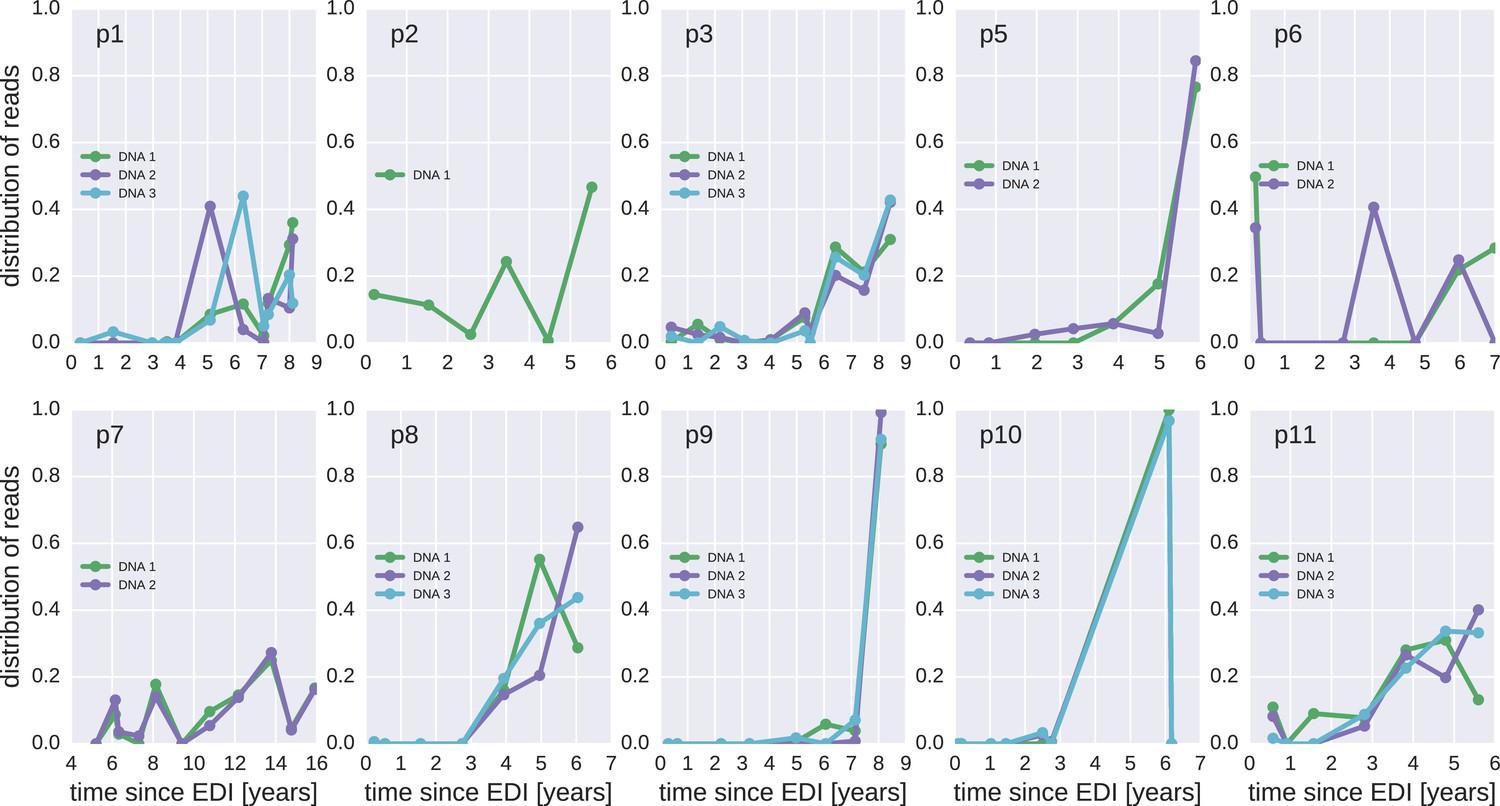
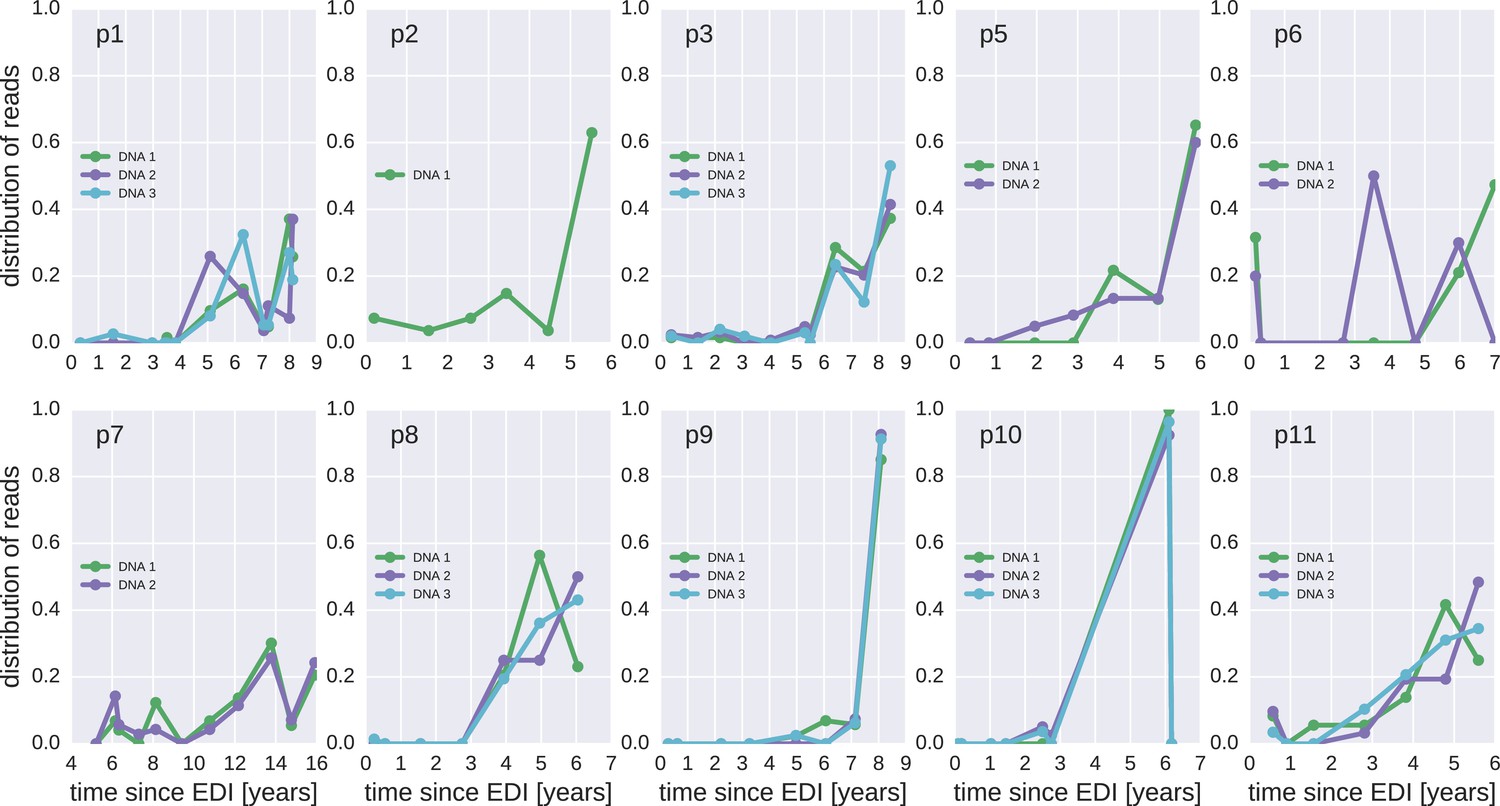
The distribution of plausible seeding times of reservoir HIV-1 DNA sequences for all 10 patients.
For each HIV-1 DNA read obtained from the PBMCs, the plasma sample and HIV-1 RNA variant from which the read was most likely derived was determined. The plots present the distributions of these most likely origin samples across all available RNA samples.
Figure 4—figure supplement 2
Same as Figure 4—figure supplement 1, but counting each sequence once instead of weighted by the number of reads it represents.
https://doi.org/10.7554/eLife.18889.015Tables
Table 1
Summary of patient characteristics.
| Patient | Gender | Transmission | Subtype | Age* | HIV RNA from plasma | HIV DNA from PBMCs | |||
|---|---|---|---|---|---|---|---|---|---|
| # samples | First/last since EDI† | Time on ART† | # templates | ||||||
p1 | F | HET | 01_AE | 37 | 12 | 0.3 | 8.2 | 7.9/9.9/10.4 | 820/148/38 |
p2 | M | MSM | B | 32 | 6 | 0.2 | 5.5 | 6.9 | 75 |
p3 | M | MSM | B | 52 | 10 | 0.4 | 8.4 | 4.6/6.7/7.2 | 243/102/108 |
p5 | M | MSM | B | 38 | 7 | 0.4 | 5.9 | 4.0/6.3 | 180/72 |
p6 | M | HET | C | 31 | 7 | 0.2 | 7.0 | 3.0/5.0/5.5 | 115/15/nd |
p7 | M | MSM | B | 31 | 11 | 6.3‡ | 16.1 | 6.3/8.4/8.8 | 88/279/108 |
p8 | M | MSM | B | 35 | 7 | 0.2 | 6.0 | 8.4/10.6/10.9 | 180/55/175 |
p9 | M | MSM | B | 32 | 8 | 0.3 | 8.1 | 7.7/9.7/10.2 | 60/72/72 |
p10 | M | MSM | B | 34 | 9 | 0.1 | 6.2 | 16.2/18.3/18.6 | 249/116/51 |
p11 | M | MSM | B | 53 | 7 | 0.6 | 5.6 | 6.4/8.4/8.8 | 124/120/123 |
-
*at diagnosis;
-
†EDI: estimated date of infection; all times are given in years;
-
‡sequencing failed in earlier samples due to low plasma HIV-1 RNA levels.
Table 2
Rates of evolution in plasma HIV-1 RNA and PBMC HIV-1 DNA sequences obtained before the start and after the start of suppressive antiretroviral therapy, respectively.
| Patient | RNA rate | DNA rate | ||
|---|---|---|---|---|
| [Year−1] | p-value | [Year−1] | p-value | |
| p1 | 4.4 × 10⁻³ | <10−6 | −6 × 10⁻⁴ | 0.22 |
| p2 | 3.7 × 10⁻³ | <10−2 | −8 × 10⁻⁴ | – |
| p3 | 4.1 × 10⁻³ | <10−6 | −2 × 10⁻⁴ | 0.39 |
| p5 | 4.8 × 10⁻³ | <10−3 | 4 × 10⁻⁴ | 0.45 |
| p6 | 1.4 × 10⁻³ | <10−3 | −9 × 10⁻⁴ | 0.22 |
| p7 | 1.3 × 10⁻³ | <10−2 | −7 × 10⁻⁴ | 0.14 |
| p8 | 2.9 × 10⁻³ | <10−5 | 8 × 10⁻⁵ | 0.22 |
| p9 | 2.6 × 10⁻³ | <10−4 | 1 × 10⁻⁴ | 0.12 |
| p10 | 3.6 × 10⁻³ | <10−5 | −1 × 10⁻⁴ | 0.20 |
| p11 | 1.2 × 10⁻³ | <10−2 | 2 × 10⁻⁴ | 0.16 |
Additional files
-
Supplementary file 1
Sequencing and hypermutation statistic for all samples.
'good' refers to proviral sequences that are not obviously defective, 'hyper' refers to those with an excess of G→A mutations. The column '% recaptured' indicates the fraction of sequences >1% frequency that were present in other samples from the same patient.
- https://doi.org/10.7554/eLife.18889.016
-
Supplementary file 2
PCR primers used for HIV-1 p17gag amplification.
- https://doi.org/10.7554/eLife.18889.017
Download links
A two-part list of links to download the article, or parts of the article, in various formats.
Downloads (link to download the article as PDF)
Open citations (links to open the citations from this article in various online reference manager services)
Cite this article (links to download the citations from this article in formats compatible with various reference manager tools)
Establishment and stability of the latent HIV-1 DNA reservoir
eLife 5:e18889.
https://doi.org/10.7554/eLife.18889


