Human Nup98 regulates the localization and activity of DExH/D-box helicase DHX9
- University of Alberta, Canada
- University of California, United states
Figures
Figure 1
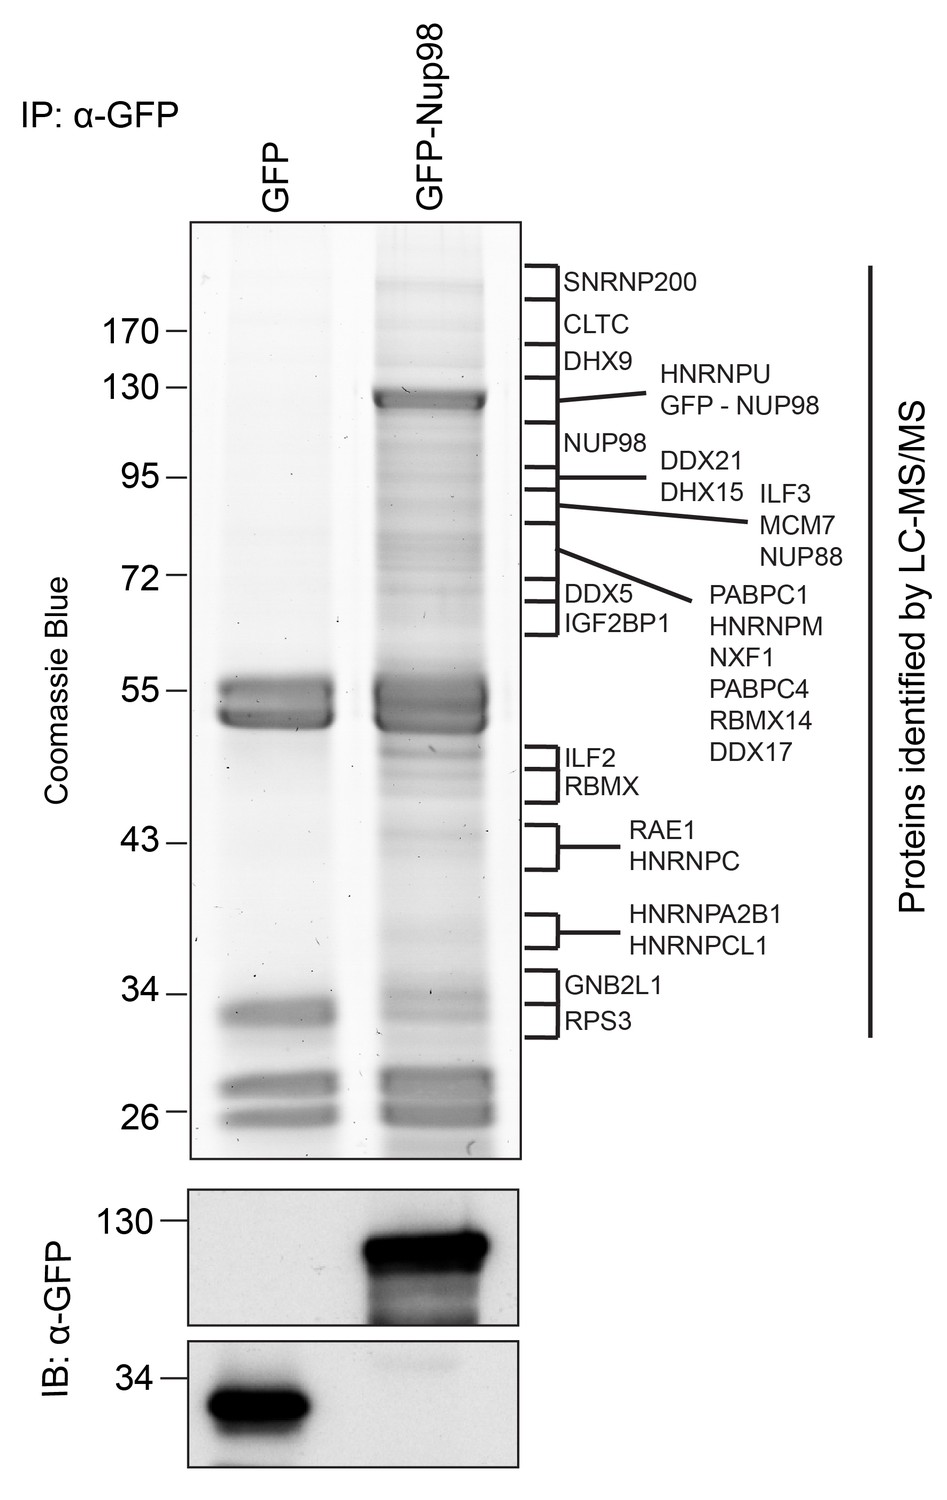
Identification of Nup98-interacting proteins.
Plasmids encoding GFP-Nup98 or GFP alone were transfected into HEK293T cells. These proteins were immunoprecipitated from whole cell lysates using an antibody directed against GFP. Co-immunoprecipitated proteins were analyzed by SDS-PAGE and gel pieces containing regions of interest were analyzed by LC-MS/MS to identify proteins co-immunoprecipitated with GFP-Nup98. Western blotting of these fractions using anti-GFP antibodies confirmed the presence of GFP and GFP-Nup98 (bottom panel). Protein species indicated on the right of the gel represent those producing peptides most frequently identified by LC-MS/MS in the GFP-Nup98 immunoprecipitated fractions. The positions of molecular mass markers (shown in kDa) are indicated on the left.
Figure 2 with 1 supplement
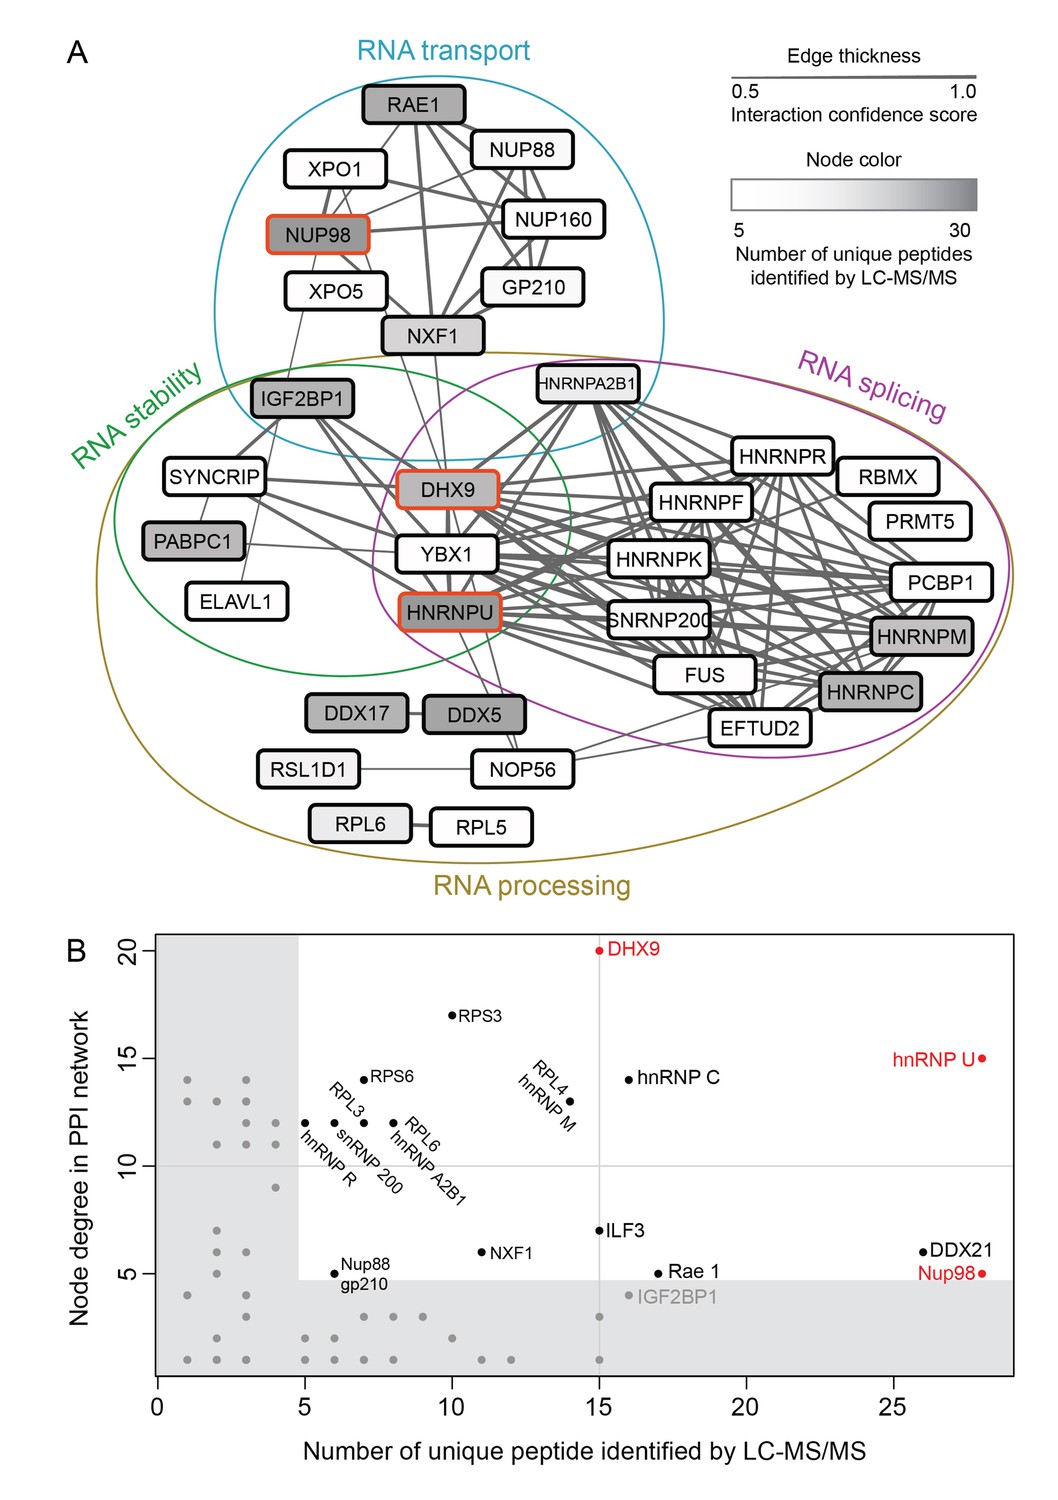
Nup98 protein-protein interaction network identified by IP-MS.
(A) Curated protein-protein interactions (PPI) among identified Nup98 binding partners are represented in a PPI network. Edge thickness indicates the confidence score for the interaction and node color indicates abundance of the interactor in the GFP-Nup98 immunoprecipitation. Biological functions of identified protein complexes are indicated in the colored Venn diagram superimposed on the network. Nup98, DHX9 and hnRNP U are indicated by a red border. (B) Nup98 interactors were prioritized based on their degree of interconnection and the number of unique peptides identified by MS. In the scatterplot, node degree in the PPI network (y-axis) identifies hubs in the GFP-Nup98 PPI network, while the number of unique peptides (x-axis) reflects the abundance of the indicated protein in the purified GFP-Nup98 protein complex. Nup98 and its interactors DHX9 and hnRNP U are shown in red.
Figure 2—figure supplement 1
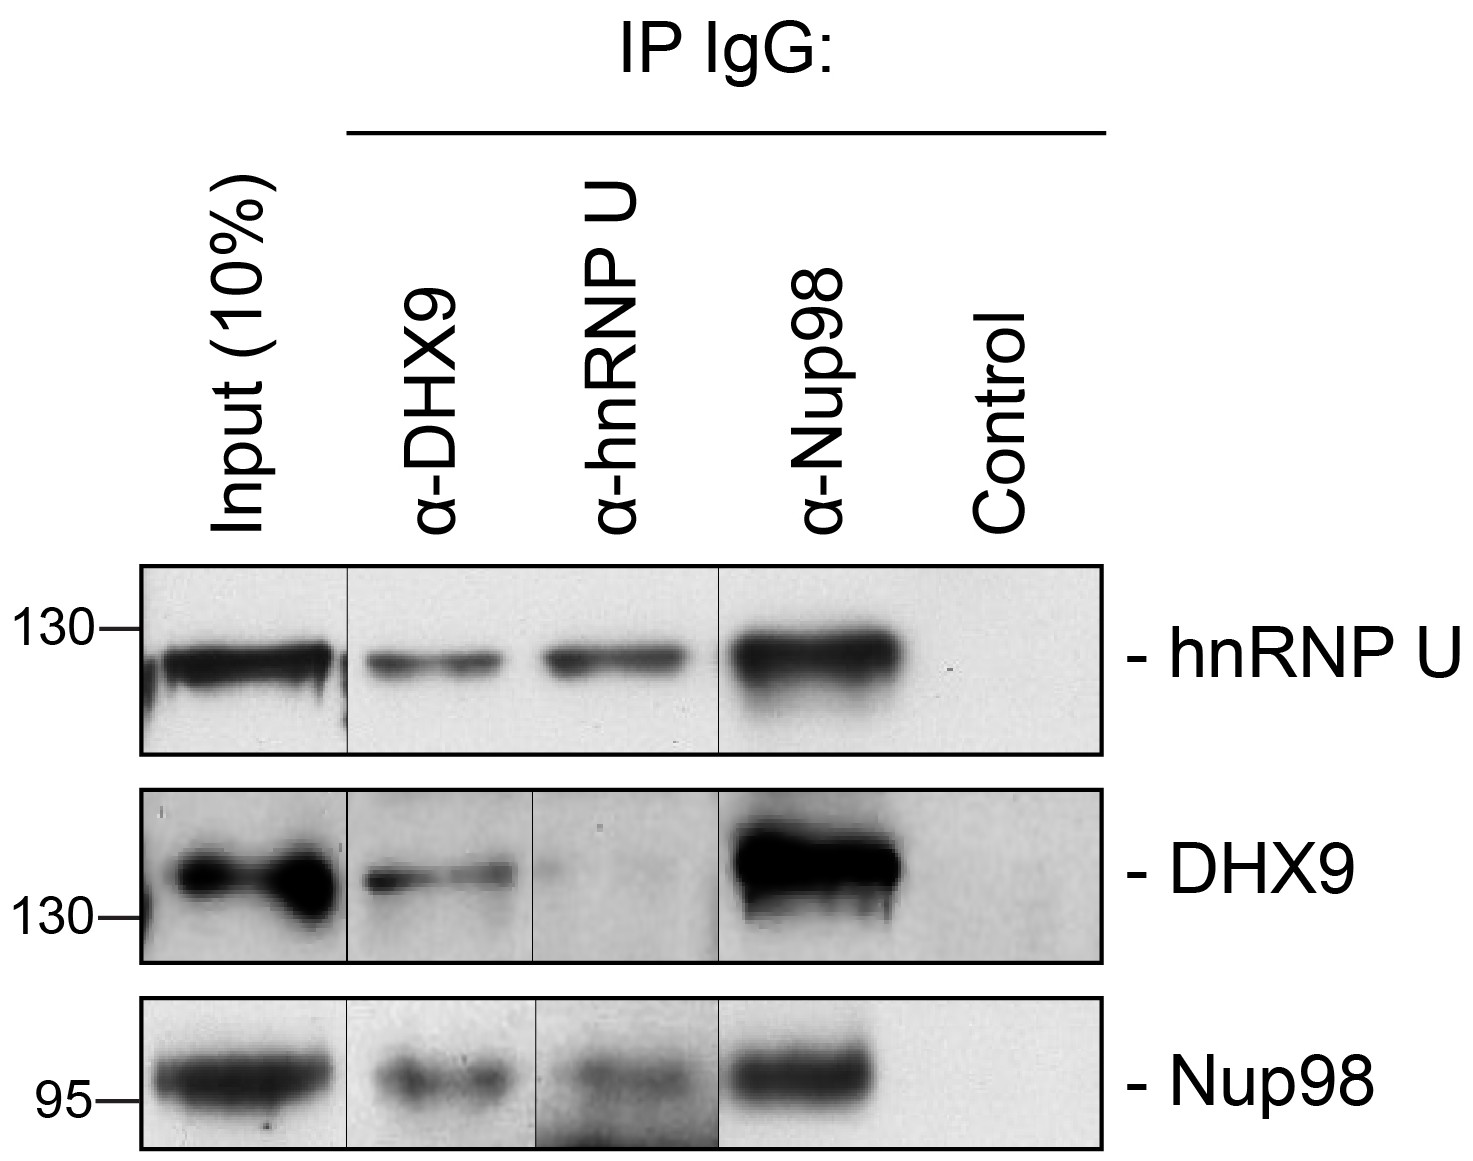
Immunoprecipitation of endogenous Nup98 with DHX9 and hnRNP U.
Endogenous DHX9, hnRNP U, and Nup98 were immunoprecipitated from whole cell lysates (Input) using specific antibodies as indicated above the panels. Anti-GFP antibodies were used to assess nonspecific binding (Control). Immuno-purified proteins were analyzed by western blotting using antibodies against the target proteins as indicated on the right. The positions of molecular mass markers (shown in kDa) are indicated on the left.
Figure 3
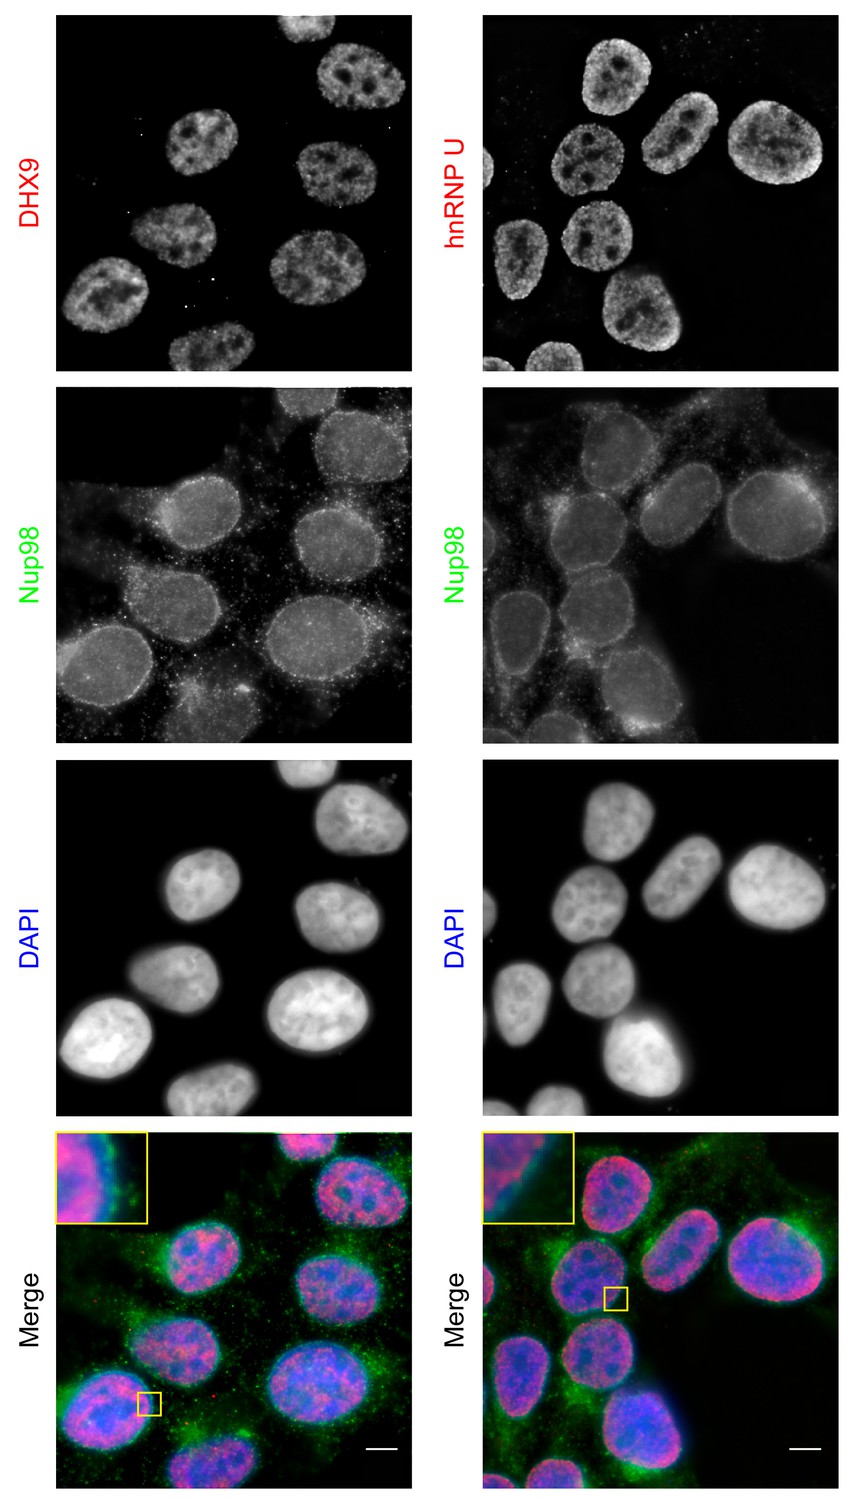
Localization of Nup98 with DHX9 and hnRNP U.
The cellular distribution of Nup98, DHX9, and hnRNP U in HEK293T cells was examined by indirect immunofluorescence using antibodies directed against each protein as indicated. The positions of nuclei were determined using the DNA stain DAPI. Merged images showing DHX9 or hnRNP U (red), Nup98 (green), and DAPI-stained DNA (blue) are shown. Note, DHX9 and hnRNP U are partially excluded from the nucleoli, which exhibits reduced DAPI staining. Scale bars, 5 µm.
Figure 4 with 2 supplements
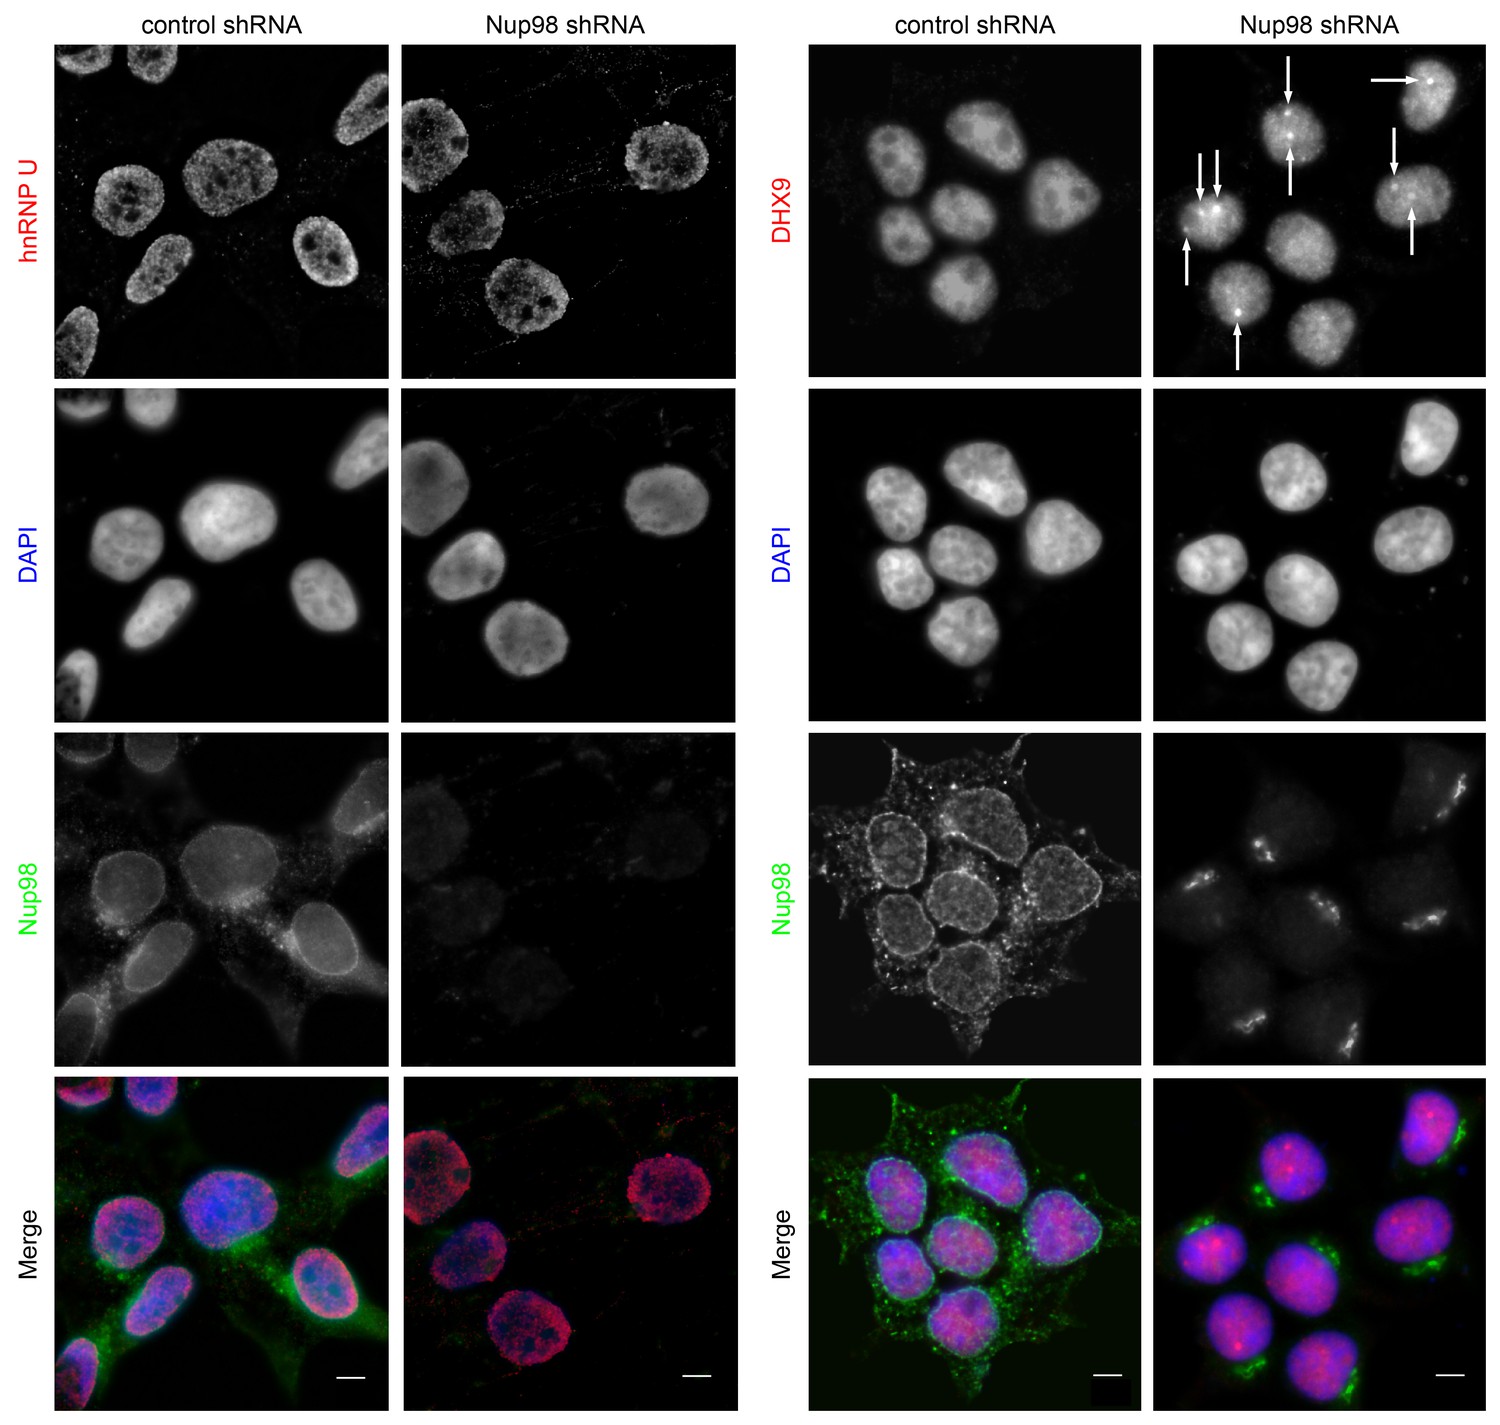
Nup98 depletion alters the intranuclear distribution of DHX9, but not hnRNP U.
HEK293T cells were transfected with shRNA targeting Nup98 or with a control shRNA. Four days later the cellular distributions of Nup98 and either DHX9 or hnRNP U were examined by indirect immunofluorescence. Cells depleted of Nup98 show partial relocation of DHX9 into intranuclear foci (white arrows). Merged images show DHX9 or hnRNP U (red), Nup98 (green), and DAPI-stained DNA (blue). Scale bars, 5 µm. The cellular localization of Nup98 is not affected by depletion of DHX9 (see Figure 4—figure supplement 1). Protein depletion in these experiments was confirmed by immunoblot analysis (Figure 4—figure supplement 2).
Figure 4—figure supplement 1

DHX9 depletion does not alter Nup98 localization in the cell.
HEK293T cells were transfected with a control shRNA or an shRNA targeting DHX9. Four days later the cellular distribution of Nup98 and DHX9 were examined by indirect immunofluorescence. Merged images show DHX9 (red), Nup98 (green), and DAPI stained DNA (blue). Scale bars, 5 µm. Protein depletion in these experiments was confirmed by immunoblot analysis (Figure 4—figure supplement 2).
Figure 4—figure supplement 2
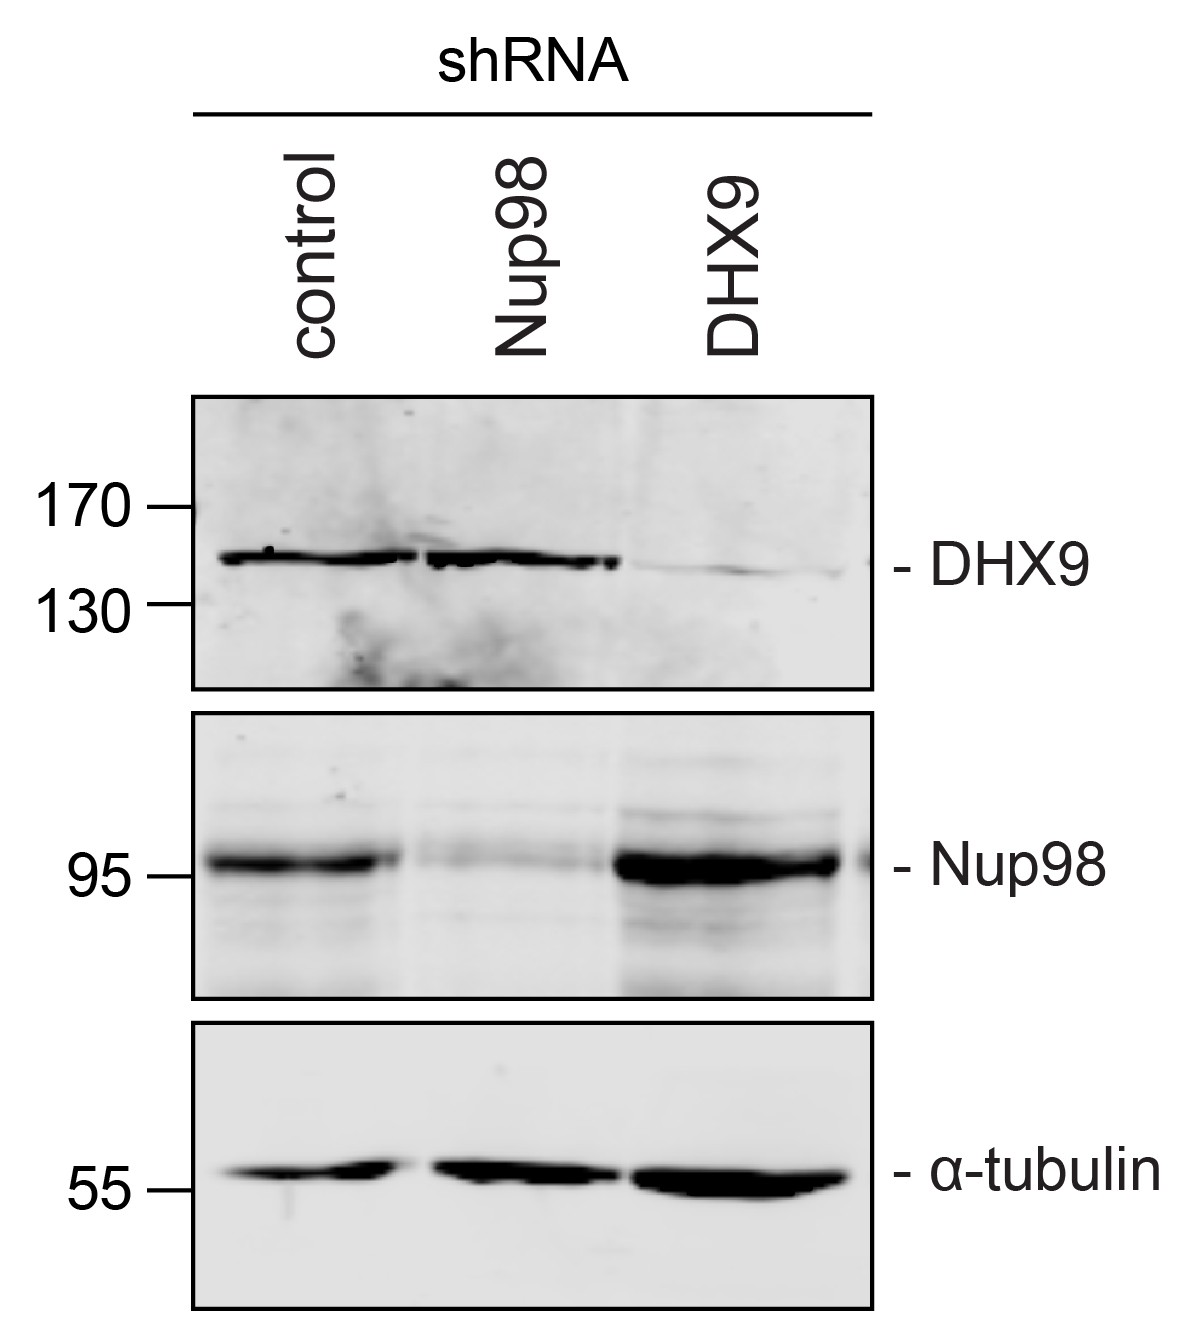
Immunoblotting of cell extracts following shRNA-mediated protein depletion.
Four days after shRNA transfection, lysates from cells depleted of the indicated protein (listed above top panel) were analyzed by western blotting using antibodies directed against Nup98, DHX9, and α-tubulin (load control) as indicated to the right of the panels. Corresponding immunofluorescence images are shown in Figure 4 and Figure 4—figure supplement 1. The positions of molecular mass markers (shown in kDa) are indicated on the left.
Figure 5 with 3 supplements
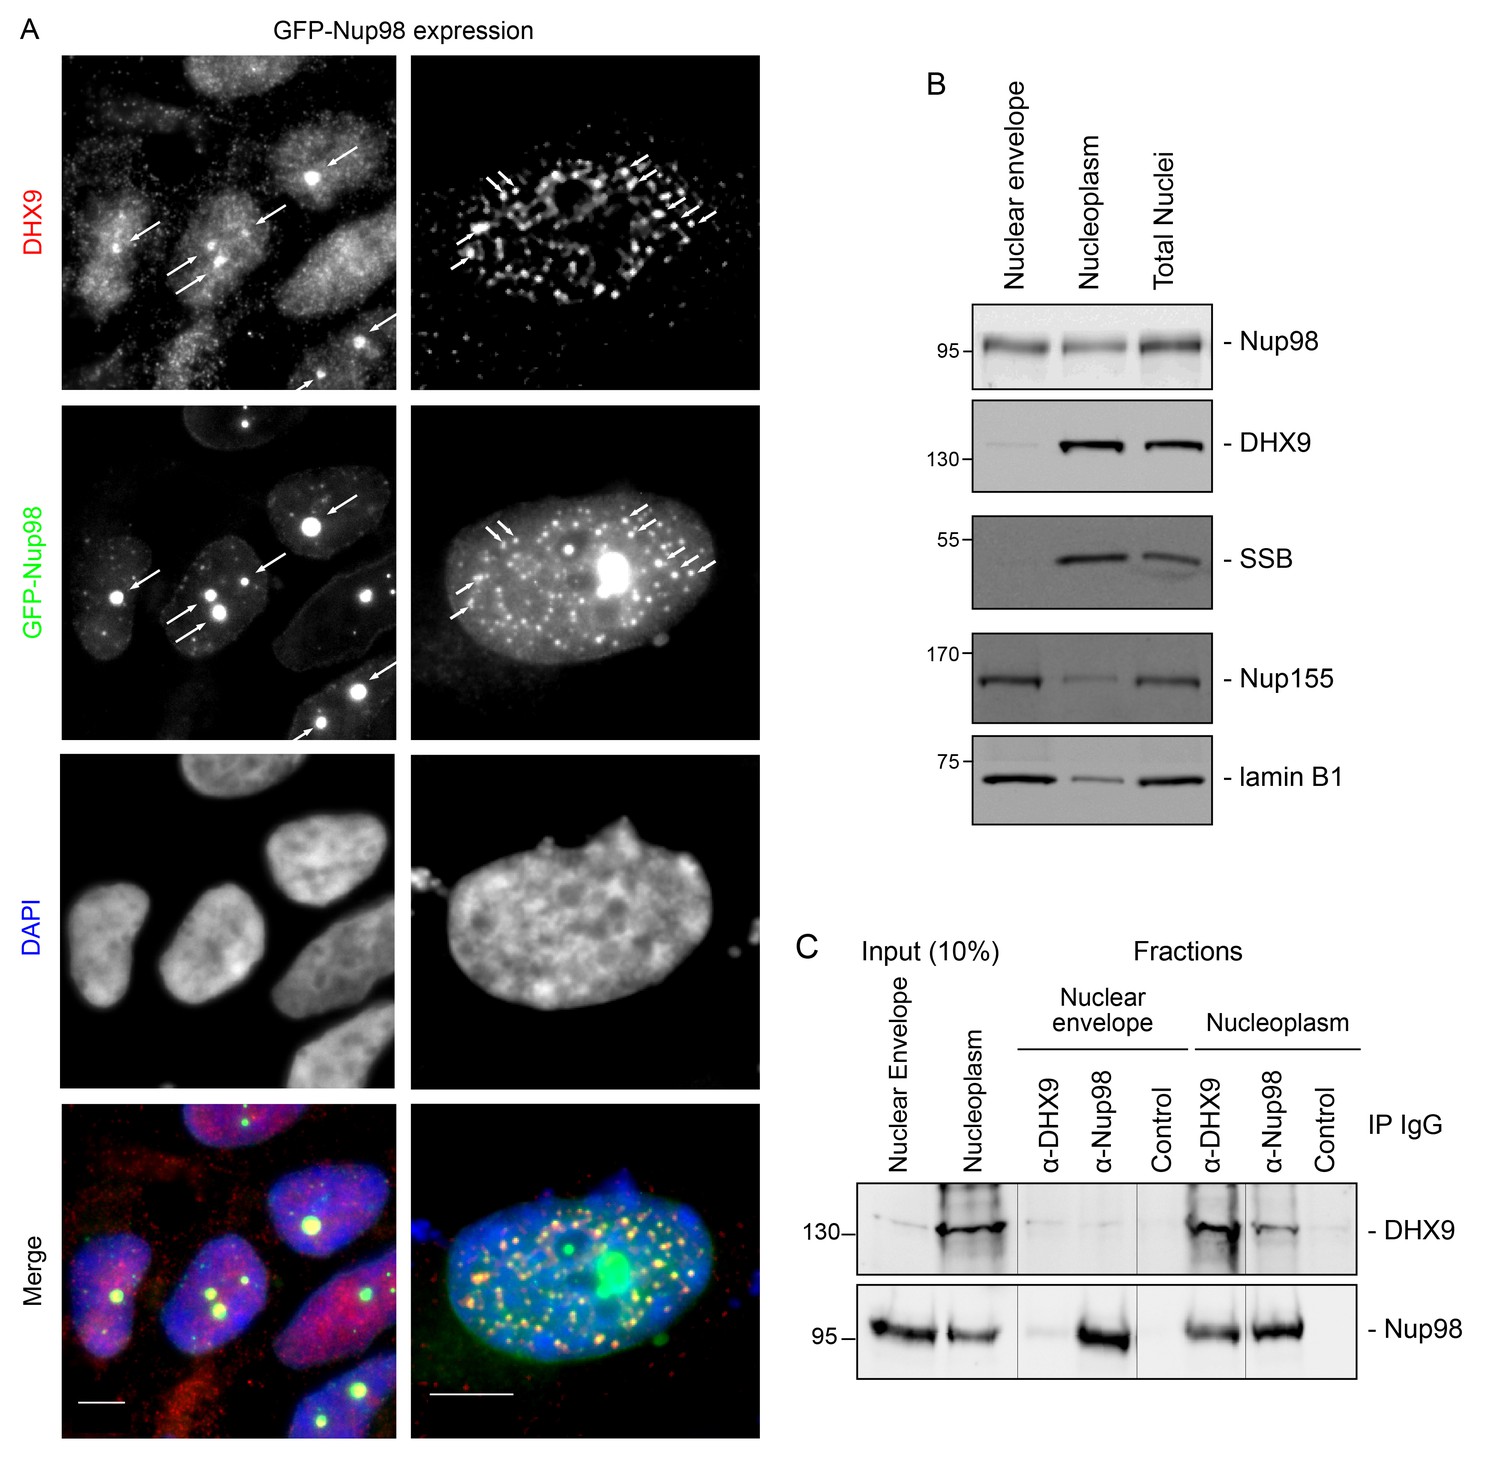
DHX9 interacts with intranuclear Nup98.
(A) HEK293T cells expressing GFP-NUP98 were used to compare DHX9 and GFP-Nup98 localization by immunofluorescence microscopy. Two magnifications are shown, each showing that upon GFP-NUP98 expression intranuclear GFP-Nup98-containing foci form that contain DHX9. Examples of GFP-Nup98 colocalization with DHX9 are marked by arrows. Cells expressing higher levels of GFP-NUP98 (right column) contain greater numbers of GFP-Nup98 foci and display even more pronounced DHX9 colocalization. Merged images show DHX9 (red), GFP-Nup98 (green), and DAPI-stained DNA (blue). Scale bars, 5 µm. In contrast, expression of GFP had no effect on DHX9 localization, and expressing GFP or GFP-NUP98 had no impact on hnRNP U localization (Figure 5—figure supplement 1). The presence of GFP-Nup98 was confirmed by immunoblot (Figure 5—figure supplement 2). (B) HeLa cell nuclei were fractionated to produce nucleoplasmic and nuclear envelope fractions. Fractions were analyzed by western blotting using antibodies directed against the indicated proteins (right). The positions of molecular mass markers (shown in kDa) are indicated on the left. The fractionation procedure was evaluated by western blotting using antibodies directed against NE (lamin B and Nup155) and nucleoplasmic (SSB) proteins. (C) Nup98 or DHX9 were immunoprecipitated from nucleoplasmic and NE fractions derived from HeLa cell nuclei. Co-purifying proteins from the samples indicated above the panels were separated by SDS-PAGE and analyzed by immunoblotting to detect DHX9 and Nup98 as specified to the right of the panels. The positions of molecular mass markers (shown in kDa) are indicated on the left.
Figure 5—figure supplement 1
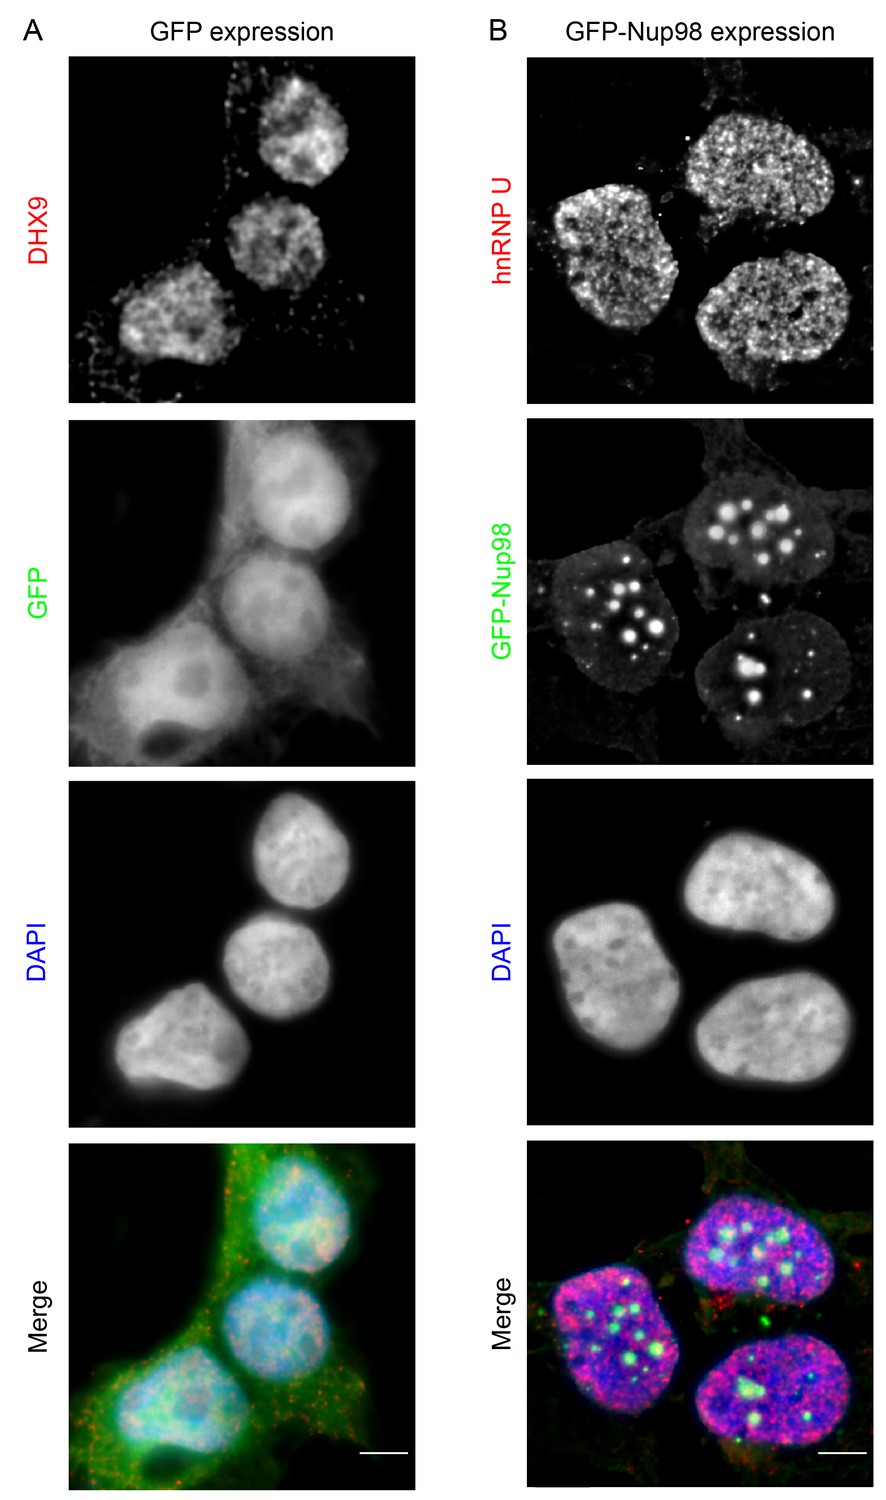
GFP expression does not alter the localization of DHX9, nor does GFP-Nup98 alter hnRNP U localization.
HEK293T cells expressing GFP (A) or GFP-NUP98 (B) were used to compare their localization to DHX9 or hnRNP U detected by indirect immunofluorescence microscopy using specific antibodies. Merged images show DHX9 or hnRNP U (red), GFP or GFP-Nup98 (green), and DAPI-stained DNA (blue). Scale bars, 5 µm. Production of GFP or GFP-Nup98 was further confirmed by immunoblotting (Figure 5—figure supplement 2).
Figure 5—figure supplement 2
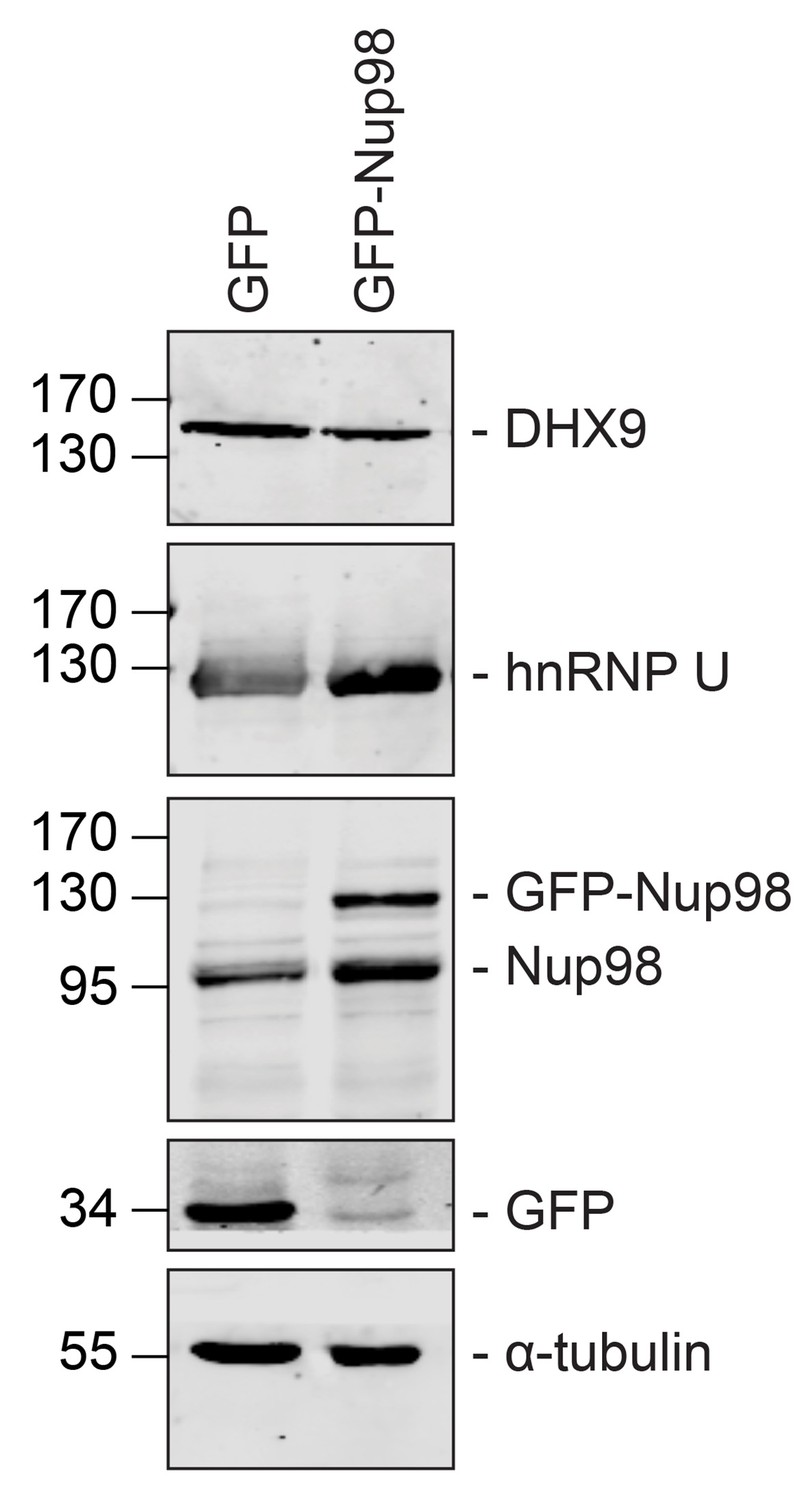
GFP or GFP-Nup98 expression does not alter cellular levels of DHX9 or hnRNP U.
Western blots of proteins derived from HEK293T cells lysates expressing GFP or GFP-Nup98 are shown. Antibodies were used for immunoblotting to detect the proteins indicated to the right of the panels. The positions of molecular mass markers (shown in kDa) are indicated on the left. α-tubulin was used as loading control. Corresponding immunofluorescence images are shown in Figure 5 and Figure 5—figure supplement 1.
Figure 5—figure supplement 3
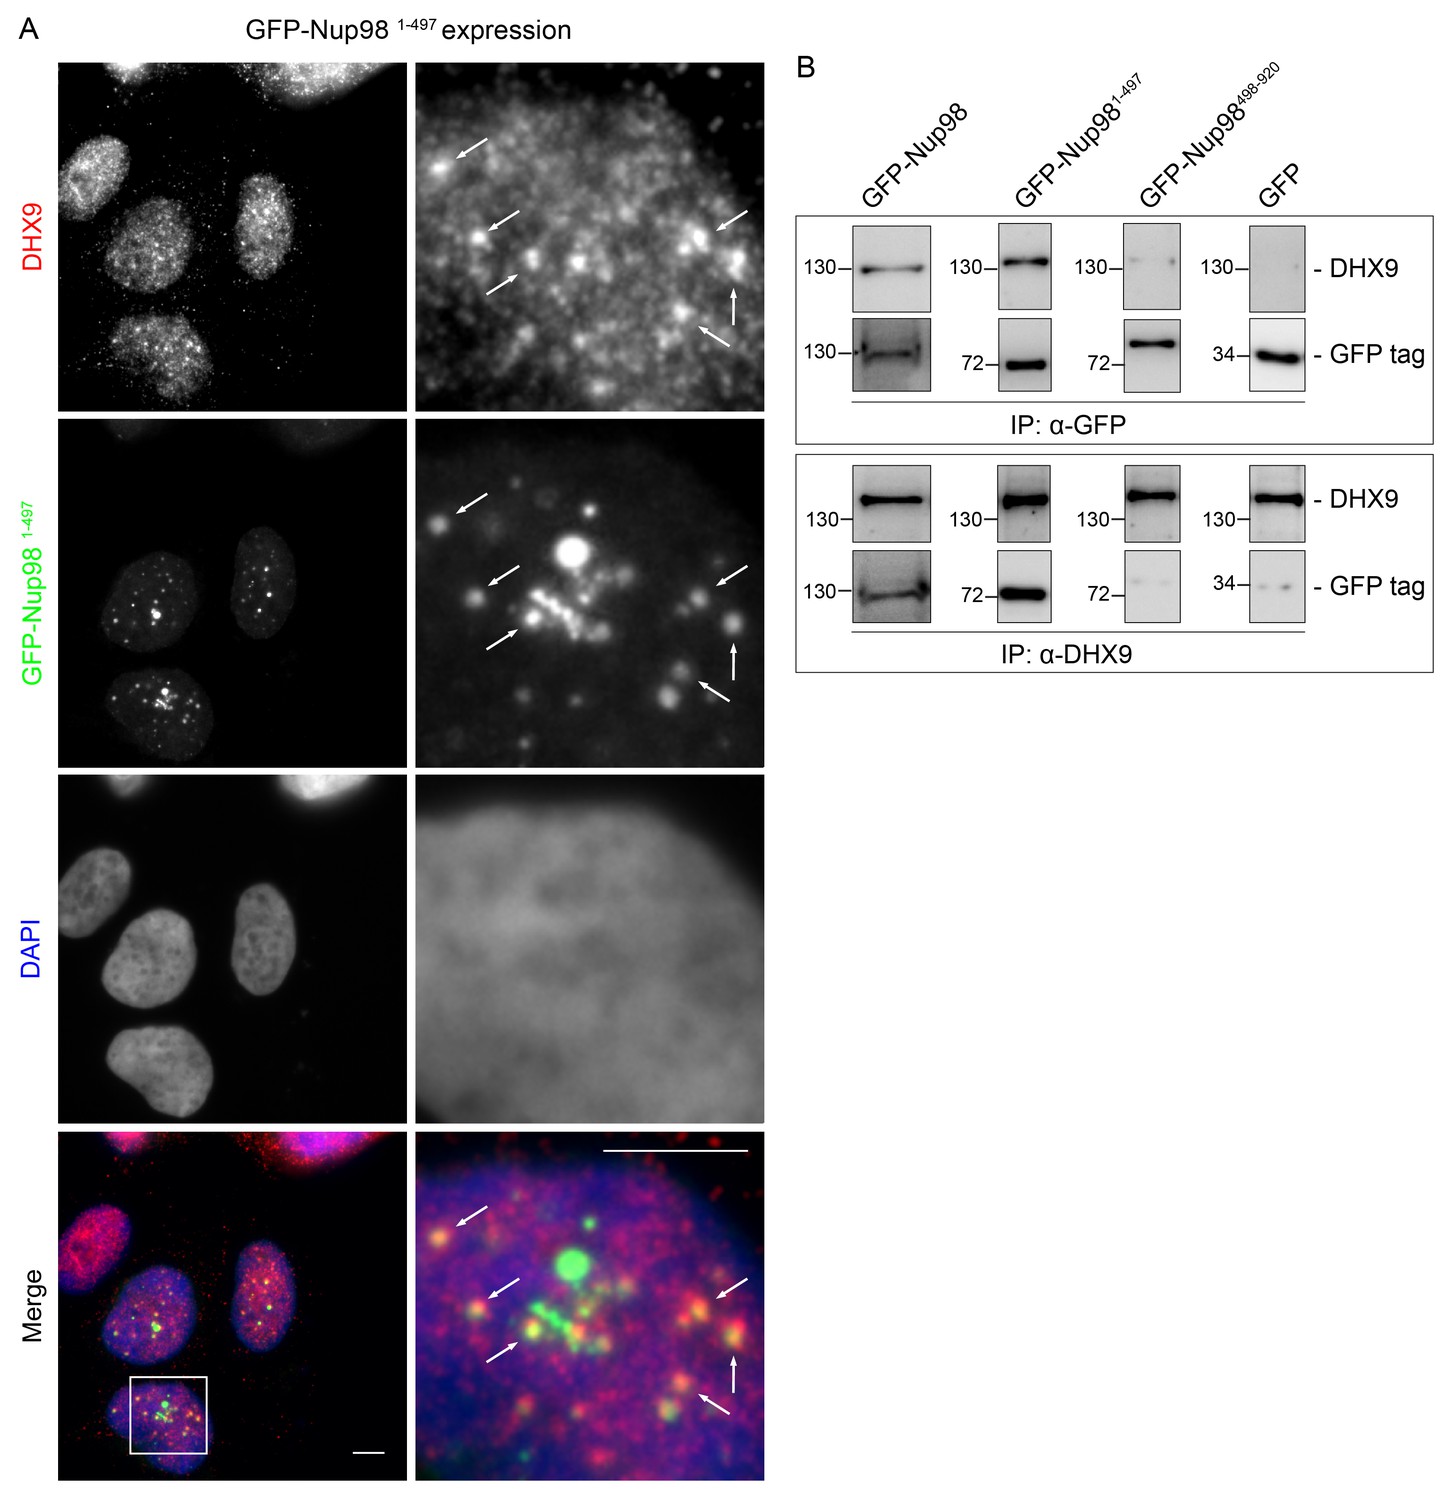
DHX9 is recruited to intranuclear GFP-Nup981–497 foci.
(A) HEK293T cells expressing GFP-NUP981–497 were used to assay the localization of DHX9 detected by immunofluorescence microscopy. Two magnifications are shown and examples of GFP-Nup981–497 colocalization with DHX9 are highlighted with arrows. Merged images show DHX9 (red), GFP-Nup981–497 (green), and DAPI-stained DNA (blue). Scale bars, 5 µm. (B) HEK293T cells were transfected with GFP-Nup98 constructs (full length – 1–920, FG/GLFG repeats – 1–497, C-terminal – 498–920) for 24 hours and lysed. Anti-DHX9 or anti-GFP IgG was used to affinity purify protein complexes from cell lysates. Co-purifying proteins were separated by SDS-PAGE and analyzed by immunoblotting using anti-DHX9 or anti-GFP antibodies indicated to the right of the panels. The positions of molecular mass markers (shown in kDa) are indicated on the left.
Figure 6 with 1 supplement
Nup98 binds directly to DHX9.
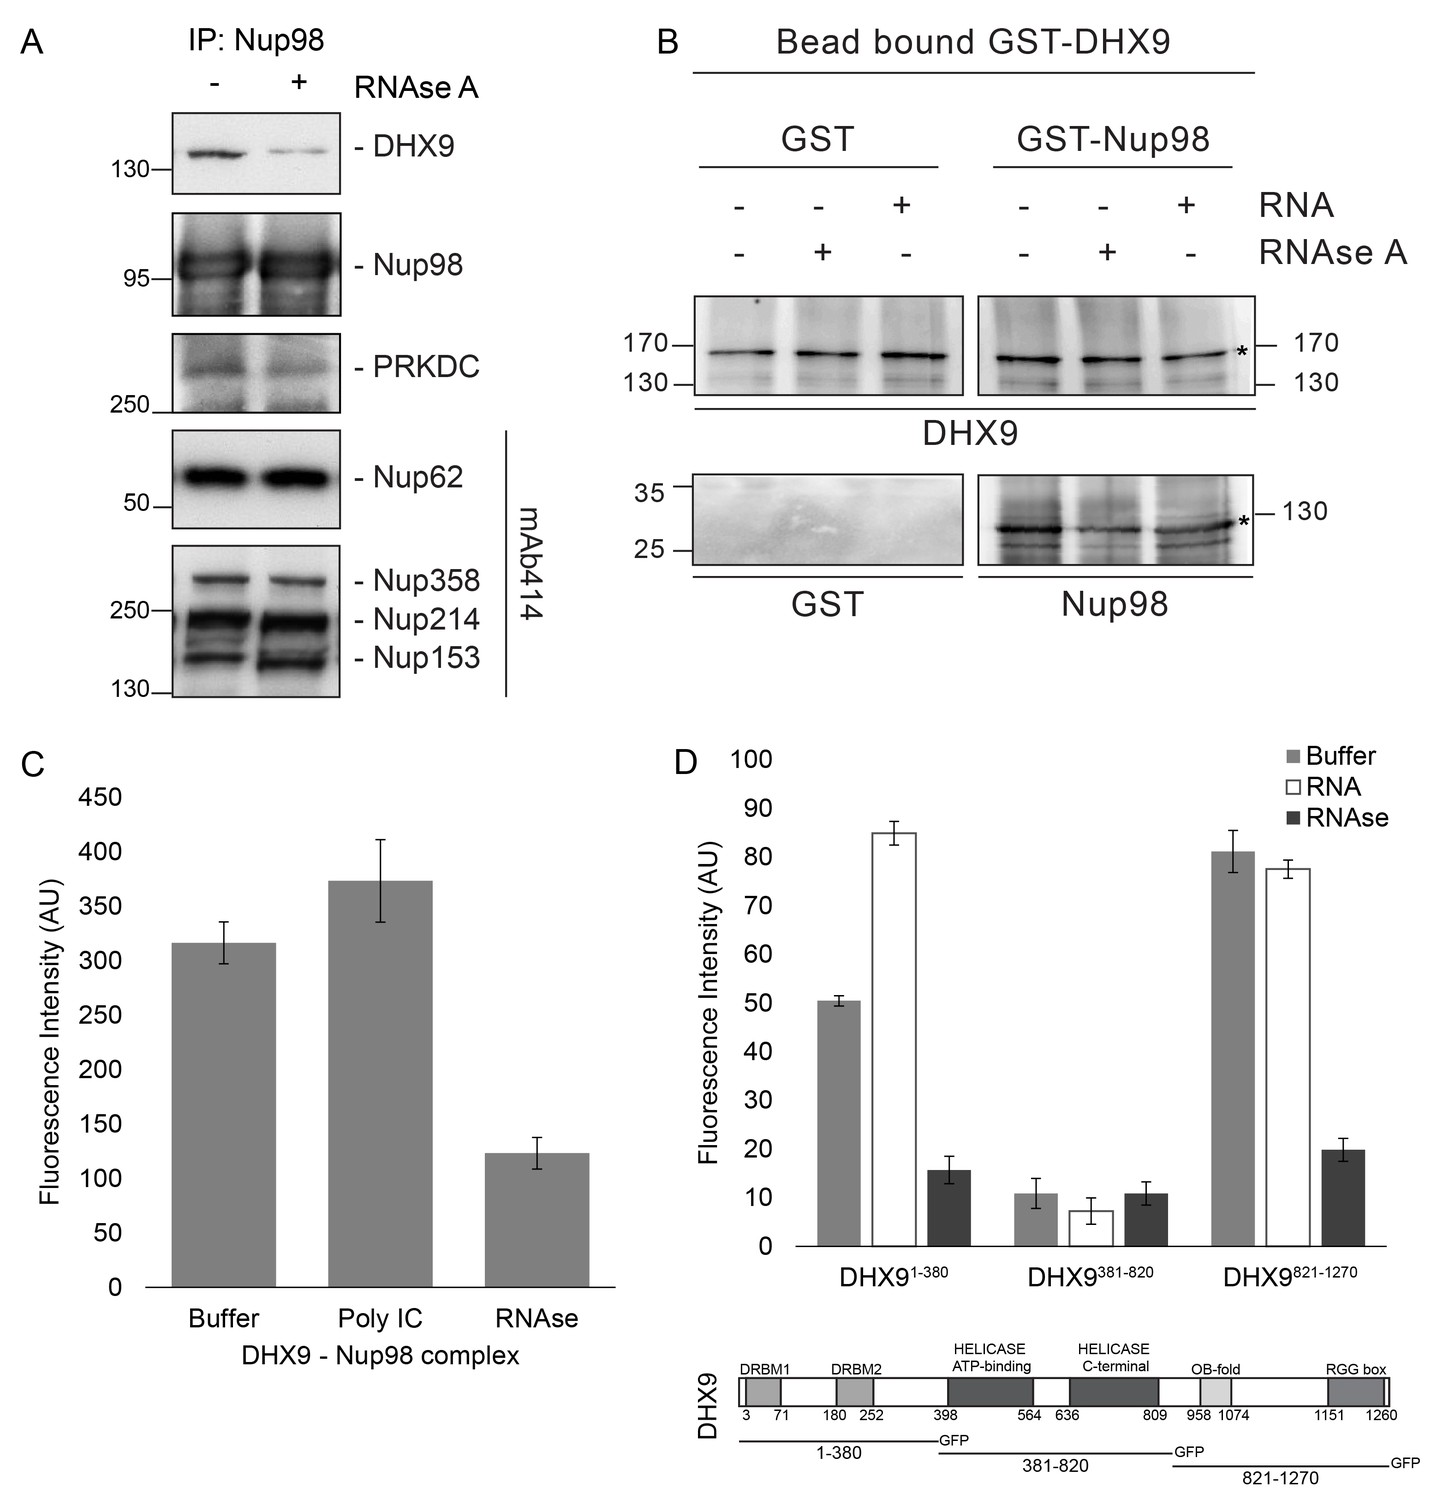
(A) Nup98 was affinity purified from HEK293T cell lysates. Bead-bound protein complexes were then incubated with or without RNase A, and proteins remaining bound to Nup98 were analyzed by western blotting using antibodies directed against the indicated proteins (right). The positions of molecular mass markers (shown in kDa) are indicated on the left. (B) Anti-DHX9 antibodies coupled to beads were used to immobilize GST-DHX9. Bead-bound GST-DHX9 was incubated with GST-Nup98 or GST alone in the presence of RNA (poly I:C), RNase A, or buffer alone. Bound proteins were analyzed by western blotting using the indicated antibodies (below each panel). The top row of images shows the GST-DHX9 bait bound to beads. The bottom row of images shows GST and GST-Nup98 that bound to GST-DHX9 under the indicated conditions. Asterisks denote positions of GST-DHX9 and GST-Nup98. The positions of molecular mass markers (shown in kDa) are indicated. A similar interaction between untagged recombinant DHX9 and Nup98 was also detected (Figure 6—figure supplement 1A). (C) Bead halo assays were performed using DHX9 immobilized on beads with an anti-DHX9 antibody as bait and Nup98 as prey. Prior to the binding step, both proteins were incubated with RNase A, RNA (poly I:C), or buffer alone. Interactions of Nup98 with bead-bound DHX9 were detected by fluorescence microscopy with rabbit anti-Nup98 antibodies and Alexa Fluor 488 donkey anti-rabbit antibodies. Examples of images of beads used to quantify binding can be seen in Figure 6—figure supplement 1B. (D) Bead halo assays were performed using bead-bound GST-Nup98 (bait) and different domains of DHX9-GFP (prey; see bottom diagram). Proteins were incubated with RNA (poly I:C), RNase A, or buffer alone before binding. The interaction of bead-bound GST-Nup98 with DHX9-GFP domains was detected by fluorescence microscopy. Examples of images of beads can be seen in Figure 6—figure supplement 1C. For C and D, bead halo assays were performed with purified recombinant proteins. Plots show average fluorescence intensity values of beads (arbitrary units) corrected against negative control assays (see Materials and methods). Results from three biological replicates are shown. Error bars indicate standard deviation between biological replicates.
Figure 6—figure supplement 1
In vitro interaction of Nup98 and DHX9.
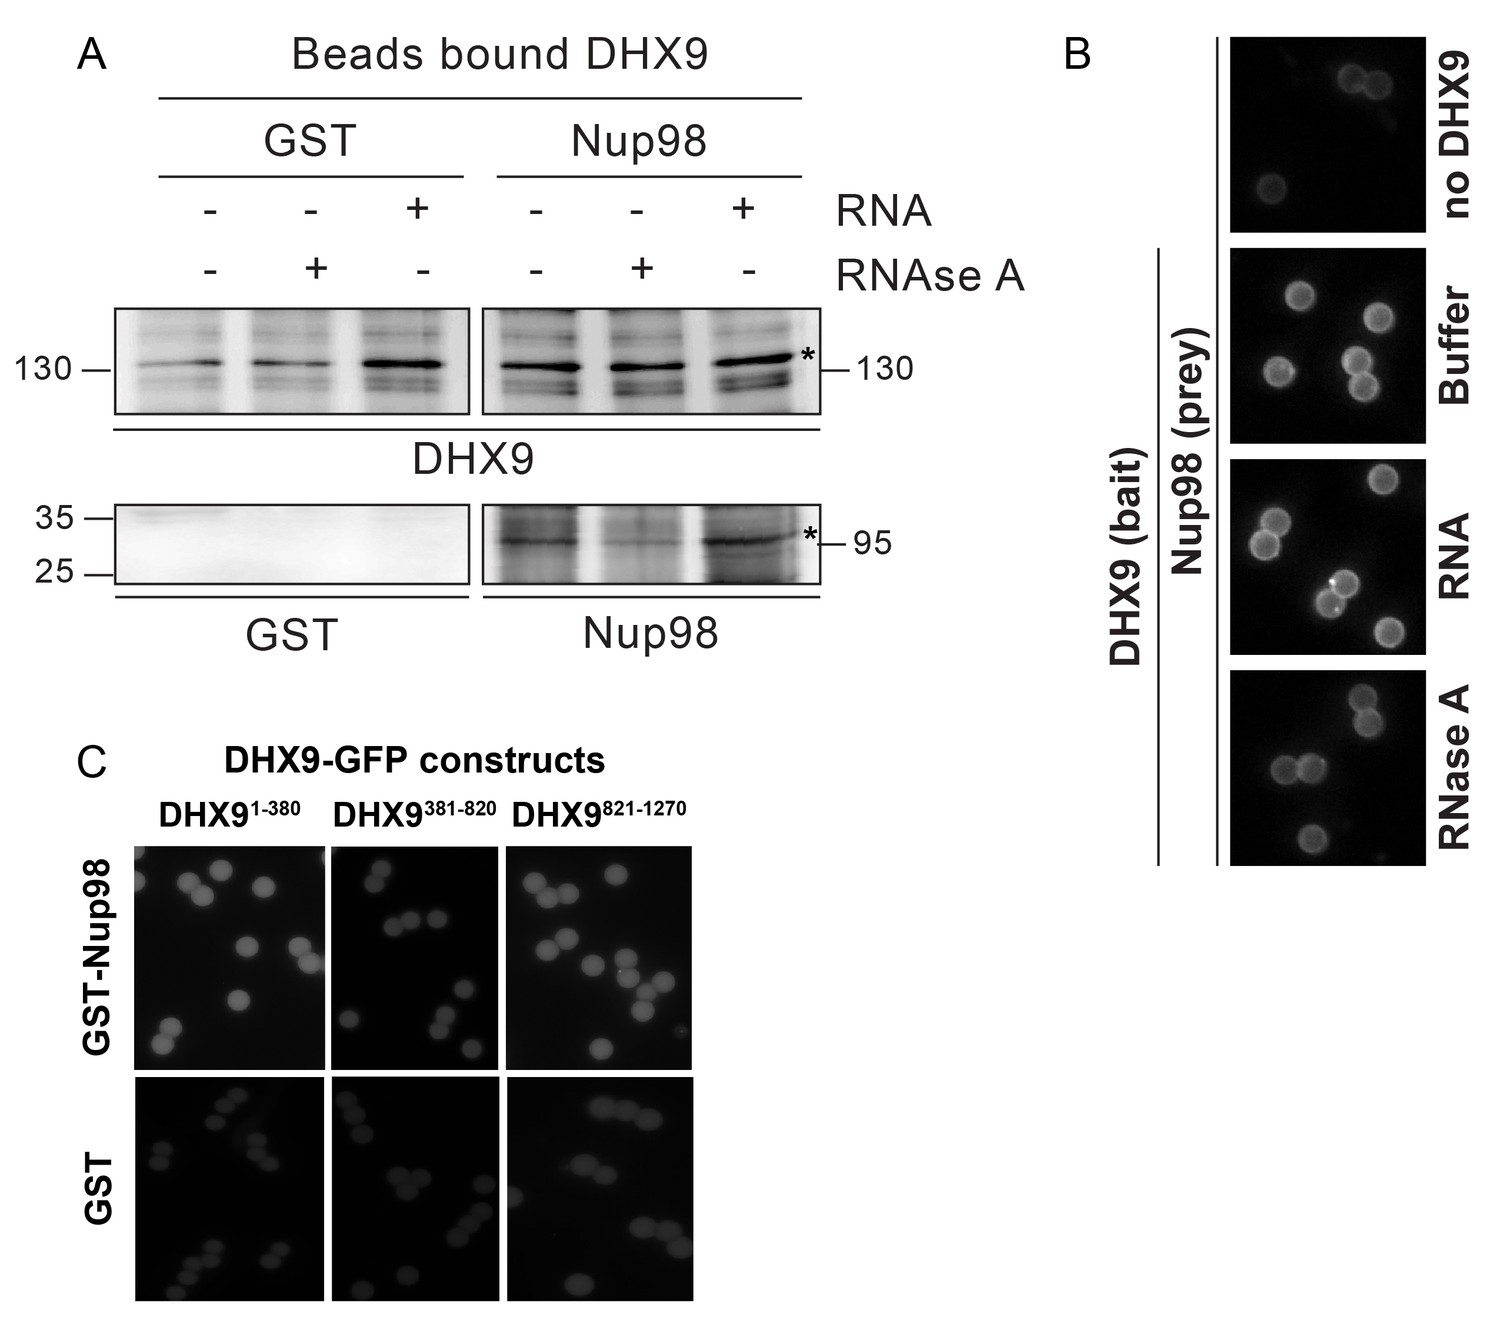
(A) Anti-DHX9 antibodies coupled to beads were used to immobilize recombinant DHX9. Bead-bound DHX9 was then incubated with recombinant Nup98 or GST in the presence or absence of RNA (poly I:C), RNase A, or buffer alone. Bound proteins were analyzed by Western blots using the indicated antibodies (below images). The top row of panels shows the DHX9 bait bound to beads. The bottom row of panels shows GST and Nup98 that bound to DHX9 under the indicated conditions. Asterisks denote positions of DHX9 and Nup98. The positions of molecular mass markers (shown in kDa) are indicated on the left and right. (B) Example images of bead-bound complexes used for the quantification shown in Figure 6C. (C) Example images of bead-bound complexes used for the quantification shown in Figure 6D.
Figure 7 with 1 supplement
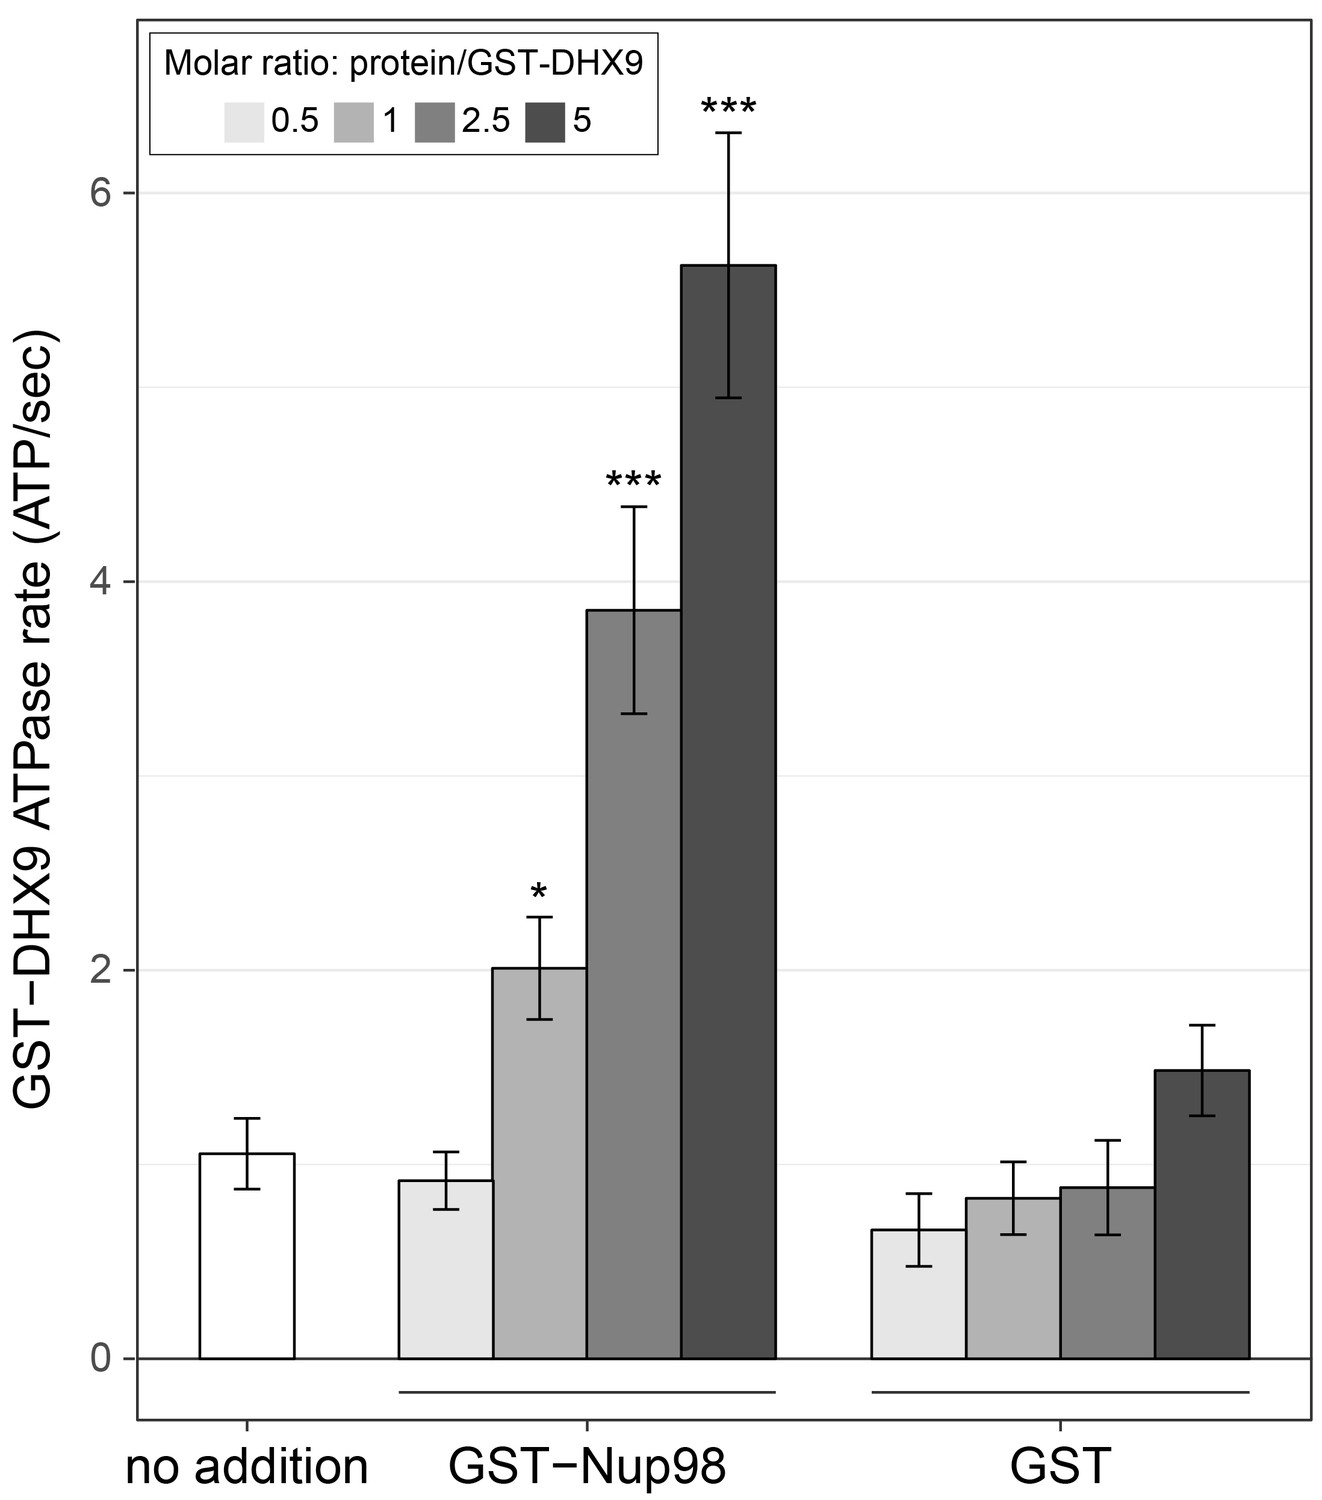
Nup98 stimulates DHX9 ATPase activity.
The ATPase activity (ATP hydrolysis rate) of purified recombinant GST-DHX9 in the presence of RNA alone (no addition) or following the addition of increasing concentrations of GST-Nup98 or GST (show as the molar ratio of the added protein to that of GST-DHX9) is shown on the y-axis. Error bars indicate standard deviation. Results from three biological replicates were submitted to ANOVA followed by Tukey HSD tests (*** indicates adjusted p-values < 0.001 and * indicates adjusted p-values < 0.05 for Tukey HSD in pairwise comparison between a reaction containing GST-Nup98 and a reaction containing GST in similar molar amounts). Similar results were obtained using untagged versions of DHX9 and Nup98 (Figure 7—figure supplement 1B). The addition of GST-Nup98 constructs or GST alone had no effect on the ATPase rate of GST-DHX9 in the absence of RNA (Figure 7—figure supplement 1C).
Figure 7—figure supplement 1
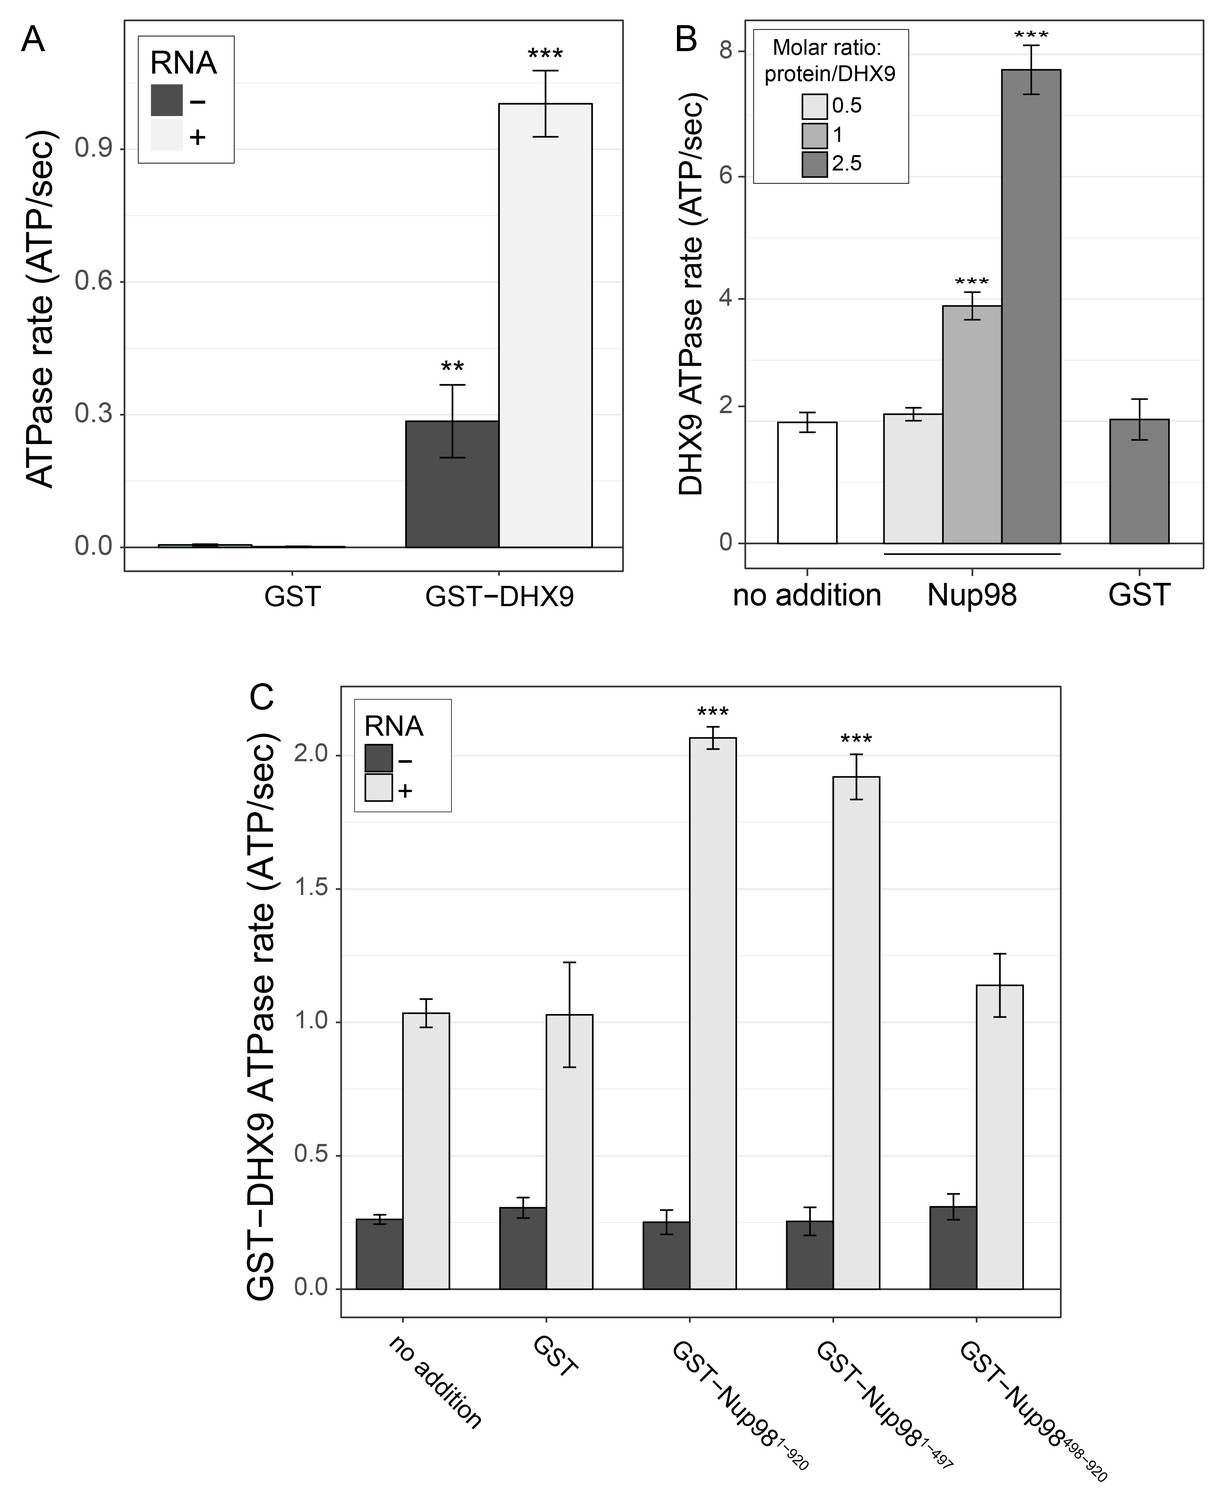
DHX9 ATPase assay.
(A) The ATP hydrolysis rate (ATP/sec) of purified recombinant GST-DHX9 or GST alone in the presence or absence of RNA was examined. Error bars indicate standard deviation. Results from three biological replicates were submitted to ANOVA followed by Tukey HSD tests (*** indicates adjusted p-values < 0.001 for Tukey HSD in pairwise comparison between reactions containing GST-DHX9 and reactions containing GST alone in the presence or absence of RNA). (B) The ATP hydrolysis rate (ATP/sec) of untagged DHX9 in the presence of RNA alone (no addition) or following the addition of untagged Nup98 (molar ratio of Nup98:DHX9 of 0.5:1, 1:1, or 2.5:1) or GST (GST:DHX9 molar ratio of 2.5:1) is shown on the y-axis. Error bars indicate standard deviation for biological replicates. Results from three biological replicates were submitted to ANOVA followed by Tukey HSD (*** indicates adjusted p-values < 0.001 for Tukey HSD in pairwise comparison between reactions containing Nup98 and reactions containing GST). (C) The ATP hydrolysis rate (ATP/sec) of purified recombinant GST-DHX9 in the presence or absence of RNA (poly I:C), and either alone (no addition) or following the addition of equal molar amounts of GST or GST-Nup98 constructs containing full length Nup98 (1-920), the FG/GLFG region (1-497), or C-terminal region (498-920). Error bars indicate standard deviation. Results from three biological replicates were submitted to ANOVA followed by Tukey HSD tests (*** indicates adjusted p-values < 0.001 for Tukey HSD in pairwise comparison between a reaction containing a GST-Nup98 construct and a reaction containing GST).
Figure 8 with 1 supplement
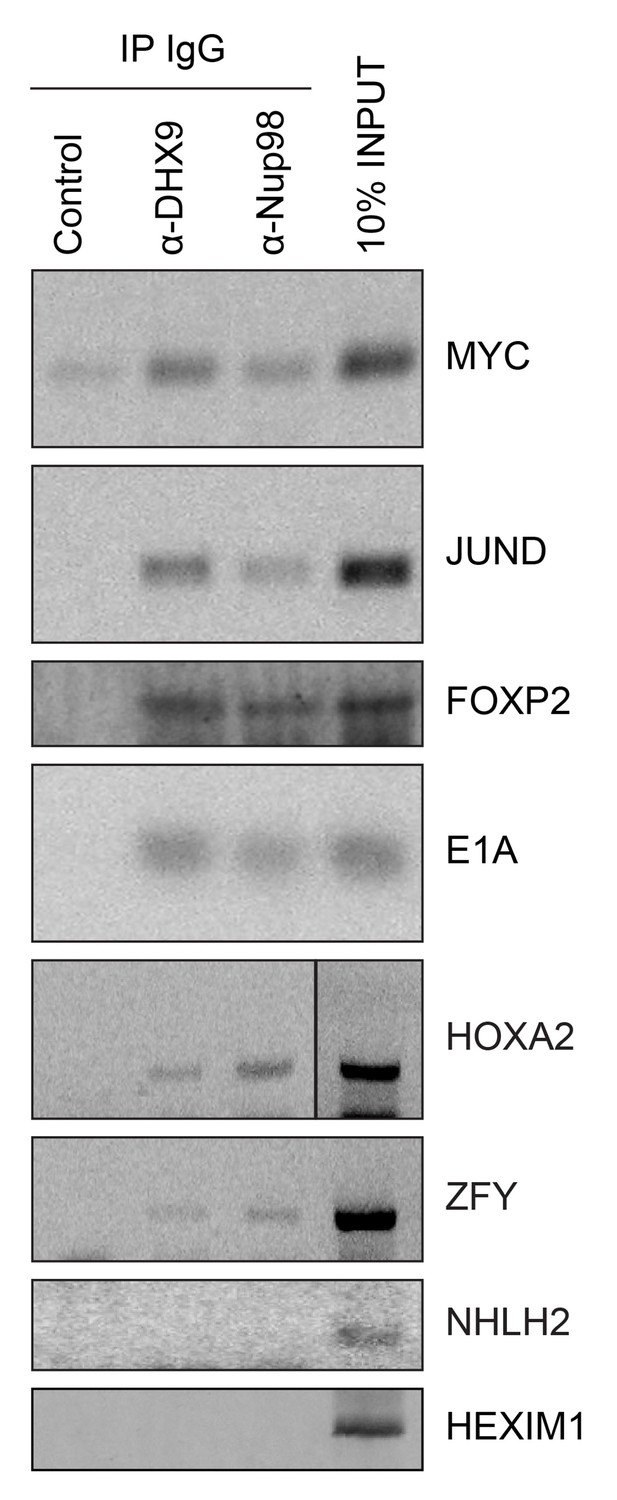
Nup98 directly interacts with target mRNA molecules.
Following crosslinking of HEK293T cells to preserve protein/RNA complexes, cell lysates were incubated with beads coupled to a control IgG (α-GFP) or beads coupled to Nup98 or DHX9 specific antibodies. RNA present in immunoprecipitated complexes and total cellular RNA (10% input) was used as template in RT-PCR reactions containing primers (Supplementary file 1D) specific to regions of several cDNAs whose genes are denoted on the right.
Figure 8—figure supplement 1
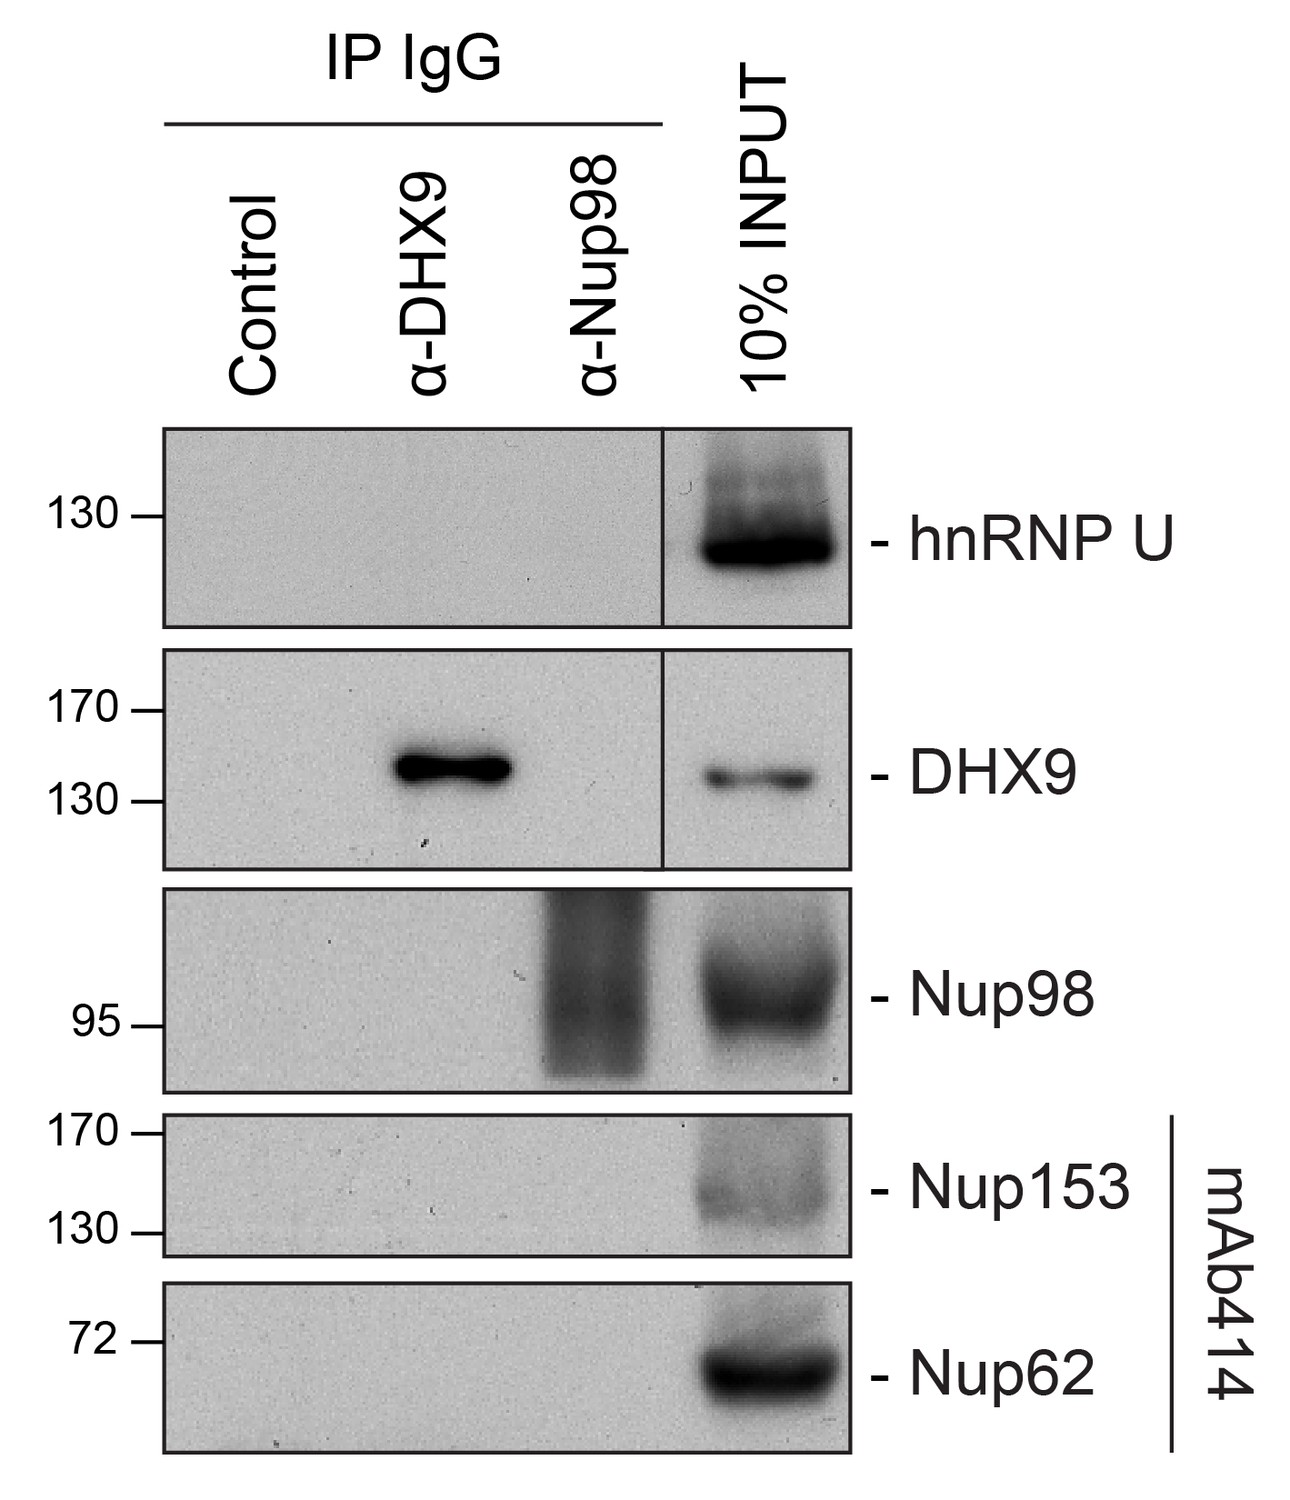
Analysis of protein immunoprecipitation.
Western blot analysis of protein immunoprecipitation (IP) fractions described in Figure 8 to detect associated RNA. The indicated IP samples (IP IgG) were analyzed by western blotting using antibodies directed against the proteins indicated on the right. The positions of molecular mass markers (shown in kDa) are indicated on the left.
Figure 9 with 2 supplements
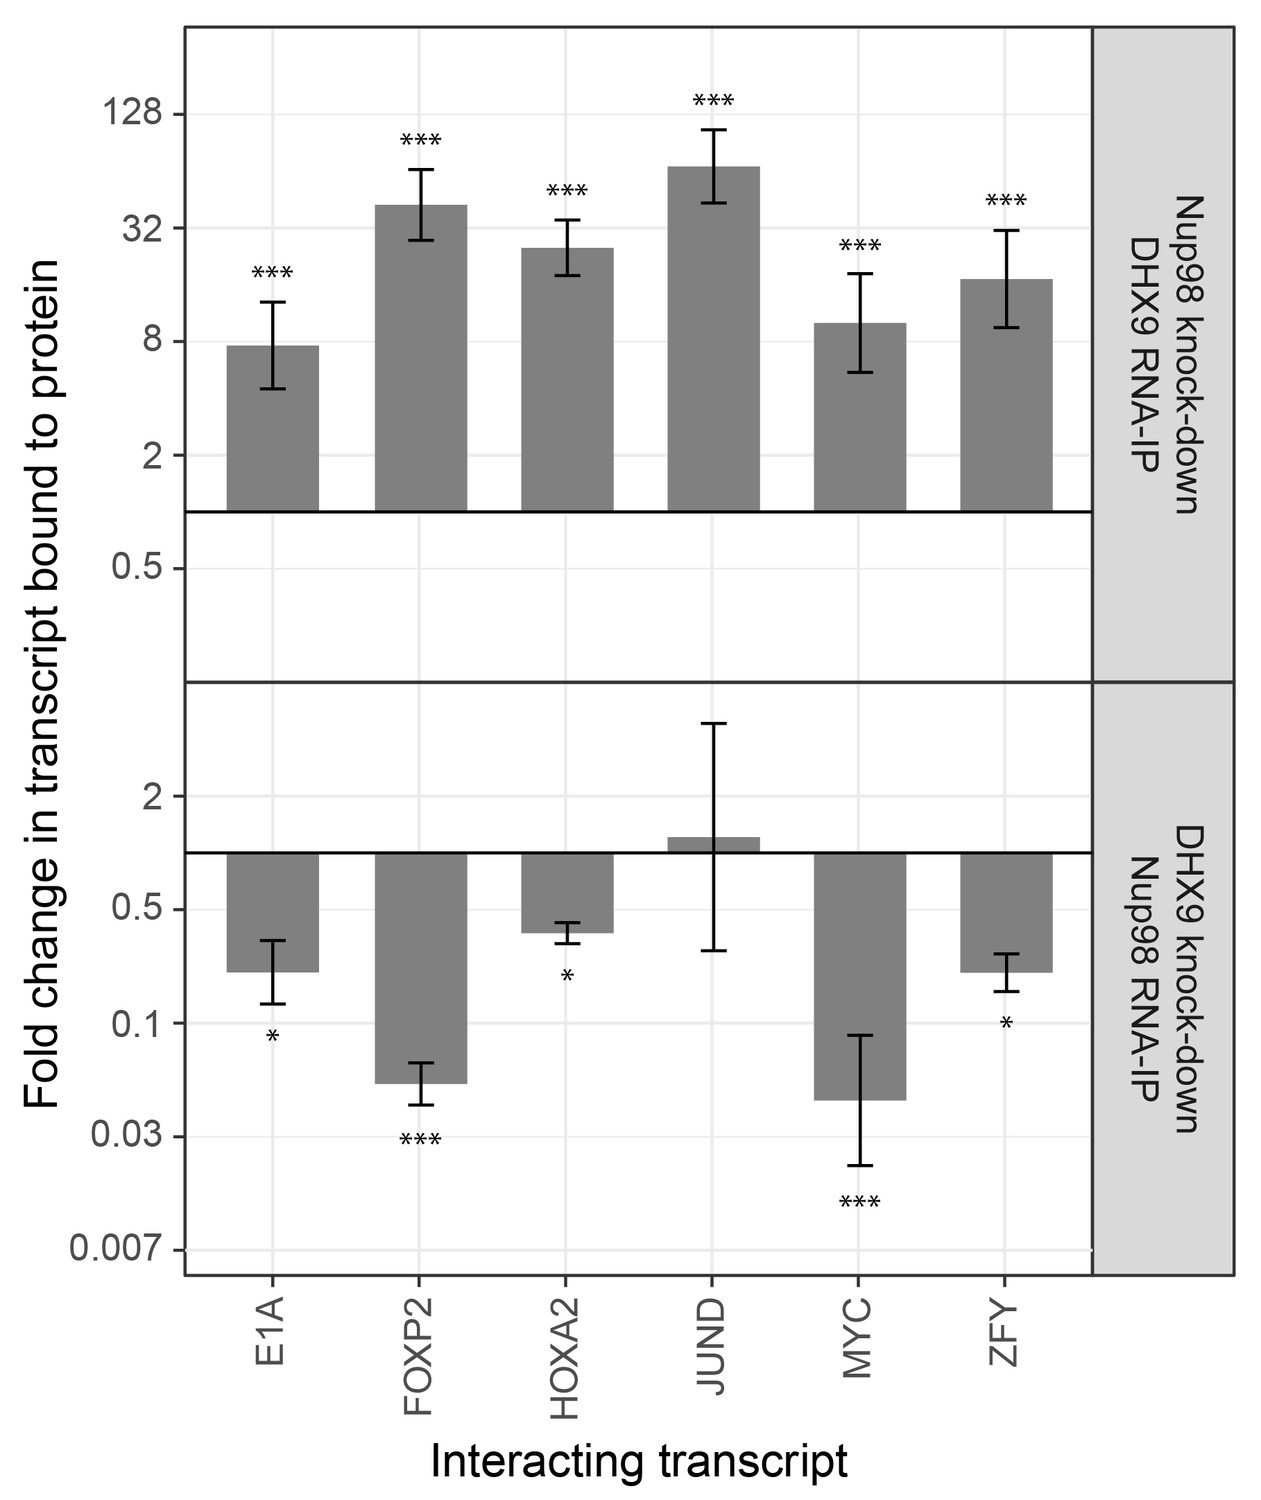
The association of Nup98 or DHX9 with specific mRNAs is altered by depletion of its binding partner.
HEK293T cells were transfected with a control shRNA or an shRNA targeting Nup98 or DHX9. RNA immunopurified with Nup98 or DHX9 was reverse transcribed and used in qPCR reactions to assess the levels of indicated transcripts (x-axis). The ratio of bound mRNA relative to input was determined for each transcript listed. The fold-change in this ratio is relative to that determined from mock-depleted cells and is shown on the y-axis. The top panel shows the results of mRNA bound to DHX9 upon Nup98 depletion and the bottom panel mRNA bound to Nup98 upon DHX9 depletion. Error bars indicate standard deviation for biological replicates. Results from three biological replicates were submitted to ANOVA followed by Tukey HSD tests. The *** indicates adjusted p-values < 0.001 and * < 0.05 for Tukey HSD in pairwise comparisons between depleted and mock depleted samples.
Figure 9—figure supplement 1
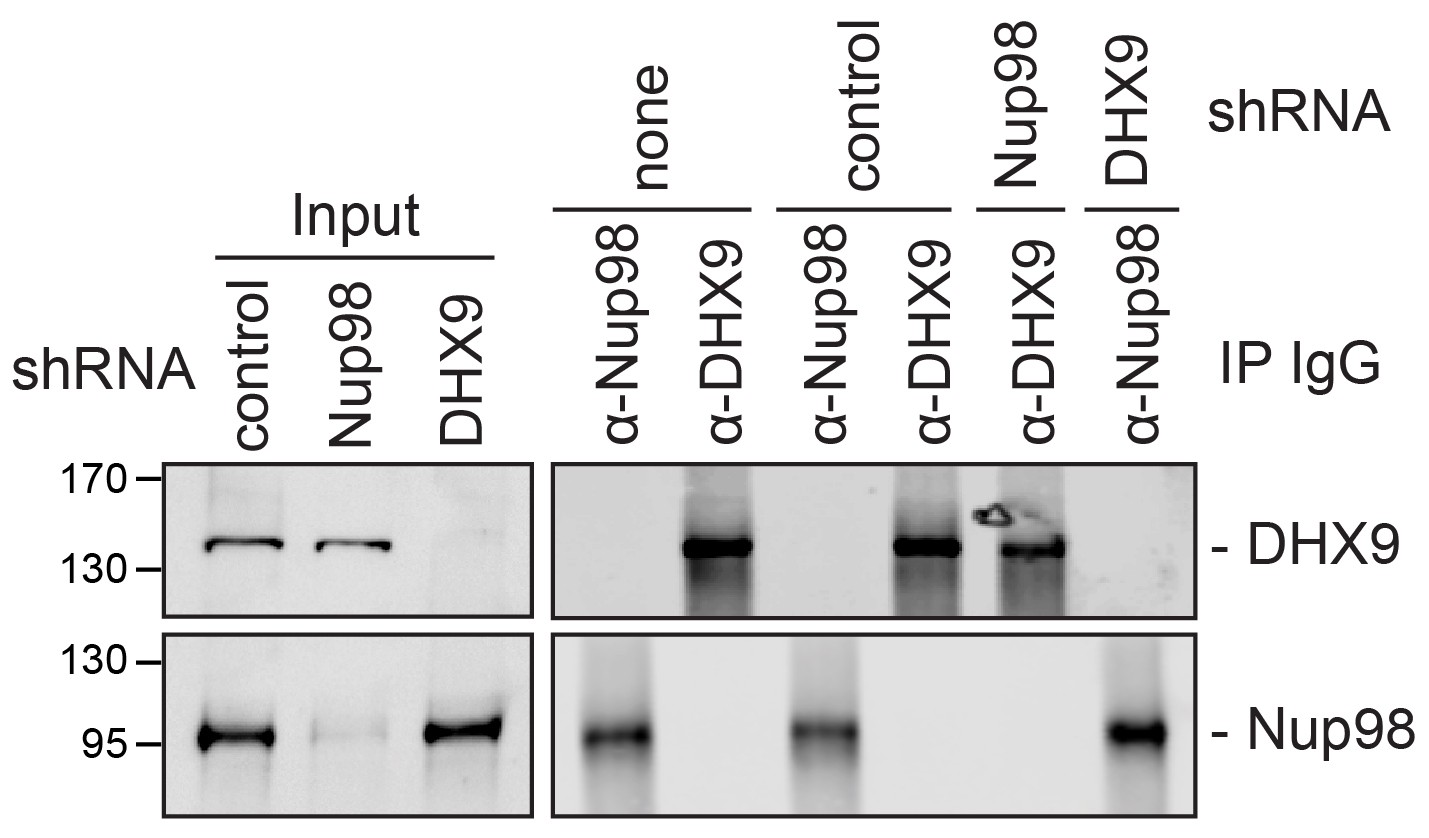
Analysis of protein immunoprecipitation from HEK293T cells depleted of Nup98 or DHX9.
Western blot analysis of cell lysates and protein immunoprecipitation (IP) fractions described in Figure 9 to detect associated RNA. The indicated cell lysates and IP samples (list above the panels) were probed with antibodies directed against DHX9 (top row) and Nup98 (bottom row). The positions of molecular mass markers (shown in kDa) are indicated on the left.
Figure 9—figure supplement 2
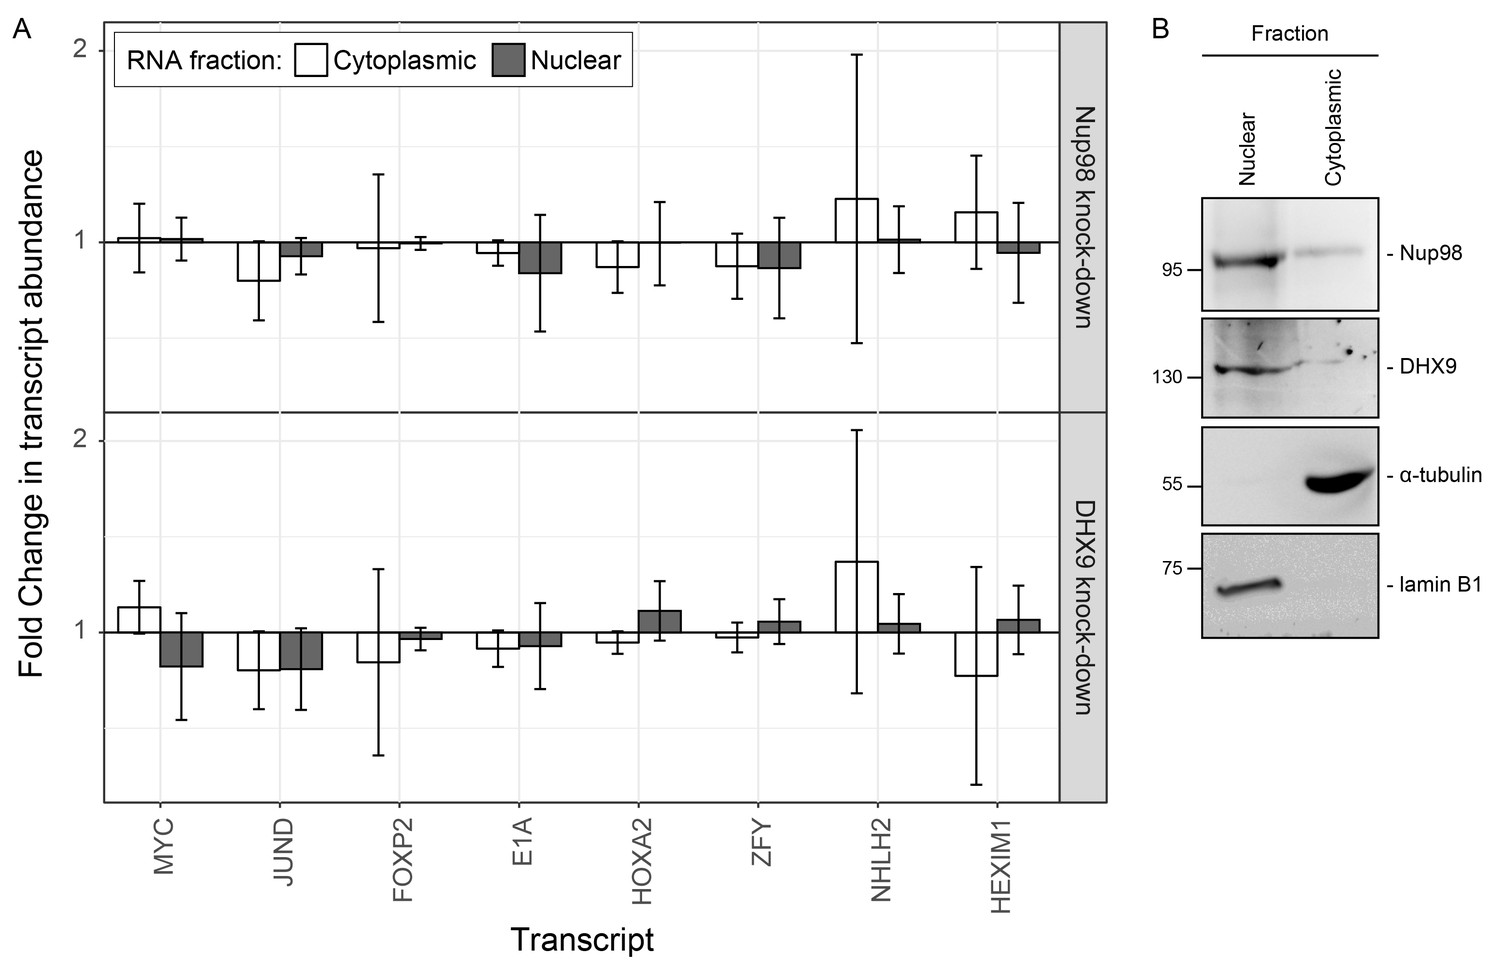
Nup98 or DHX9 depletion has no significant impact on the nuclear or cytoplasmic abundance of target mRNAs.
(A) HEK293T cells were transduced with a control shRNA or an shRNA targeting Nup98 or DHX9. Cells were fractionated into nuclear and cytoplasmic samples and the levels of the indicated gene transcripts were quantified by qPCR. Nuclear and cytoplasmic transcript abundance was normalized to total transcript abundance in the cell. Fold changes (y-axis) in nuclear or cytoplasmic RNA levels upon Nup98 (top) or DHX9 (bottom) depletion relative to mock-depleted cells are shown. Error bars indicate standard deviation for biological replicates. Results from three biological replicates were submitted to ANOVA tests and show no statistically significant changes. (B) Fractions described in A were evaluated by western blotting using antibodies directed against Nup98, DHX9, the nuclear protein lamin B1, and cytoplasmic protein α-tubulin. The positions of molecular mass markers (shown in kDa) are indicated on the left.
Figure 10 with 1 supplement
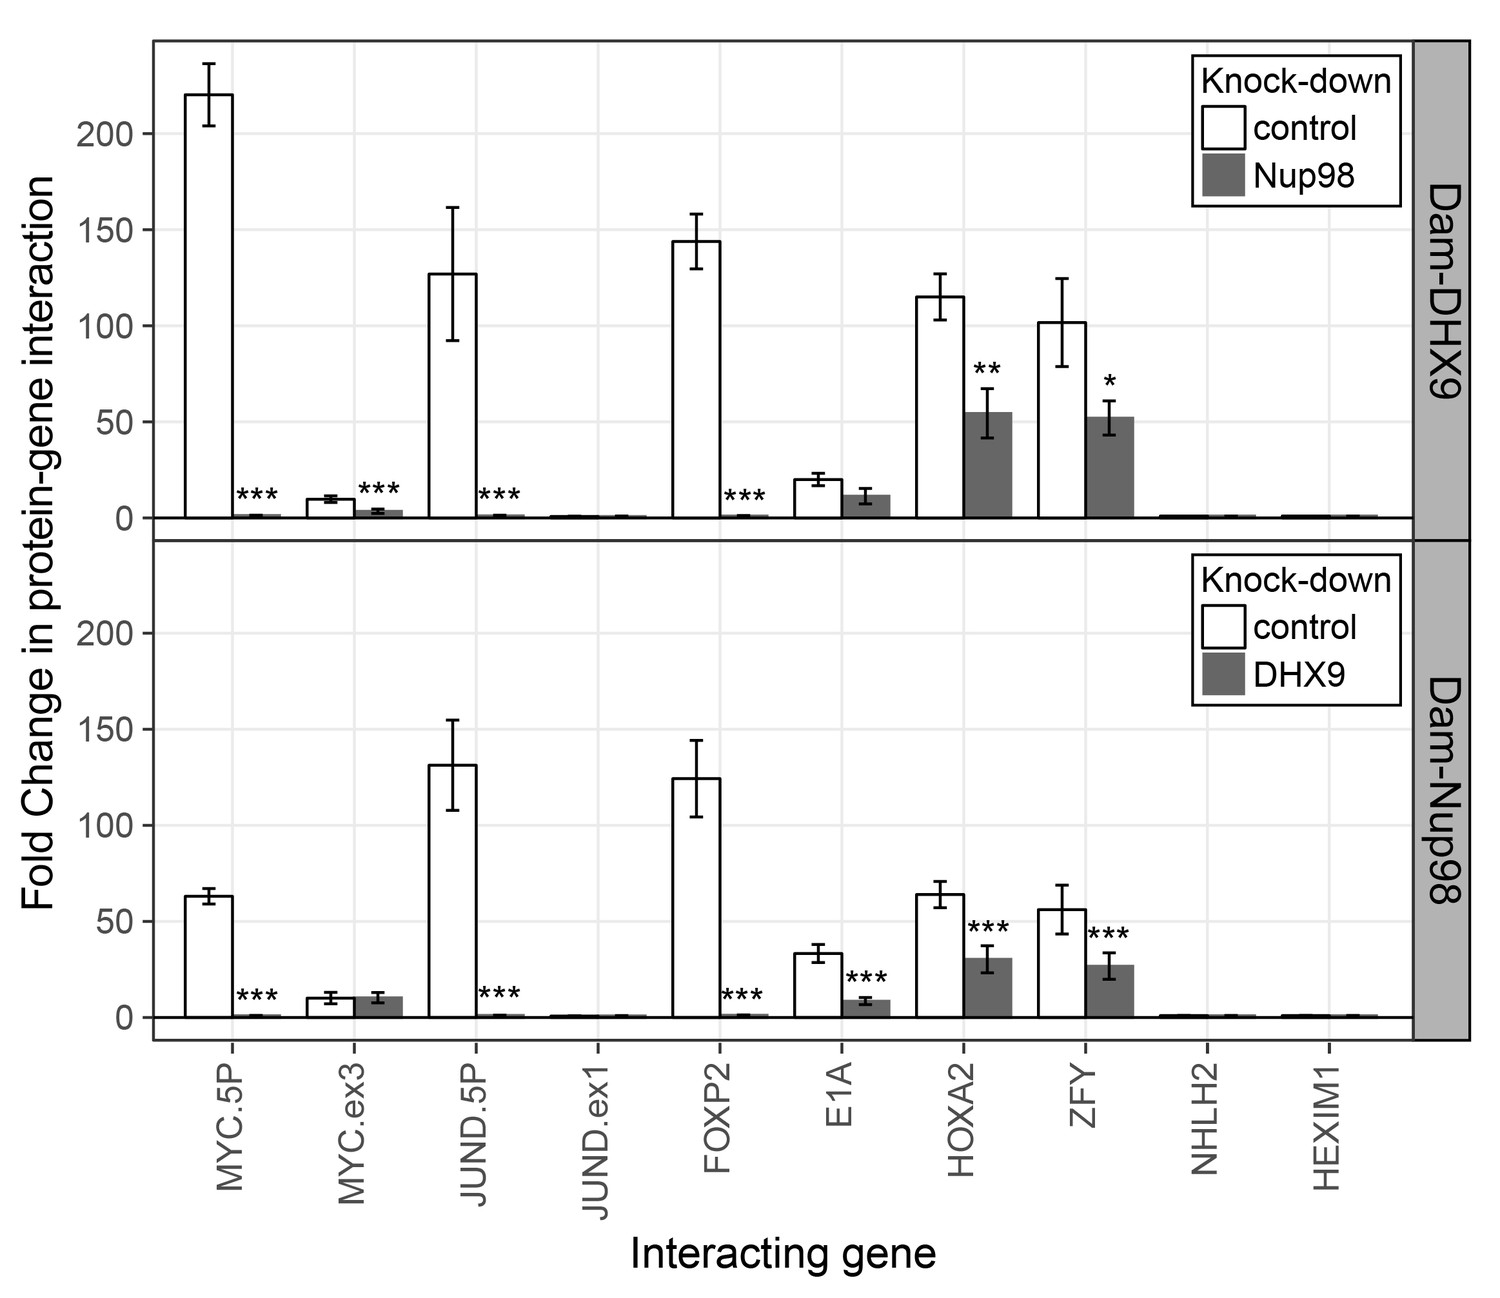
Nup98 and DHX9 associate with similar gene loci and their binding is interdependent.
HEK293T cells stably expressing Dam-GFP, Dam-Nup98 or Dam-DHX9 were transduced with lentivirus encoding a control shRNA (white) or an shRNA targeting Nup98 or DHX9 (gray) and DamID analysis was performed. The association of Dam-Nup98 and Dam-DHX9 to the indicated gene loci is represented as the fold change (x-axis) relative to a Dam-GFP control. Error bars indicate standard deviation for biological replicates. For the top and bottom graphs, results from three biological replicates were submitted to two-way ANOVA followed by Tukey HSD tests. Adjusted p-values are indicated as *** < 0.001 < ** < 0.01 < * < 0.05 for Tukey HSD in pairwise comparisons between mock and Nup98 or DHX9 depleted cells for each gene tested.
Figure 10—figure supplement 1
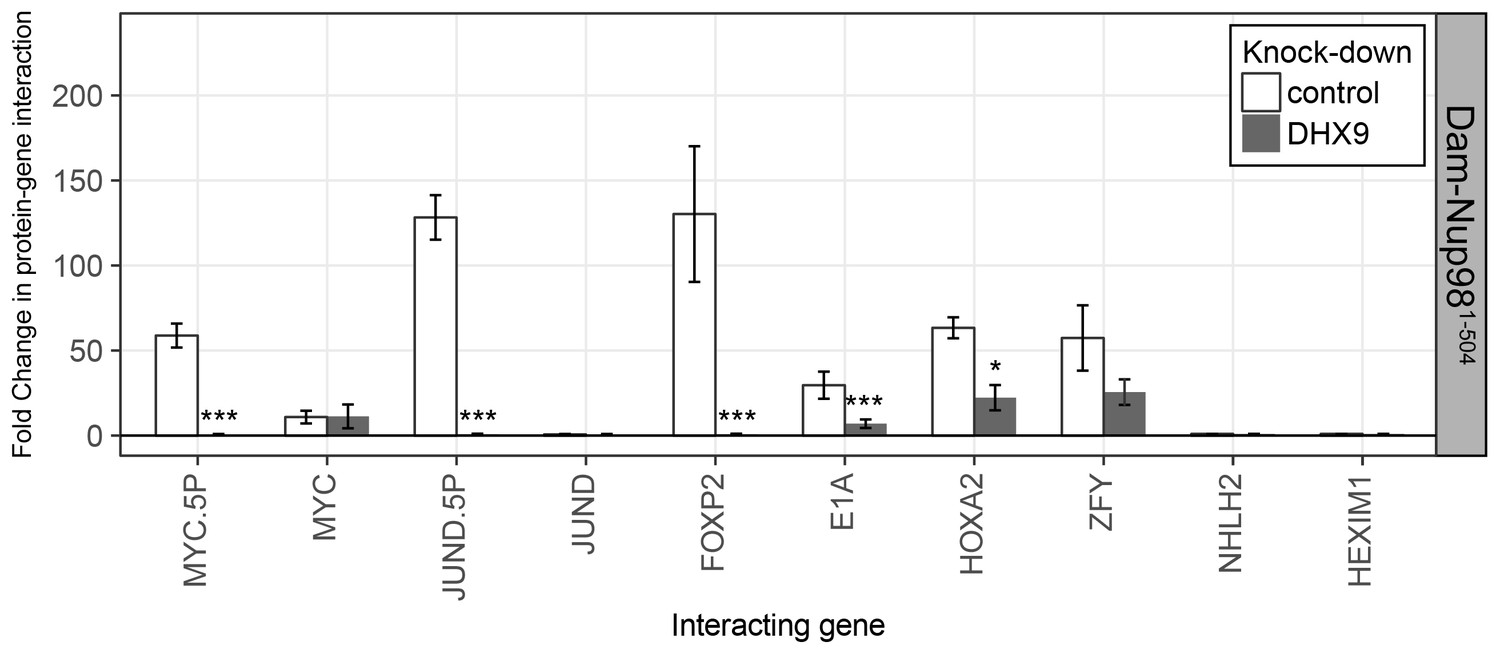
The N-terminal FG/GLFG region of Nup98 associates with specific gene loci and is altered by depletion of DHX9.
HEK293T cells stably expressing Dam-GFP or Dam-Nup981–504 were transduced with lentivirus encoding a control shRNA (white) or an shRNA targeting DHX9 (gray), and Dam-ID analysis was performed. The association of Dam-Nup981–504 with indicated gene loci is represented as the fold change (x-axis) relative to a Dam-GFP control. Error bars indicate standard deviation for biological replicates. For the top and bottom graphs, results from three biological replicates were submitted to two-way ANOVA followed by Tukey HSD tests. Adjusted p-values are indicated as *** < 0.001 < ** < 0.01 < * < 0.05 for Tukey HSD in pairwise comparisons between mock and DHX9-depleted cells for each gene tested.
Figure 11

Nup98 or DHX9 depletion alters the abundance of target mRNAs.
HEK293T cells were transduced with a control shRNA or an shRNA targeting Nup98 or DHX9. RNA was purified and transcript levels from the indicated genes (x-axis) were reverse transcribed and quantified by qPCR. Fold changes (y-axis) in the abundance of different transcripts upon Nup98 (top) or DHX9 (bottom) depletion relative to transcript abundance in mock depleted cells are shown. Error bars indicate standard deviation for biological replicates. Results from three biological replicates were submitted to ANOVA tests followed by Tukey HSD tests. p-values are indicated as *** < 0.001 and * < 0.05 for Tukey HSD in pairwise comparisons between mRNA levels from depleted and mock depleted cells.
Figure 12 with 1 supplement
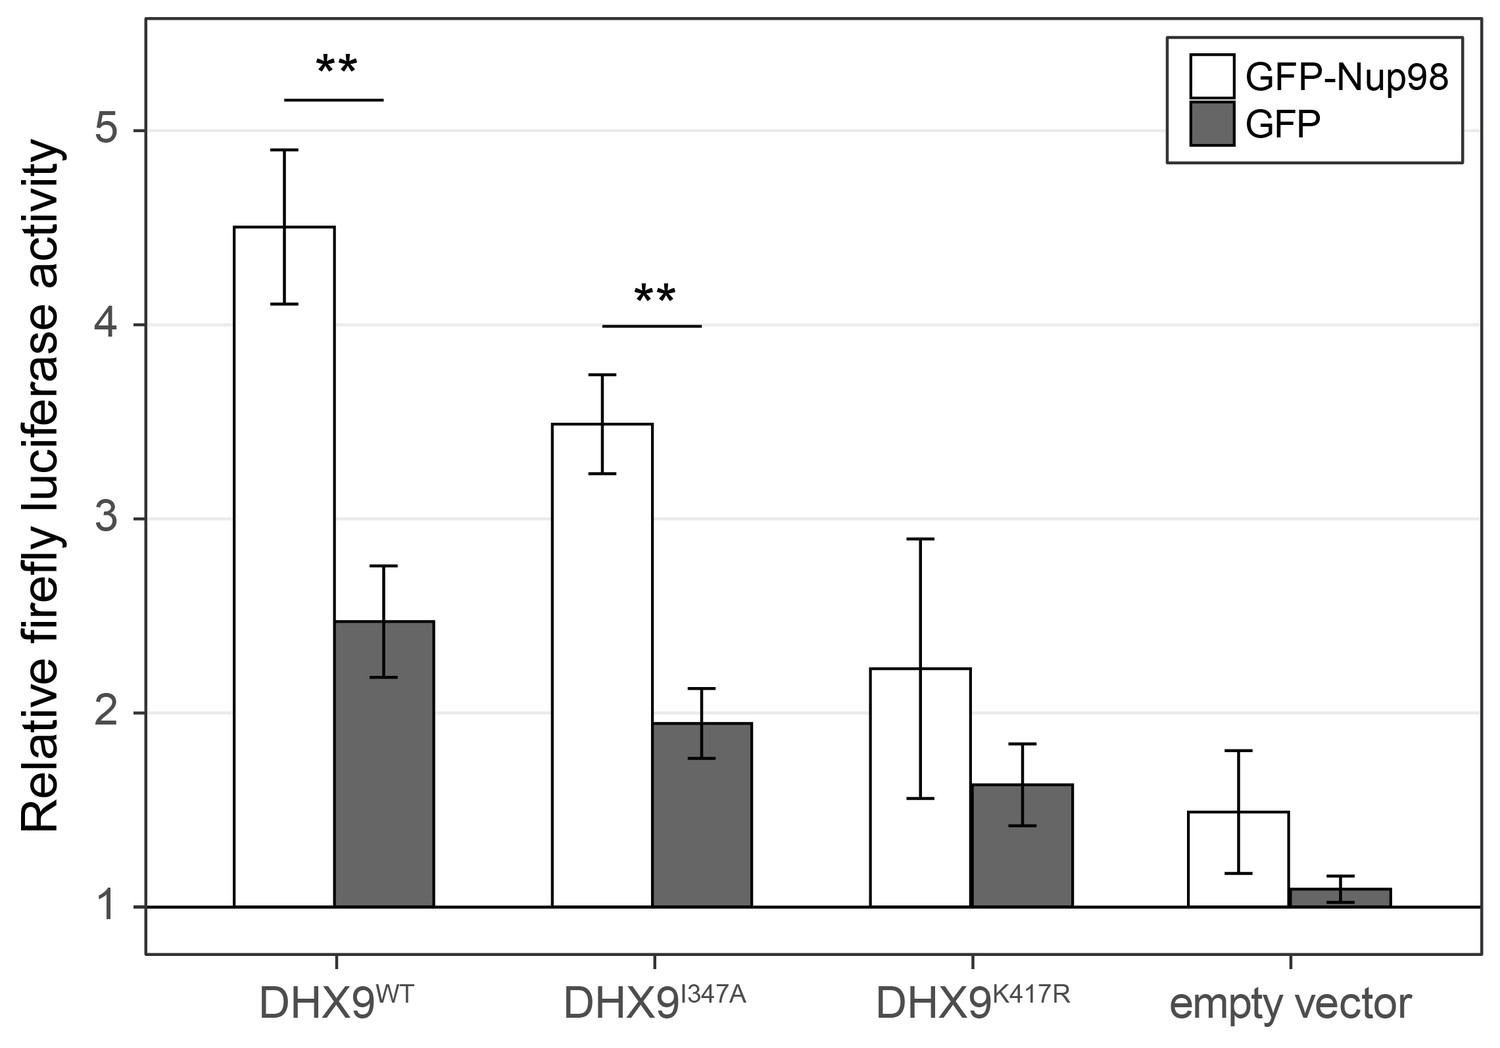
Nup98 stimulates the transcriptional activity of DHX9.
HEK293T cells transfected with the luciferase gene under control of a cAMP-regulatory element (CRE) were co-transfected with two plasmids, one containing GFP-NUP98 or GFP and another containing either DHX9WT, the point mutant DHX9I347A, the point mutant DHX9K417R or an empty plasmid. Luciferase activity is shown on the y-axis. The luciferase activity from cells transfected with luciferase plasmid alone was designated 1. Each value of relative luciferase activity represents the mean ± standard deviation (n = 3). (** indicate p-value < 0.01 in T-test comparing normalized luciferase activity in cells transfected with GFP-Nup98 versus GFP). DHX9 and the DHX9 point mutants are expressed at similar levels (Figure 12—figure supplement 1).
Figure 12—figure supplement 1
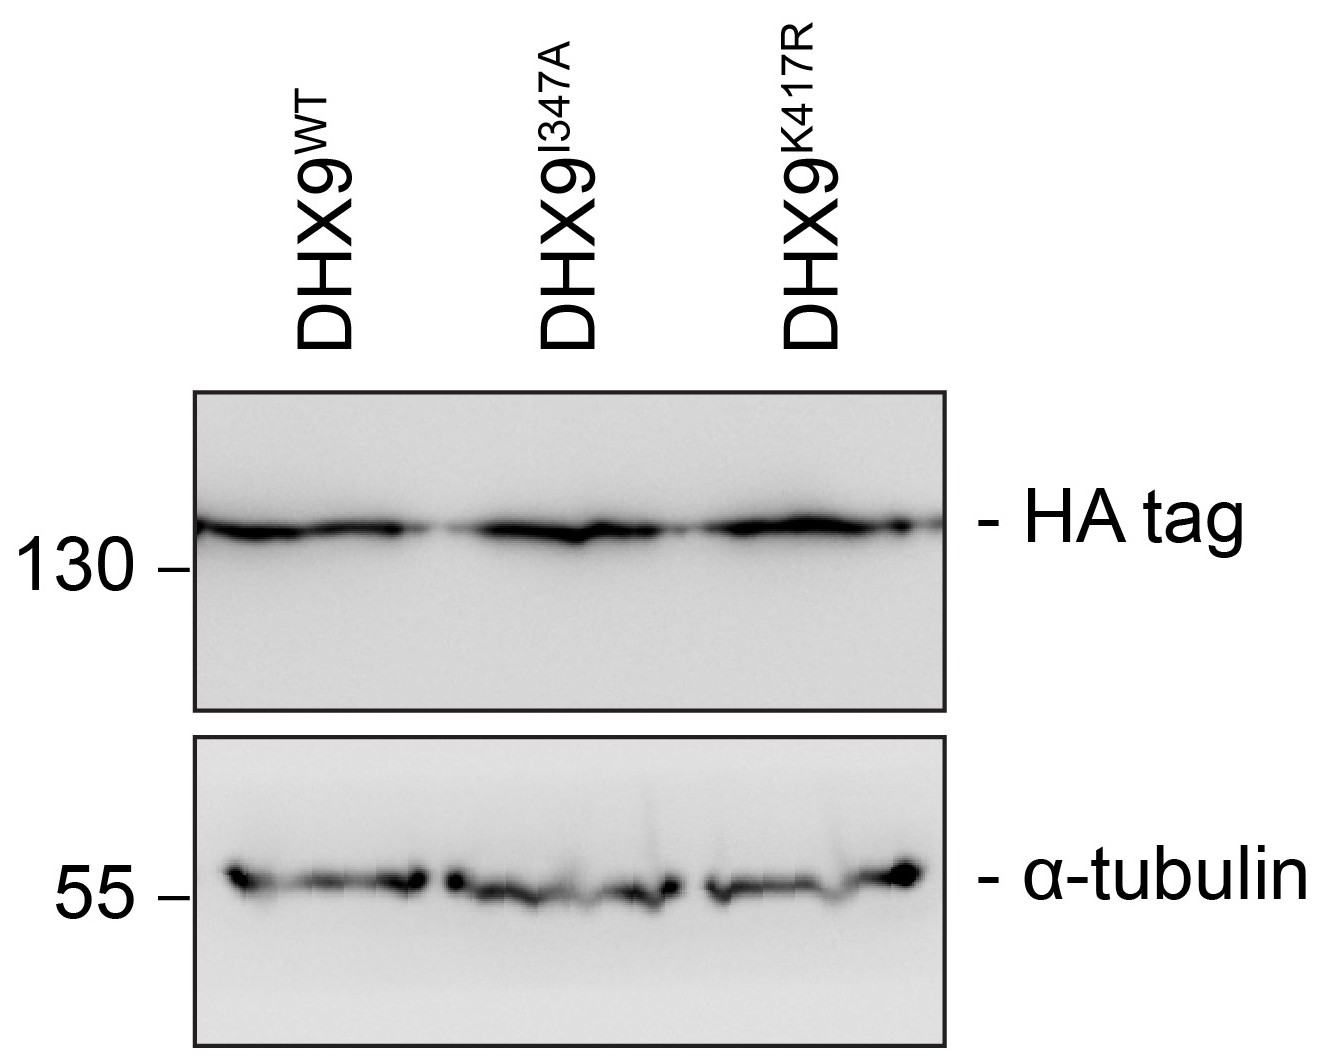
DHX9 point mutant constructs are expressed at levels similar to WT.
Western blots of proteins derived from HEK293T cell lysates expressing the indicated DHX9 constructs were performed. These constructs contain a C-terminal HA-tag, allowing detection and comparison of protein levels. The positions of molecular mass markers (shown in kDa) are indicated on the left. α-tubulin was used as loading control.
Figure 13
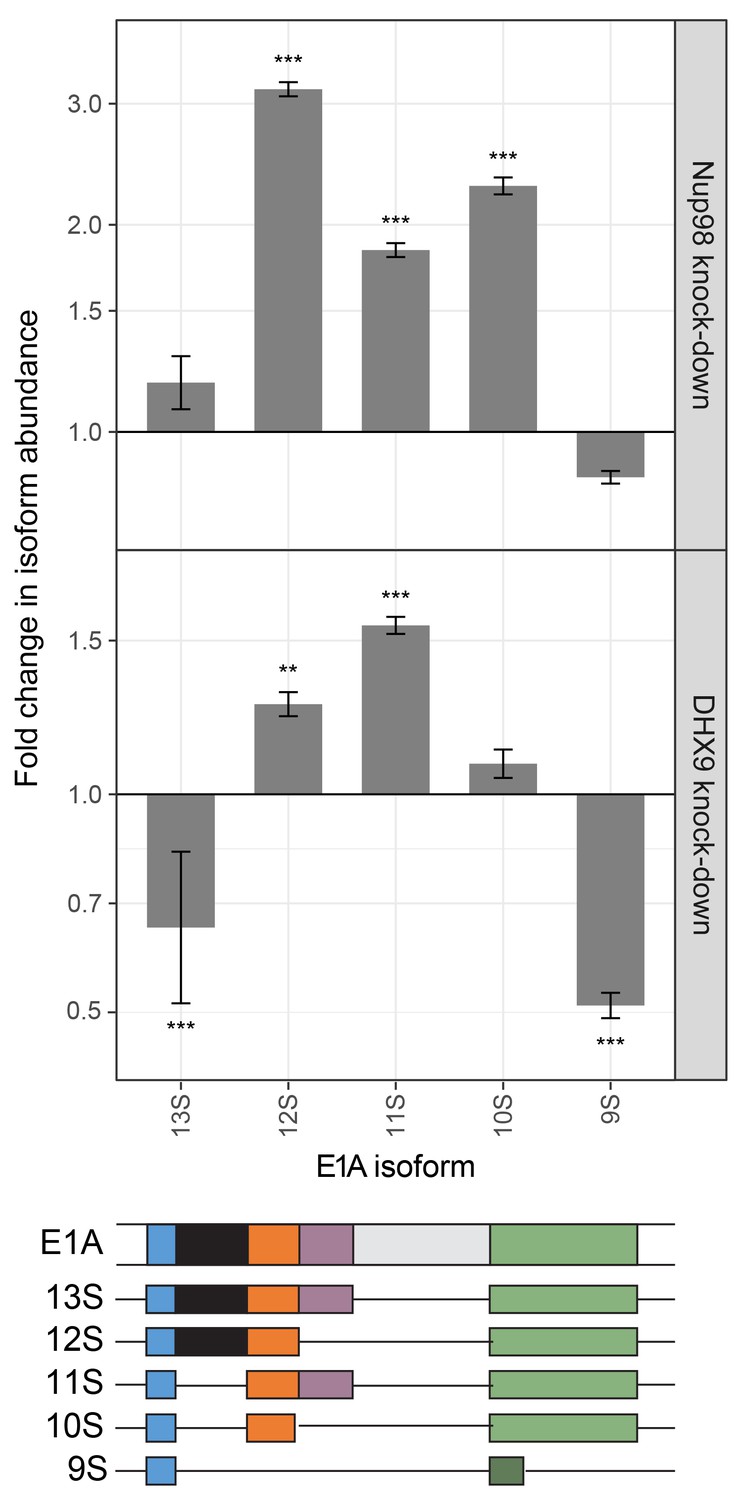
Nup98 or DHX9 depletion affects alternative splicing of E1A mRNA.
HEK293T cells were transfected with a control shRNA or an shRNA targeting Nup98 or DHX9. RNA from these cells was reverse transcribed and cDNAs used as template in qPCR reactions containing primers specific to different splice isoforms of the E1A mRNA (see bottom diagram). The abundance of each E1A splice isoform was normalized to total E1A transcript present in the same sample. Fold change in the normalized abundance of different E1A splice isoforms between the knock-down and control samples are shown in the y-axis. Error bars indicate standard deviation for biological replicates. Results from three biological replicates were submitted to ANOVA followed by Tukey HSD tests. Adjusted p-values are indicated as *** < 0.001 < ** < 0.01 for Tukey HSD in pairwise comparisons between E1A splice isoforms mRNA amounts from cells depleted of DHX9 or Nup98 and mock-depleted cells.
Additional files
-
Supplementary file 1
Supplemental information.
(A) Complete mass spectrometry data exported from PEAKS software. (B) List of plasmids. (C) List of shRNAs. (D) List of primers.
- https://doi.org/10.7554/eLife.18825.028
Download links
A two-part list of links to download the article, or parts of the article, in various formats.
Downloads (link to download the article as PDF)
Open citations (links to open the citations from this article in various online reference manager services)
Cite this article (links to download the citations from this article in formats compatible with various reference manager tools)
Human Nup98 regulates the localization and activity of DExH/D-box helicase DHX9
eLife 6:e18825.
https://doi.org/10.7554/eLife.18825


