Dynamic control of gene regulatory logic by seemingly redundant transcription factors
- University of California, San Diego, United States
Figures
Figure 1 with 2 supplements
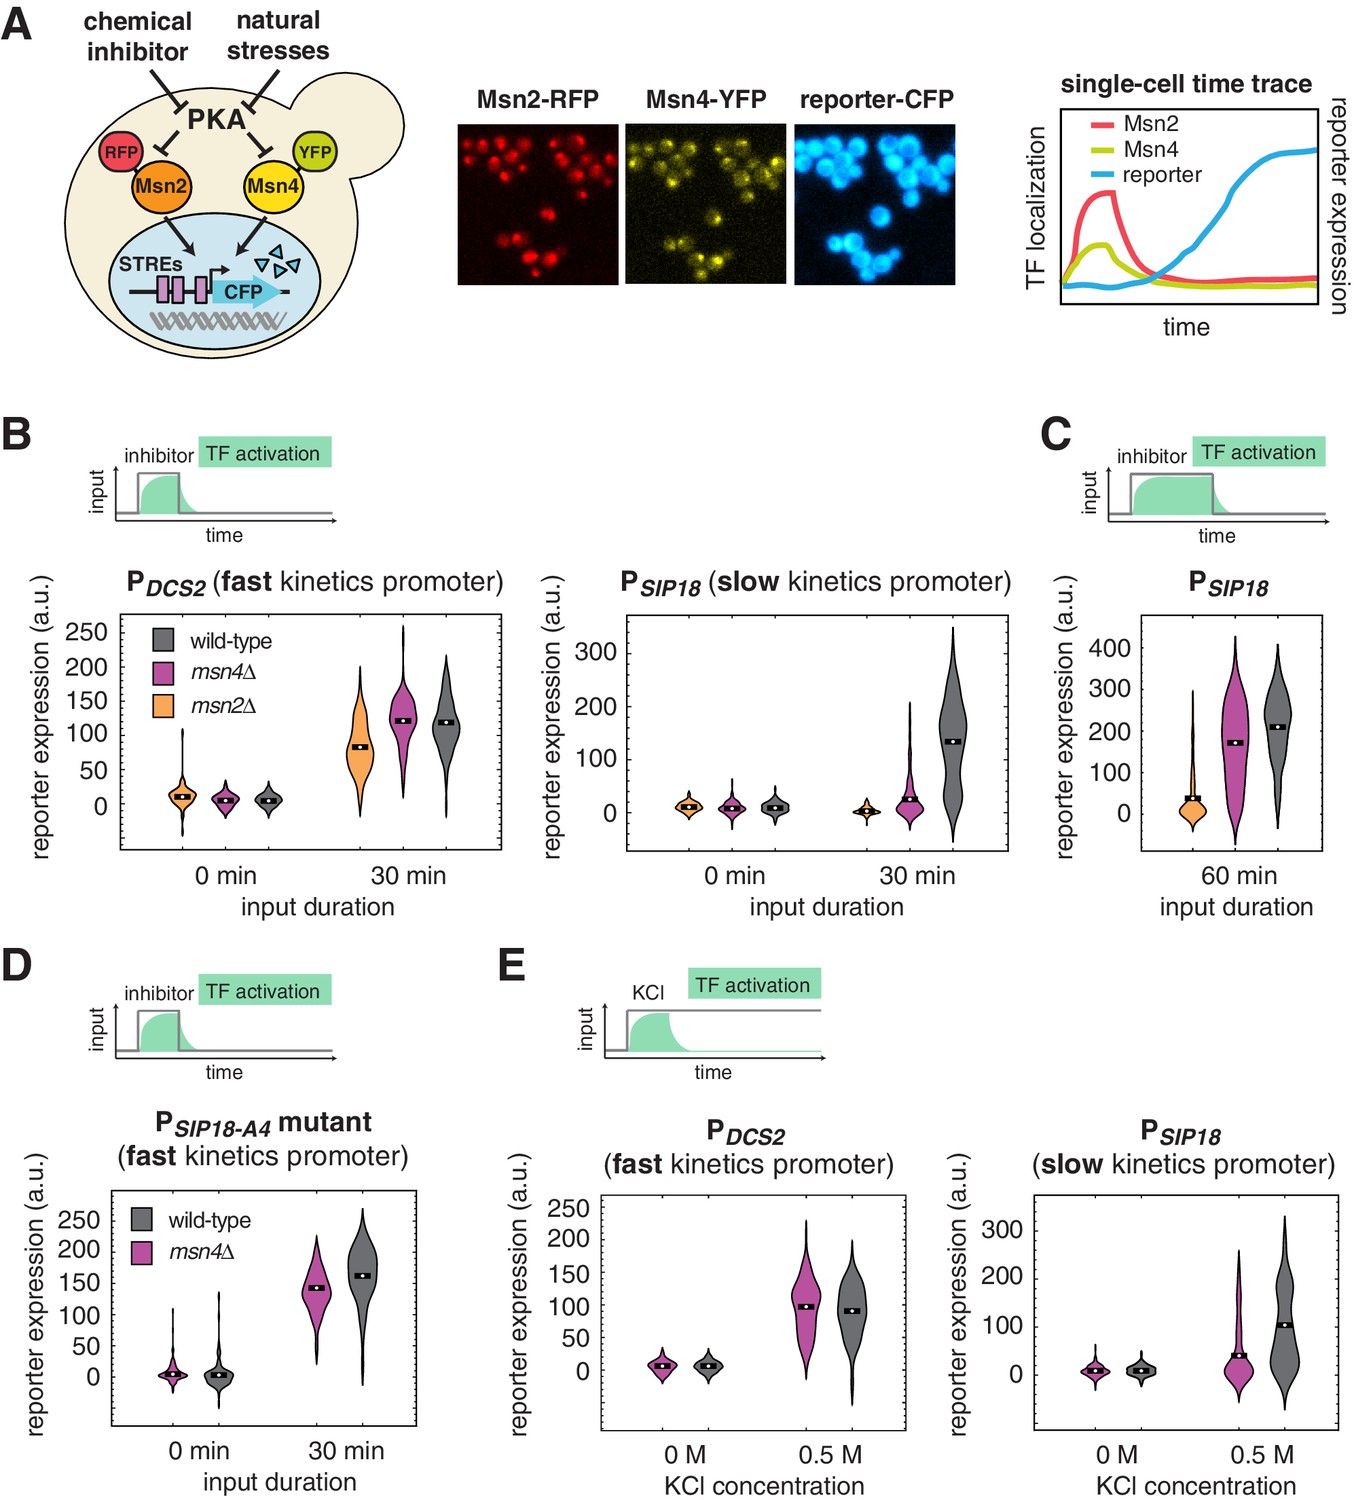
Msn4 is required for the induction of target genes with slow promoter kinetics.
(A) Homologous TFs Msn2 and Msn4 are regulated by the same upstream PKA signals in response to natural stresses or chemical inhibitors and control a common set of target genes with stress response elements (STREs) in their promoters. In the same strain, Msn2 and Msn4 are fused with RFP and YFP respectively, at their native loci; a CFP reporter under the Msn2/4 specific promoter is introduced to monitor gene expression responses. Middle: Translocation of Msn2-RFP and Msn4-YFP and reporter gene expression can be monitored in the same single cells over time. Right: In response to stimulation, time traces of Msn2 and Msn4 translocation and reporter gene expression can be quantified for each single cell. For each condition, single-cell data are collected from at least three independent experiments. (B) Violin plots showing the distributions of reporter expression under (left) the fast kinetics promoter PDCS2 or (right) the slow kinetics promoter PSIP18 in single cells in response to 3 μM inhibitor inputs with 30-min pulse duration (illustrated by the top inset) in wild-type, msn2Δ, and msn4Δ strains, respectively (n: ~300 cells per condition per strain). The mean value of single cell responses was labeled using the black bar for each condition. The expression of the reporter gene was tracked in single cells over a 3-hr period in which the reporter fluorescence in most cells has already reached the plateau. The last point of each single-cell time trace was used in the plots (a.u.: arbitrary units). (C) Violin plots showing the distributions of reporter expression under the slow kinetics promoter PSIP18 in response to a 60 min pulse of inhibitor input. (D) Violin plots showing the distributions of reporter expression under the faster mutant promoter PSIP18-A4 in wild-type and msn4Δ strains, respectively, in response to 30-min inhibitor input. (E) Violin plots showing the distributions of reporter expression under (left) the fast kinetics promoter PDCS2 or (right) the slow kinetics promoter PSIP18 in response to 0.5 M KCl in wild-type and msn4Δ strains, respectively. The sustained KCl stimulation leads to a transient pulse of TF activation, as illustrated in the top cartoon panel.
Figure 1—figure supplement 1
Dynamic profiles of reporter gene expression.
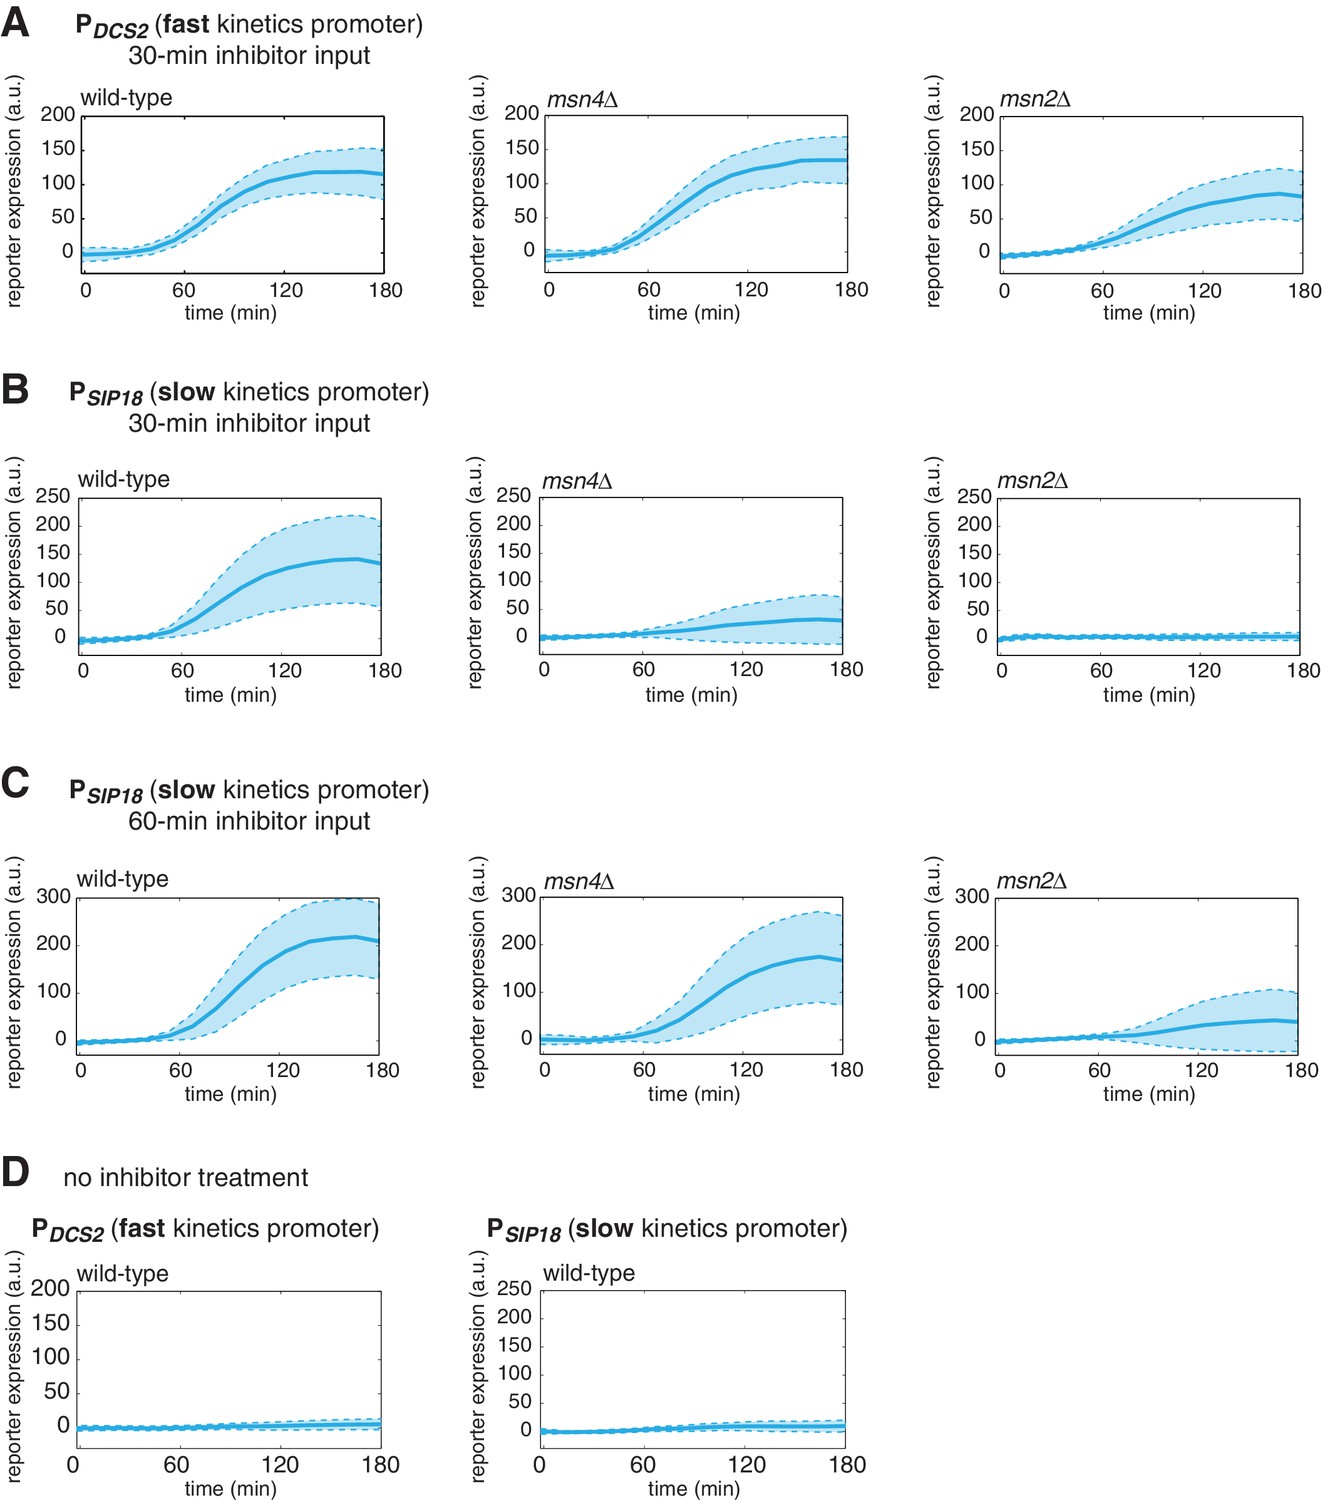
Averaged single-cell time traces of reporter gene expression under (A) the fast kinetics promoter PDCS2 and (B) the slow kinetics promoter PSIP18, in response to 30-min inhibitor inputs, (C) the slow kinetics promoter PSIP18, in response to 60-min inhibitor inputs, and (D) under no inhibitor condition. The single-cell data are the same data used to generate Figure 1B and C. The solid curves represent the averaged single-cell time traces; the shaded regions represent the standard deviations of single cell responses. For each condition, single-cell responses have been measured over a 3-hr period, which is sufficient for the fluorescent gene expression reporter to reach the plateau in most cells.
Figure 1—figure supplement 2
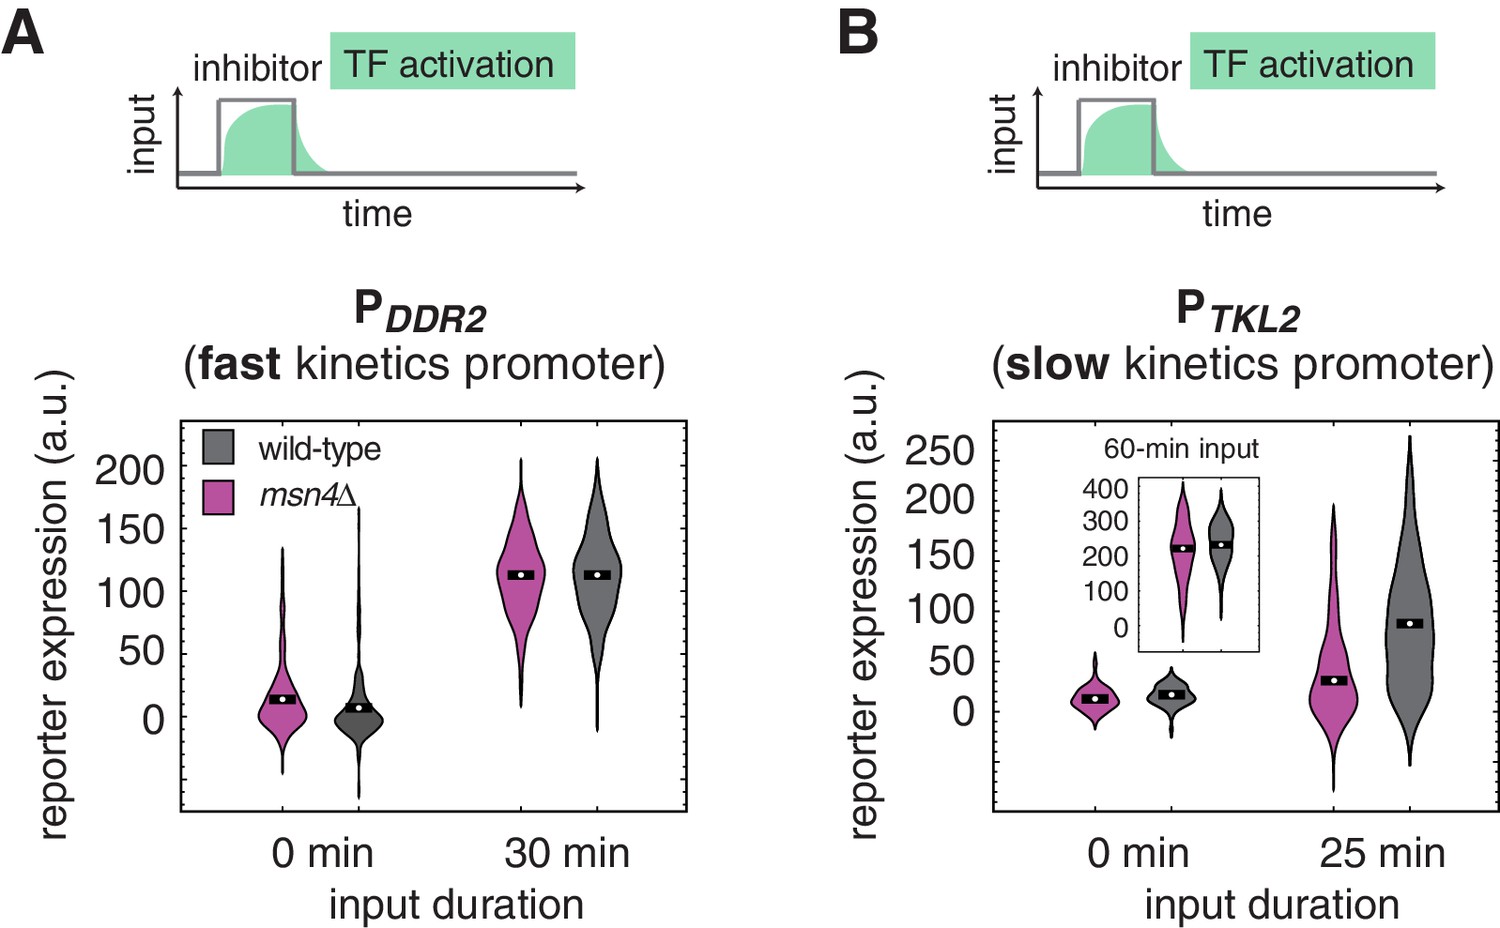
The dependence on Msn4 might expand generally to slow kinetics promoters.
Violin plots showing the distributions of reporter expression under (A) the fast kinetics promoter PDDR2 and (B) the slow kinetics promoter PTKL2, respectively. In (B), the inset shows the distributions of PTKL2 reporter expression in response to 60 min pulse of inhibitor input.
Figure 2 with 2 supplements
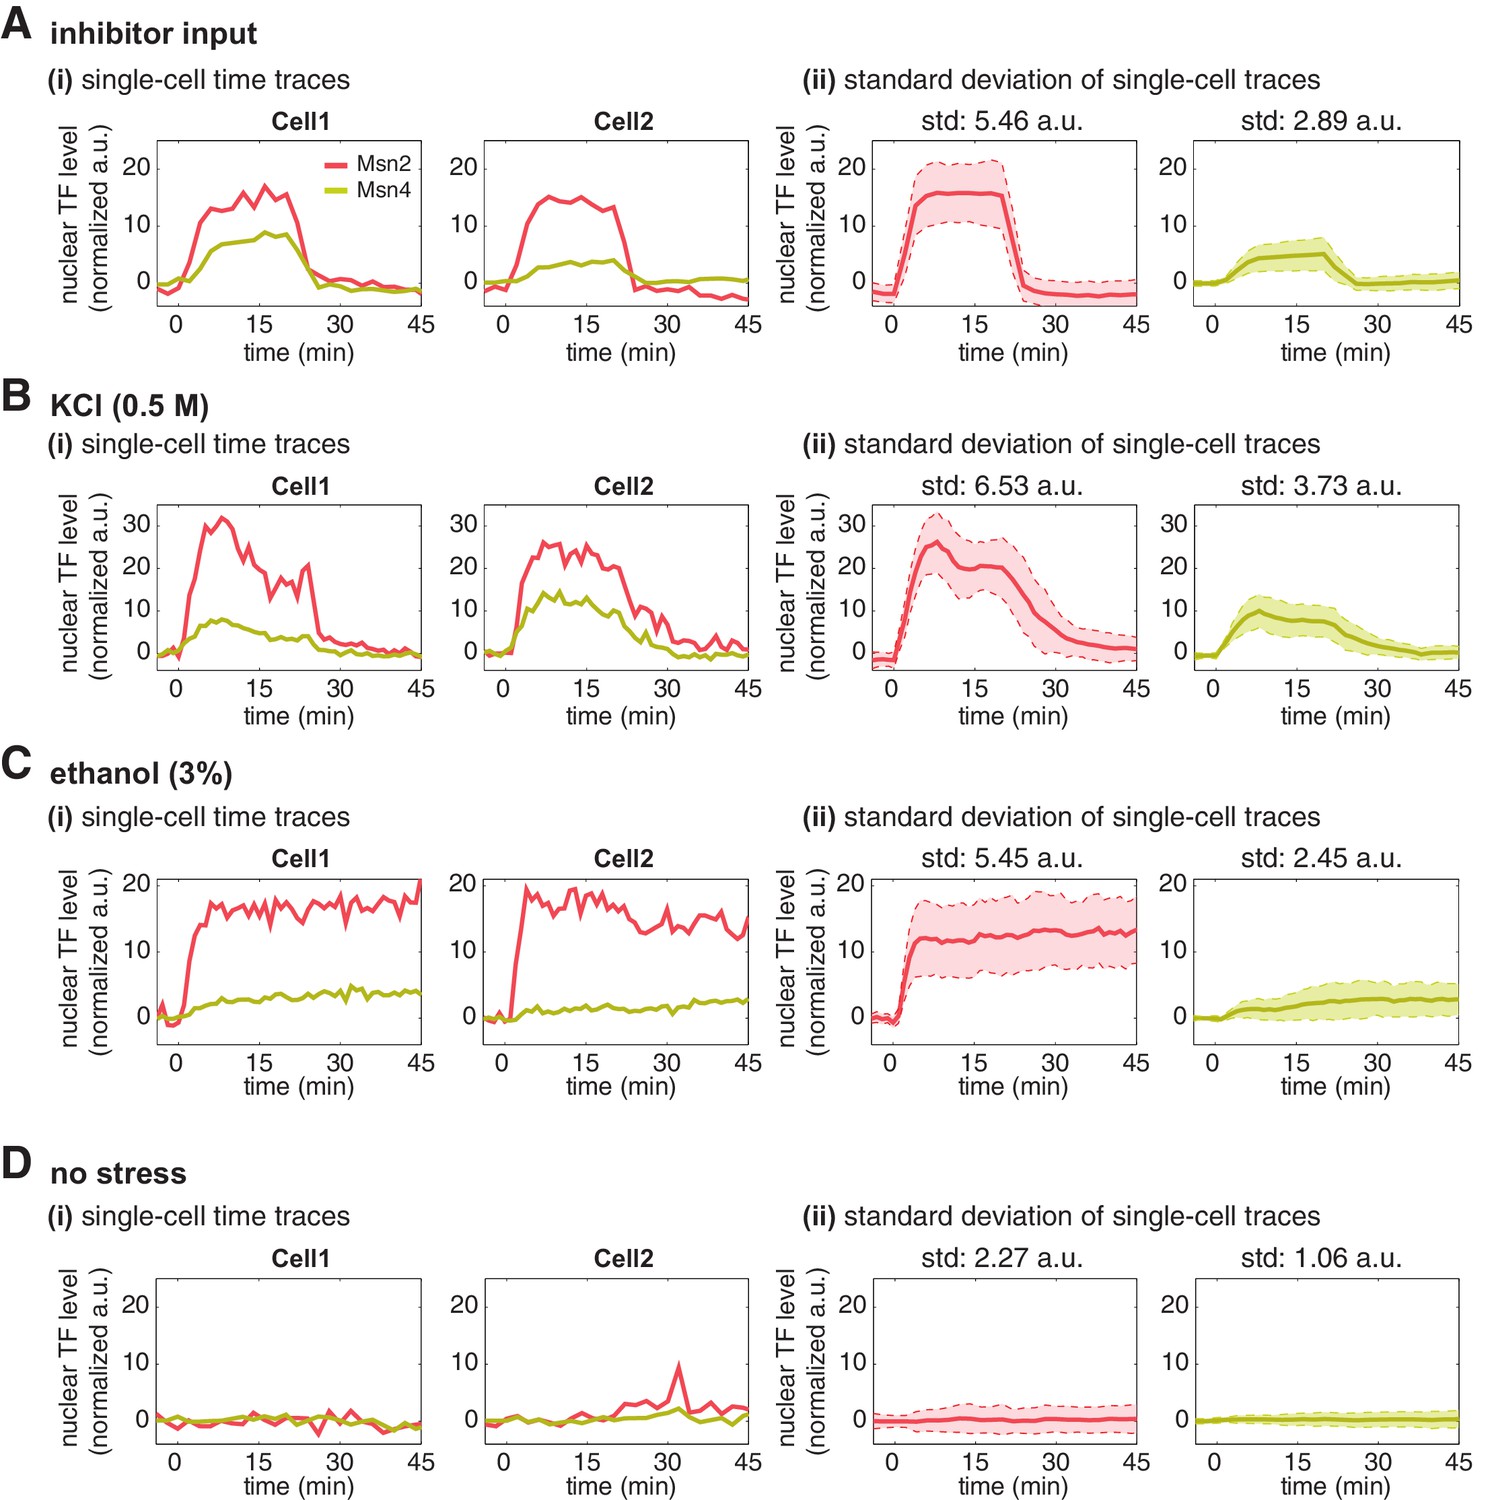
Msn2 and Msn4 show different levels of heterogeneity in single cells.
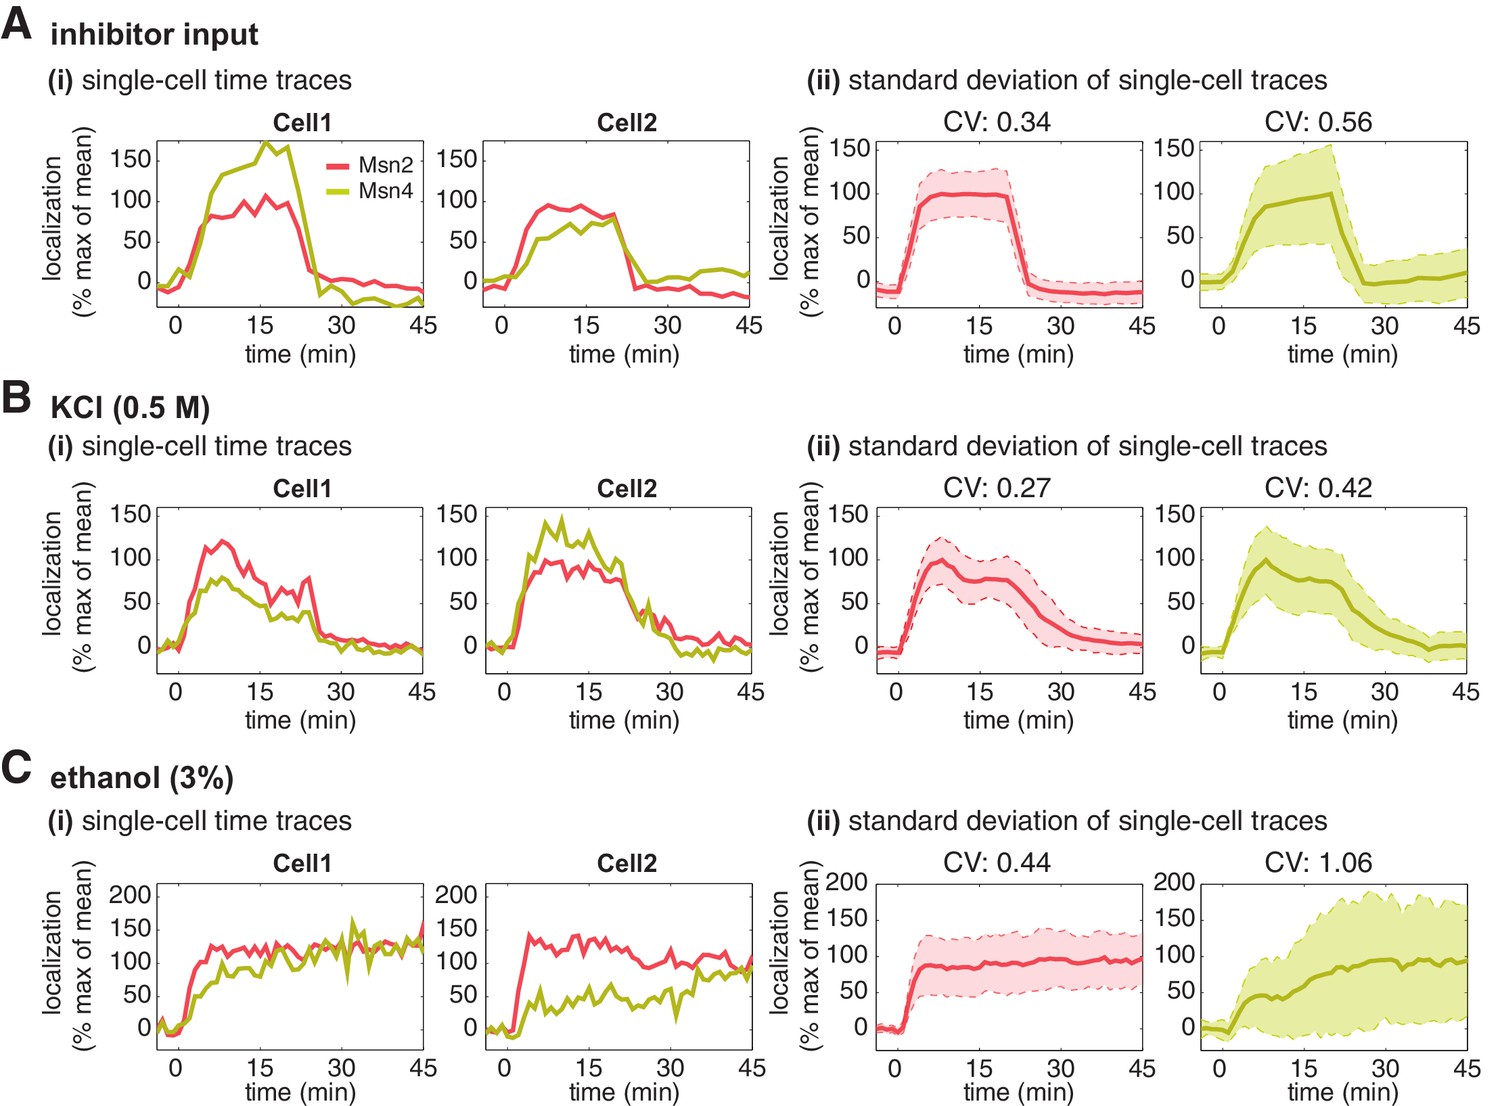
Time traces of Msn2 and Msn4 nuclear translocation in the same single cells in response to (A) 20-min 1 μM inhibitor pulse, (B) 0.5M KCl, or (C) 3% ethanol. In each panel, (i) representative single-cell time traces of Msn2 and Msn4 nuclear translocation in the same single cells; (ii) standard deviation of single-cell time traces. For each condition, the single-cell time traces and standard deviations of single cell responses are scaled by the peak value of the averaged time traces (% max of mean). In (ii), the solid curve represents the averaged time trace; the shaded region represents the scaled standard deviation of single cell responses. The coefficient of variation (CV; the standard deviation divided by the mean) is calculated for the peak time point of time traces for each condition and displayed above each time trace.
Figure 2—figure supplement 1

A direct comparison of the levels of Msn2 and Msn4 nuclear localization in the same cells.
(A) To directly compare the nuclear level of Msn2-RFP relative to that of Msn4-YFP in the same single cells (Figure 1A), a scaling factor between RFP and YFP is needed to account for unique microscope settings used in each channel as well as inherent emission differences between each fluorophore. This was determined by creating two yeast strains in which Msn2 was C-terminally tagged with either florescent protein RFP or YFP, respectively (illustrated in the top panel). Left: Sustained nuclear translocation of Msn2 was induced in both stains with an identical stimulus and the averaged single-cell time traces of Msn2 translocation were generated for both strains (n: ~100 cells per strain). Right: The scaling factor (1.52) was determined by taking the ratio between the maximal fluorescence intensity of each averaged trace. The time trace of Msn2-RFP, when times the scaling factor (dashed curve), overlaps with the time trace of Msn2-YFP. Therefore, this factor normalizes the fluorescence arbitrary unit of RFP with the fluorescence arbitrary unit of YFP and enables the direct comparison of the nuclear level of Msn2-RFP with that of Msn4-YFP in the same single cells (in the unit of 'normalized a.u.'). (B) Averaged time traces of Msn2 and Msn4 nuclear translocation in the same single cells in response to 20-min 1 μM inhibitor pulse, 0.5M KCl, or 3% ethanol, as indicated. The top left panel illustrates that Msn2-YFP and Msn4-RFP are expressed in the same strain. The averaged traces were normalized by the scaling factor to allow a direct comparison of Msn2 and Msn4 in the same cells. (C) Averaged time traces of Msn2 and Msn4 nuclear translocation from the same cells were normalized as% of max. The traces were plotted together and zoomed in to the early time period of the response to demonstrate the small time delay of Msn4 translocation.
Figure 2—figure supplement 2
Single-cell time traces of Msn2 and Msn4 after normalization of YFP and RFP fluorescence.
After the YFP and RFP normalization as shown in Figure 2—figure supplement 1, time traces of Msn2 and Msn4 nuclear translocation are plotted in the same single cells in response to (A) 20-min 1 μM inhibitor pulse, (B) 0.5M KCl, (C) 3% ethanol, or (D) no stress. Each panel shows (i) representative single-cell time traces of Msn2 and Msn4 nuclear translocation in the same single cells; (ii) standard deviation of single-cell time traces. For each condition, the single-cell time traces and standard deviations of single cell responses are normalized so that the levels of Msn2 and Msn4 can be compared directly. In (ii), the solid curve represents the averaged time trace; the shaded region represents the standard deviation of single cell responses. The standard deviation is calculated for the peak time point of time traces for each condition and displayed above each time trace. For the condition without stress, the standard deviation is calculated for the time point used in the inhibitor condition.
Figure 3 with 6 supplements
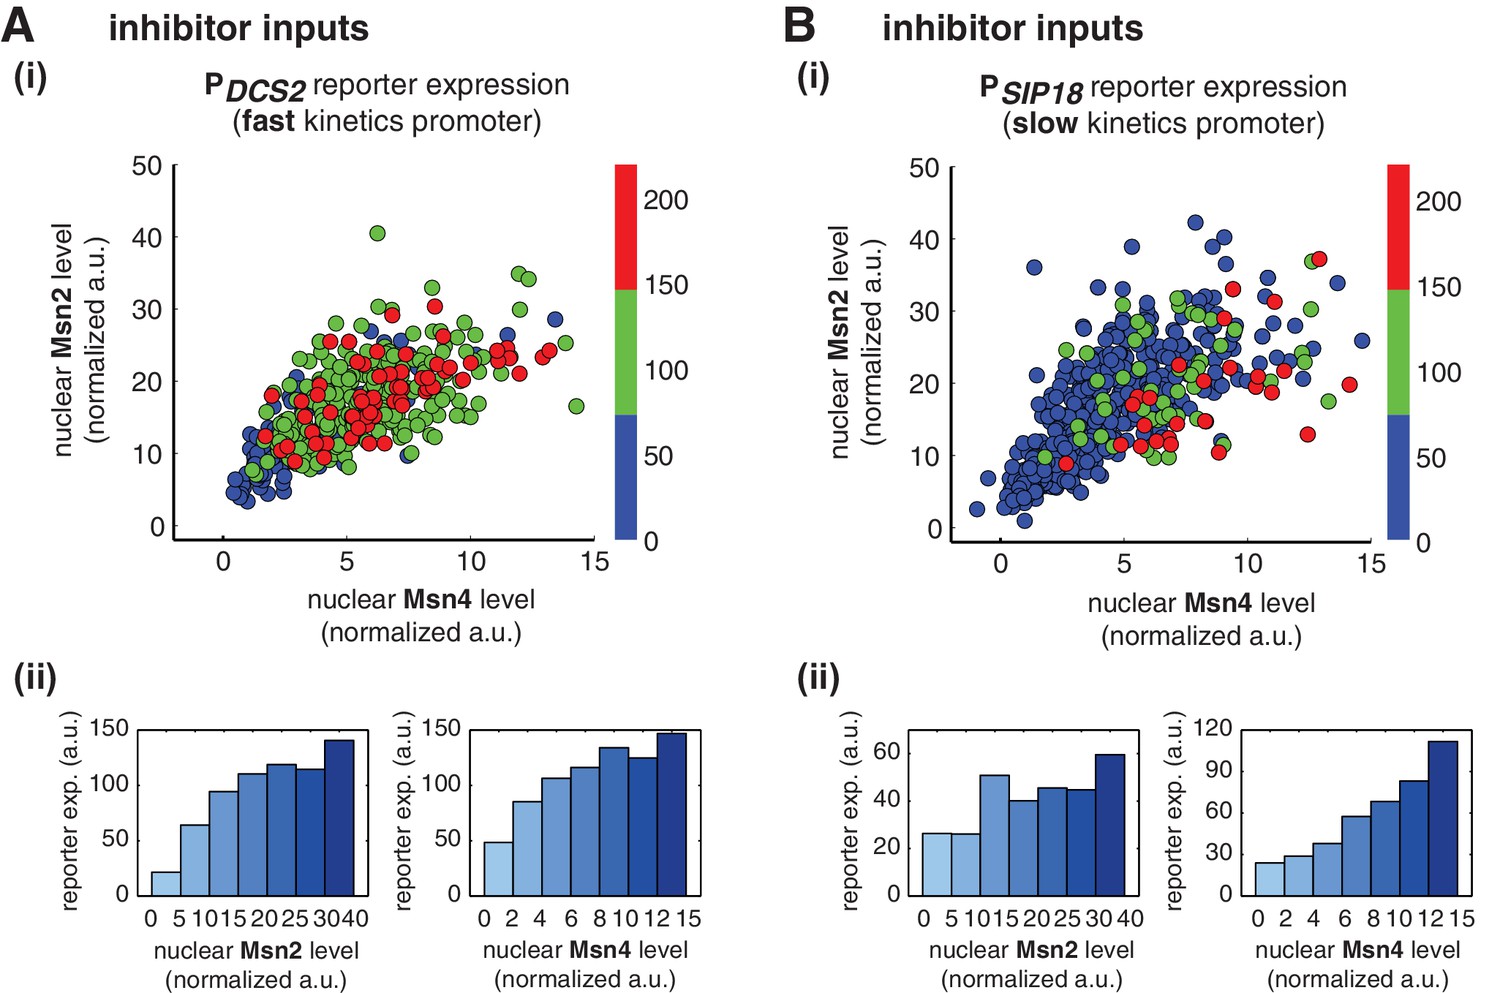
Msn2 and Msn4 exhibit distinct gene regulatory functions in single cells in response to 30-min inhibitor inputs.
(A) (i) A scatter plot showing the relationship of the fast kinetics promoter PDCS2 reporter expression with Msn2 and Msn4 activation at the single cell level. Each dot represents a single cell. Single-cell time traces were tracked over a 3-hr period in which the reporter fluorescence in most cells has already reached the plateau. The x and y axes represent the peak values of Msn4 and Msn2 nuclear translocation (the maximal values in the first 30 min of translocation time traces), respectively; and the dot color represents the maximal level of gene expression as indicated in the color bar. To cover the full dynamic range of TF translocation, the data from the experiments using 30 min inhibitor pulses with 0.1, 0.25, 0.5, 0.75 and 1 μM doses have been combined (n: 444 cells). (ii) Plots show the relationships between PDCS2 reporter expression and (left) Msn2 or (right) Msn4, respectively. Single cells are binned based on their Msn2 or Msn4 nuclear level as indicated in the x-axis and the average of reporter expression is calculated for each binned groups of single cells and shown in the bar graphs. (B) Scatter plots and bar graphs showing the relationship of the slow kinetics promoter PSIP18 reporter expression with Msn2 and Msn4 activation at the single cell level. The data analysis and presentation schemes are consistent with those in (A) (n: 595 cells). Single-cell data used in these plots are provided in the source data files.
-
Figure 3—source data 1
Source data for Figure 3A.
- https://doi.org/10.7554/eLife.18458.010
-
Figure 3—source data 2
Source data for Figure 3B.
- https://doi.org/10.7554/eLife.18458.011
Figure 3—figure supplement 1

Single-cell distributions of reporter gene expression versus nuclear TF levels in response to 30-min inhibitor inputs.
(A) Single-cell scatter plots showing the relationships between PDCS2 reporter expression with (left) Msn2 or (right) Msn4 nuclear level, respectively. Single-cell data are from Figure 3A. (B) Single-cell scatter plots showing the relationships between PSIP18 reporter expression with (left) Msn2 or (right) Msn4 nuclear level, respectively. Single-cell data are from Figure 3B.
Figure 3—figure supplement 2
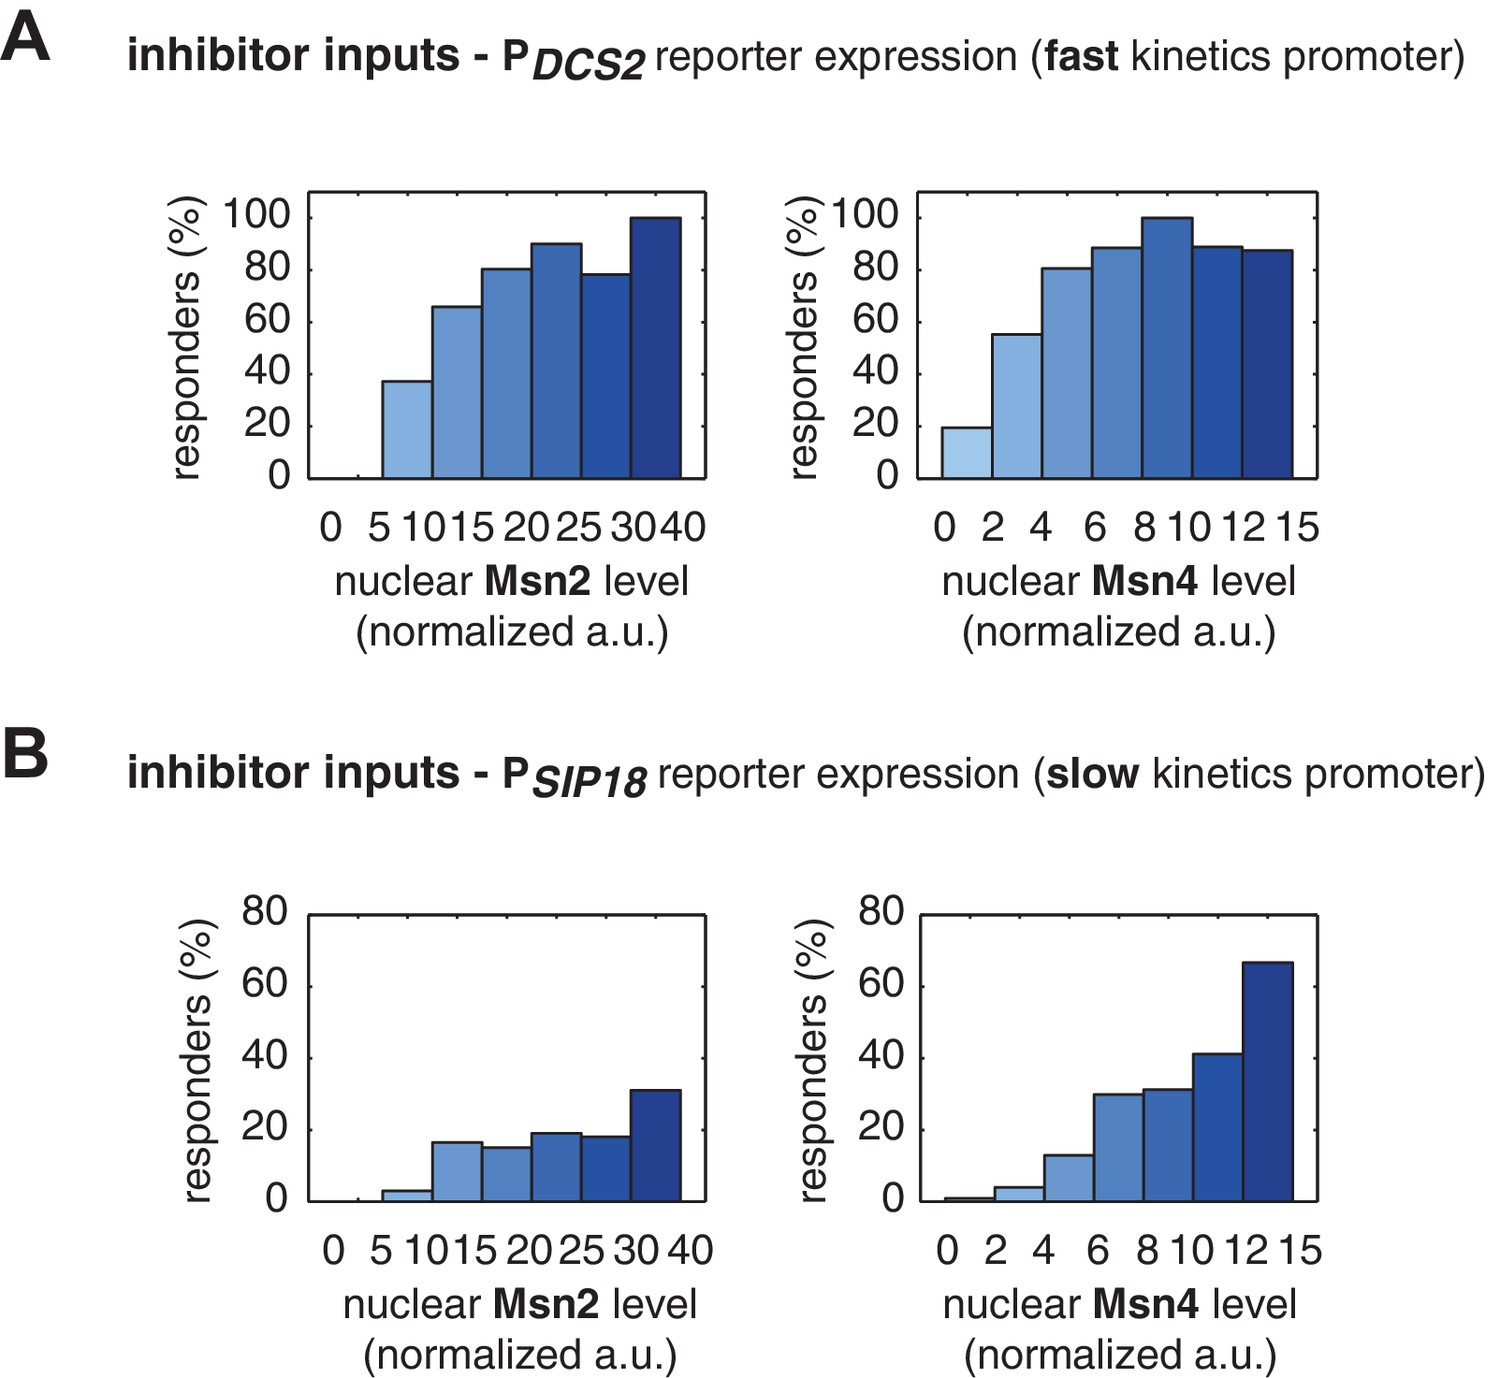
The relationship between the probability of reporter gene expression and nuclear TF levels in response to 30-min inhibitor inputs.
(A) Bar graphs showing the relationships between the probability of PDCS2 reporter expression with (left) Msn2 or (right) Msn4 nuclear level, respectively. Single-cell data are from Figure 3A. Single cells are binned based on their Msn2 or Msn4 nuclear level as indicated in the x-axis and the proportion of 'responder' cells (green and red cells in Figure 3), instead of the average of reporter expression, is calculated for each binned groups of single cells and shown in the bar graphs. (B) Bar graphs showing the relationships between the probability of PSIP18 reporter expression with (left) Msn2 or (right) Msn4 nuclear level, respectively. Single-cell data are from Figure 3B.
Figure 3—figure supplement 3
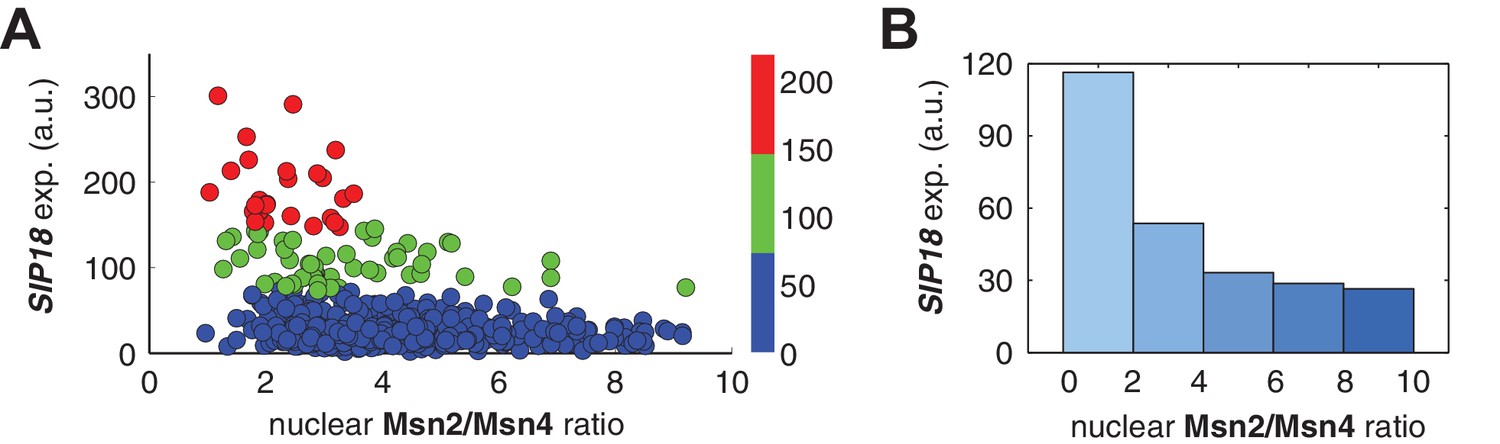
Relationship between PSIP18 reporter gene expression and the ratio of nuclear Msn2 versus Msn4 in response to 30-min inhibitor inputs.
(A) Scatter plot showing the single-cell distribution of PSIP18 reporter expression with the ratio of nuclear Msn2 versus Msn4. Single-cell data are from Figure 3B. (B) Bar graph shows the relationship between PSIP18 reporter expression and the ratio of nuclear Msn2 versus Msn4. Single cells are binned based on their ratio of nuclear Msn2 versus Msn4 as indicated in the x-axis and the average of reporter expression is calculated for each binned groups of single cells and shown in the bar graphs.
Figure 3—figure supplement 4
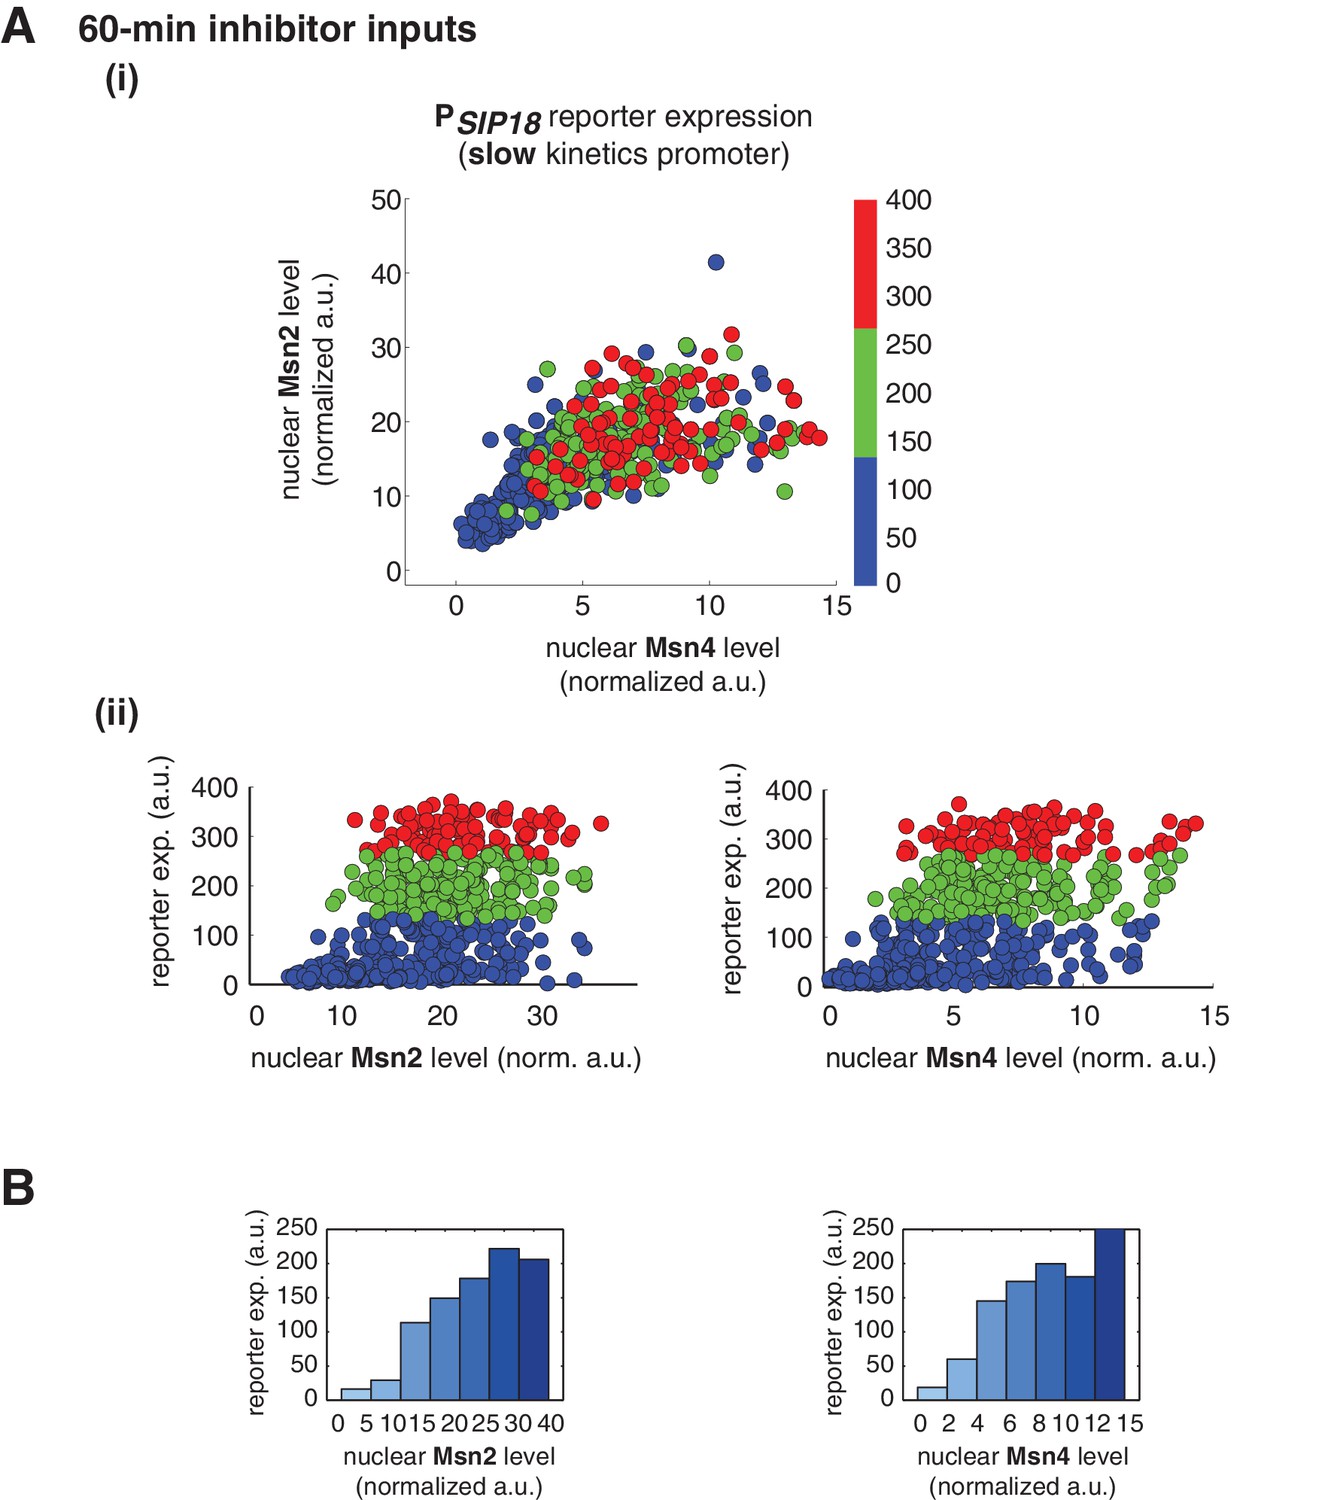
Msn2 and Msn4 exhibit similar gene regulatory functions in single cells in response to 60-min inhibitor inputs.
(A) (i) A scatter plot showing the relationship of the slow kinetics promoter PSIP18 reporter expression with Msn2 and Msn4 activation at the single cell level. To cover the full dynamic range of TF translocation, the data from the experiments using 60 min inhibitor pulses with 0.1, 0.25, 0.5, 0.75 and 1 μM doses have been combined (n: 702 cells). (ii) Single-cell scatter plots showing the relationships between PSIP18 reporter expression with (left) Msn2 or (right) Msn4 nuclear level, respectively. Single-cell data are from (i). (B) Plots show the relationships between PSIP18 reporter expression and (left) Msn2 or (right) Msn4, respectively. Single cells are binned based on their Msn2 or Msn4 nuclear level as indicated in the x-axis and the average of reporter expression is calculated for each binned groups of single cells and shown in the bar graphs.
Figure 3—figure supplement 5

Relationship between reporter gene expression and the area-under-the-curve (AUC) of nuclear TF levels in response to 30-min inhibitor inputs.
Single-cell data from Figure 3 were analyzed to show the relationship of (A) the fast kinetics promoter PDCS2 or (B) the slow kinetics promoter PSIP18 reporter expression with the AUC of Msn2 and Msn4 nuclear translocation. The AUC is calculated as the sum of TF nuclear levels for each single-cell time trace (data points taken every two minutes). (i) Scatter plots showing single-cell distributions; (ii) Bar graphs showing the average level of gene expression in single cells binned based on their TF AUCs.
Figure 3—figure supplement 6

Single-cell distributions of reporter gene expression versus the speed of TF nuclear import or export.
(A) Scatter plots showing single-cell distributions of PDCS2 reporter expression versus (i) the speed of nuclear import or (ii) the speed of nuclear export of Msn2 and Msn4. The speed of nuclear translocation is quantified by the time needed to reach half maximum of nuclear translocation of Msn2 or Msn4 in response to stimulation (nuclear import speed) or upon the removal of stimulation (nuclear export speed). Single-cell data are from Figure 3A. The means of reporter expression are calculated for grouped single cells and shown using black solid lines. The mean and standard deviation of nuclear translocation times in single cells are calculated and shown above each plot. (B) Scatter plots showing single-cell distributions of PSIP18 reporter expression versus (i) the speed of nuclear import or (ii) the speed of nuclear export of Msn2 and Msn4. Single-cell data are from Figure 3B.
Figure 4 with 2 supplements
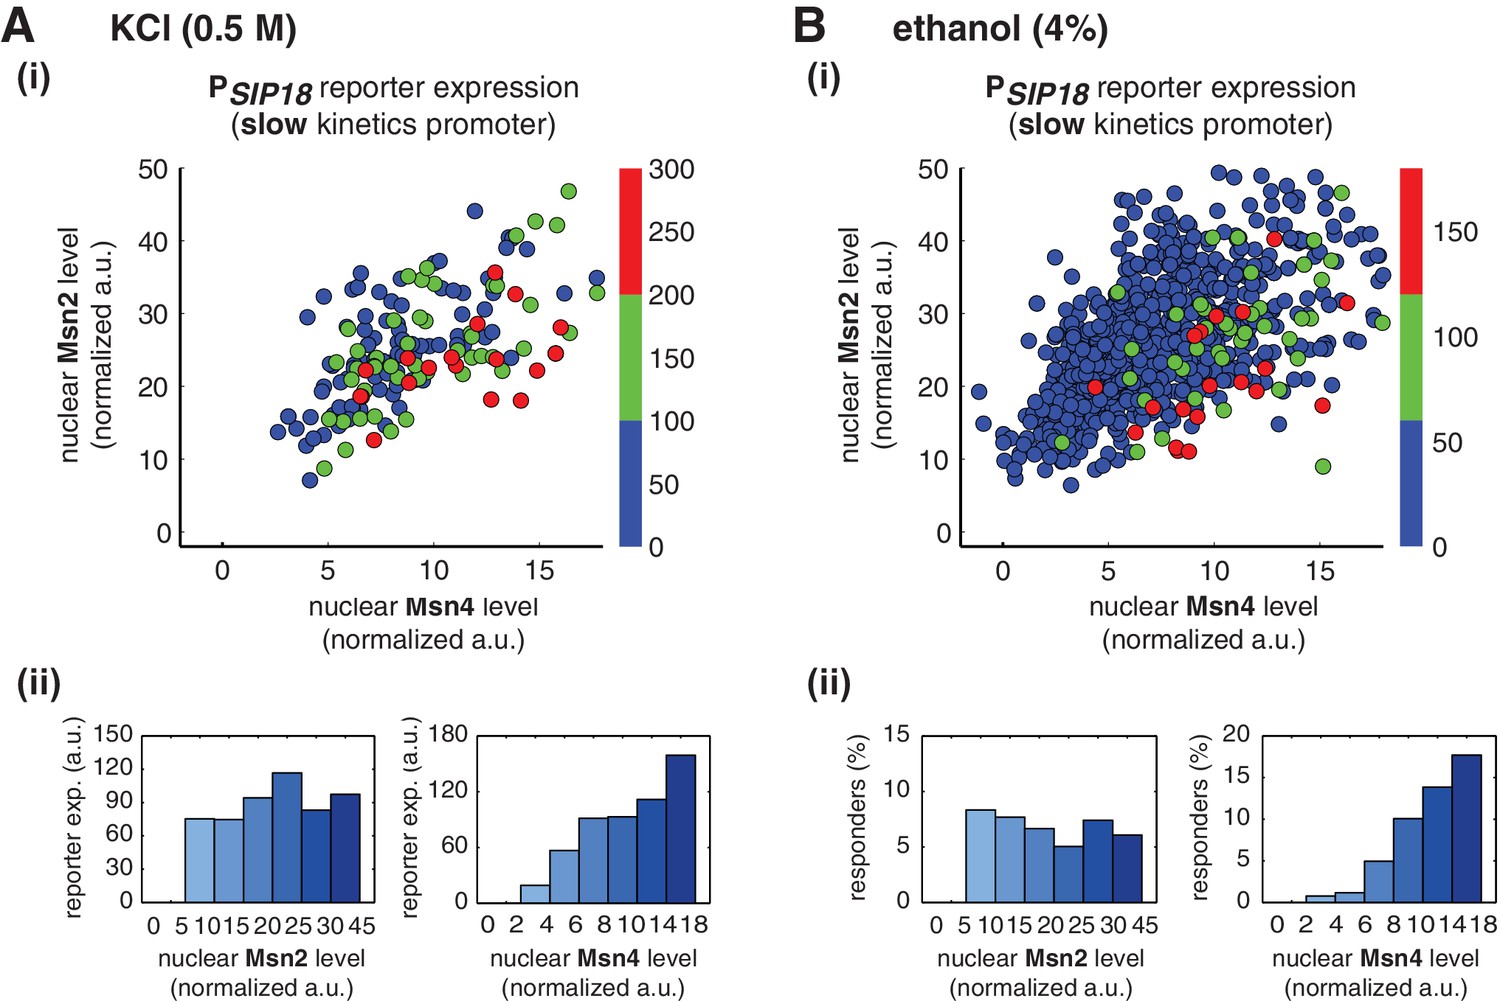
Msn2 and Msn4 exhibit distinct gene regulatory functions in single cells in response to natural stresses.
(A) (i) A scatter plot showing the relationship of the slow kinetics promoter PSIP18 reporter expression with Msn2 and Msn4 activation at the single cell level in response to 0.5M KCl. Each dot represents a single cell. The x and y axes represent the peak values of Msn4 and Msn2 nuclear translocation (the maximal values in the first 30 min of translocation time traces), respectively; and the dot color represents the peak level of gene expression as indicated in the color bar (n: 182 cells). (ii) Plots show the relationships between PSIP18 reporter expression and (left) Msn2 or (right) Msn4, respectively. Single cells are binned based on their Msn2 or Msn4 nuclear level as indicated in the x-axis and the average of reporter expression is calculated for each binned groups of single cells and shown in the bar graphs. (B) Scatter plots and bar graphs showing the relationship of the slow kinetics promoter PSIP18 reporter expression with Msn2 and Msn4 activation at the single cell level in response to 4% ethanol. The data analysis and presentation schemes are consistent with those in (A). Because the majority of cells are not able to express the reporter gene, the proportion of 'responder' cells (green and red cells) is quantified and shown in the bar graphs, instead of the average of reporter expression. Data from a large number of single cells are collected to obtain enough responders (n: 924 cells). Single-cell data used in these plots are provided in the source data files.
-
Figure 4—source data 1
Source data for Figure 4A.
- https://doi.org/10.7554/eLife.18458.019
-
Figure 4—source data 2
Source data for Figure 4B.
- https://doi.org/10.7554/eLife.18458.020
Figure 4—figure supplement 1

Single-cell distributions of reporter gene expression versus nuclear TF levels in response to natural stresses.
(A) Single-cell scatter plots showing the relationships between PSIP18 reporter expression and (left) Msn2 or (right) Msn4 nuclear level, respectively, in response to 0.5 M KCl. Single-cell data are from Figure 4A. (B) Single-cell scatter plots showing the relationships between PSIP18 reporter expression and (left) Msn2 or (right) Msn4 nuclear level, respectively, in response to 4% ethanol. Single-cell data are from Figure 4B. Because the majority of cells are not able to express the reporter gene, scatter plots, instead of boxplots, are used here to show the distributions of responder cells (green and red) and non-responder cells (blue) with different TF levels.
Figure 4—figure supplement 2
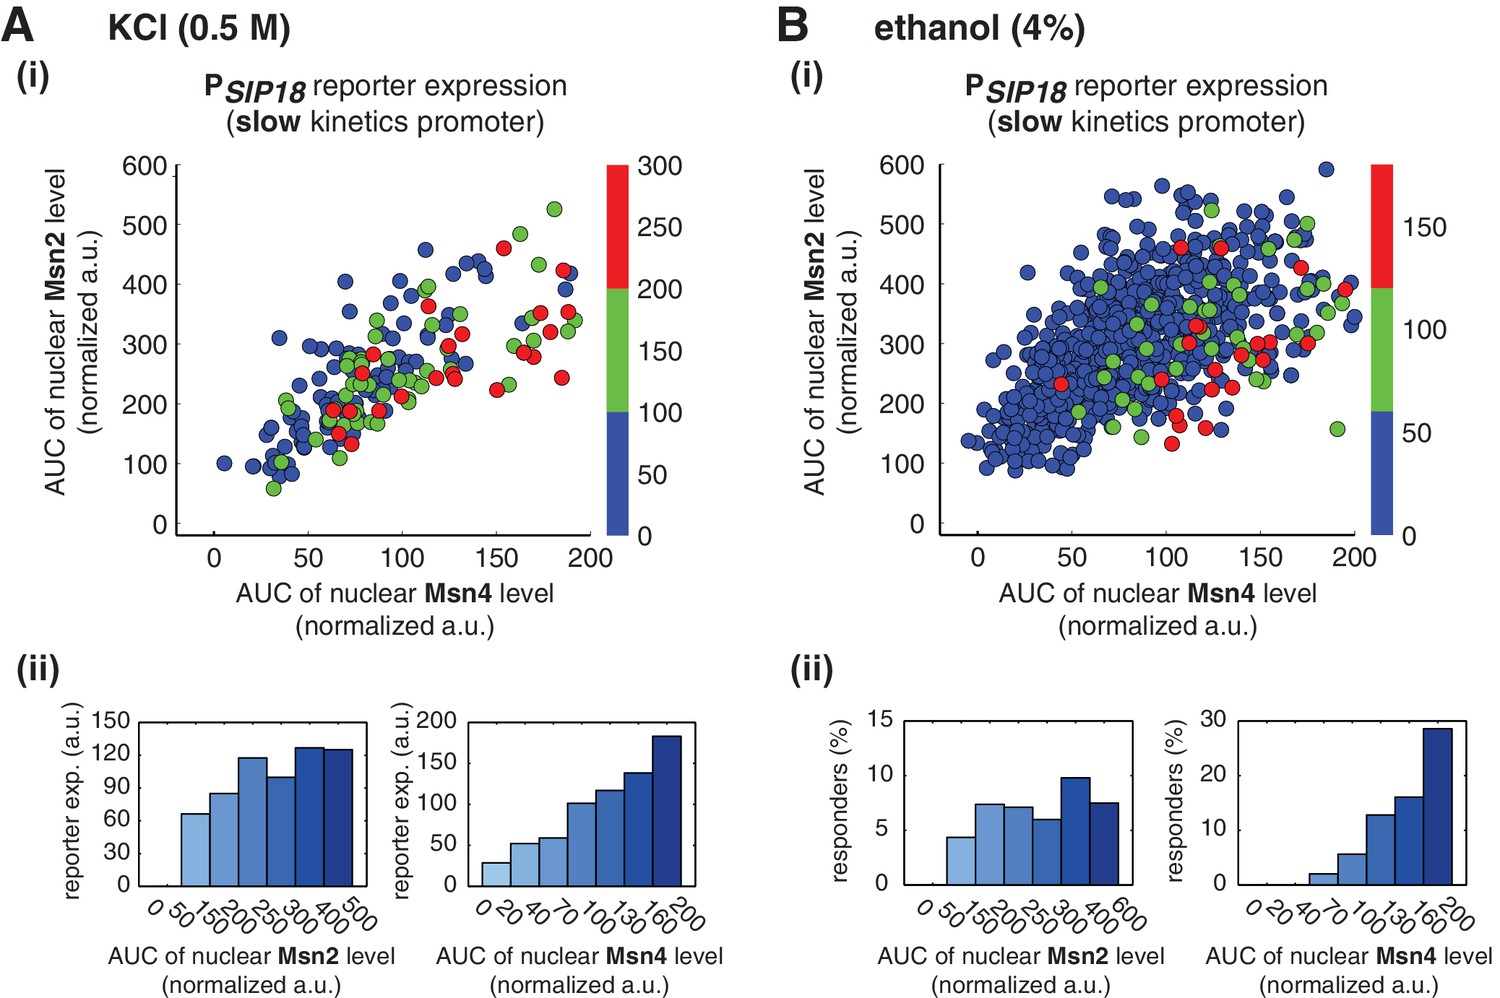
Relationship between reporter gene expression and the area-under-the-curve (AUC) of nuclear TF levels in response to natural stresses.
Single-cell data in Figure 4 were analyzed show the relationship of the slow kinetics promoter PSIP18 reporter expression with the AUC of Msn2 and Msn4 nuclear translocation in response to (A) 0.5 M KCl and (B) 4% ethanol. For the ethanol treatment, the AUC is calculated as the sum of TF nuclear levels for the first 30 min of stress treatment for each single-cell time trace (data points taken every two minutes). Due to the translational arrest induced by ethanol stress, TF nuclear localization at the later time points would not be able to contribute significantly to gene expression.
Figure 5
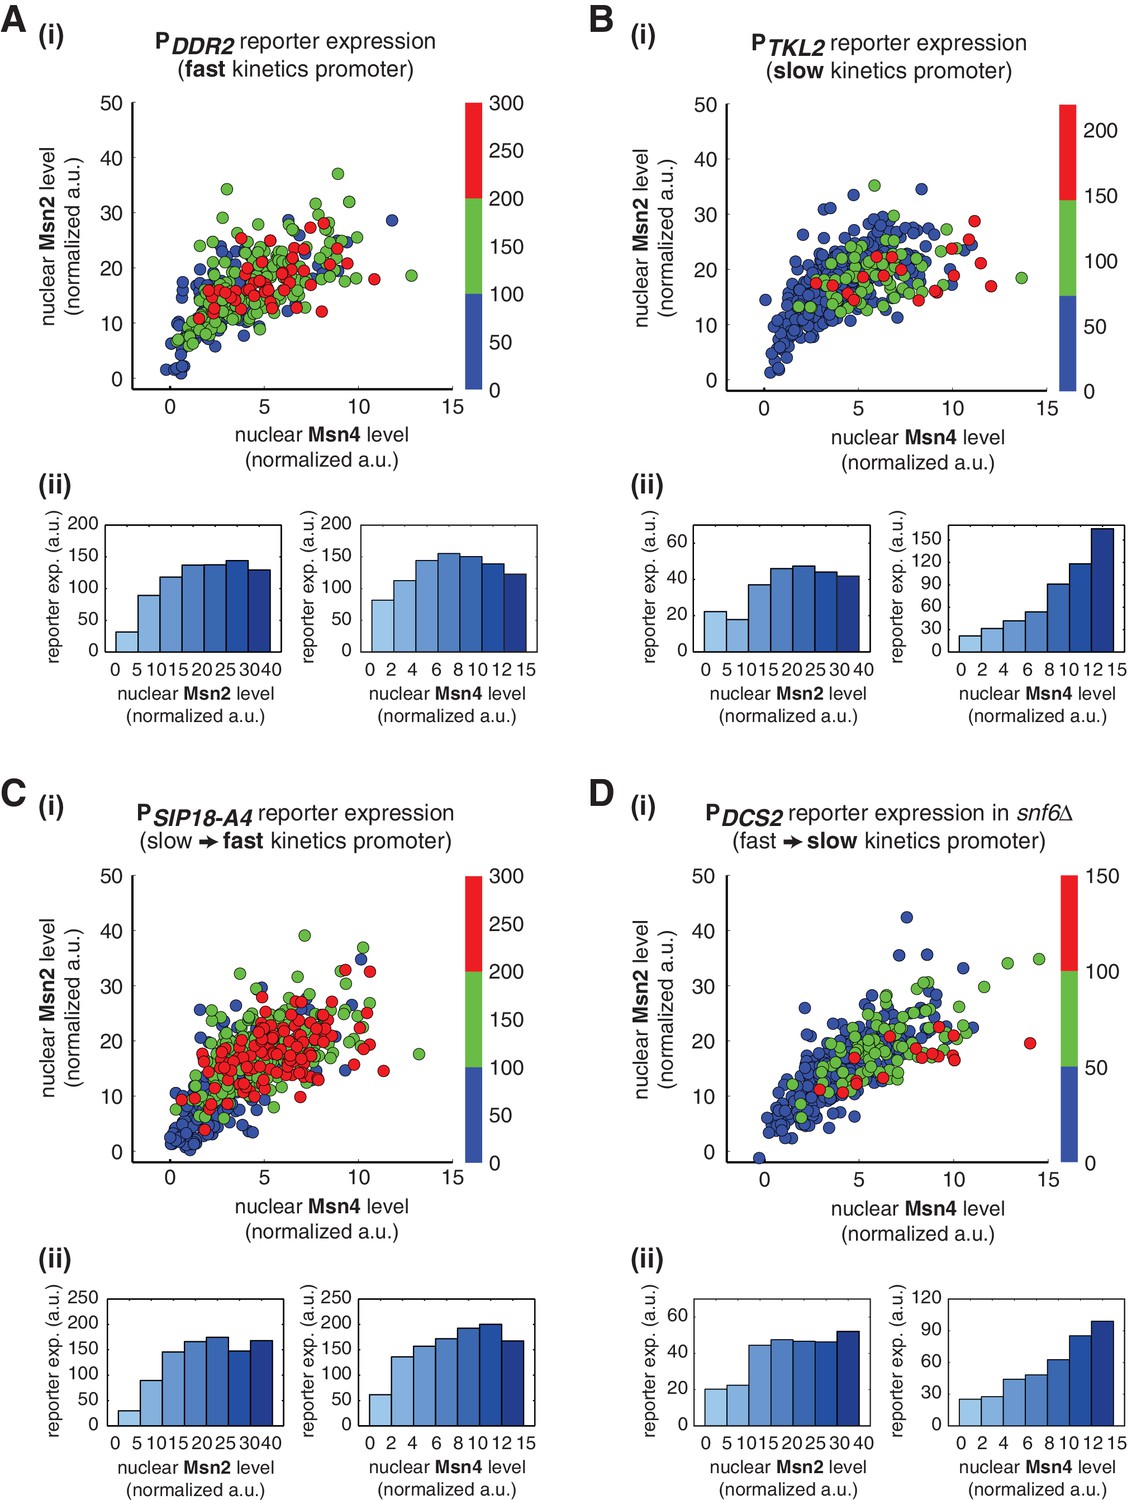
Gene regulatory functions of Msn2 and Msn4 on other fast or slow kinetics promoters.
(A) (i) A scatter plot showing the relationship of the fast kinetics promoter PDDR2 reporter expression with Msn2 and Msn4 activation at the single cell level. Each dot represents a single cell. Single-cell time traces were tracked over a 3-hr period in which the reporter fluorescence in most cells has already reached the plateau. The x and y axes represent the peak values of Msn4 and Msn2 nuclear translocation (the maximal values in the first 30 min of translocation time traces), respectively; and the dot color represents the maximal level of gene expression as indicated in the color bar. To cover the full dynamic range of TF translocation, the data from the experiments using 30 min inhibitor pulses with 0.1, 0.25, 0.5, 0.75 and 1 μM doses have been combined (n: 407 cells). (ii) Plots show the relationships between PDDR2 reporter expression and (left) Msn2 or (right) Msn4, respectively. Single cells are binned based on their Msn2 or Msn4 nuclear level as indicated in the x-axis and the average of reporter expression is calculated for each binned groups of single cells and shown in the bar graphs. Scatter plots and bar graphs showing the relationship between gene expression and Msn2 and Msn4 activation for (B) the slow kinetics promoter PTKL2 (n: 476 cells), (C) the promoter mutant PSIP18-A4 (n: 553 cells), and (D) the promoter PDCS2 in snf6Δ (n: 352 cells). The data analysis and presentation schemes are consistent with those in (A).
-
Figure 5—source data 1
Source data for Figure 5A.
- https://doi.org/10.7554/eLife.18458.024
-
Figure 5—source data 2
Source data for Figure 5B.
- https://doi.org/10.7554/eLife.18458.025
-
Figure 5—source data 3
Source data for Figure 5C.
- https://doi.org/10.7554/eLife.18458.026
-
Figure 5—source data 4
Source data for Figure 5D.
- https://doi.org/10.7554/eLife.18458.027
Figure 6 with 1 supplement
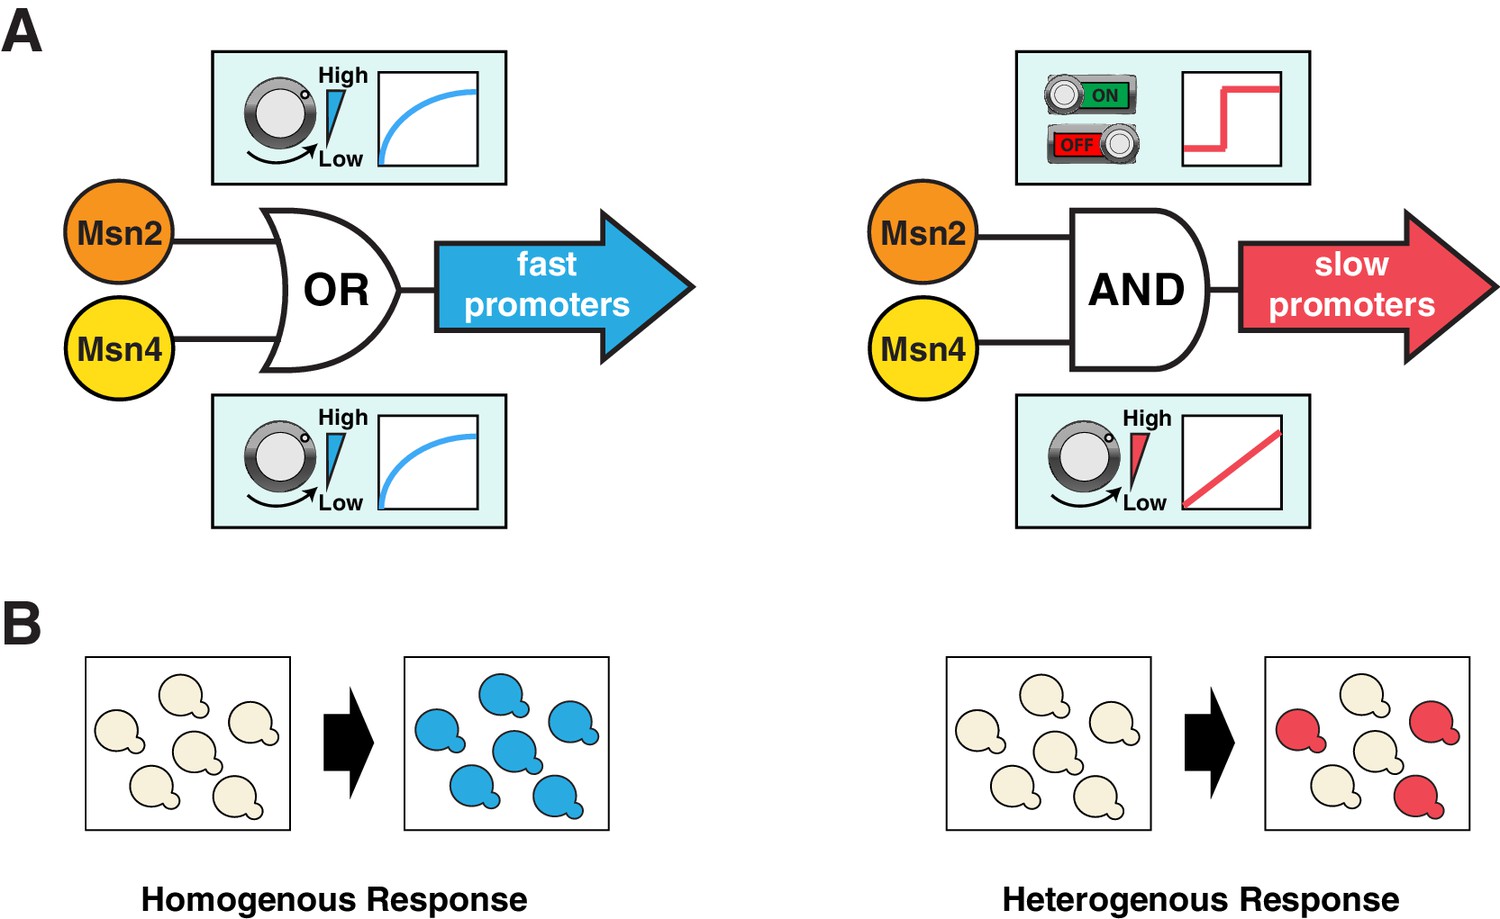
Schematics of the gene regulatory logic by Msn2 and Msn4.
(A) Diagrams illustrating the gene regulatory schemes of Msn2 and Msn4 in controlling (left) fast or (right) slow kinetics promoters. Left: Either Msn2 or Msn4 is sufficient for the induction of fast promoters, constituting an 'OR' logic gate. At the single cell level, gene expression shows a similar graded dependence on both Msn2 and Msn4 and reaches saturation upon a low TF activity. Right: Msn2 and Msn4 are both required for the induction of slow promoters, constituting an 'AND' logic gate. At the single cell level, Msn2 serves as a low threshold 'switch' turning transcription ON or OFF depending on its activity. In contrast, Msn4 functions as a 'rheostat', tuning the gene induction level in a linear fashion. (B) Diagrams illustrating how the gene regulatory schemes of Msn2 and Msn4 contribute to the heterogeneity in gene expression at the population level. Left: an 'OR' logic gate will lead to homogeneous gene expression in a cell population. Right: an 'AND' logic gate with the 'rheostat' TF Msn4 produces a heterogeneous response in a population of cells.
Figure 6—figure supplement 1

Biological functions of target genes with fast or slow kinetics promoters.
Pie charts are used to illustrate the functional enrichments for target genes with (A) fast and (B) slow kinetics promoters. Detailed functional classification for each gene in the two gene groups are shown below the pie charts. Only genes with known functions are included in the pie charts. 'Early stress response' includes the genes that are important for early transcriptional response during stresses. The groups of target genes are from Hao and O’Shea (2012).
Tables
Table 1
Yeast strains used in this work.
| Strain Name | Description |
|---|---|
| NH0084 | NHP6a-IRFP:kanMX, TPK1M164G, TPK2M147G, TPK3M165G |
| NH0094 | MSN4-mCitrineV163A, MSN2-mCherry, NHP6a-IRFP:kanMX, TPK1M164G, TPK2M147G, TPK3M165G |
| NH0095 | msn4Δ::TRP1, MSN2-mCherry, NHP6a-IRFP:kanMX, TPK1M164G, TPK2M147G, TPK3M165G |
| NH0108 | MSN4-mCitrineV163A, msn2Δ::natMX, NHP6a-IRFP:kanMX, TPK1M164G, TPK2M147G, TPK3M165G |
| NH0096 | msn4Δ::TRP1, msn2Δ::natMX, NHP6a-IRFP:kanMX, TPK1M164G, TPK2M147G, TPK3M165G |
| NH0116 | PSIP18-mTurqouise2-HIS, MSN4-mCitrineV163A, MSN2-mCherry, NHP6a-IRFP:kanMX, TPK1M164G, TPK2M147G, TPK3M165G |
| NH0117 | PSIP18- mTurqouise2-HIS, msn4Δ::TRP1, MSN2-mCherry, NHP6a-IRFP:kanMX, TPK1M164G, TPK2M147G, TPK3M165G |
| NH0119 | PSIP18- mTurqouise2-HIS, MSN4-mCitrineV163A, msn2Δ::natMX, NHP6a-IRFP:kanMX, TPK1M164G, TPK2M147G, TPK3M165G |
| NH0120 | PDCS2- mTurqouise2-HIS, MSN4-mCitrineV163A, MSN2-mCherry, NHP6a-IRFP:kanMX, TPK1M164G, TPK2M147G, TPK3M165G |
| NH0121 | PDCS2- mTurqouise2-HIS, msn4Δ::TRP1, MSN2-mCherry, NHP6a-IRFP:kanMX, TPK1M164G, TPK2M147G, TPK3M165G |
| NH0110 | PDCS2- mTurqouise2-HIS, MSN4-mCitrineV163A, msn2Δ::natMX,, NHP6a-IRFP:kanMX, TPK1M164G, TPK2M147G, TPK3M165G |
| NH0333 | PSIP18--A4- mTurqouise2-HIS, MSN4-mCitrineV163A, MSN2-mCherry, NHP6a-IRFP:kanMX, TPK1M164G, TPK2M147G, TPK3M165G |
| NH0334 | PSIP18--A4- mTurqouise2-HIS, msn4Δ::TRP1, MSN2-mCherry, NHP6a-IRFP:kanMX, TPK1M164G, TPK2M147G, TPK3M165G |
| NH0335 | PSIP18-A4- mTurqouise2-HIS, MSN4-mCitrineV163A, msn2Δ::natMX, NHP6a-IRFP:kanMX, TPK1M164G, TPK2M147G, TPK3M165G |
| NH0425 | PTKL2- mTurqouise2-HIS, MSN4-mCitrineV163A, MSN2-mCherry, NHP6a-IRFP:kanMX, TPK1M164G, TPK2M147G, TPK3M165G |
| NH0426 | PTKL2- mTurqouise2-HIS, msn4Δ::TRP1, MSN2-mCherry, NHP6a-IRFP:kanMX, TPK1M164G, TPK2M147G, TPK3M165G |
| NH0427 | PDDR2- mTurqouise2-HIS, MSN4-mCitrineV163A, MSN2-mCherry, NHP6a-IRFP:kanMX, TPK1M164G, TPK2M147G, TPK3M165G |
| NH0428 | PDDR2- mTurqouise2-HIS, msn4Δ::TRP1, MSN2-mCherry, NHP6a-IRFP:kanMX, TPK1M164G, TPK2M147G, TPK3M165G |
| NH0459 | PDCS2- mTurqouise2-HIS, MSN4-mCitrineV163A, MSN2-mCherry, NHP6a-IRFP:kanMX, TPK1M164G, TPK2M147G, TPK3M165G, snf6::cgURA3 |
| NH0237 | MSN2- mCitrineV163A -HIS, NHP6a-IRFP:kanMX |
| NH0267 | MSN2- mCherry –TRP1, NHP6a-IRFP:kanMX |
Download links
A two-part list of links to download the article, or parts of the article, in various formats.
Downloads (link to download the article as PDF)
Open citations (links to open the citations from this article in various online reference manager services)
Cite this article (links to download the citations from this article in formats compatible with various reference manager tools)
Dynamic control of gene regulatory logic by seemingly redundant transcription factors
eLife 5:e18458.
https://doi.org/10.7554/eLife.18458


