Social observation enhances cross-environment activation of hippocampal place cell patterns
- Baylor College of Medicine, United States
Figures
Figure 1 with 1 supplement
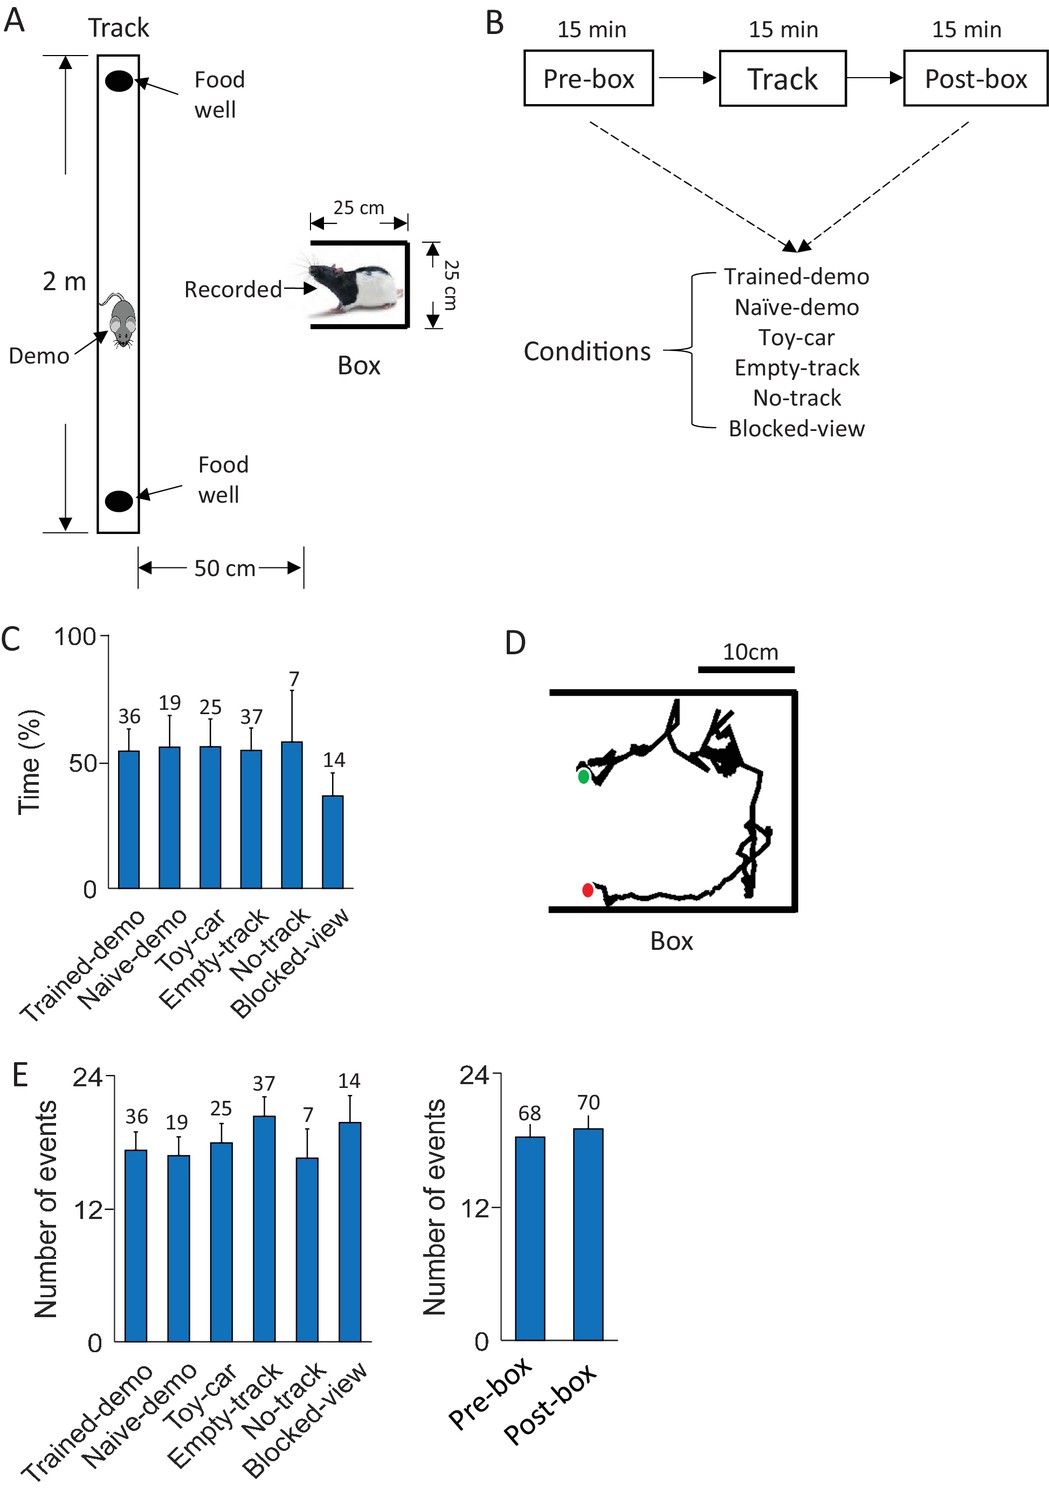
Behavioral tasks.
(A) A recorded rat staying in a small box while a demonstrator (Demo) running on a nearby linear track. (B) Daily experimental procedure: staying in the box before (Pre-box) and after (Post-box) running the track (Track). The Pre- and Post-box sessions were configured with various conditions (see Results). A shows the condition with a demo (Trained-demo or Naïve-demo). (C) Average percentage of time animals spent facing the opening side of the box under each box condition (F(5,133) = 12, p=6.5 × 10⁻¹⁰, comparing among all conditions one-way ANOVA; F(4,119) = 1.4, p=0.23, comparing among the conditions other than Blocked-view). Number on top of each bar: number of sessions. (D) Animal’s head trajectory in an example rotation event in the box. Green/red dots: start/end positions, respectively. (E) Average number of rotation events per session under each box condition (F(5,133) = 1.6, p=0.17, one-way ANOVA) and in Pre-box and Post-box sessions (t = 0.46, p=0.65, t-test). Number on top of each bar: number of sessions.
Figure 1—figure supplement 1
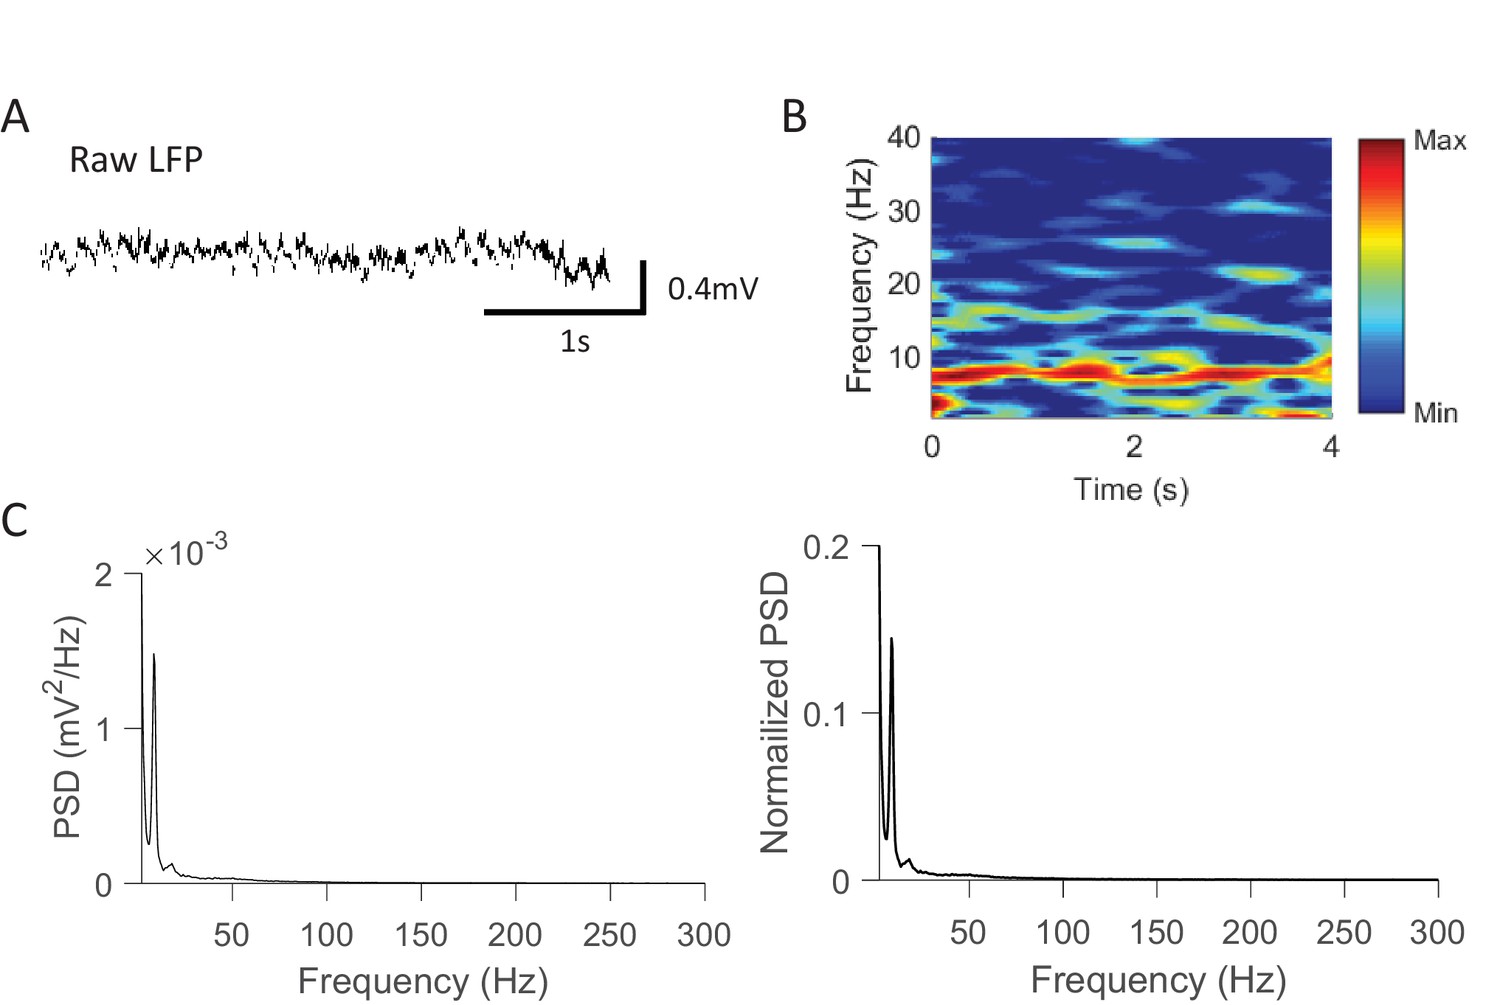
Rotation events were accompanied by prominent theta, not ripple, oscillations.
(A) An example raw LFP trace within a rotation event. (B) Spectrogram of the LFP trace in (A). Power was computed at every 0.5 Hz and every 25 ms with a window size of 1 s. The power was re-scaled to between the max and min power values. Note the strong theta at ~8 Hz. (C) Average absolute (left) and normalized (right) power spectrum density (PSD) of raw LFPs within rotation events in Pre-box and Post-box sessions. The values in the normalized PSD were normalized by the total power within [0.5 400] Hz. Note the PSD peaks at theta range (~8 Hz) and the absence of peaks in ripple band (100–250 Hz).
Figure 2 with 1 supplement
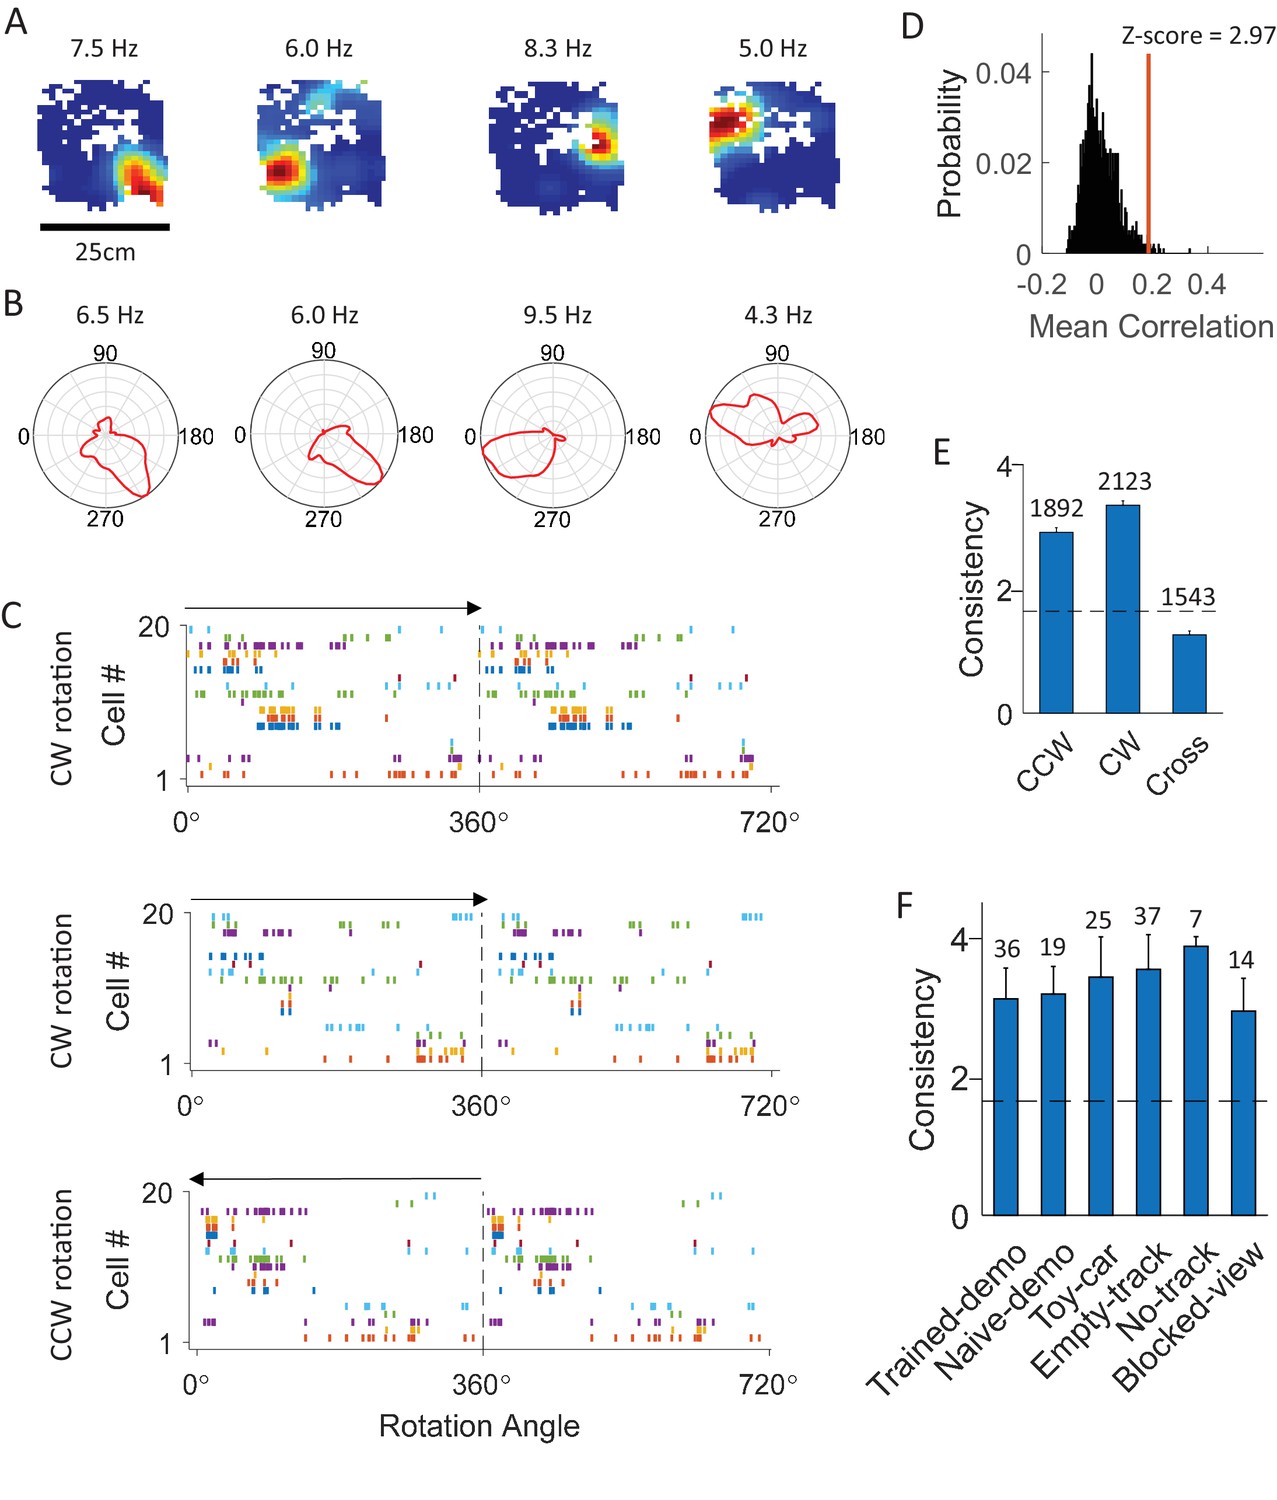
CA1 cells displayed consistent firing sequences during rotation events in the box.
(A) Rate maps of example cells in the box during rotation events. Each color plot shows mean firing rate of a cell versus the animal’s head position in the box. Number on top of each map: peak rate. (B) Firing rate curves of the same cells. Each plot is the mean firing rate at each bin of head direction during the rotation events. Number on the top of each curve: peak rate. (C) Firing sequences of all the simultaneously recorded rotation-consistent cells during a CW rotation (top), another CW rotation (middle), and a CCW rotation event (bottom). Each row plots spike rater of one cell versus the animal’s head direction for a 360° cycle twice. Cells were ordered by their peak firing angles. Arrow: rotation direction. Note the consistent sequences during all the 3 rotation events (same firing order between the 2 CW events; reverse firing order between CCW and CW events with cells firing at similar angles during both CW and CCW events). (D) Actual mean cross-event correlation (red line) and distribution of shuffle-generated correlation values for an example rotation-consistent cell. Z-score: z-scored mean cross-event correlation (rotation-consistency). (E) Average rotation-consistency for all rotation-active cells within CW events, within CCW events and cross CW and CCW events (cross). Dashed line: threshold (Z = 1.645, p<0.05, z-test) for a cell to be rotation-consistent. t = 21, p=3.4 × 10–94 (paired t-test between cross and within-CW); t = 17, p=3.5 × 10–61 (between cross and within-CCW); Number above each bar: number of cells active in CCW or CW events, or both (only a subset active in both). (F) Average rotation-consistency under different box conditions. F(5,133) = 0.62, p=0.62 (one-way ANOVA across all conditions). Each bar is the average over all the sessions (all cells within a session were averaged to get a mean value) under a condition. Number above each bar: number of sessions.
Figure 2—figure supplement 1

Example firing sequences in a Toy-car, an Empty-track and a No-track box session.
For each example, firing activities of same CA1 cells are plotted during a CW (left) and a CCW (right) rotation events, similarly as in Figure 2C.
Figure 3
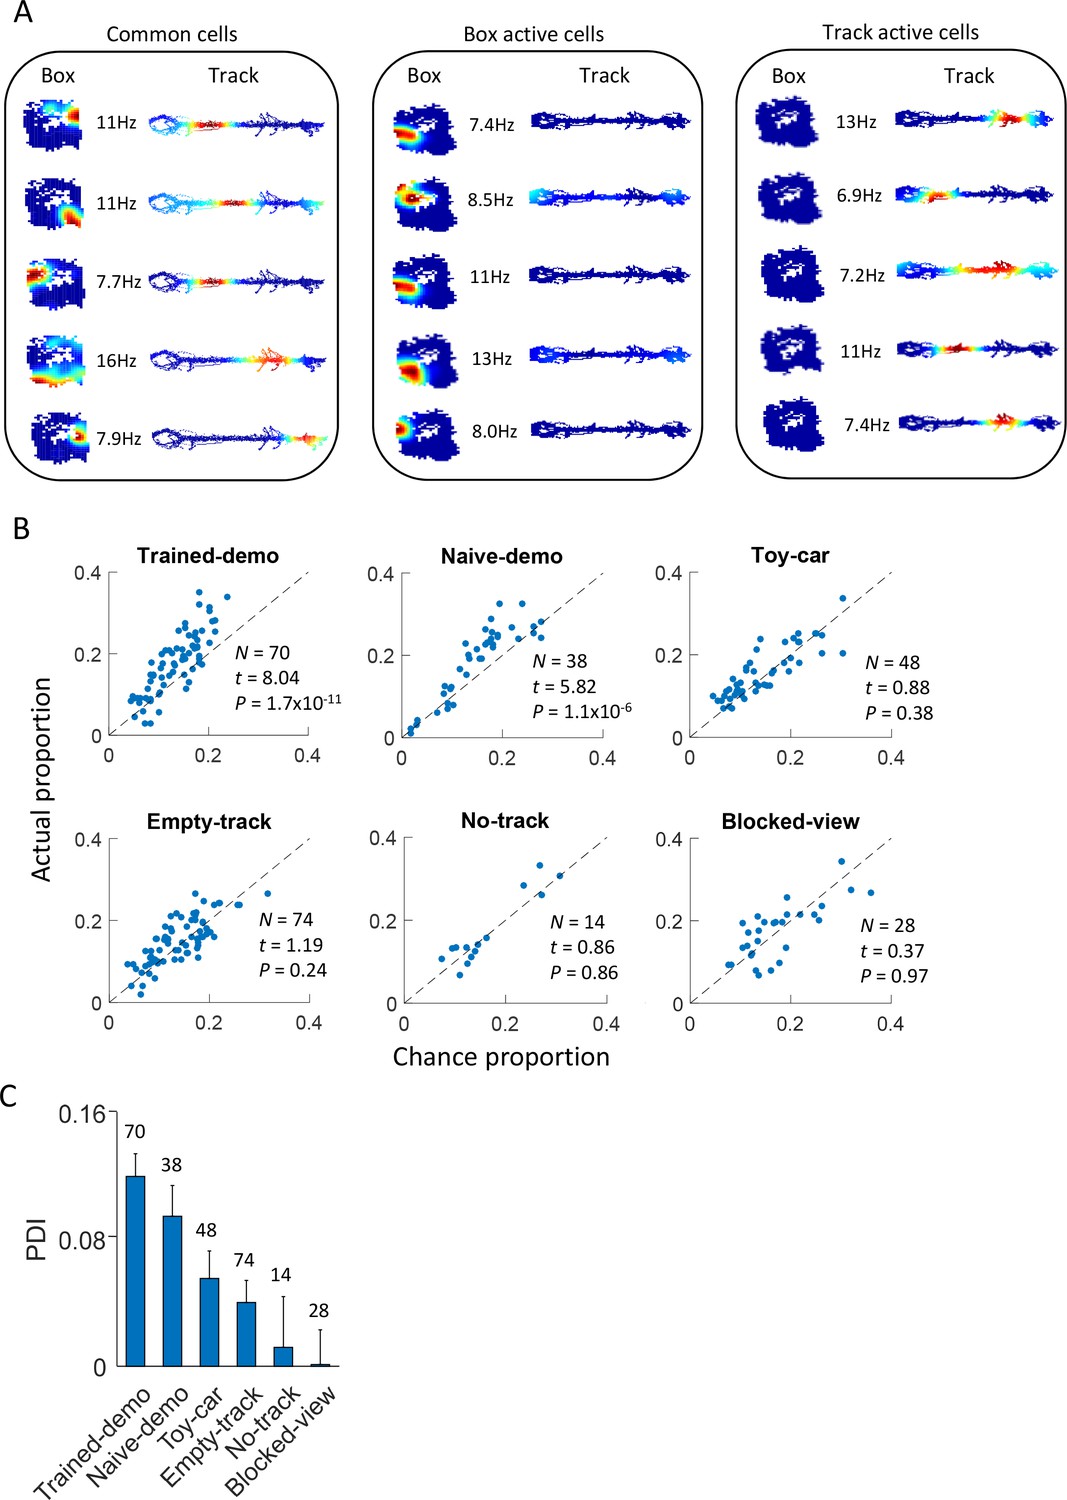
Common cells were cross-activated during rotation events in the box and during lap-running events on the track.
(A) Example rate maps of common cells, those active during rotation only, and those active during lap-running only, in the same rat under the Trained-demo condition. Each row of color plots shows firing rate maps (firing rate versus position) of a cell during rotation events in a Post-box session and that of the same cell during lap-running events on a track trajectory. Numbers: peak rates. (B) Scatter plot of actual proportion versus chance proportion of common cells under different box conditions. Each dot represents a pairing between a box (either Pre- or Post-box) session with one of the two track trajectories on the same day (there could be up to 4 dots on each day). Dashed line: line of equal actual and chance proportion values. N: number of pairings between box sessions and track trajectories; t, P: paired t-test statistics and p value between actual and chance proportions. (C) Average PDI across box sessions under each observation condition. F(5,267) = 11, p=0, one-way ANOVA across all conditions. Number above each bar: number of pairings between box sessions and track trajectories.
Figure 4 with 2 supplements
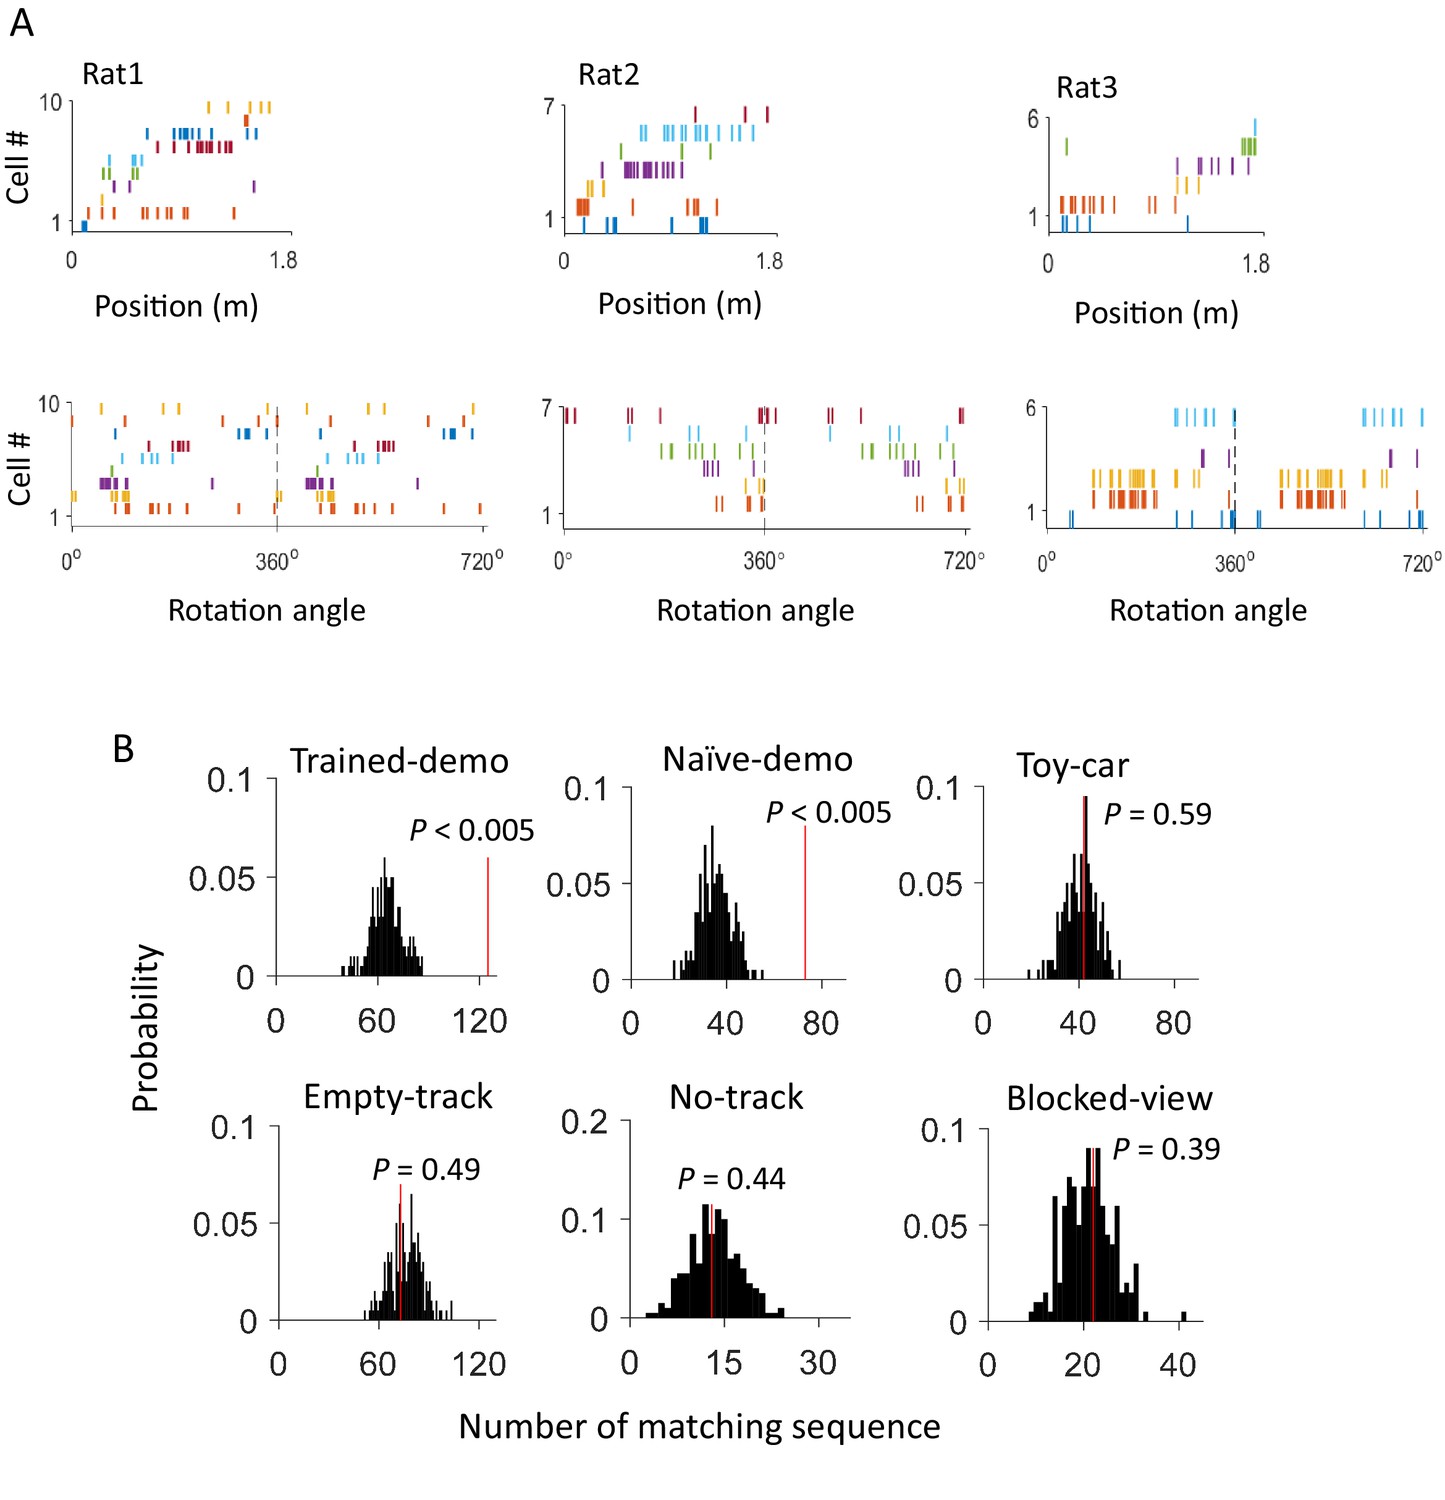
Firing sequences of multiple common cells were cross-activated between rotation events in the box and lap-running events on the track.
(A) Firing sequences of 3 example sets of common cells (Rat1 - Rat3), each from a different rat. For each example, the sequence during a running lap on a trajectory of the track was on the top and that of the same set of cells during a rotation event in Post-box was on the bottom. Each row is the spike raster of one cell. Cells were ordered by peak firing locations on the track. A full cycles (360°) were plotted twice for each rotation event. Note that the sequences on the track matched the rotation sequence with the same (Rat1, Rat3) or opposite (Rat2) order. (B) Actual number of matching sequences (red line) relative to the distribution of randomly-generated number of matches (black histogram) under each box condition. P: significance p-values.
Figure 4—figure supplement 1
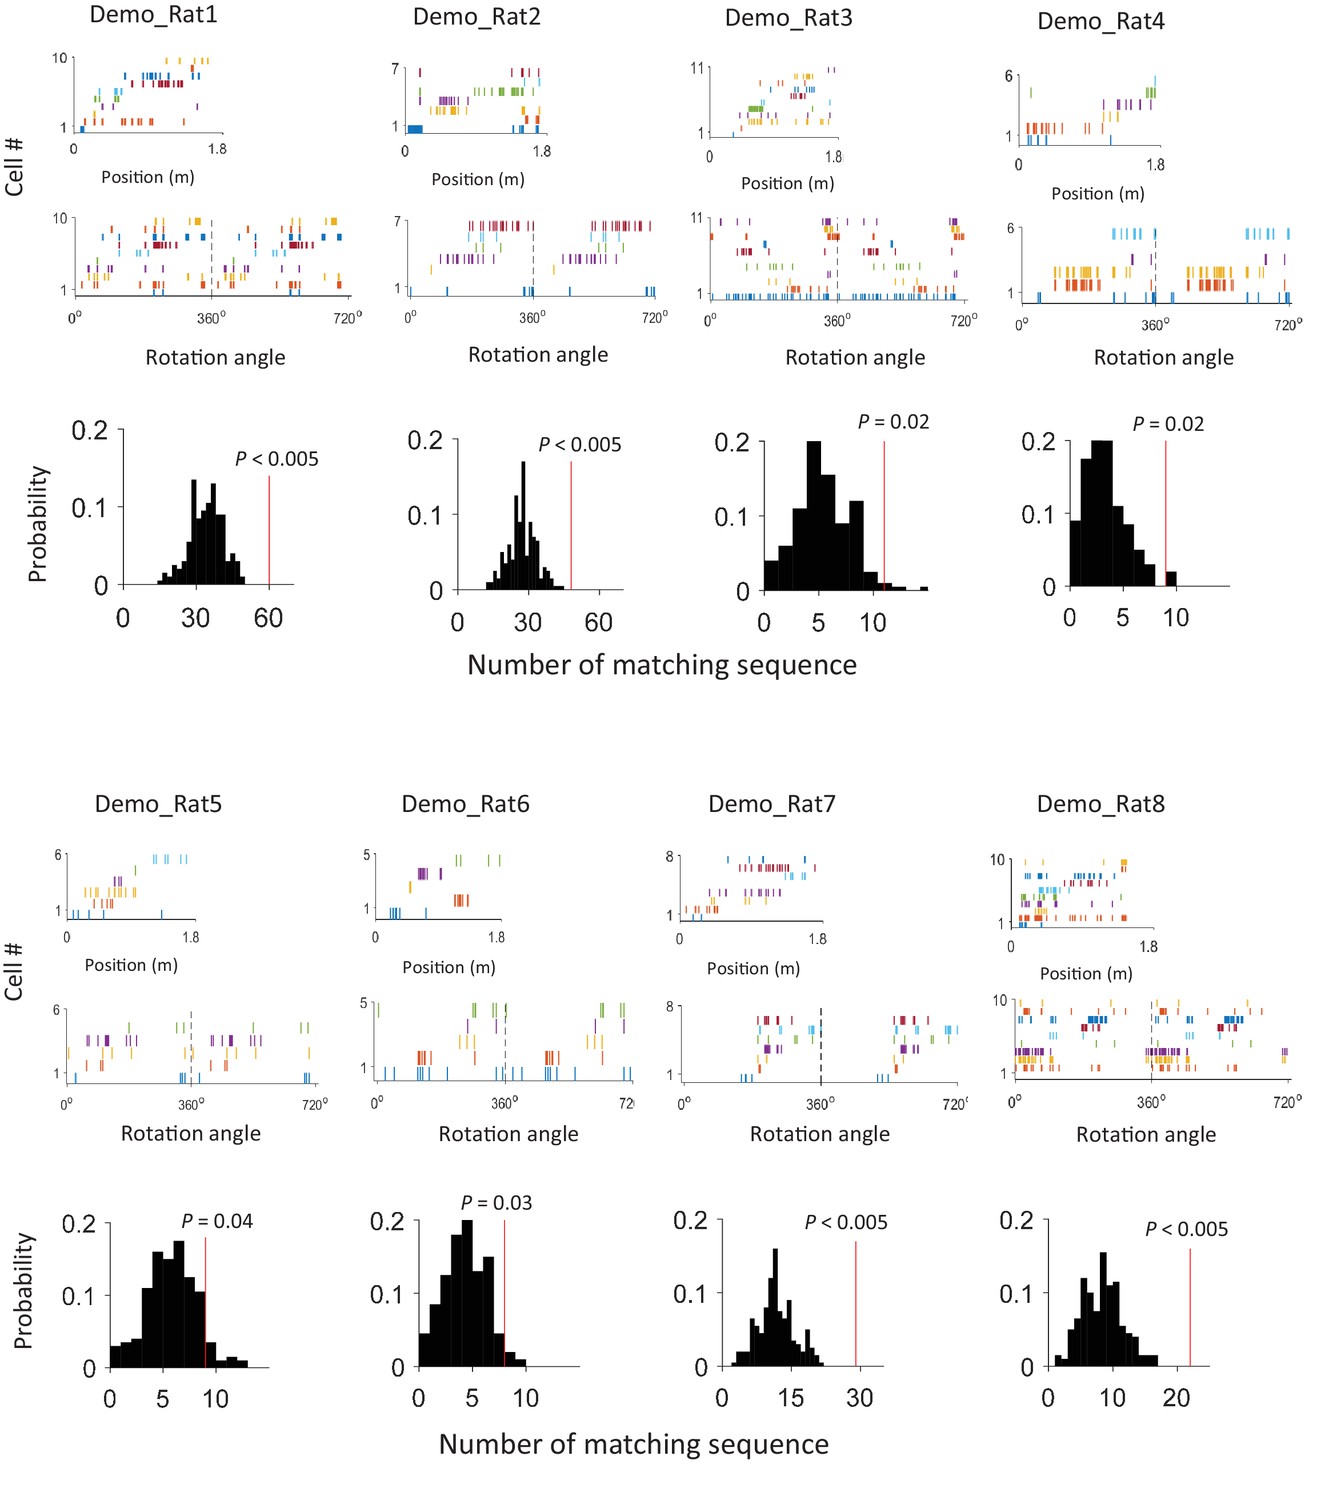
An example of matching sequence and the number of matching sequences in box sessions when a demonstrator was present (Demo: Trained-demo and Naïve-demo sessions combined) in each individual rat (Rat1 - Rat8).
For each rat, we plot an example sequence similarly as in Figure 4A (top), and the actual number of matching sequences (red line) relative to the distribution (black histogram) of randomly-generated number of matches (bottom).
Figure 4—figure supplement 2
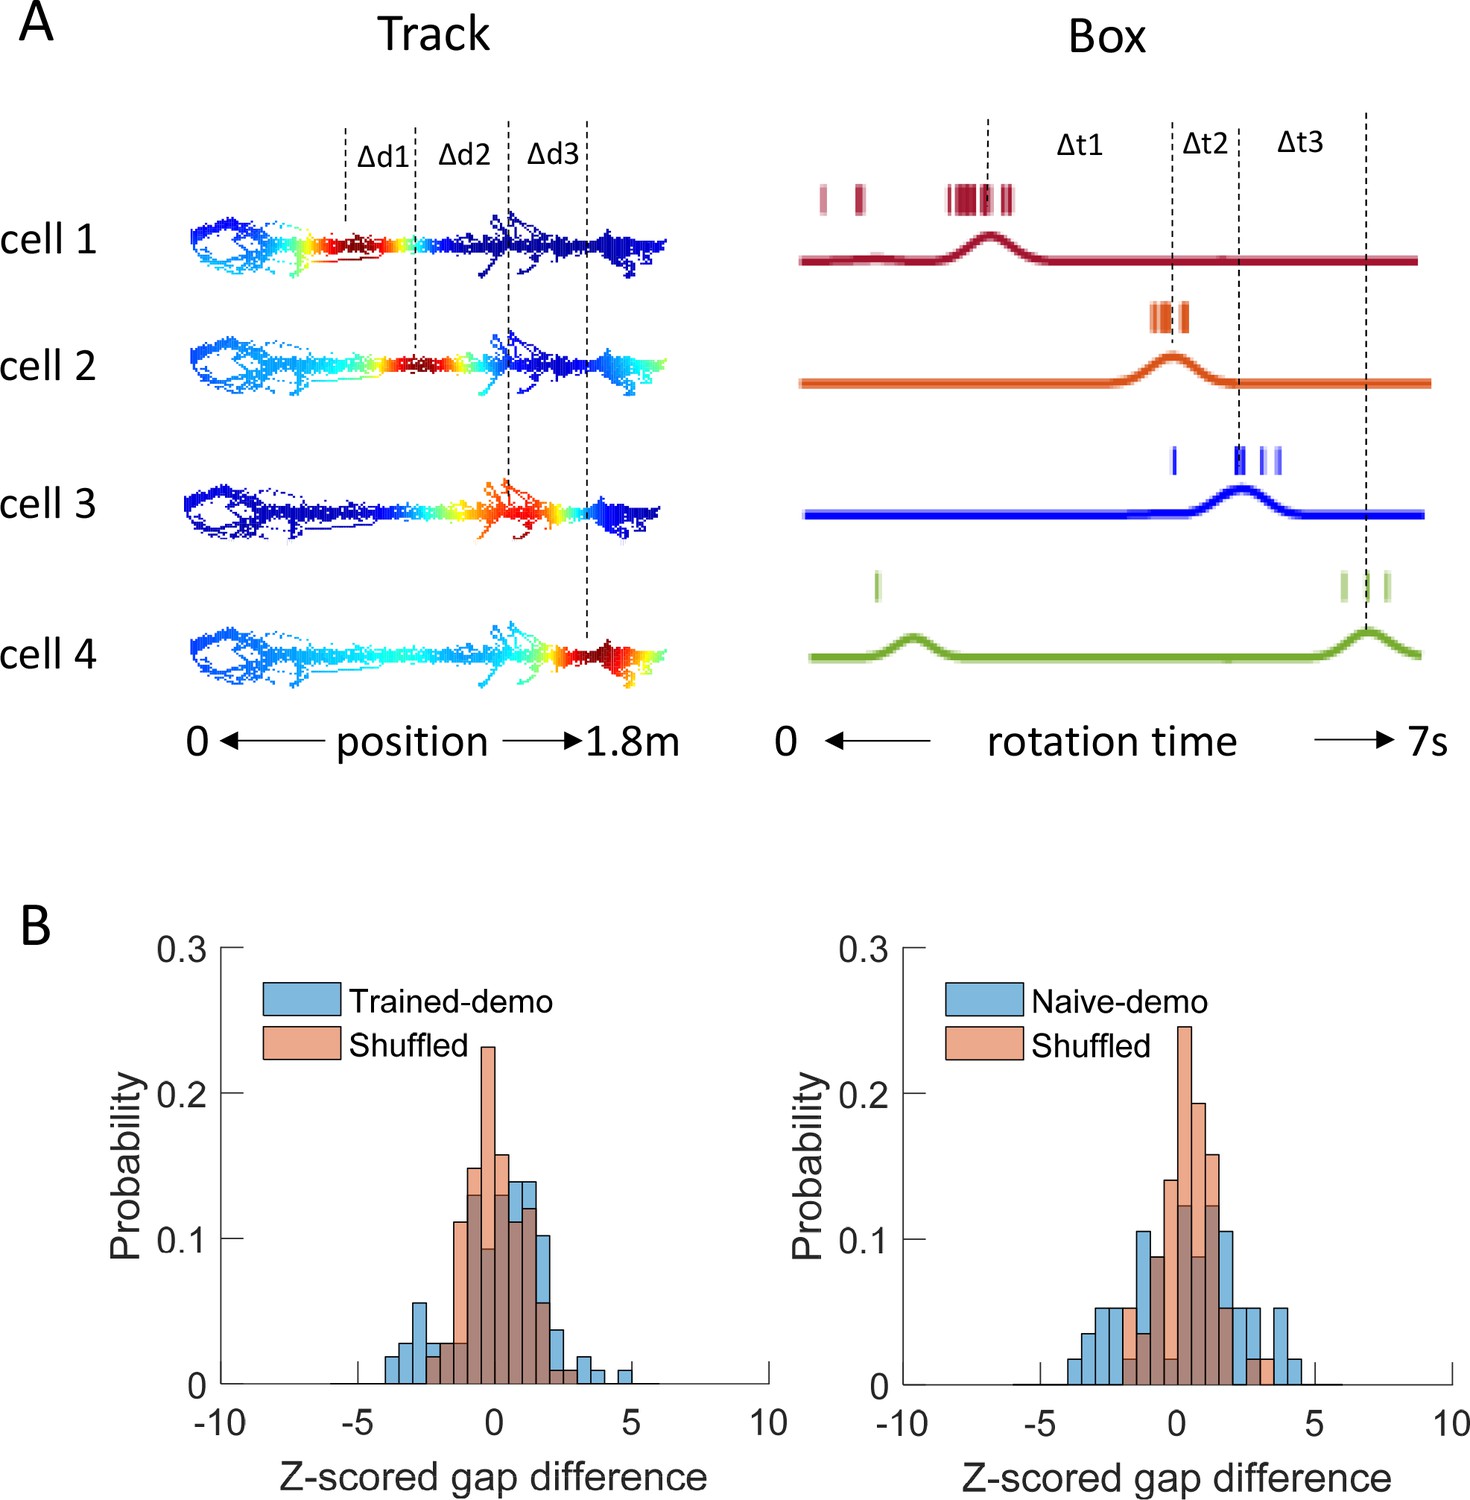
Precise firing timing among common cells did not match between matching sequences in the box and template sequences on the track trajectories.
(A) Fire rate maps of 4 example cells on a trajectory of the track (as in Figure 3A) and spike trains of the same cells within a matching sequence in the box (as in Figure 4A). On the track, the peak location of each map was identified. The distance between peak locations of a pair of common cells with neighboring peaks (∆d) was computed and transformed to a time gap according to the animal’s mean speed on the trajectory. For the same pair of cells in a rotation event, their spike trains were convolved into instantaneous firing rate curves (solid lines) and peak firing times were identified. The time gap between the peal times (∆t) was computed. Both ∆d, ∆t were rescaled such that the total lengths of the trajectory running and rotation event were equalized to 1. The absolute difference of these two time gaps (gap difference: |∆d − ∆t|) was averaged over all pairs in a matching sequence. (B) Distributions of gap difference (blue) for all matching sequences in Trained-demo (N = 36) or Naïve-demo (N = 19) box sessions, z-scored relative to those obtained from randomly shuffled matching sequences (independent shifting of each cell’s firing timing within a matching sequence but with firing orders intact). For comparison, the distributions of the z-scored gap difference of a sample of shuffled sequences are shown (red). t = 0.08, p=0.98 between Trained-demo and Shuffled (t-test), and t = 0.7, p=0.48 between Naïve demo and Shuffled.
Figure 5
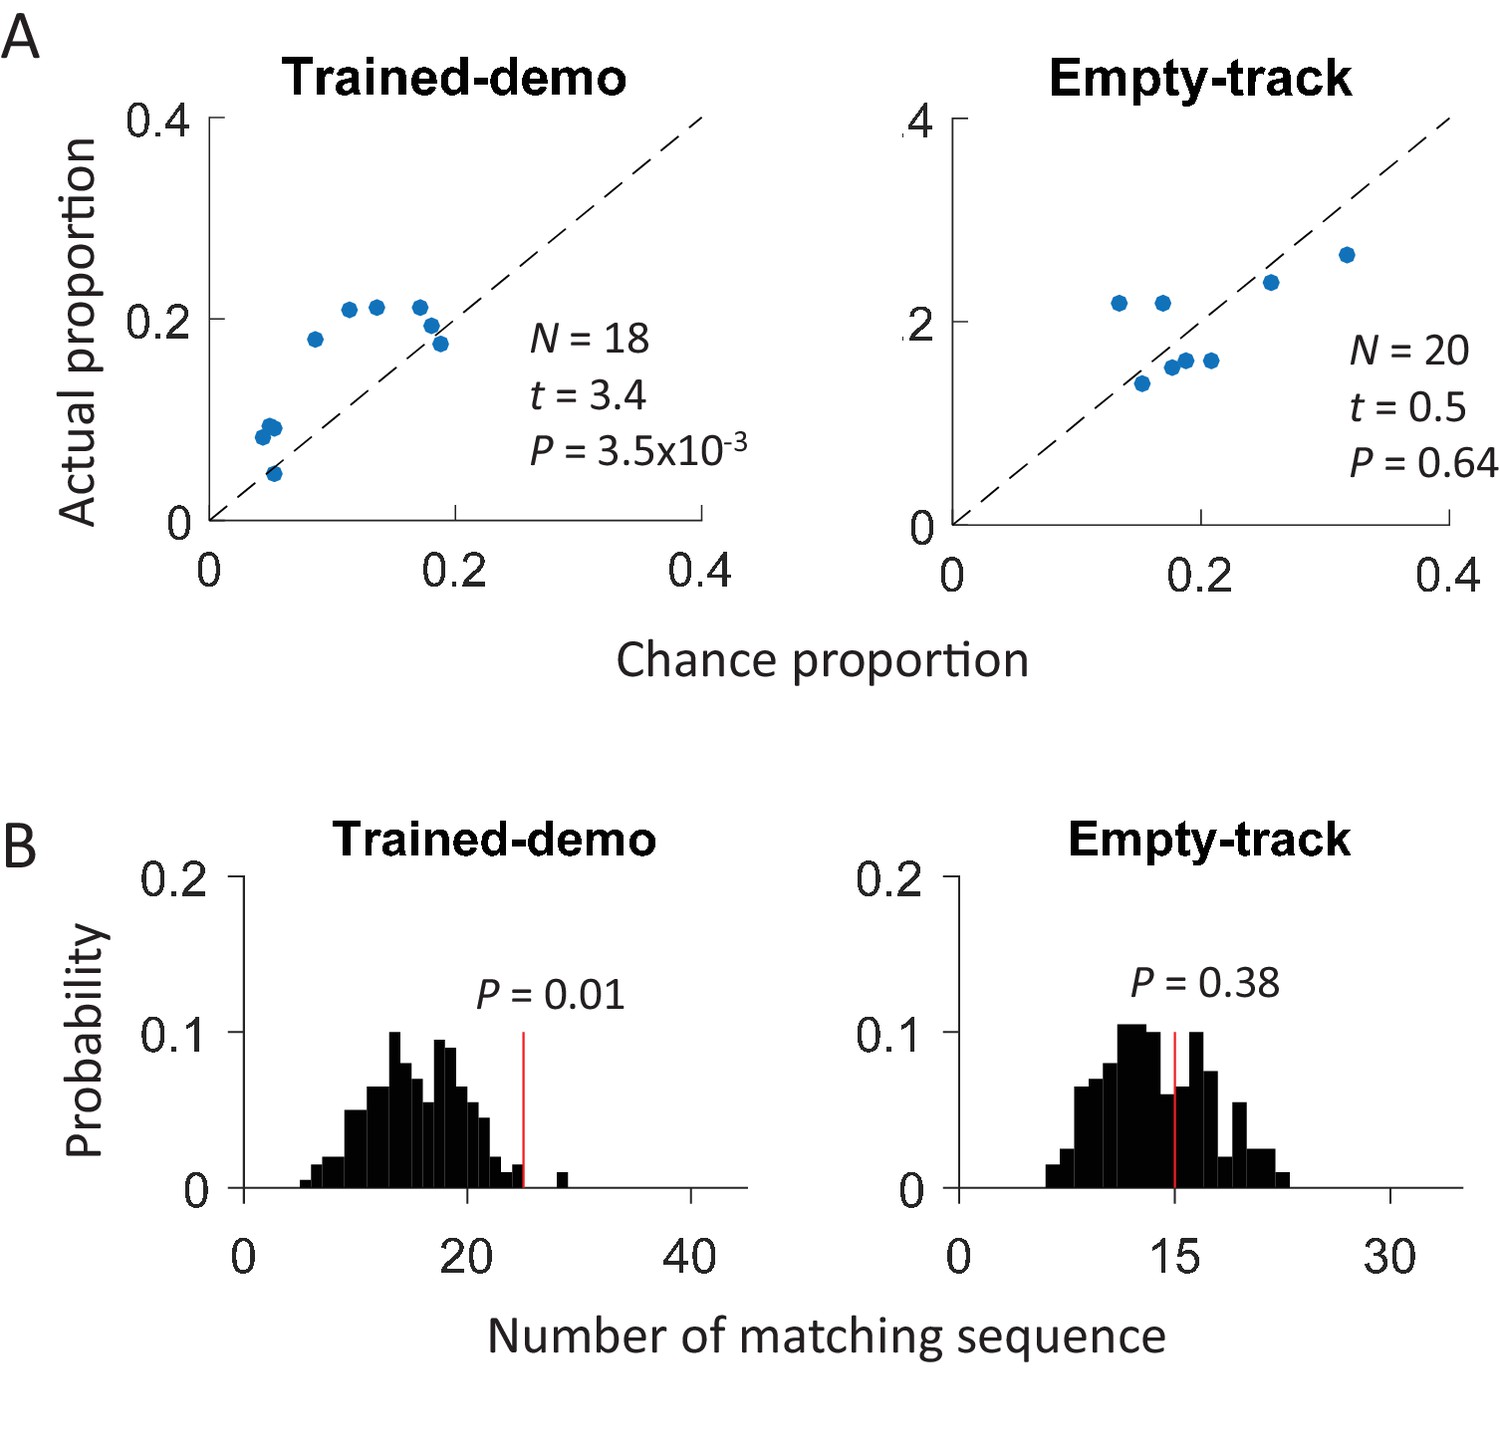
Cross-activation of CA1 activities appeared in Pre-box prior to the first self-running experience on the track.
(A) Scatter plot of actual proportion versus chance proportion of common cells for Pre-box sessions under Trained-demo and Empty-track before the very first self-running on the track. Each dot represents a pairing between a Pre-box session and one of the two track trajectories on the same day. Dashed line: line of equal actual and chance proportion values. N: number of pairings between Pre-box sessions and track trajectories; t, P: paired t-test statistics and p value between actual and chance proportions. (B) Actual number of matching sequences (red line) relative to the distribution of randomly-generated number of matches (black histogram) in Pre-box under Trained-demo and Empty-track before first self-running on the track. P: significance p-values.
Figure 6
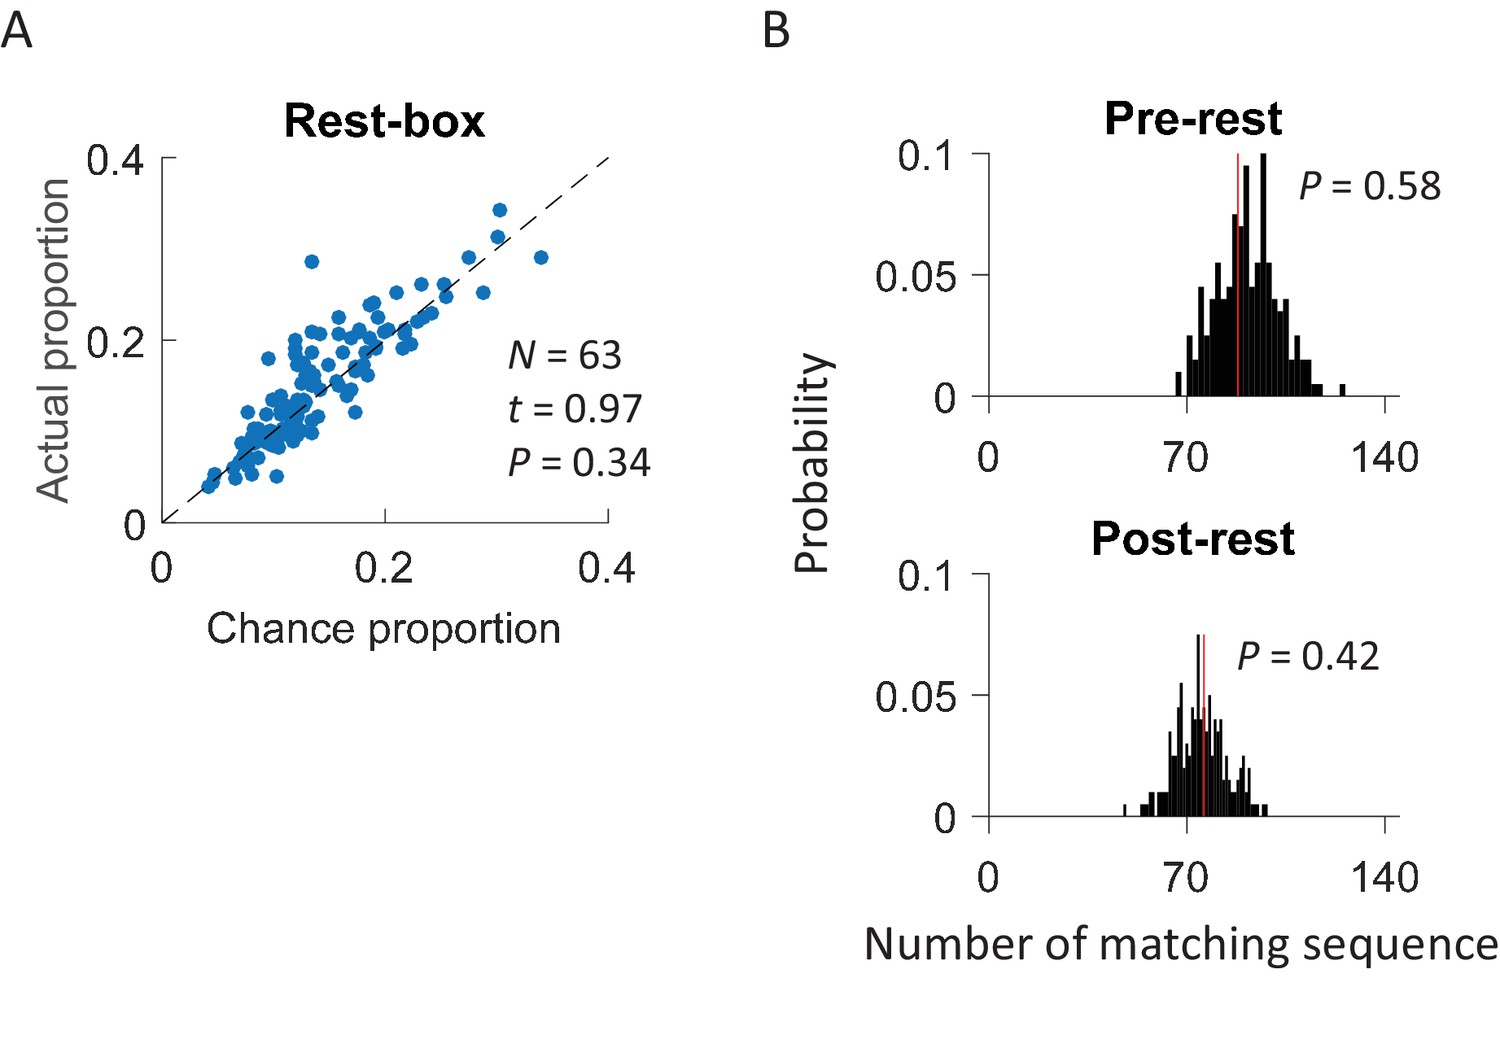
Cross-activation of CA1 activities did not occur in a rest box.
(A) Scatter plot of actual proportion versus chance proportion of common cells for each rest session. Each dot represents a pairing between a rest session with one of the two track trajectories on the same day. Dashed line: line of equal actual and chance proportion values. N: number of pairings between rest sessions and track trajectories; t, P: paired t-test statistics and p value between actual and chance proportions. (B) Actual number of matching sequences (red line) relative to the distribution of randomly-generated number of matches (black histogram) in rotation events in the rest box. P: significance p-values.
Figure 7
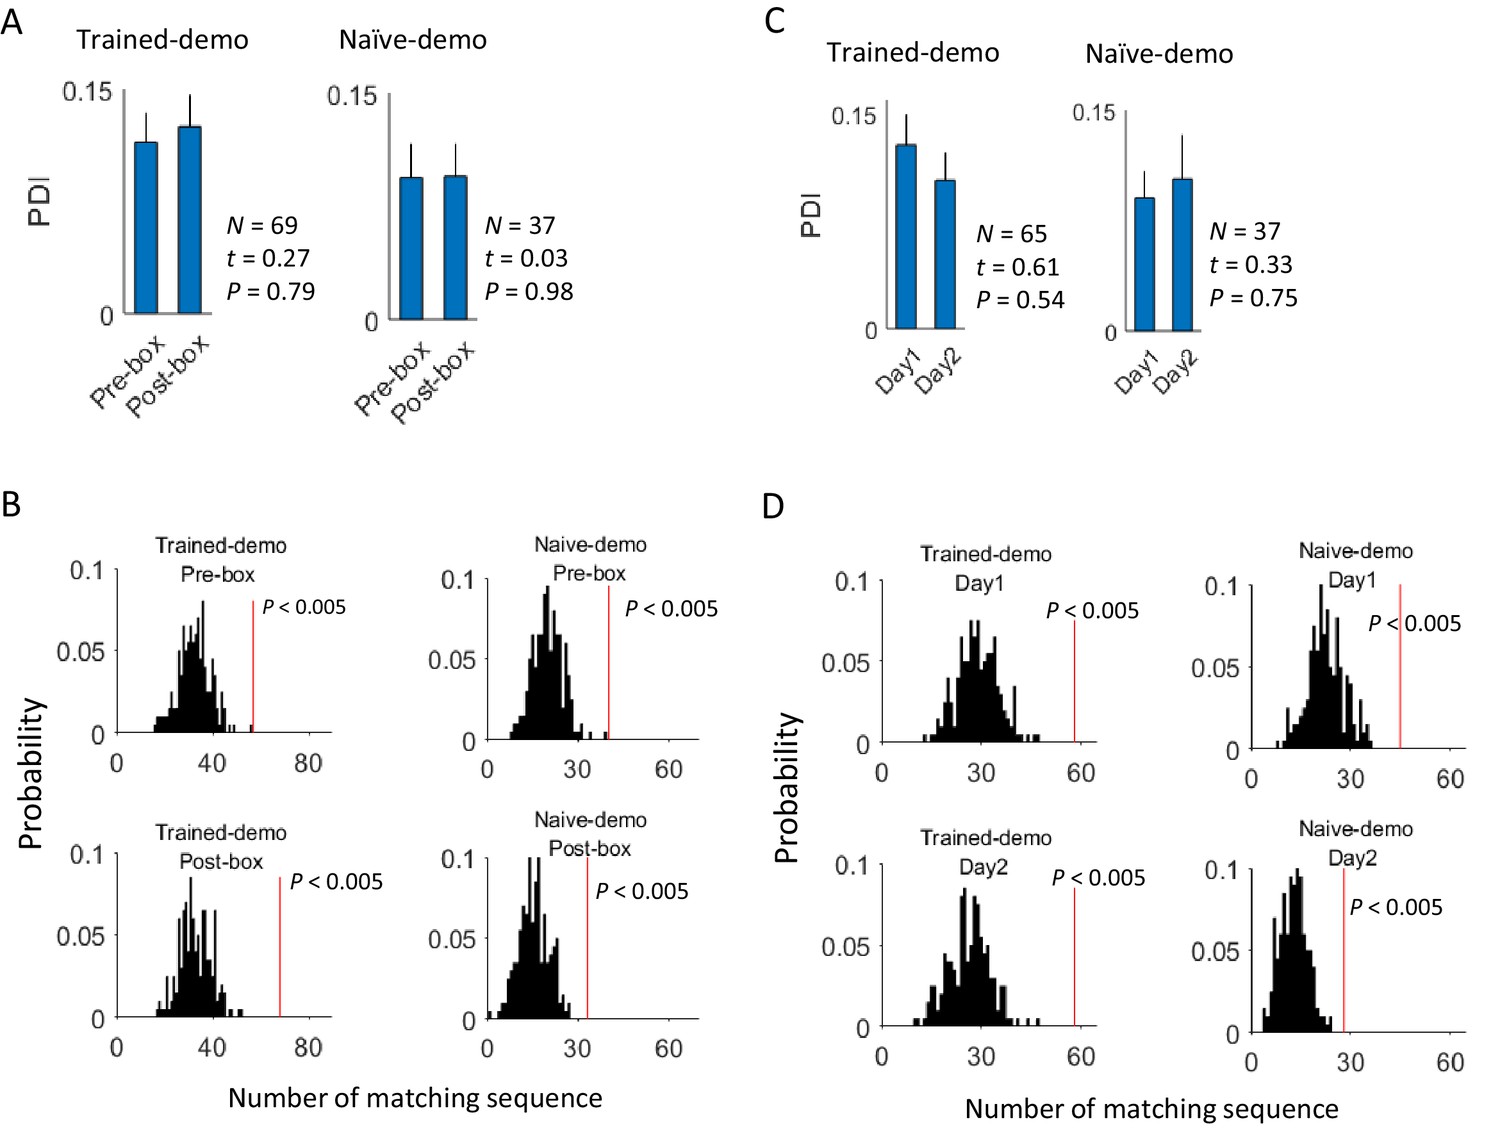
Cross-activation of CA1 activities displayed little experience-dependence.
(A) Average PDIs of rotation-active cells for Pre-box and Post-box sessions under Trained-demo and Naïve-demo. N: number of pairings between Pre- or Post-box sessions and track trajectories sessions; t, P: paired t-test statistics and p value. (B) Actual number of matching sequences (red line) relative to the distribution of randomly-generated number of matches (black histogram) in Pre-box and Post-box under Trained-demo and Naïve-demo. P: significance p-values. (C, D): Same as in A, B, but for the first and second recording day (Day1, Day2) under Trained-demo and Naïve-demo.
Figure 8
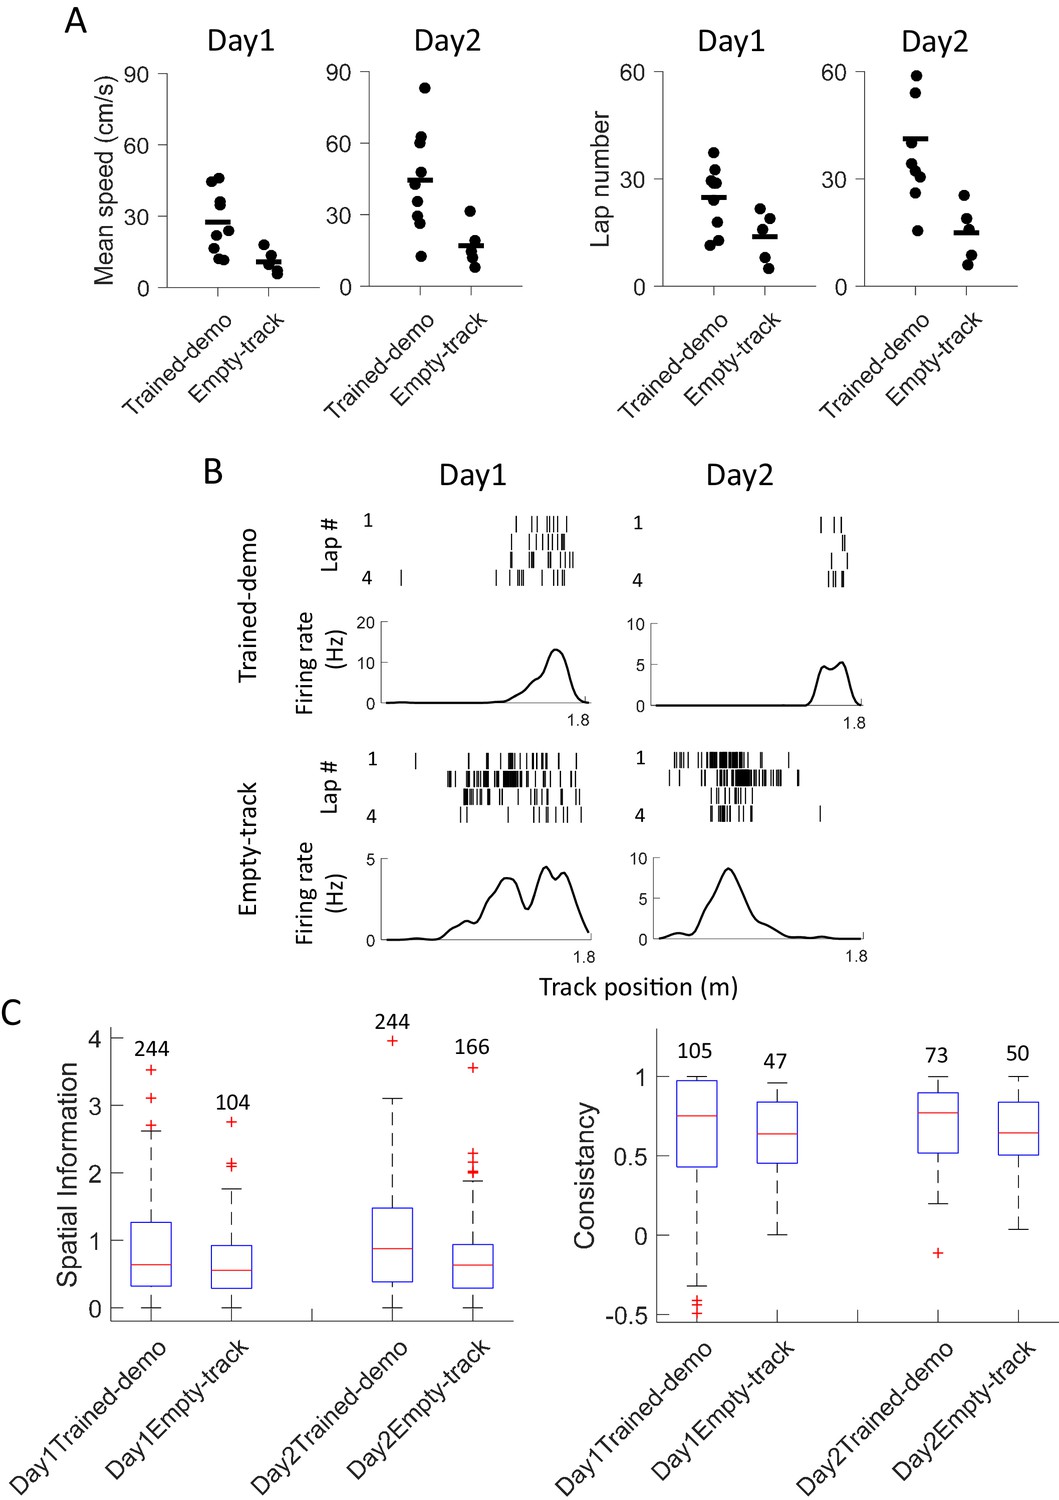
Experience in the box improved behavioral performance and novel place field development on the track.
(A) Mean running speed and number of laps per trajectory in Track sessions of first two days (Day1, Day2) for the Trained-demo (N = 9) and Empty-track (N = 5) rats. Both parameters were significantly different between Day1 and Day2 (mean speed: F1,27 = 5.3, p=0.03; number of laps: F1,27 = 4.6, p=0.04; Two-way ANOVA). Trained-demo had significantly faster mean speed (F1,27 = 14, p=0.001) and ran more number of laps (F1,27 = 12, p=0.002). (B) Example place cells from a Trained-demo and an Empty-track rat on Day1 and Day2. For each condition and each day, a cell’s spike raster (top) and its firing rate curve (bottom: mean rate versus position) during the first 4 laps of a trajectory are shown. Each tick is a spike. (C) Spatial information for all active cells under each condition (Trained-demo, Empty-track) on each day (Day1, Day2). Number on top of each bar: number of cells. There was a significant main effect between the conditions (F1,791 = 21, p=0, Two-way ANOVA), but not between days (F1,791 = 1.4, p=0.25). (D) Same as C, but for lap consistency. Although median values of lap consistent in Trained-demo appeared to be higher than those in Empty-track, there was no significant main effect between the conditions (F1,274 = 0.11, p=0.74, Two-way ANOVA) or between days (F1,274 = 1.8, p=0.17).
Figure 9
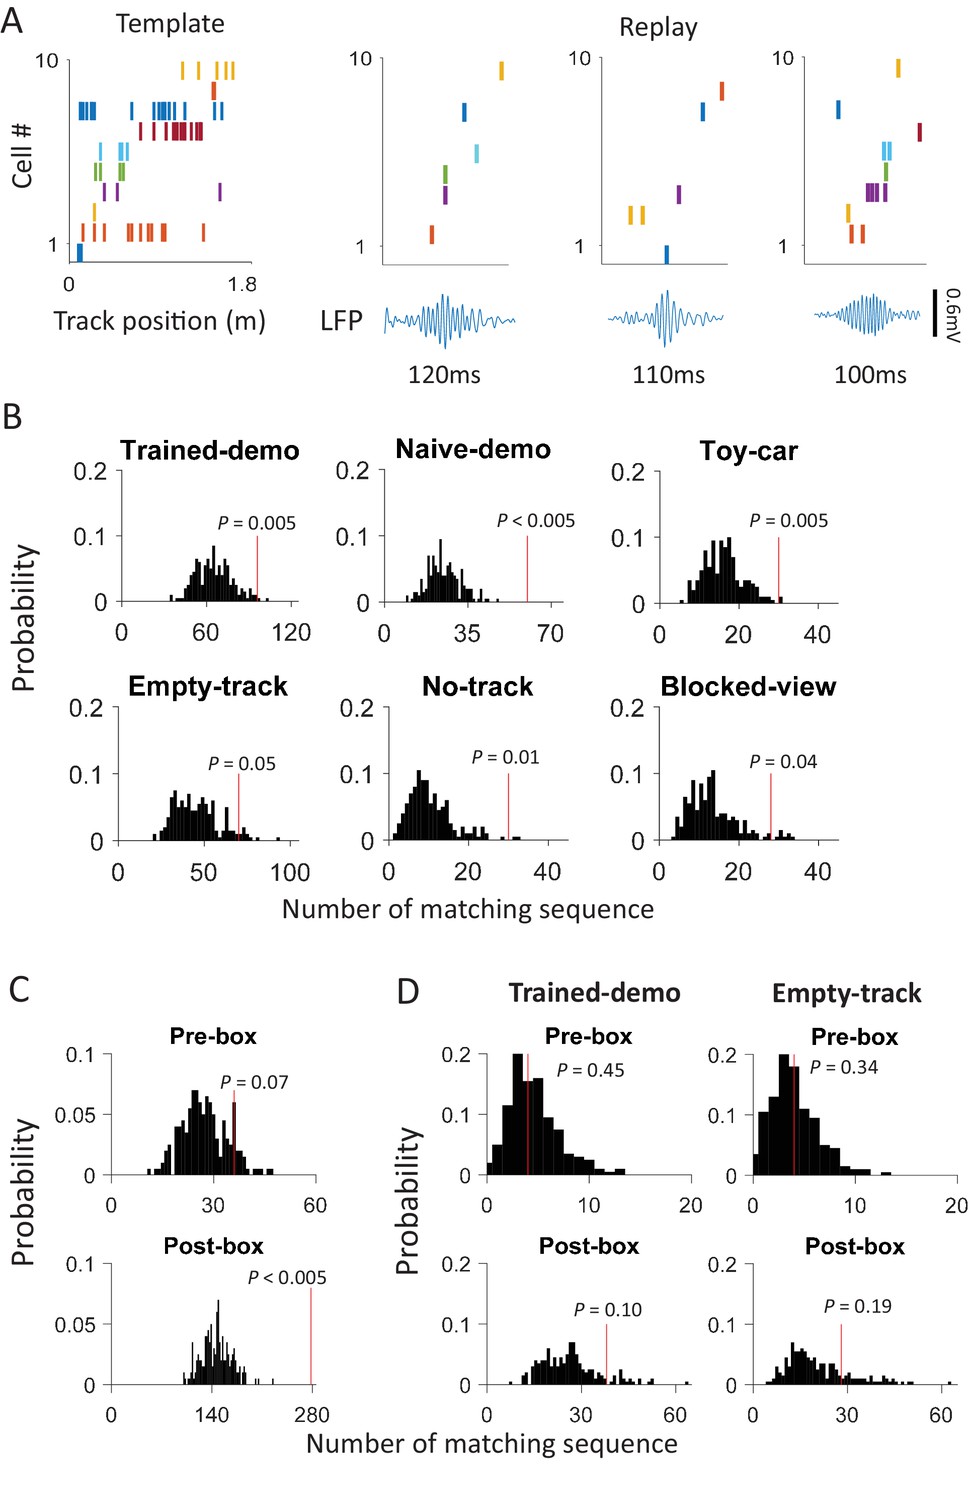
Ripple-associated replay occurred in box sessions, but was insensitive to the presence of a demonstrator on the track.
(A) Example replay events in a Post-box session. Left: a template firing sequence made of 10 cells during a lap running event on a trajectory, plotted similarly as in Figure 4A. Right: 3 examples of replay events, each plotted with the spike raster of the same 10 cells (top) and the CA1 LFP (bottom; filtered through the ripple band of 100–250 Hz). Each tick is a spike. Note the sequential firing of the cells in each replay example, similarly as in the template. (B) Number of replay events (red line) relative to the distribution of randomly-generated number of replays (black histogram) under each box condition. P: significance p-value. (C) Same as B, but for Pre-box and Post-box sessions with all box conditions combined. (B) Same as B, but for the Pre-box and Post-box session on the very first day under the Trained-demo and Empty-track conditions.
Figure 10
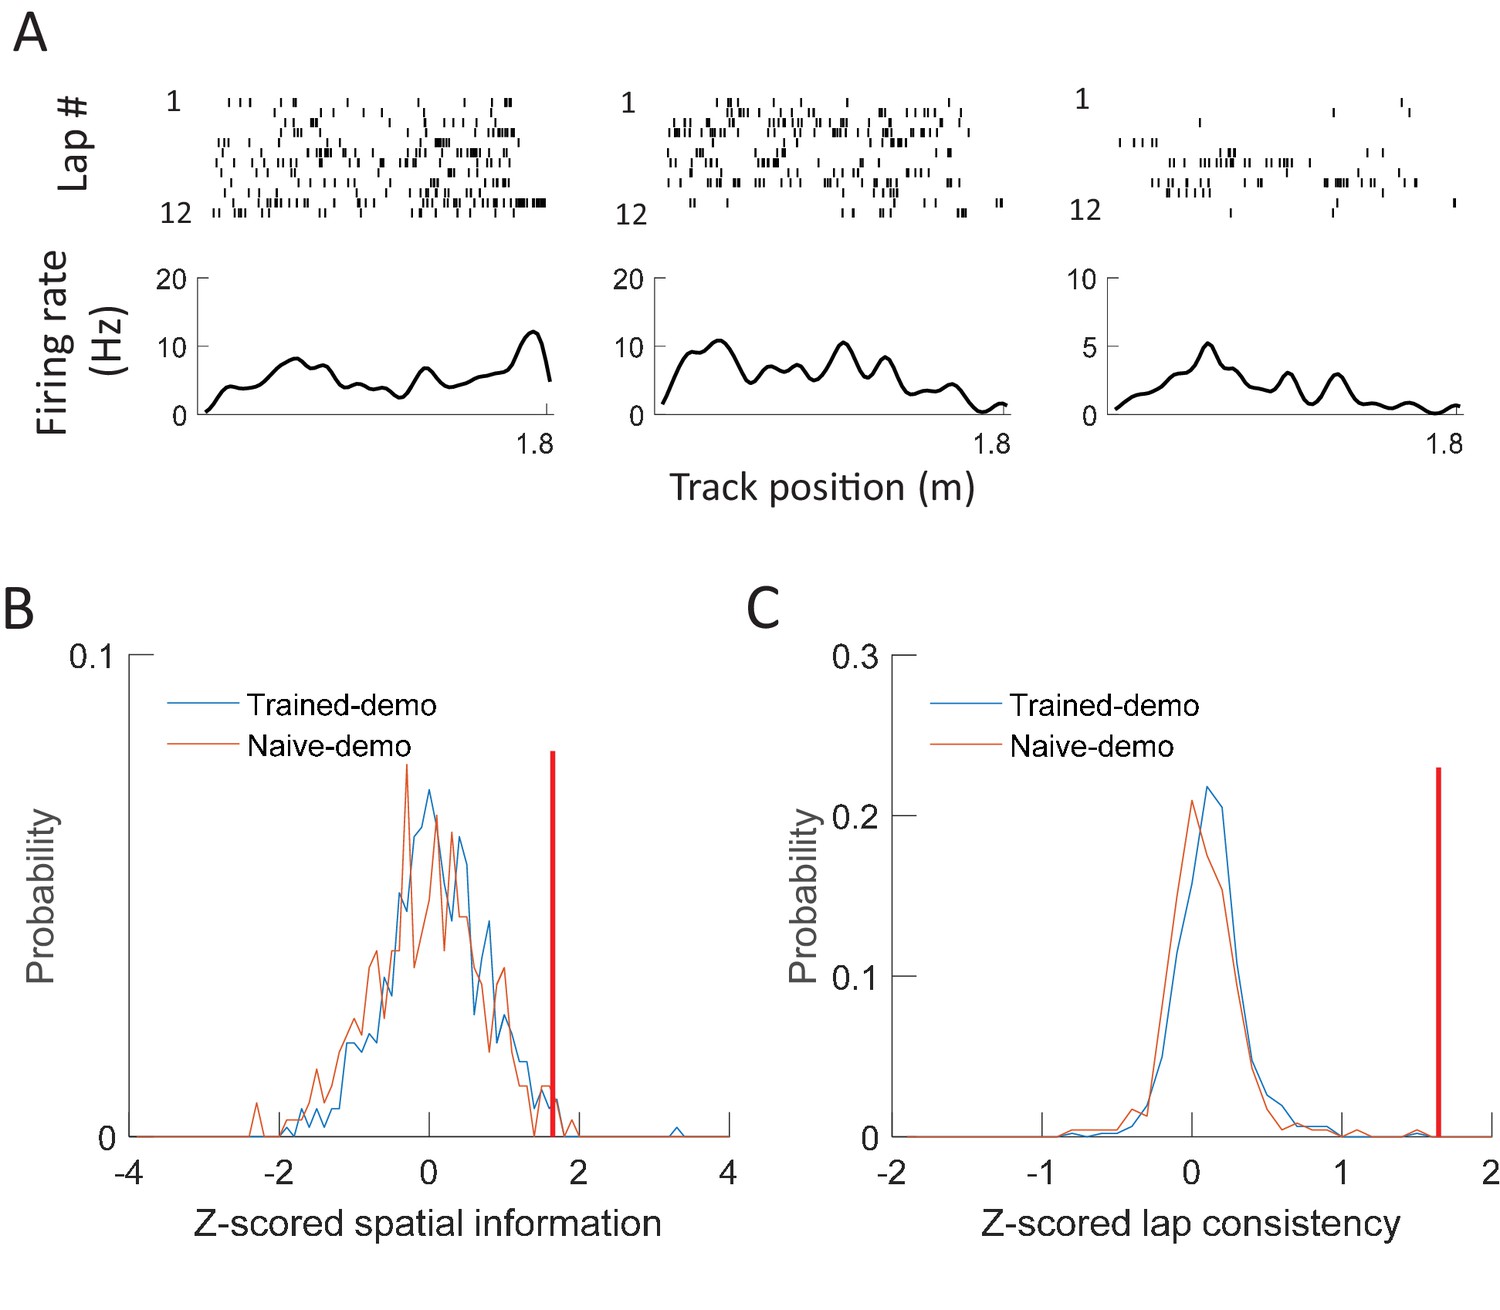
CA1 cells in the box did not respond to demonstrators’ positions on the track.
(A) Spikes of example cells from a rat staying in the small box, but plotted versus a well-trained demonstrator’s position on the track. For each example, a cell’s spike raster during every lap of the demonstrator’s running on a track trajectory (top) and its mean firing rate curve (bottom: mean rate versus position) are shown. Each tick is a spike. (B) Distributions of spatial information for all active cells in all the box sessions under Trained-demo (red, N = 463 cells) or Naïve-demo (blue, N = 235). For each cell, its spatial information was z-scored relative to the spatial information values obtained by random, circular shifting of spike trains within each lap. Red vertical line: threshold to identify significant cells. The mean value of z-scored spatial information was not significantly different from 0 either under Trained-demo (t = 1.1, p=0.28) or Naïve-demo (t = −1.3, p=0.18). (C) Same as B, but for z-scored lap consistency. The mean value was not significantly different from 0 either under Trained-demo (t = 1.6, p=0.11) or Naïve-demo (t = 0.43, p=0.67).
Download links
A two-part list of links to download the article, or parts of the article, in various formats.
Downloads (link to download the article as PDF)
Open citations (links to open the citations from this article in various online reference manager services)
Cite this article (links to download the citations from this article in formats compatible with various reference manager tools)
Social observation enhances cross-environment activation of hippocampal place cell patterns
eLife 5:e18022.
https://doi.org/10.7554/eLife.18022


